a pilot demonstration of electrochromic and … · chromogenic glazing materials are emerging...
TRANSCRIPT

Prepared for the General Services Administration
By Eleanor S. Lee, Luis L. Fernandes, Chad Howdy Goudey,
Carl Jacob Jonsson, Dragan Charlie Curcija, Xiufeng Pang,
Dennis DiBartolomeo, and Sabine Hoffmann
July 2013
A Pilot Demonstration of Electrochromic and Thermochromic Windows in the Denver Federal Center, Building 41, Denver, Colorado
Eleanor S. Lee, Principal Investigator

The Green Proving Ground program leverages GSA’s real estate portfolio
to evaluate innovative sustainable building technologies and practices.
Findings are used to support the development of GSA performance
specifications and inform decision-making within GSA, other federal
agencies, and the real estate industry. The program aims to drive
innovation in environmental performance in federal buildings and help
lead market transformation through deployment of new technologies.

A Pilot Demonstration of Electrochromic and Thermochromic Windows in the Denver Federal Center, Building 41, Denver, Colorado Page i
DISCLAIMER
This document was prepared as an account of work sponsored by the United States Government. While this
document is believed to contain correct information, neither the United States Government nor any agency
thereof, nor the Lawrence Berkeley National Laboratory, nor any of their employees, makes any warranty,
express or implied, or assumes any legal responsibility for the accuracy, completeness, or usefulness of any
information, apparatus, product, or process disclosed, or represents that its use would not infringe privately
owned rights. Reference herein to any specific commercial product, process, or service by its trade name,
trademark, manufacturer, or otherwise, does not constitute or imply its endorsement, recommendation, or
favoring by the United States Government or any agency thereof, or the Lawrence Berkeley National
Laboratory. The views and opinions of authors expressed herein do not necessarily state or reflect those of
the United States Government or any agency thereof or the Lawrence Berkeley National Laboratory.
The work described in this report was funded by the U.S. General Services Administration, the Federal
Energy Management Program of the U.S. Department of Energy, and by the Assistant Secretary for Energy
Efficiency and Renewable Energy, Office of Building Technology, State and Community Programs, Office of
Building Research and Standards of the U.S. Department of Energy under Contract No. DE-AC02-05CH11231.
ACKNOWLEDGEMENTS
The demonstration facility agency was the U.S. General Services Administration, Bldg. 41, Denver Federal
Center, Lakewood, Colorado.
This project was supported by Dana Coolbroth, Doug Porter, Jeffrey Engelstad, Michael Lowell, Doug
Rothgeb, and Andrew Bond, GSA-Public Building Service (PBS)-Region 8 of Design & Construction Branch at
the Denver Federal Center, Building 41, PO Box 25546 (8PC), Denver, Colorado 80225. This project was also
supported by Kevin Powell, Michael Hobson, and Christine Wu, GSA-PBS-Green Proving Ground National
Program Team.
This report was authored by Eleanor S. Lee, Luis L. Fernandes, Chad Howdy Goudey, Carl Jacob Jonsson,
Dragan Charlie Curcija, Xiufeng Pang, Dennis DiBartolomeo, and Sabine Hoffmann. Additional support was
provided by our LBNL colleagues Robert Clear, Alex Fung, Christian Kohler, Anothai Thanachareonkit, David
Parker, Daniel Fuller, Alastair Robinson, and Stephen Selkowitz of the Lawrence Berkeley National
Laboratory, Environmental Energy Technologies Division, Windows and Envelope Materials Group, Building
Technology and Urban Systems Department, 1 Cyclotron Road, Mailstop 90-3111, Berkeley, California,
94720.
For more information contact:
Kevin Powell Program Manager, Green Proving Ground Office of the Commissioner, Public Buildings Service U.S. General Services Administration 555 Battery Street, Room 518 Federal Energy Management Program San Francisco, CA 94708 Email: [email protected]
Shawn Herrera Program Manager Technology Deployment 1000 Independence Avenue, SW, Room EE-2L Washington, DC 20585-0121 [email protected]

A Pilot Demonstration of Electrochromic and Thermochromic Windows in the Denver Federal Center, Building 41, Denver, Colorado Page i
Table of Contents I. Executive Summary .............................................................................................................................................. 1
II. Introduction ....................................................................................................................................................... 12
A. Opportunity .............................................................................................................................................. 13
III. Methodology ...................................................................................................................................................... 16
A. Technology Description ............................................................................................................................ 16
B. Technical Objectives ................................................................................................................................. 19
C. Demonstration Project Location .............................................................................................................. 20
IV. M&V Evaluation Plan ......................................................................................................................................... 22
A. Facility Description ................................................................................................................................... 22
B. Technology Specification ......................................................................................................................... 25
C. Technology Deployment .......................................................................................................................... 30
D. Instrumentation Plan ............................................................................................................................... 35
V. Results ................................................................................................................................................................ 37
A. Thermochromic Windows ........................................................................................................................ 37
B. Electrochromic Windows ......................................................................................................................... 64
VI. Summary Findings and Conclusions ................................................................................................................... 83
A. Overall Technology Assessment ............................................................................................................... 83
VII. Appendices ......................................................................................................................................................... 88
A. References ................................................................................................................................................ 88
B. Glossary .................................................................................................................................................... 90
C. Appendix A: Floor Plans Showing Furniture Layouts For Phases I And II ................................................. 91
D. Appendix B: Spectral Measurements Of The Thermochromic Windows ................................................ 95
E. Appendix C: Accuracy Of Solar Irradiance Measurements ...................................................................... 96
F. Appendix D: Calibration And Accuracy Of Infrared Thermography Measurements ................................ 97
G. Appendix E: Summary Of Energyplus Assumptions ............................................................................... 100
H. Appendix F: Methods Used To Assess Occupant Response ................................................................... 102
I. Appendix G: Summary Of Monitored Data ............................................................................................ 139

A Pilot Demonstration of Electrochromic and Thermochromic Windows in the Denver Federal Center, Building 41, Denver, Colorado Page 1
I. Executive Summary Chromogenic glazing materials are emerging technologies that tint reversibly from a clear to dark tinted
state either passively in response to environmental conditions or actively in response to a command from a
switch or building automation system. Switchable coatings on glass manage solar radiation and visible light
while enabling unobstructed views to the outdoors. Building energy simulations estimate that actively
controlled, near-term chromogenic glazings can reduce perimeter zone heating, ventilation, and air-
conditioning (HVAC) and lighting energy use by 10-20% and reduce peak electricity demand by 20-30%,
achieving energy use levels that are lower than an opaque, insulated wall.
This project demonstrates the use of two types of chromogenic windows: thermochromic and
electrochromic windows. By 2013, these windows will begin production in the U.S. by multiple vendors at
high-volume manufacturing plants, enabling lower cost and larger area window products to be specified.
Both technologies are in the late R&D stage of development, where cost reductions and performance
improvements are underway. Electrochromic windows have been installed in numerous buildings over the
past four years, but monitored energy-efficiency performance has been independently evaluated in very
limited applications. Thermochromic windows have been installed in one other building with an
independent evaluation, but results have not yet been made public.
Thermochromic windows are a class of chromogenic devices that passively switch when the surface
temperature of the glass changes. The windows change from a clear to dark tinted state while remaining
transparent at all times. The thermochromic layer is produced as a thin plastic film and then applied to the
indoor surface of a heat-strengthened or tempered glass substrate. The end user is able to define the
properties of the double-pane insulating glass unit by selecting the type of glass that the thermochromic film
is adhered to and the type of low-e glass layer that the thermochromic glazing layer is combined with. A low
emittance coating (e.g., e=0.03) significantly improves the performance of thermochromic windows. These
choices affect the window's color and appearance, the temperature at which the thermochromic switches,
and the final solar control properties of the window.
Electrochromic coatings are switchable, thin-film coatings applied to glass during the manufacturing process
that can be actively controlled to change appearance reversibly from a clear to a dark blue tint when a small
direct current (dc) voltage is applied using a manually operated switch or an automated building control
system. The electrochromic window also remains transparent at all times when modulating transmitted
daylight and solar heat gains. Electrochromic windows are also produced as insulating glass units, which can
be engineered with different glazing substrates, low-e coatings, gas fills, and spacers to fine-tune
performance. Some electrochromic manufacturers have demonstrated automated control in building
applications, but, on the whole, this is a burgeoning area of development.
The U.S. General Services Administration's (GSA) Region 8 piloted a small application of these two
technologies in a 9,500-ft2 perimeter zone of a Federal office building. GSA's Green Proving Ground (GPG)
program supported a monitored assessment as a means of gauging technology maturity, performance, and
user response to the technologies and the resultant indoor environment. There are currently very few
publicly available studies of the technologies in occupied buildings that provide independent third-party
information on key issues of interest to GSA. This study was designed to enable GSA to explore and evaluate
the various practical aspects of post- occupancy performance associated with the two technologies without
A Pilot Demonstration of Electrochromic and Thermochromic Windows in the Denver Federal Center, Building 41, Denver, Colorado Page 2
the undue risk and cost of installing these emerging technologies building-wide. While it may be useful to
understand the specific aspects of this pilot demonstration to frame the results and conclusions, the intent
of this demonstration was to obtain a more detailed understanding of the technology, its maturity, and its
potential impacts to evaluate whether the technologies warrant further, more detailed investigations or
recommendation for broad deployment across GSA's buildings portfolio, or both.
The specific technical objectives of this pilot project were to:
Characterize and understand how the switchable windows work;
Estimate HVAC energy use reductions for a west-facing perimeter zone in an office building located in a
hot/ cold climate;
Gain an understanding of how switchable windows affect occupant comfort, satisfaction, and
acceptance of the technology; and
Estimate the potential economic feasibility of this technology assuming mature market costs.
GSA Region 8 selected the Denver Federal Center for a pilot demonstration of the electrochromic and
thermochromic windows. Site selection was based on several criteria: a) the existing, single pane, clear glass,
double hung windows badly needed to be replaced; and b) the space was entirely occupied by GSA, enabling
the regional office to monitor this technology more closely.
The Denver Federal Center, Building 41, is a low-rise office building located at West 6th Avenue in Denver,
Colorado (latitude 39.75°N). In 2011, the existing west-facing windows were replaced on the second floor,
affecting an approximate 200-ft length of the façade. The orientation of the west-facing façade was about
67° west of due south. The thermochromic windows were installed along the south end of the perimeter
zone. The electrochromic windows were installed adjacent to the thermochromic windows, in the middle of
the perimeter zone. In 2005, new low-emittance (low-e) windows were installed north of the electrochromic
windows in an adjacent area along a 200-ft length of the same facade. The punched windows were of
moderate size: the window-to-exterior-wall area ratio was 0.27. Each low-e window had a manually
operated, interior white woven roller shade with medium openness (i.e., there was a partially blocked view
out when the shades were lowered). The thermochromic and electrochromic windows had no interior
shades. All windows were well exposed to west sunlight from about mid-day to sunset. Incident solar
irradiance on the windows was increased by reflected radiation off the cool white roof in front of the
windows.
On the interior, the perimeter zone was defined by the 48-ft deep open plan office area adjacent to the
window wall. The area with the electrochromic and thermochromic windows was contiguous. A full height
wall divided this area from the area with the low-e windows. The work area near the windows was initially
furnished with open plan workstations with a walkway in front of the windows. Workstations were generally
6x8 ft. cubicles with 65-inch high partitions, with a few 51-inch high partitions in the area with the
thermochromic windows. In the second phase of monitoring, high efficiency workstations with 51-inch high
partitions were installed in some areas, particularly the area next to the electrochromic windows. There
were 71 GSA employees working in the area with the electrochromic and thermochromic windows; their
primary tasks involved working on the computer.

A Pilot Demonstration of Electrochromic and Thermochromic Windows in the Denver Federal Center, Building 41, Denver, Colorado Page 3
Both the thermochromic and electrochromic window composition and specifications for automatic control
of the electrochromic window were defined through a series of discussions between GSA and the
manufacturers. The controls were implemented in two phases. The objective of Phase I electrochromic
control algorithm was to minimize HVAC energy use while meeting the indoor requirements for daylight and
control of glare. Dimmable lighting controls were not installed in the building. The Phase II control system
refined the Phase I basic algorithm and added wall switches that occupants could use to override the
automatic control system manually and set the windows to their preferred tint level. The windows were
returned to automatic control after 60 minutes.
This study focused on evaluating three key aspects of performance:
1. Characterize and understand how the switchable windows work
Window and weather conditions were monitored at the site and these data were used to evaluate
actual thermochromic and electrochromic window operations.
Thermal infrared imaging tests were conducted to obtain a more detailed characterization of
thermochromic switching patterns.
2. Estimate HVAC energy use reductions
Annual energy use simulations were conducted using the EnergyPlus model, and the results were
used to evaluate the performance of the windows and economic feasibility. Since there were no
dimmable lighting controls, the impact of the windows on lighting energy use was not evaluated.
3. Gain an understanding of how switchable windows affect occupant comfort, satisfaction, and acceptance of the technology
Survey questions were issued to the zone occupants using an on-line survey tool.
The Phase I survey provided a before and after comparison of subjective responses to the comfort
and quality of the indoor environment with the old single-pane clear glass windows and the new
thermochromic and electrochromic windows. The electrochromic windows had Phase I controls.
The Phase II survey provided a before and after comparison of subjective responses to the
electrochromic windows with Phase I and II controls.
A. OVERALL TECHNOLOGY ASSESSMENT OF THERMOCHROMIC WINDOWS
Early-market thermochromic windows were evaluated for nine months in an occupied west-facing open plan
office area in Denver, Colorado. The thermochromic windows replaced the existing single-pane clear, wood-
framed windows from the original 1940s building. The following summary findings are generally applicable
to office buildings and are supported by the specifics of this case study demonstration.
A simplistic view of thermochromic windows is that the windows are tinted during the summer and are clear
during the winter, assuming that thermochromic windows switch based on outdoor air temperature.
Monitored data indicated that the thermochromic window switches based on a combination of outdoor air
temperature and incident solar radiation. The outdoor glass layer has absorptive properties, so incident
solar radiation is absorbed, which, in turn, heats up the glass and causes the thermochromic film layer
adhered to the glass to switch. This means that on a sunny day during the winter, for example, the

A Pilot Demonstration of Electrochromic and Thermochromic Windows in the Denver Federal Center, Building 41, Denver, Colorado Page 4
thermochromic windows in Denver were tinted for 4 hours in the afternoon for this west-facing orientation
when outdoor air temperatures were 41- 59°F (5-15°C).
This pattern of switching is not necessarily incompatible with the goal of reducing HVAC energy use. For
commercial office buildings with high internal loads from equipment, people, and lights, perimeter zones are
often in cooling mode throughout the winter. Having the thermochromic window switch during the winter
can help to curtail cooling energy use. Tinting will reduce daylight availability. However, lighting energy use
was not evaluated in this study because of the space layout, high partitions, and lack of automatic lighting
controls. Energy savings were assessed using the Window 6 and EnergyPlus building energy simulation
software. Window 6 was used to define the whole window solar, optical, and thermal properties, which
were then used in EnergyPlus to determine window heat gains.
The energy savings achieved in this project were illustrative of the potential of thermochromic windows to
reduce HVAC energy use when west-facing windows of moderate size are used in a 1940s commercial office
building in a hot/cold climate such as Denver, Colorado. For the thermochromic window tested in the
Denver Federal Center (type B-TC), there was a significant reduction in annual HVAC energy use compared
to the existing single-pane, clear-glazed windows, but the savings were about the same as those achieved
with the low- e windows. However, the solar-optical and thermal properties of the thermochromic window
are determined by the make-up of the insulating glass unit. If the emittance of the inboard low-e glass layer
is reduced to e=0.035, the solar heat gain coefficient (SHGC) range (whole window) of the thermochromic
used in the Denver facility decreases from SHGC=0.43-0.33 to SHGC=0.19-0.13. For this alternate
thermochromic (type C-TC), annual HVAC electricity use due to cooling equipment (e.g., chiller, fans, and
pumps) was decreased 22%, from 2.48 to 1.93 kWh/ft2-yr, compared to the existing single-pane, clear glass
windows. Peak cooling load decreased 47%, from 7.05 W/ft2 to 3.71 W/ft2, which, in turn, could enable
downsizing of HVAC cooling equipment (chiller and cooling tower) by 21%, from 50.1 tons to 39.8 tons, if
such a renovation was under consideration. Annual boiler gas consumption for heating also decreased 21%,
from 34.34 to 27.28 kBtu/ft2-yr.
If the existing single-pane, clear glass windows were replaced with low-e windows, then the payback would
be 21.5 years based on energy savings alone. Energy savings are attributed to increased solar control,
window insulation, and lower conductance window frames. Assuming an added cost of $16/ft2–glass for the
thermochromic film over the cost of the low-e window in a mature market with a large volume application,
the thermochromic (type C-TC) would shorten this simple payback by 0.5 years to 21 years, and the internal
rate of return would be the same as the low-e window, or 2%, assuming a 30-year life, 6% discount rate, and
utility costs of $0.20/kWh and $0.83/therm. Installation practices for the thermochromic windows were the
same as conventional windows, and no special maintenance requirements are needed. Based on the
occupant survey data, shades may be needed to control glare from the windows. This analysis did not
include the potential HVAC capital cost reductions if the system were to be replaced.
The performance impacts on lighting energy use were not included in this analysis. To counteract the
reduction in daylight due to the lower visible transmittance range of the type C-TC thermochromic window

A Pilot Demonstration of Electrochromic and Thermochromic Windows in the Denver Federal Center, Building 41, Denver, Colorado Page 5
(Tvis=0.21- 0.03 1), the upper clerestory portion of the window could be used for daylighting by installing
high-transmittance low-e glass instead of thermochromic glass. This would lower lighting energy use but
raise HVAC energy use. Alternatively, daylight could be admitted from other windows or skylights that have
less exposure to sun (e.g., north-facing windows).
The thermochromic film switched from a gray-yellowish clear color to an almost black gray-green color
when the critical switching temperature of the thermochromic film was reached. This particular
thermochromic is either clear or tinted – the film does not gradually tint as temperature is increased. In this
case, the switching temperature was about 89°F (32°C) but the manufacturer stated that the temperature
could be tuned to any desired value (this was not verified by LBNL). Views through the thermochromic
window were slightly distorted by the film, which lent a wavy appearance that was commented on in the
surveys issued to the occupants. The manufacturer indicated that this issue would be resolved in future
product releases (e.g., a 1-ft square sample sent to LBNL in November 2012 showed no perceptible
distortion of view through the sample).
The appearance of the window had irregular areas of clear and dark tinted patches across the face of the
window pane that were visible from indoors when localized shading by the overhang, reflected radiation off
the cool white roof and nearby mechanical ducts, or localized heating at the window frame edge caused a
non- uniform temperature gradient to occur across the surface of the window. The appearance was less
noticeable from the outdoors when it was bright outside. This mottled appearance did not last for more
than 30-60 minutes under stable solar conditions, but could occur more often under highly variable weather
conditions. A few occupants (3 of 19) also commented on this unsatisfactory appearance. There are other
types of thermochromic glazing available on the market that have a broader switching temperature range
that would not exhibit this non-uniform appearance, including a later version of the thermochromic
technology tested in this demonstration.
The occupant responses were particular to the site conditions, were few in number, and may not be
generalizable. Surveys were issued by an independent consultant several months before this GPG study was
initiated [18] 2. Eight of the 19 respondents had some written comments on the quality of the indoor
environment produced by the type B-TC thermochromic windows, including gloominess of the space, that
the windows made it look like it was storming outside, and that it looked like it was cloudy when it was
actually sunny outside. However, findings from the first phase survey of this GPG study, which was issued in
the winter, indicated no change in the average response to questions about thermal comfort, light level,
level of glare, task visibility, daylight level, aesthetic impression, and noise level with the thermochromic
windows installed compared to the existing window condition. This was surprising given the significant
difference between the two window conditions, but perhaps responses were dampened by the tall
workstation partitions. Twelve of the 19 respondents worked within 20 ft. of the window.
1 Note that the manufacturer claims that, due to polarization effects, the effective transmittance for indirect light from the blue sky is approximately 0.34. This claim could not be substantiated with the current measurement and rating procedure. 2 Cited reports, shown in square brackets, are listed in the Appendices at the end of this report. Footnotes are given as raised numbers, as in this example.

A Pilot Demonstration of Electrochromic and Thermochromic Windows in the Denver Federal Center, Building 41, Denver, Colorado Page 6
A second phase survey was issued in the summer, after workstations were replaced with new furniture with
lower height partitions in some areas. In this case, there was a statistically significant decrease in perceived
temperature during warm/hot weather, but no other changes in responses were found to be statistically
significant. For the second survey, 7 of the 11 respondents worked within 20 ft. of the window. When asked
for comments on areas of improvement, the largest number of comments (6 comments) was about the
need for interior shades. Five of the 18 respondents (largest percentage of respondents) thought that the
space would be more visually comfortable if operable shades were on the window. Direct sun on the west-
facing façades occurs in the afternoon and is particularly difficult to control due its low angles. In the
occupants' write-in comments, the most often-mentioned issue was how the windows changed their
perceptions of outdoor weather patterns. When all windows were automatically tinted in Phase I of testing,
the windows gave occupants the impression that it was very overcast or dark outside, even though it was
sunny. This was a problem common to buildings with heavily tinted windows, although in the case of
thermochromic windows and depending on how they are controlled, tinting would not occur all the time.
The potential market value of increased access to outdoor views was not included. Economic payback is
highly dependent on context. In other, more optimal applications, the economics would be more favorable.
The ability to model thermochromic windows was only recently added to EnergyPlus, and measured spectral
data has only become available within the term of this study. Therefore, we can only speculate on the
applicability of the general class of thermochromic windows to the GSA building stock. Thermochromic
windows are likely to reduce HVAC energy use in south-, east-, and west-facing perimeter zones with good
solar exposure and would be most applicable to moderate- to large-area windows without exterior shading,
particularly if frame replacement is not needed in the case of retrofit applications.
Thermochromic windows are likely to produce more significant energy saving benefits for commercial
buildings with high internal loads located in hot/cold climates. Although energy savings are more significant
in hot climates, thermochromic windows are unlikely to produce a significant occupant satisfaction in hot
climates where the thermochromic would be in a tinted state for the majority of the year; a static low-e
window could be used instead. End users are encouraged to run building energy simulations for their
specific case to determine the most appropriate combination of glass substrates, low-e coating, gas fill, and
frame type that meet both daylighting and HVAC energy use reduction goals.
The energy efficiency of thermochromic windows may be improved if the properties of the thermochromic
materials were more optimized for daylighting and the load profile of the commercial (or residential)
building. This is an area of significant research within the material science community. The manufacturer for
this study indicated that most of these performance objectives can be attained by new product
developments.
B. OVERALL TECHNOLOGY ASSESSMENT OF ELECTROCHROMIC WINDOWS
Early-market electrochromic (EC) windows were evaluated for twelve months in an occupied west-facing
open plan office area in Denver, Colorado. The electrochromic windows replaced the existing single-pane
clear, wood- framed windows from the original 1940s building. The following summary findings are
generally applicable and are supported by the specifics of this case study demonstration.
Automatic control of electrochromic windows can significantly affect both HVAC and lighting energy use in
the perimeter zone. This demonstration focused on minimizing HVAC energy use since lighting controls were

A Pilot Demonstration of Electrochromic and Thermochromic Windows in the Denver Federal Center, Building 41, Denver, Colorado Page 7
not installed. In Phase I of testing, the control system was designed to run in the automatic mode at all
times, where, depending on the outdoor air temperature, the window would either switch to a fully clear
state when it was cold outdoors (<60°F) or to a tint level allowing 6% daylight transmittance (Tvis = 0.06)
when the weather was hot (>90°F). During the monitored period for this Phase I control system, the system
never went into the cooling mode because temperatures in the fall and winter were never above 90°F.
The electrochromic manufacturer worked with the HVAC manufacturer to implement coordinated control
via BACNet communications. The electrochromic controller relinquished control to the HVAC control system
when in the HVAC mode and then the HVAC system returned control to the electrochromic system when
operating in the daylight mode. When outdoor temperatures were between 60 and 90°F, the windows
operated in the daylight mode and were switched based on transmitted daylight levels just inside the
window. This closed-loop mode of control maintained the photosensor level to within a specified range.
Initial attempts to coordinate control between systems were not always reliable, so, in the second phase of
testing, the HVAC system simply passed status information to the electrochromic control system and the
electrochromic system maintained control over the windows at all times. This new mode of coordination
worked reliably.
In Phase II of testing, the mode of control continued to focus on minimizing HVAC energy use by introducing
two new approaches: a) the damper position was used to determine heating or cooling status for the zone,
and b) the HVAC-based modulation of the electrochromic windows differed between scheduled occupied
and unoccupied hours of the day, the latter being more aggressive at minimizing window heat gains when
occupants were not present. The daylight mode continued to operate when the zone was in transition,
requiring neither heating nor cooling to maintain the setpoint temperature. Manual switches were also
introduced so that occupants could override automatic control. This system also worked fairly reliably once
the system was fully commissioned.
Energy savings were assessed using the Window 6 and EnergyPlus building energy simulation software.
Window 6 was used to define the whole window solar, optical, and thermal properties, which were then
used in EnergyPlus to determine window heat gains. Prior versions of EnergyPlus modeled the
electrochromic window as either fully clear or fully tinted with pre-defined control algorithms. New features
were developed in a parallel project and these features were tested and then used on this project to define
the Phase II control algorithm. Industry now has public domain software tools available to evaluate
electrochromic windows with multiple tinted states and any user-defined control algorithm.
The energy savings achieved in this project were illustrative of the potential of automated electrochromic
windows to reduce HVAC energy use when west-facing windows of moderate size are used in a 1940s
commercial office building in a hot/cold climate such as Denver, Colorado. Annual HVAC electricity use due
to cooling equipment (e.g., chiller, fans, and pumps) was decreased 22%, from 2.48 to 1.95 kWh/ft2-yr,
compared to the existing single-pane, clear glass windows. Peak cooling load was decreased 45%, from 7.05
W/ft2 to 3.87 W/ft2, which, in turn, would enable downsizing of HVAC cooling equipment, such as chiller and
cooling tower, by 20%, from 50.1 tons to 40.3 tons, if such a renovation was under consideration. Annual
boiler gas consumption for heating was decreased 19%, from 34.34 to 27.76 kBtu/ft2-yr. These are savings
without manual override; with manual override, savings will differ. In this study, occupants overrode the
automatic controls to increase daylight with an unknown net effect: cooling energy use may have been

A Pilot Demonstration of Electrochromic and Thermochromic Windows in the Denver Federal Center, Building 41, Denver, Colorado Page 8
increased, but lighting energy use and heat gains may have been decreased had daylight-responsive controls
been installed.
If the existing single-pane, clear glass windows were replaced with low-e windows, then the payback would
be 21.5 years based on energy savings alone. Assuming an added cost of $37/ft2–glass for the
electrochromic window and controls over the low-e window in a mature market with a large volume
application, the simple payback would be lengthened by 11.2 years to 32.7 years, and the internal rate of
return would be -1%, assuming a 30-year life, 6% discount rate, and utility costs of $0.20/kWh and
$0.83/therm.
Installation practices for electrochromic windows were the same as for conventional windows with the
exception of the involvement of the glazing and electrical contractors to install the related electrical
connections and sensors (e.g., low-voltage wiring and power for automatic and manual switching of the
electrochromic windows, electrochromic controllers, and sensors). For whole building applications, a
centralized control system would be needed to facilitate operations, tuning, and troubleshooting.
Depending on the control algorithm, the system can also require networking and coordination with other
building control systems. Integration of the electrochromic and HVAC control systems was accomplished
successfully in this demonstration. A period of on- site commissioning and tuning will be required. The time
needed to commission the systems in this pilot demonstration was not indicative of a mature market
product and is expected to be reduced significantly in the future. When operational, the control system will
likely require fine-tuning and adjustments (e.g., scheduled occupancy, set point temperatures, and
illuminance range) in response to facility and occupant input. In all other respects, maintenance practices
are expected to be the same as for conventional windows.
The electrochromic window switched from a clear, slightly blue color to a dark Prussian blue in steps defined
by the manufacturer. The number and levels of tinting can be defined when manufacturing the window unit
but not changed afterwards. When switching, the electrochromic window exhibited slight darkening from
the edges, but when switching was complete, the tinting across the window surface was uniform. No defects
such as pinholes or optical distortion were noted in the glazing units. When comparing the average
responses for the existing clear glass window with an interior shade and the new electrochromic window
without a shade, there was no statistically significant difference in the occupants' impressions of the
aesthetics of the windows. In the occupants' write-in comments, the most often-mentioned issue was how
the windows changed their perceptions of outdoor weather patterns. When all windows were automatically
tinted in Phase I of testing, the windows gave occupants the impression that it was very overcast or dark
outside, even though it was sunny. This was a problem common to buildings with heavily tinted windows,
although in the case of electrochromic windows and depending on how they are controlled, tinting would
not occur all the time. When occupants were permitted to override the automatic controls, the perceived
levels of daylight sufficiency increased. There were no remarks about the blue color exhibited by the tinted
windows.
Electrochromic windows can take 20-30 minutes to switch from the fully clear to the fully tinted state if the
windows are large and the outdoor conditions are cold. Solar radiation assists in speeding up electrochromic
switching significantly, and it is unlikely that end users would want the electrochromic windows fully tinted
if outdoor conditions were cold and overcast. Under partly cloudy conditions, however, the end user might
need the windows to control occasional direct sun. The windows used in this study were subdivided into

A Pilot Demonstration of Electrochromic and Thermochromic Windows in the Denver Federal Center, Building 41, Denver, Colorado Page 9
four lites so the distance between the bus bars used to supply voltage to the window was small (23 or 36
inches) – greater distances will slow switching speeds. Switching speed was not perceived to be an issue
with the occupants. Occupant responses were inconclusive and there were no write-in comments to the
effect that the windows did not switch fast enough to meet end user requirements. For the survey issued in
the winter, the majority of the end users (5 out of the 6 respondents) indicated that the window tinted and
untinted as expected and also achieved the expected effects. Longer response times could cause occupants
to turn to alternate measures to mitigate discomfort in a timely way, such as lowering an interior shade to
block direct sun. The largest group of responses to the question of whether the space would be more
visually comfortable if the windows had operable shades was "yes" (7 out of the 19 respondents).
As a possible indicator of a well-designed automatic control system, there was no statistically significant
difference in the occupants' perception of the indoor air temperature being too hot or too cold during hot
and cold weather when compared to the existing single pane, clear glass, double-hung wood windows or
Phase I and II modes of control. Nor were there statistically significant differences in perceived levels of
glare. If, for example, an occupant was in direct sun and the windows failed to automatically tint to control
either visual or thermal discomfort, one would perhaps expect stronger trends in the survey data. The type
and layout of Phase I workstation furniture, however, buffered occupants from the direct effects of the
windows, for the most part, and in Phase II, when workstation partitions were lowered and occupants were
moved closer to the windows, occupants could use the manual override switches to address uncomfortable
conditions. Of the four groups of electrochromic windows (two windows per control zone), automatic
control of one group was manually overridden for 39% of the total work hours over the monitored period,
while the remaining three window groups were overridden for 3 to 7% of the time. The most cited reasons
for the overrides were to reduce glare from sunlight, reduce glare when the sun was directly visible, and
increase overall brightness of the space, where use of the switches resulted in the window satisfying the
effect desired for 5 of the 6 people who responded to the survey question.
When the windows were in the automatic mode to reduce HVAC energy use, the control systems were not
explicitly designed to address daylighting to minimize lighting energy use, daylight quality, discomfort glare,
or control of direct sun. The manufacturer offered such options but the client wished to focus on minimizing
energy use. When the windows were in the daylight mode, it was unclear whether the system adequately
addressed comfort and indoor environmental quality issues. The occupant response data did not provide
statistically significant results and the occupant written-in responses were anecdotal, given the small
number of responses to the survey. Additional studies are required to determine if electrochromic windows
can deliver an energy efficient, comfortable, satisfactory and acceptable work place environment on a
routine, reliable basis.
Energy savings due to electrochromic windows would be greater with larger windows, greater solar
exposure (particularly in hotter climates), if the automated control algorithm was designed to minimize
lighting energy use through daylighting as well as HVAC energy use, and if the capital cost for downsizing
HVAC capacity was included for retrofit or new construction projects that are considering improvements to
the HVAC system. The potential real estate or market value of increased access to outdoor views was also
not included. Economic payback is highly dependent on context. In other, more optimal applications, the
economics would be more favorable.

A Pilot Demonstration of Electrochromic and Thermochromic Windows in the Denver Federal Center, Building 41, Denver, Colorado Page 10
Although the technology is simple to switch, optimal integration of this technology within buildings is made
complex by the interactions and demands of occupants performing a variety of tasks, by HVAC and lighting
operations, and by variable climatic conditions. Prior simulation and field studies indicate that well-
conceived and executed control algorithms combined with good architectural design will likely produce both
an energy- efficient and acceptable indoor environment. More work is needed to understand these complex
interactions and to define simple, robust, reliable, and cost-effective hardware and software solutions to
meet the varying demands over the life of the building. To accelerate market adoption and instill confidence
in this technology, additional third-party monitored demonstrations will be required to verify energy-
efficiency performance and assess end user satisfaction before recommendation for broad deployment
across GSA's buildings portfolio can be made.
CONCLUSIONS
This pilot study was designed to enable GSA to explore and evaluate the various practical aspects of post-
occupancy performance associated with the thermochromic and electrochromic technologies, both of which
are estimated to be at the late R&D stage of technology readiness (i.e., the cost reduction and performance
improvement stage).
For both technologies, the windows operated as intended and yielded significant reductions in window heat
gains and losses and HVAC energy use compared to the existing single-pane, clear glazed windows. For this
monitored study with moderate-area, west-facing, single-pane clear glass windows, the thermochromic
windows installed in the Denver Federal Center (type B-TC) yielded about the same energy savings as the
low-e reference windows. The solar control range of the thermochromic window could be improved with a
better low- e coating. With this alternative configuration, the thermochromic window (type C-TC) was able
to shorten the payback period compared to a low-e glazing retrofit by 0.5 years with an internal rate of
return of 2%. This assumes an added cost for the thermochromic film of $16/ft2-window. The electrochromic
windows lengthened the payback period compared to a low-e glazing retrofit by 11.2 years with an internal
rate of return of -1%. This assumes an added cost for the electrochromic window and controls of $37/ft2-
window. These savings were calculated based on HVAC energy savings alone; no impacts on lighting energy
use were included. In addition, savings due to HVAC downsizing were not included.
The quality of the indoor environment produced by the thermochromic (type B-TC) and electrochromic
windows was perceived as statistically comparable to that provided by the existing single-pane clear glazed
windows, which had operable interior roller shades. Anecdotal comments about the thermochromic and
electrochromic windows and use of the manual override switches (in the case of the electrochromic
windows) suggested that occupants preferred more daylight, less glare, and greater connection to the
outdoors than that provided by the dynamic windows.
In the case of the thermochromic windows, the manufacturer claims that the existing product and future
improvements to the project could be engineered to achieve a more acceptable and energy-efficient
balance between daylight and solar control. In the case of the electrochromic windows, the manufacturer
claims that they have the capability to automate the windows to balance both solar control and daylighting
objectives. In both cases, further, more detailed, investigations are needed to determine the performance
impacts on lighting energy use and assess occupant comfort and response before recommendation for
broad deployment across GSA's buildings portfolio can be made.

A Pilot Demonstration of Electrochromic and Thermochromic Windows in the Denver Federal Center, Building 41, Denver, Colorado Page 11
GSA's Green Proving Ground program is aimed at deriving conclusions that are not specific to a particular
building, rather to the building industry as a whole. The following general conclusions are based on findings
from this study and related studies that LBNL has conducted on thermochromic and electrochromic
windows for commercial office building applications but are not definitive:
The thermochromic windows evaluated in this study do not provide significant overall energy savings
benefits in internal load dominated commercial buildings, such as offices, over that achieved by
conventional low-e windows with the same solar heat gain coefficient (as the tinted thermochromic).
The spectrally selective, low-emittance windows of today have a high luminous efficacy (high visible
transmittance and low solar heat gain coefficient) and can reduce both HVAC and lighting energy use in
typical commercial buildings.
The electrochromic windows evaluated in this study can provide significant HVAC and lighting energy
savings in internal load dominated commercial buildings, such as offices, compared to low-e windows, if
the windows are large, unobstructed by other buildings or exterior attachments (e.g., overhangs), and
subject to significant solar exposure (south, east, and west-facing orientations in the Northern
Hemisphere). Energy savings are more significant in hot climates. Cost and complexity are major barriers
to market adoption. Occupant comfort and satisfaction with the resultant indoor environment are
considerable unknowns and require further evaluations.

A Pilot Demonstration of Electrochromic and Thermochromic Windows in the Denver Federal Center, Building 41, Denver, Colorado Page 12
II. Introduction The United States Department of Energy estimates that 30% of the energy used to heat and cool all United
States buildings, including federal facilities, is lost through inefficient windows, representing 4,100,000,000
MBtu of primary energy at a cost of $42,000,000,000 per year [1,2]. Daylight through windows offers an
opportunity to reduce lighting energy use, with an estimated technical potential to save 1,000,000,000 MBtu
of primary energy use in United States buildings. Efficient windows in Federal facilities would benefit the
United States buildings industry as a whole. The U.S. General Services Administration (GSA) is a leader
among federal agencies in aggressively pursuing energy efficiency opportunities for its facilities and
installing renewable energy systems to provide heating, cooling, and power to these facilities. GSA's Public
Building Service (PBS) has jurisdiction, custody or control over more than 9,600 assets and is responsible for
managing an inventory of diverse Federal buildings totaling more than 354 million square feet (ft2) of
building stock. This includes approximately 400 buildings listed in or eligible for listing in the National
Register of Historic Places, and more than 800 buildings that are over 50 years old. GSA has an abiding
interest in examining the technical performance and cost-effectiveness of different energy-efficient
technologies in its building portfolio as well as those currently proposed for construction. Given that the
large majority of GSA's buildings include office spaces, identifying appropriate energy-efficient solutions has
been a high priority for the GSA, as well as for other United States federal agencies. Based on the sheer size
of the building portfolio, there exists a huge opportunity for potential energy savings.
While the standard windows of today are significantly more efficient than in the past, they are still energy
liabilities. Even if all windows were converted to today's efficient products (e.g., low-emittance, dual pane
windows), they would still require 2,000,000,000 MBtu of energy use to offset heat gains and losses.
Windows can be converted to components that enable net zero energy building goals by more tightly
controlling the heat gains, losses, and daylight associated with windows. In both the residential and
commercial building sectors, dynamic windows are anticipated to transform windows into net energy
producers, resulting in less energy use than that required to offset the heat gains and losses through an
opaque insulated wall.
Dynamic windows can provide real-time optimization of perimeter zone energy use, peak demand, comfort,
amenity, and cost criteria on a seasonal or even minute-to-minute basis in response to weather, occupant
demands, or regional grid demands. Integrated with daylighting controls, these technologies have the
technical potential to reduce U.S. commercial building heating and cooling energy use by a total of
980,000,000 MBtu, with an additional potential to reduce about 500,000,000 to 1,00,000,000 MBtu in
lighting energy use over the business-as-usual case [1].
Dynamic windows have long been on the market: automated, motorized roller shades were used on a
California State office building in the 1970s to control solar gains as part of a demonstration of energy-
efficiency measures during the oil embargo. The Occidental Chemical Building in New York, built in 1980,
used motorized louvers within one of the first double-skin facades as part of a heat recovery system. Since
then, the digital revolution and significant advances in the material sciences have enabled buildings to
realize architecture's vision of an intelligent building "skin" that responds actively to both indoor
requirements and outdoor stimuli at a microscopic, rather than macroscopic, scale.

A Pilot Demonstration of Electrochromic and Thermochromic Windows in the Denver Federal Center, Building 41, Denver, Colorado Page 13
Chromogenic glazing materials are emerging technologies that hold the promise of enabling real-time
response to stimuli similar to the human skin. Switchable coatings on glass manage solar radiation and
visible light while enabling unobstructed views to the outdoors. Building energy simulations estimate that
actively controlled, near-term chromogenic glazings can reduce heating, ventilation, air-conditioning (HVAC),
and lighting energy use by 10-20% and reduce peak electricity demand by 20-30%, achieving energy use
levels that are lower than an opaque insulated wall. New material science developments will continue to
push the forefront of innovation, enabling even greater savings.
A. Opportunity
In standard practice, windows are selected based on solar heat gain and thermal properties dictated by
prescriptive energy efficiency codes. These mandatory requirements were formulated to minimize HVAC
energy use at lowest cost. In the 1980s, bronze-tinted, single-pane windows were standard practice,
followed by reflective windows in hotter climates (which were subsequently banned by most zoning
ordinances), then low- emittance windows in the 1990s.
Today's advanced windows are dual-pane, spectrally selective low-e windows, where the highest-ranking
performers for commercial buildings have a high visible transmittance (Tvis) to admit daylight, a low solar
heat gain coefficient (SHGC) to reject solar heat gains, and moderate U-value to reduce conductive heat
transfer through the window. In occupied buildings, however, the benefit of daylighting is often lost, since
interior shades are installed to control direct sun and window heat gains, and, in some cases, to provide
privacy. Once lowered, interior shades are rarely raised, according to field studies, often for many days on
end.
Integrated window systems attempt to minimize both HVAC and lighting energy use through a proactive
recognition of energy- and comfort-related tradeoffs to:
Reduce window heat gains, direct sun control, HVAC energy use, and glare (e.g., by lowering the shade);
versus
Increase daylighting, reduce lighting energy use and its associated heat gains, and permit access to views
(e.g., by raising the shade).
These tradeoffs can be achieved to some degree of success with static windows, manually operated shades,
and informed building design. With dynamic façade systems these tradeoffs are managed in real time,
enabling more optimal performance over the life of the building. Benefits include reduced annual energy
use and cost; reduced peak demand, which can reduce cost and provide increased utility grid stability
(which, when combined with other demand response strategies, can reduce the possibility of brown outs or
blackouts in energy supply within a city or region); improved comfort; and potentially reduced HVAC
capacity for additional cost savings.
Dynamic façade systems involve two key elements: 1) the window component being activated; and 2) the
control mechanism or control system algorithm indicating when and how the component is activated. Both
dictate the performance of the system. For example, outdoor Venetian blinds are commonly used in Europe
to reduce solar heat gains when lowered during the summer (air-conditioning is often not available in the
Northern climates) and enable passive solar heating and daylighting when raised during the winter. In the
1990s, sophisticated double envelope façade systems became popular in Europe, where motorized shading

A Pilot Demonstration of Electrochromic and Thermochromic Windows in the Denver Federal Center, Building 41, Denver, Colorado Page 14
was used as solar collectors in a ventilated deep air cavity, enabling heat rejection and recovery schemes to
be implemented at the perimeter zone [3]. Both of these solutions were driven by the desire to reduce or
even eliminate the need for perimeter zone HVAC systems. More recently, in the mid-2000s, automated
motorized interior roller shades were used in combination with digital dimmable lighting controls in a 1.6
Mft2 high-rise office building, where the shades were activated to control direct sun, glare, and daylight,
thereby reducing window loads and lighting energy use [4]. Subsequent to this volume purchase, possibly
the largest made in the U.S., the market and product offerings for automated shading grew significantly and
component costs dropped. These earlier activities have set the stage for realizing the goal of net zero energy
buildings using whole building integrated control systems, of which dynamic facades is a key component.
Chromogenic windows, described in more detail in Section II-A, hold several distinct advantages over
conventional motorized shading systems: a) the windows tint but remain transparent to preserve views out
(similar to photochromic sunglasses); b) the switchable coating or glazing layer rejects solar heat gains on
the outboard layer of an insulating glass unit, achieving more efficient solar control than most between-
pane or interior shading systems; and c) switchable glass requires less maintenance than a mechanized
system and cannot be damaged by the occupants or outdoor elements (e.g., ice, snow, wind, birds).
Large-area, durable, chromogenic window products are just emerging onto the buildings market. Switchable
glazings have been used for eyewear, rear view mirrors, and in luxury vehicles and boats for about a decade.
More durable, small-area electrochromic skylights and windows (a type of chromogenic material) have also
been offered commercially for niche applications on residential and commercial buildings since the early
2000s as the industry transitioned from laboratory devices to pilot production facilities.
This project demonstrates the use of two types of chromogenic windows: thermochromic (TC) and
electrochromic (EC) windows. By 2013, electrochromic and thermochromic windows will start to be
produced in the U.S. by multiple vendors using high-volume manufacturing plants, enabling lower cost,
larger area windows to be specified. Both technologies are in the late R&D stage of development, where
cost reductions and performance improvements are underway. Electrochromic windows have been installed
in numerous buildings over the past four years, but building performance has not yet been independently
evaluated. Thermochromic windows have been installed in one other building with an independent
evaluation, but results have not yet been made public.
This GSA Green Proving Ground program project piloted a small application of these two technologies in a
9,500-ft2 perimeter zone of a Federal office building as a means of gauging technology maturity,
performance, and user response to the technologies and the resultant indoor environment. There are
currently no publicly available studies of the technologies in occupied buildings that provide independent
third-party information on key issues of interest to GSA. This study was designed to enable GSA to explore
and evaluate the various practical aspects of post-occupancy performance associated with the two
technologies without the undue risk and cost of installing these emerging technologies building-wide. While
it may be useful to understand the specific aspects of this pilot demonstration to frame the results and
conclusions, the intent of this demonstration was to obtain a more detailed understanding of the
technology, its maturity, and its potential impacts to evaluate whether the technologies warrant further,
more detailed investigations, if needed, or recommendation for broad deployment across GSA's buildings
portfolio, or both.
A Pilot Demonstration of Electrochromic and Thermochromic Windows in the Denver Federal Center, Building 41, Denver, Colorado Page 15
If chromogenic windows are able to deliver on performance claims, the technology would be applicable to
all commercial buildings, particularly those with significant solar exposure, such as buildings with curtainwall
facades; large-area south-, east-, and west-facing windows that are unobstructed by trees or other
buildings; and buildings with significant internal loads from people, equipment, and lighting such as office
buildings. The chromogenic windows are sold as dual-pane glazing units and would require frame
replacement in retrofit applications where the existing glass is single pane. GSA manages a portfolio of
buildings with unique security requirements, such as protection from outdoor espionage and bomb blasts.
While these issues are not explored in detail in this study, fundamentally, the chromogenic windows are
similar to any other glazing on the market and would require the same considerations when designing for
security requirements.

A Pilot Demonstration of Electrochromic and Thermochromic Windows in the Denver Federal Center, Building 41, Denver, Colorado Page 16
III. Methodology
A. TECHNOLOGY DESCRIPTION
THERMOCHROMIC WINDOWS
Thermochromic (TC) windows are a class of chromogenic devices that passively switch when the surface
temperature of the glass changes. The general idea conceived of by material scientists is that at cold
temperatures during the winter, the glass is clear to enable passive solar heating. At warmer temperatures
during the summer, the glass becomes tinted to reduce the need for cooling. Thermochromic windows in
fact switch based on a combination of both incident solar radiation and outdoor air temperature (and other
environmental factors, such as wind and indoor air temperature), so, on a sunny winter day, a south-facing
window may tint even if outdoor temperatures are cold. The color and switching temperature of the
thermochromic window is dependent on the chemical composition of the material. When the
thermochromic switches, the glazing material tints, absorbing solar radiation, then partially rejecting the
heat to the outdoors and reducing daylight admission. When thermochromic is combined with a low-
emittance inboard glazing layer to form a double-pane insulating glass unit (IGU), the low-e coating reduces
transfer of radiative heat from the thermochromic glazing layer to the indoors. The window remains
transparent as it switches so the view is maintained irrespective of tint level.
At present, there are two known manufacturers of thermochromic windows in the U.S., whose primary
difference is the switching temperature of the thermochromic device: one switches over a broad range of
temperatures while the other switches over a narrow 1.8-3.6°F (1-2°C) temperature range. This study
focuses on evaluating the performance of the latter type, although lessons learned for one type are
generally applicable to the other type because the fundamental mechanisms for solar control are the same.
The thermochromic is produced as a thin plastic film and then applied to the indoor surface of a heat-
strengthened or tempered glass substrate. The end user is able to select the type of glass to which the
thermochromic film is adhered and the type of low-e glass layer the thermochromic glazing layer is
combined. These choices affect the window's color and appearance, the temperature at which the
thermochromic switches, and the final solar control properties of the window. With clear glass substrates,
the thermochromic window switches from a gray color when cold to an almost black-green color when hot.
Flat as well as curved windows are possible.
The following claims have been made by the manufacturer [5]:
The primary purpose of thermochromic windows is to save energy and increase human comfort by
regulating solar heat gain through windows in concert with outside temperatures. The filter provides a
variable solar heat gain coefficient with significant energy savings benefits.
In its cold state, the thermochromic window has a polarizing effect on the light passing through it,
mitigating exterior glare due to light reflecting off of surfaces.
The thermochromic window requires almost no maintenance or attention of any kind.

A Pilot Demonstration of Electrochromic and Thermochromic Windows in the Denver Federal Center, Building 41, Denver, Colorado Page 17
Other considerations include:
The durability or life of the thermochromic film is dependent on exposure to heat and ultraviolet
radiation. Durability of the film's adhesive is affected by thermal stress induced by a rapid rate of change
in the glass temperature. Seal failure of the insulating glass unit will also affect the life of the
thermochromic film. The manufacturer asserts that the thermochromic window has been ASTM tested
to a 30-year design life and 10-year warranty, and this testing has been third-party validated (see
Section V.A. Durability).
Since the thermochromic window switches at a particular temperature, it is important to match the
properties of the window to the building application. Building energy simulations are needed to evaluate
how a thermochromic window performs for a specific window orientation, building type, and climate.
This is discussed in Section V-A on annual energy savings.
The appearance of the façade, in most cases, will be non-uniform if there are outdoor projections or
obstructions (e.g., overhangs, fins, building wings) near the thermochromic windows that shade parts of
the window. This is discussed in Section V-A on switching characteristics as related to surface
temperature of the glass.
Reduced fading of valuable furnishings and artwork.
Thermochromic windows have not been tested extensively in the field. The technology readiness level is the
"late R&D" stage (i.e., cost reduction and performance improvement stage). 3 In 2011, the U.S. Department
of Energy initiated a monitored field test of the thermochromic with a broad switching temperature range at
the Iowa Energy Center [6] and at the Advanced Windows Testbed Facility of the Lawrence Berkeley
National Laboratory (LBNL) [7]. An early adopter/building owner retrofitted the entire façade of a five-story
building with this same type of thermochromic in the northern United States, but no public data were made
available. The thermochromic window with a narrow switching temperature range studied in this report has
also been installed and evaluated in a large curtainwall section of the National Renewable Energy Laboratory
(NREL) facility in Golden, Colorado [8]. Solar exposure was limited in the NREL facility due to the presence of
a deep overhang. This demonstration provides a monitored evaluation of a façade with more direct solar
exposure.
ELECTROCHROMIC WINDOWS
Electrochromic coatings (EC) are switchable thin-film coatings applied to glass that can be actively controlled
to change appearance reversibly from a clear to a dark blue tint when a small direct current (dc) voltage is
applied using a manually operated switch or an automated building control system. The electrochromic
window preserves the outward view while modulating transmitted daylight and solar heat gains.
3 GSA defines levels of technology maturity as follows: 2= Late R&D (in the cost reduction and performance improvement stage; may be available to
early adopters);) 3 = Early Deployment (commercially available; savings not yet proven in a whole building context)); 4 = Late Deployment (savings
are proven; market transformation/penetration is needed)); and 5 = Standards (technology has a Standard (ASHRAE 90.1, for example) rule either in
place, underway, planned, or ready to be planned).

A Pilot Demonstration of Electrochromic and Thermochromic Windows in the Denver Federal Center, Building 41, Denver, Colorado Page 18
The electrochromic glazing layer is used as the outboard layer in an insulating glass unit. For some
electrochromic coatings, low-emittance is a property of the electrochromic coating (on surface #2, where
surface #1 is the outdoor surface) so the inboard glass layer can be uncoated glass. As does the
thermochromic window, the electrochromic window modulates solar heat gains by absorbing radiation on
the outboard glazing layer and rejecting heat to the outdoors in combination with the low-e coating, which
reduces radiative heat transfer to the indoors. Incoming daylight is modulated as well by the tint level of the
window.
Electrochromic windows have an exponential response time that is dependent on the temperature and the
size of the window. A 4x5 ft. window on a hot day can take 2-3 minutes to switch from clear to fully tinted. A
5x8 ft. window on a cold day can take 5-10 minutes to reach 80% of full tint level, but 20-30 minutes to
switch from clear to its fully tinted state.
Electrochromic coatings, at this time, are fundamentally the same between the two known U.S.
manufacturers that currently offer this technology: the electrochromic materials exhibit approximately the
same solar-optical properties when switched. The combination of the electrochromic coating, the substrate
glazing layers, and emittance of the low-e coating determines the resultant range of solar and daylight
control, speed versus temperature characteristics, and color. Some electrochromic manufacturers have
demonstrated automated control in building applications, but, on the whole, this is a burgeoning area of
development. For both manufacturers, the technology readiness level is estimated to be in the "Early
Deployment" stage (i.e., commercially available; savings not yet proven in a whole building context).
The following claims have been made by the manufacturer [9]:
Electrochromic windows save energy, money, and the environment by letting light stream in without the
unwanted heat gain of conventional glass. Lighting and air-conditioning costs are reduced.
Electrochromic windows control tint to deliver abundant natural light that makes people happier,
healthier, and more productive without blocking the view to the outdoors.
Electrochromic windows mean reduced glare and no more shades. By eliminating the need for shades,
blinds, and louvers, electrochromic windows preserve views of the outdoors (the reason we have
windows and skylights in the first place). And by negating the costs of these add-ons (e.g., purchase
price, installation, cleaning, maintenance), the building owner saves money.
Reduced fading of valuable furnishings and artwork.
Other considerations include:
If automated, energy savings and end user satisfaction are dependent on how the controls are designed
and implemented.
The exterior appearance of the façade can have a non-uniform appearance if the windows are not
controlled to the same tint level (although the manufacturer claims that the outdoor appearance will be
more uniform and nearly independent of the tint level of the windows).
A Pilot Demonstration of Electrochromic and Thermochromic Windows in the Denver Federal Center, Building 41, Denver, Colorado Page 19
Interior shades may be needed to control direct sun and glare. This may change the economic payback
of this technology if payback is calculated assuming that no shades are needed when using
electrochromic windows.
The durability or lifetime of electrochromic windows has been evaluated by the National Renewable
Energy Laboratory (NREL) using accelerated aging tests where the electrochromic window was cycled
tens of thousands of times under elevated temperatures and levels of radiation. Product lifetime should
be discussed with the manufacturer prior to purchase.
There have been few monitored demonstrations of automated, energy-efficient electrochromic control, and
none have been designed to enable a rigorous evaluation of energy performance and occupant impacts over
the long term. A three-year, full-scale field test in an office mockup provided analysis of the window heat
gain and lighting impacts of an early prototype electrochromic window integrated with a dimmable electric
lighting system, but occupant satisfaction was evaluated over a short period (4-6 hour exposure per subject)
[10, 11]. A two-year monitored installation of electrochromic windows in a large office building
demonstrated end user acceptance of this technology, but the windows were shaded by a 10-foot deep
overhang and conventional skylights, confounding the analysis of energy use and occupant impacts [12]. An
18-month installation of electrochromic windows and dimmable lighting in a conference room also
demonstrated feasibility of the technology, but end user acceptance was inferred by manual override switch
activity, not direct subjective survey data [13]. Other electrochromic demonstrations are underway:
electrochromic windows are being used to retrofit part of an office building of the Department of Defense
(DoD) in Miramar, California, via the DoD Environmental Security Technology Certification Program, and is
due to be completed in 2014 [14].
B. TECHNICAL OBJECTIVES
As discussed in Section II-A, the overall objective of this pilot study was to begin to understand the technical
and market potential of these two emerging technologies in a real-world context through a small, targeted
application at a demonstration site. Therefore, the technical objectives of this pilot project were to:
characterize and understand how the switchable windows work;
estimate HVAC energy use reductions for a west-facing perimeter zone in an office building located in a
hot/cold climate;
gain an understanding of how switchable windows affect occupant comfort, satisfaction, and
acceptance of the technology; and
estimate the potential economic feasibility of this technology, assuming mature market costs.
Witnessing and experiencing the technology directly was perhaps one of the most valuable aspects of
conducting the pilot demonstration. In the case of the thermochromics, there is no characterization of how
the thermochromic window switches under variable weather conditions since the technology is just
emerging on the market. Does it actually switch as claimed by the manufacturer and how does it switch?
This information is critical to the understanding of how thermochromics balance the trade-offs of daylight
admission and solar heat gain rejection, which, in turn, affects HVAC and lighting energy use. The
appearance of the thermochromic window is also of interest – does the film look uniform and transparent
when switched or does it exhibit flaws and switching characteristics that indicate that the technology is still

A Pilot Demonstration of Electrochromic and Thermochromic Windows in the Denver Federal Center, Building 41, Denver, Colorado Page 20
insufficiently mature for the commercial market? Is the appearance of the exterior façade acceptable or will
it affect the marketability of the building? Does the appearance of the windows from the interior affect the
end user's perception of the quality of the indoor environment?
In the case of electrochromic windows, the same issues and questions apply. Here, patterns of switching are
determined by the automatic control system, which, in this pilot study, focused on minimizing HVAC and
lighting energy use. The analysis evaluates both the reliability of the control system in meeting stated
objectives (i.e., did it work?) and the impact of the controls on HVAC energy use and the occupants. The
unique challenge of this study was how the system was implemented. Two control systems were involved
and required integration: the electrochromic window control system and the HVAC control system. The pilot
study provided hands-on experience with the issues of networking and communication between two
proprietary control systems.
Verification of HVAC energy use savings due to the windows could not be measured directly because the
thermochromic and electrochromic windows were in the same thermal zone; that is, window heat gains
from the thermochromic windows could not be isolated from the electrochromic windows. Also, the
window area was small so savings were expected to be small, making direct measurement very challenging.
Instead, solar optical properties of the glazings were measured then used with the Window 6 [15] and
EnergyPlus [16] building energy simulation tool to determine annual HVAC energy use. These tasks in and of
themselves were valuable since the simulation tools for these technologies are under development. Lighting
energy use was not monitored because there were no daylight responsive lighting controls installed in the
monitored zone.
Gauging occupant comfort, satisfaction, and acceptance of the electrochromic and thermochromic window
technologies was perhaps the most interesting aspect of this study since there are no post-occupancy data
for these technologies. Although the installation was small and because occupant exposure to the windows
was mitigated by the high-partitioned work station furniture, the findings are indicative of occupant
response. GSA modified the furniture in the second half of the study and this provided an opportunity to
gauge user response when more directly exposed to the technologies. The demonstration enabled an
evaluation of user response when given the option to manually override the automatic controls (i.e., were
the manual controls used and did it lead to a greater degree of satisfaction with the technology and the
indoor environment?).
C. DEMONSTRATION PROJECT LOCATION
GSA Region 8 selected the Denver Federal Center for a pilot demonstration of the electrochromic and
thermochromic windows. Site selection was based on several criteria: a) the existing, single pane, clear glass,
double-hung windows badly needed to be replaced (Figure 1); and b) the space was entirely occupied by
GSA, enabling the regional office to more closely monitor their first Green Proving Ground project. A 200-ft
length of the west-facing façade on the second floor was selected for the renovation. Although the windows
were small, punched openings, exposure to direct solar radiation was relatively unobstructed by nearby
trees and other buildings, which was critical for the evaluation of the switchable windows. The perimeter
zone also extended another 200 ft., enabling comparisons against a reference case of low-e windows (which
were a retrofit measure installed in 2005) with the same solar exposure. LBNL was invited later to conduct a
more detailed monitored study after site selection and details of procurement had been resolved.
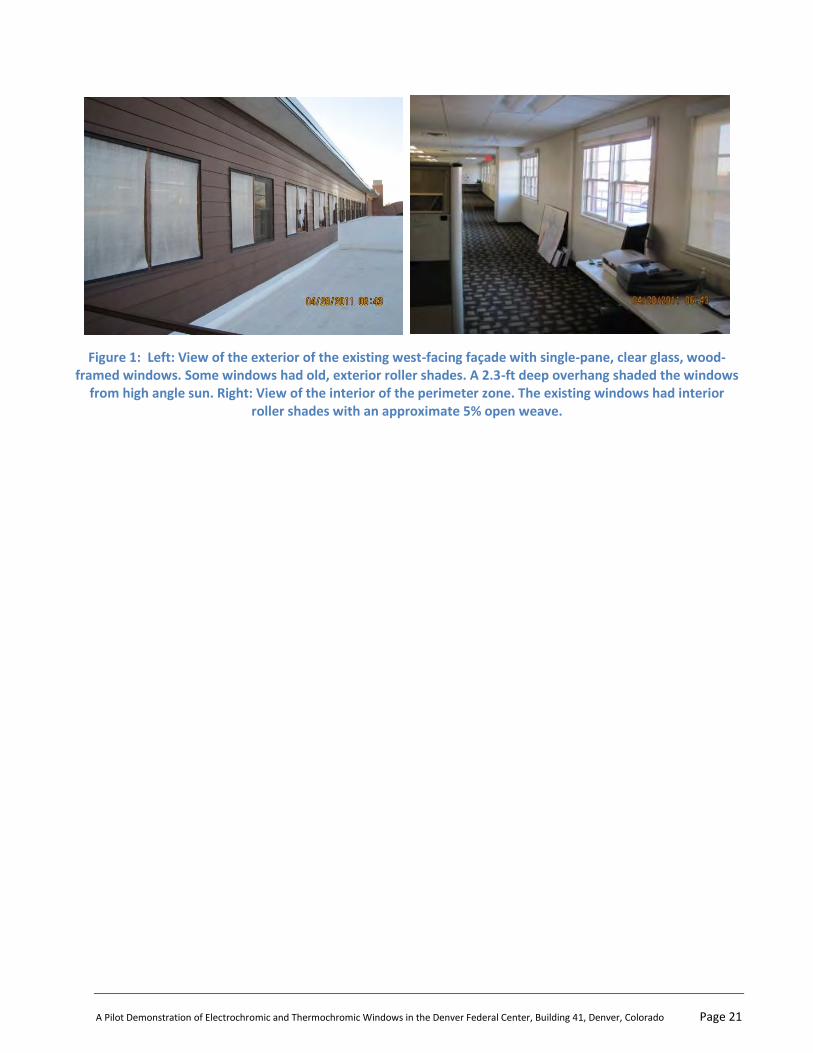
A Pilot Demonstration of Electrochromic and Thermochromic Windows in the Denver Federal Center, Building 41, Denver, Colorado Page 21
Figure 1: Left: View of the exterior of the existing west-facing façade with single-pane, clear glass, wood- framed windows. Some windows had old, exterior roller shades. A 2.3-ft deep overhang shaded the windows
from high angle sun. Right: View of the interior of the perimeter zone. The existing windows had interior roller shades with an approximate 5% open weave.

A Pilot Demonstration of Electrochromic and Thermochromic Windows in the Denver Federal Center, Building 41, Denver, Colorado Page 22
IV. M&V Evaluation Plan
A. FACILITY DESCRIPTION
The Denver Federal Center, Building 41 is a low-rise office building located at West 6th Avenue in Denver,
Colorado (latitude 39.75°N). There were no original drawings or specifications available for the 1940s
vintage building, so much of the information about the building was derived from a site visit, unscaled
drawings showing furniture layout, interviews with the Facilities staff, or provided by the GSA Project
Manager.
The existing single-pane, clear glazed, west-facing windows were replaced in 2011 on the second floor,
affecting an approximate 200-ft length of the façade. The orientation of the west-facing façade was about
67° west of due south. The thermochromic windows were installed along the south end of the perimeter
zone. The electrochromic windows were installed along the middle north end of the perimeter zone. New
low-e windows were installed in 2005 north of the electrochromic windows in an adjacent area along a 200
ft. length of the same facade. Both the single-pane clear and dual-pane low-e windows served as reference
cases against which the performance of the thermochromic and electrochromic windows was compared. Sill
height was 35 inches above the finished floor and the floor-to-floor height was about 11 ft. The punched
windows were of moderate size: the window-to-exterior-wall area ratio was 0.27.
Figure 2 shows the view of the installed low-e, electrochromic, and thermochromic windows along the west-
facing façade.
Each reference low-e window had a manually operated interior white woven roller shade with medium
openness (there was a partially blocked view out when the shades were lowered). The thermochromic and
electrochromic windows had the same type of interior shade, but the shades were fixed in a fully raised
position throughout the test period.
The windows were well exposed to west sunlight from about mid-day to sunset. Horizon obstructions were
for the most part fairly minimal, with the exception of a few windows that had roof-mounted HVAC ducts
(painted brown) positioned in front of some of the windows. A low brick parapet wall and building across
the street had an angular height of no more than 2°. A 2.3-ft deep continuous wood overhang was located
3.7 ft. above the top of the window, shading the window during early- to mid-afternoon hours. Incident
solar irradiance on the windows was increased by reflected radiation off the cool white roof in front of the
windows.

A Pilot Demonstration of Electrochromic and Thermochromic Windows in the Denver Federal Center, Building 41, Denver, Colorado Page 23
Figure 2: Exterior view of the west façade showing the locations of the three types of windows. The low-e windows were installed in 2005. The electrochromic windows were installed in June 2011. The thermochromic
windows were installed at the end of August 2011.
Figure 3: Photograph of the perimeter zone during Phase I, where the existing 65-inch high partitioned work stations were located approximately 8 ft. from the window. Left: View of the south end of the electrochromic window area showing the layout of the workstations relative to the windows. Right: View toward the interior
of the perimeter zone.

A Pilot Demonstration of Electrochromic and Thermochromic Windows in the Denver Federal Center, Building 41, Denver, Colorado Page 24
Figure 4: Photograph of the perimeter zone during Phase II, where the existing furniture near the windows was replaced in January 2012 with low-height workstation furniture in the electrochromic area and part of the thermochromic area. Left: View of the south end of the electrochromic window area showing the linear high- efficiency workstation layout. Right: View from the north end of the electrochromic window area showing the
high efficiency workstations serving four occupants.
On the interior, the perimeter zone was defined by the 48-ft deep open plan area adjacent to the window
wall. The area with the reference windows was separated from the electrochromic area by a full height, 48-
ft deep demising wall. The thermochromic area was separated from the electrochromic area by a storage
room with full height, 16-ft deep demising walls. The ceiling height was 7.75-ft high.
The work area near the windows was initially furnished with open plan workstations with a walkway in front
of the windows (Figure 3). Work stations were generally 6x8 ft. cubicles with 65-inch high partitions, while
some workstations on the south end had 51-inch high partitions. The partitions had opaque and glazed
sections, and in some work stations, occupants had a view of the window. In the second phase of
monitoring, high efficiency work stations were installed in the electrochromic portion of the perimeter zone
and other workstations were altered (Figure 4). A walking path was still defined between the window and
the workstations, but more people had direct views to the windows due to the low partition height.
Workstations had 51-inch high partitions and were arrayed in a hexagonal formation so that occupants
faced the center of the polygon with varying angles of view and distance from the windows. Phase I and II
furniture layouts are provided in Appendix A.
The electric lighting system consisted of ceiling-recessed 2x4 indirect troffers with (2-3) 32 W T8 lamps per
luminaire. The overhead lighting power density was approximately 0.67 W/ft2. Each workstation had two 13
W compact fluorescent task downlights mounted under the storage bins, and, in many of the workstations,
this lighting was turned on. In the thermochromic and electrochromic zones, overhead lighting was on 24/7,
except for the first row next to the window where some fixtures were switched off permanently. In the
reference zone with the low-e windows, lighting was typically turned on between 6 AM and 6 PM. Interior
surface reflectances of the walls, ceiling, and floor were 0.46, 0.72, and 0.10, respectively.
The HVAC system was a 2-zone constant volume, air handling unit (AHU) served by a central chiller and
boiler. The AHU had a mixed air section with an outside air damper, return air damper, exhaust damper,

A Pilot Demonstration of Electrochromic and Thermochromic Windows in the Denver Federal Center, Building 41, Denver, Colorado Page 25
filter, hot deck hot water heating coil, and cold deck chilled water cooling coil. Pneumatic actuation was
used for the dampers, heating coil and cooling coil valves. The dampers were controlled by a single
modulating signal to the outside, return, and exhaust air damper actuators. The perimeter and core zones
each used a damper to modulate between the hot deck and cold deck. The heating and cooling thermostat
setpoint were both set at 22.8°C with no night setback due to the pneumatic controls. Since no information
was available from the drawings and on- site staff, the coefficient of performance of the chiller was assumed
to be 5.89 and the boiler efficiency was assumed to be 0.78.
Occupants working in the perimeter zone conducted a mix of paper-based and computer-based tasks.
Occupant density was 71 people in the 9,500 ft2 of floor area. Hours of occupancy were typically Monday
through Friday, 7:30 AM to 5:30 PM. After-hour and weekend occupancy rarely occurred, according to the
building manager.
Computer-based tasks were conducted on flat screen displays. There was one desktop computer per
workstation, but more than half of the cubicles had two computer displays (white background luminance of
130- 166 cd/m2). Equipment loads were typical of an office: equipment consisted of several shared printers
and a scanner. A small fan was noted in one workstation.
B. TECHNOLOGY SPECIFICATION
The physical composition of the thermochromic and electrochromic windows is given in Table 1. Sizes of the
installed windows are summarized in Table 2.
Center-of-glass and whole-window thermal and solar-optical properties of the thermochromic,
electrochromic, and the two types of reference windows (single-pane, clear, wood-framed windows and
low-e dual-pane, aluminum-framed windows) were determined using Window 6. Center-of-glass values are
calculated without the window frame. Whole window values include the frame.
There were two additional windows that were evaluated using EnergyPlus building energy simulations, as
discussed in Section IV-D. One window represents the installed thermochromic window without the
thermochromic film (window "B"). The second window represents the existing low-e window with the
thermochromic film (window "C-TC"). Data for all windows are given in Tables 3 and 4. Measurement of the
spectral properties of the thermochromic windows, which were used in Window 6 to determine whole
window properties, was done as part of this study using a newly formulated procedure. These
measurements are described in Appendix B. Spectral data for the electrochromic windows was provided by
the manufacturer.
Note that for this climate, the ASHRAE 90.1-2010 code requires a whole window SHGC of 0.40 or less and a
U- value of 3.12 W/m2-°C or less for window-to-wall area ratios of 0-40% (Denver is in Climate Zone 5B).

A Pilot Demonstration of Electrochromic and Thermochromic Windows in the Denver Federal Center, Building 41, Denver, Colorado Page 26
Table 1: Physical Composition of the Installed Windows
Window Framing Layers
A Original Wood, twin double-hung 1/4" clear
C Low-e Thermally broken aluminum frame with a 1/2" stainless steel spacer
1/4" PPG Azuria, heat strengthened
1/2" air space
1/4" clear with Solarban 60*
B-TC Thermochromic Thermally broken aluminum frame with a 1/2" Technoform i-Spacer
1/4" OptiWhite low-iron glass
Thermochromic, surface 2
1/2" air space
1/4" PPG SunGate 500**
EC Electrochromic Thermally broken aluminum frame (Manko 6041) with a 1/2" stainless steel spacer
1/4" electrochromic outboard pane, tempered
1/2" air space
1/4" clear, tempered
Note: Surfaces are numbered from outdoors to indoors.
* low-e coating on surface #3, e=0.215; ** low-e on surface #3, e=0.035 (selected at GSA's request because
it offered the highest visible light transmission).
Table 2: Number and Sizes of Installed Windows
Overall dimensions
Number Height
(inches) Width
(inches) Lites per window Area (ft2)
Thermochromics 3 78.5 48 3 78.5
2 80 48.5 3 53.9
1 82 49 3 27.9
2 47 74.5 4 48.6
6 48 76 4 152.0
Electrochromics 8 48 76 4 202.7

A Pilot Demonstration of Electrochromic and Thermochromic Windows in the Denver Federal Center, Building 41, Denver, Colorado Page 27
Table 3: Center-of-glass Glazing System Properties
Window Window state U-value W/m2-K SHGC Tvis
A Single-pane clear not applicable 5.79 0.86 0.90
B Dual-pane, no TC not applicable 1.96 0.48 0.29
B-TC Dual-pane with thermochromic
Clear 1.96 0.48 0.29
Tinted 1.96 0.35 0.03
C Dual-pane low-e not applicable 1.64 0.31 0.54
C-TC Dual-pane low-e with thermochromic
Clear 1.60 0.17 0.29
Tinted 1.60 0.11 0.03
EC Dual-pane Fully Clear (Nominal Tvis = 0.60) 1.85 0.47 0.62
Electrochromic Nominal Tvis = 0.20 1.85 0.17 0.21
Nominal Tvis = 0.06 1.85 0.11 0.06
Fully Tinted (Nominal Tvis = 0.02) 1.85 0.09 0.02
Table 4: Whole Window Properties
Window Window state Ufactor W/m2-K SHGC Tvis
A Single-pane clear not applicable 4.55 0.59 0.58
B Dual-pane, no TC not applicable 2.95 0.43 0.23
B-TC Dual-pane with thermochromic
Clear 2.95 0.43 0.23
Tinted 2.95 0.33 0.03
C Dual-pane low-e not applicable 2.75 0.30 0.43
C-TC Dual-pane low-e with thermochromic
Clear 2.72 0.19 0.17
Tinted 2.72 0.13 0.02

A Pilot Demonstration of Electrochromic and Thermochromic Windows in the Denver Federal Center, Building 41, Denver, Colorado Page 28
Window Window state Ufactor W/m2-K SHGC Tvis
EC Dual-pane Fully Clear (Nominal Tvis = 0.60) 2.88 0.43 0.50
Electrochromic Nominal Tvis = 0.20 2.88 0.19 0.17
Nominal Tvis = 0.06 2.88 0.14 0.05
Fully Tinted (Nominal Tvis = 0.02) 2.88 0.13 0.01
PHASE I EC AUTOMATIC CONTROLS
Specifications for automatic control of the electrochromic window in Phase I were defined through a series
of discussions between GSA and the manufacturer based on GSA's experience with maintaining and
operating the building. The basic intent of the control algorithm was to minimize HVAC energy use while
meeting the indoor requirements for daylight and control of glare.
For automatic control, the electrochromic windows were grouped into pairs, with one indoor sensor
assigned to each pair. An indoor shielded photosensor was mounted on the window jamb and oriented to
look out the window. The electrochromic windows were set to produce four levels of tinting with a nominal
visible transmittance (Tvis) of 0.60, 0.20, 0.06, and 0.02 (exact values are given in Table 3). The
electrochromic window and HVAC system were integrated using the BACNet networking protocol, such that
when the control system was in the "daylight mode," the electrochromic control system would actuate the
window. When the control system was in the "HVAC mode," the HVAC control system would actuate the
window.
For the "daylight mode," control of the electrochromic windows was automated to modulate the tint level
of the window in response to transmitted daylight. The indoor photosensors were used in closed-loop mode
for control, where the electrochromic was controlled to maintain the photosensor value within a range of
3,000- 12,000 lux. All electrochromic windows were controlled as a single zone to the same tint level.
This basic algorithm was overridden by the "HVAC mode" when the outside air (OA) temperature was
outside a specified range defined by the set point temperature, i.e., 75±15°F, or 60-90°F. When the OA
temperature was less than 60°F, then the electrochromic was switched to the fully clear state. When the OA
temperature was greater than 90°F, then the electrochromic was switched to the second to darkest tinted
state (Tvis=0.06). A deadband of 1°F was set to reduce oscillations in the controls. The OA temperature
sensor from the original HVAC system was used for control, and this sensor was shielded from direct solar
irradiance on three sides and placed near the HVAC rooftop unit (RTU). The building operations staff
checked the calibration of the sensors on a yearly basis and replaced some of the sensors over the life of the
RTU installation. Table 5 summarizes the control logic.
Automatic control of the electrochromic windows was further overridden by the electrochromic
manufacturer to protect the long-term durability or life of the electrochromic coating. The electrochromic
control system allows the IGUs to be in any of the three tinted states for up to 16 continuous hours, with a
maximum of 8 of the hours being at the fully tinted state. If these limits are exceeded, the window was
automatically set to the "resting" clear state for a prescribed lock-out period of 20 minutes.

A Pilot Demonstration of Electrochromic and Thermochromic Windows in the Denver Federal Center, Building 41, Denver, Colorado Page 29
Table 5: Phase I Electrochromic Window Control Algorithm
Mode Outside air temperature (°F) Photosensor range (lux) EC state
Heating To < 60° NA Fully clear
Daylight 60° ≤ To ≤ 90° 3000 to 12,000 Varies
Cooling To > 90° NA Tvis=0.06
Notes: To = outside air temperature; NA = not applicable.
PHASE II ELECTROCHROMIC CONTROLS
In Phase II, a modified control algorithm was implemented to improve reliability and to enable occupant
override of the automatic control system. Switches were installed on the window wall to enable the
occupants to manually-override the automatic control system, where one switch controlled two adjacent
paired windows. End users could switch the windows to any of the four levels of tint. The windows were
returned to automatic control after 60 minutes. The electrochromic window and HVAC system were again
integrated, but this time the HVAC control system passively pushed data to the electrochromic control
system and the electrochromic control system actuated the windows at all times based on these data when
in the automatic mode.
Automated control was based on whether the space was occupied and what mode the HVAC system was in.
The HVAC system was in the heating mode if the damper position was between 75% and 85% and high
heating if the damper position was between 85% and 100%. The system was in the cooling mode if the
damper position was between 15% and 25% and high cooling if the damper was between 0% and 15%. The
HVAC mode was determined by information provided by the HVAC control system: two BACNet flags that
indicated the position of the supply air damper. Occupancy was determined by schedule. The zone was
considered to be occupied on work days between 8:00 AM to 5:00 PM from the start of Phase II to April 25,
2012, then was changed to work days between 6:00 AM and 6:00 PM, and unoccupied all other hours.
If the space was unoccupied, then the electrochromic windows were set to the fully clear state if the HVAC
system was in the heating mode and to the fully tinted state for a maximum of 8 hours if in the cooling
mode.
If the space was occupied and if the damper position was between 15-85%, then the control was in the
"daylight mode" as defined in Phase I, where the electrochromic windows were controlled to maintain the
sensor value within a range of 1,500-6,000 lux.
If the space was occupied and the damper position was less than 15% or greater than 85%, then the
electrochromic was controlled in the "high HVAC mode," based on a more restricted photosensor range. The
setpoint range was raised to 3,000-12,000 lux if in the high heating mode to allow more daylight and solar
gains to be admitted, and the setpoint range was lowered to 500-2,000 lux if in the high cooling mode. If the
control mode was in the "high HVAC mode" for more than 20 minutes, then the electrochromic window was
set to fully clear if in the high heating mode and to fully tinted if in the high cooling mode. The
electrochromic windows were tinted within the same time constraints for durability as in Phase I. Table 6
summarizes the control logic.

A Pilot Demonstration of Electrochromic and Thermochromic Windows in the Denver Federal Center, Building 41, Denver, Colorado Page 30
If the windows were manually overridden by the occupants, the system was returned to automated control
after 60 minutes, or whenever there was a change in HVAC mode.
Table 6: Phase II Electrochromic Window Control Algorithm
Mode Occupied
Supply Air Damper Position
Photosensor range (lux) EC State
High cooling Yes 0% < P < 15% 500-2,000 Varies, then fully tinted if in high mode for 20 min.
Daylight Yes 15% ≤ P ≤ 85% 1,500-6,000 Varies
High heating Yes 85% < P < 100% 3,000-12,000 Varies, then fully clear if in high mode for 20 min.
Cooling No 0% < P < 25% NA Fully tinted up to 8 hours, then Tvis=0.06
No 25% ≤ P ≤ 75% NA Previous state until enters heating or cooling mode
Heating No 75% < P < 100% NA Fully clear
Manual Yes NA NA User-defined, return to automatic after 60 min.
P = supply air damper position; P has a deadband of 1%; min. = minutes
Occupied: Work days 8:00 AM to 5:00 PM to April 25, 2012; Work days 6:00 AM to 6:00 PM after April 25,
2012.
C. TECHNOLOGY DEPLOYMENT
The electrochromic and thermochromic windows were purchased and installed by GSA Region 8. The
insulating glass units were provided by the manufacturers to the installation contractor, who then
assembled the insulating glazing units and framing into individual window units. The existing wood windows
were removed, and the framed windows were installed with the appropriate weatherproof barriers on the
exterior of the façade. The low-voltage wiring for the electrochromic windows was run by the glazing
contractor through the window framing channel, out the header, and then into the ceiling plenum, where it
was connected to the electrochromic window control unit. A power adaptor was installed in the ceiling for
the electrochromic control unit. Sensors for the electrochromic windows were installed on the interior of
the window frame. These wires were also run through the window frame to the ceiling above. The manual
switches were installed in Phase II; these were set into recessed wall boxes where power was provided by
conduit through the wall.
The GSA Facility manager said that both types of windows were installed using common construction
practices without any unanticipated problems.

A Pilot Demonstration of Electrochromic and Thermochromic Windows in the Denver Federal Center, Building 41, Denver, Colorado Page 31
TEST PLAN
Once the windows were installed, the schedule for monitoring and evaluating the technologies was as
follows (Table 7):
The electrochromic windows were installed June 20, 2011. The LBNL monitoring equipment was
installed as of July 6, 2011. Commissioning of the automated controls was completed September 15,
2011. The Phase I system was then monitored until December 31, 2011.
A new electrochromic control system was installed and made operational on February 21, 2012, after
furniture in the perimeter zone was renovated. Commissioning of the automated controls was
completed March 13, 2012. The Phase II system was then monitored until June 30, 2012. The new
controls included a revised automated system and new manual override switches, enabling occupants to
override the automatic controls and set the windows to their preferred tint level.
The thermochromic windows were installed by August 31, 2011. LBNL sensors were installed on
September 23, 2011, and data monitoring was conducted until June 30, 2012.
Table 7: Monitoring Schedule
Window Installation Test Period/ Auto control operational
Electrochromic Phase I June 20, 2011 September 15, 2011 - January 31, 2012
Electrochromic Phase II February 21, 2012* March 13, 2012 - June 30, 2012
Thermochromic August 31, 2011 August 31, 2011 - June 30, 2012
*New control algorithm was implemented.
To evaluate the performance of the switchable windows, the following steps were taken:
1. Characterize and understand how the switchable windows work
Window and weather conditions were monitored at the site, and these data were used to determine
actual thermochromic and electrochromic window operations. The status of the windows was
determined using two sets of paired sensors measuring incident and transmitted radiation through the
window and incident and transmitted daylight illuminance through the window. The ratio of these
values, nominally solar and visible transmittance of the window, yielded real-time data on the switching
state of the windows. These data and data logged by the manufacturer were used to determine whether
the electrochromic windows were being controlled according to the specifications.
Thermal infrared imaging tests were conducted to obtain a more detailed characterization of
thermochromic switching patterns.
2. Estimate HVAC energy use reductions
The conditions of the existing building were derived from limited tenant improvement construction
documents, site visits, and discussions with on-site GSA staff; then an EnergyPlus model of the affected
thermal zones was constructed, including site conditions, zone geometry, building construction, internal
equipment and lighting loads, HVAC system, and operating schedules.

A Pilot Demonstration of Electrochromic and Thermochromic Windows in the Denver Federal Center, Building 41, Denver, Colorado Page 32
Solar-optical measurements of the thermochromic glazing were made (see Appendix B), and these data
were then processed for use by the EnergyPlus building energy simulation software. Spectral data for
the electrochromic glazing was provided by the manufacturer.
The electrochromic window control algorithm was modeled using a newly developed feature in
EnergyPlus.
Annual energy use simulations were conducted using the EnergyPlus model, and the results were used
to evaluate the performance of the windows and economic feasibility.
3. Gain an understanding of how switchable windows affect occupant comfort, satisfaction, and acceptance of the technology
Survey questions were drafted by LBNL, reviewed by GSA, then a protocol was developed and approved
by the LBNL Human and Animal Regulatory Committee.
The subjective survey was issued twice to the zone occupants, one for each phase of monitoring.
Additional details on how these tasks were carried out are detailed in the following sections.
MONITORED SWITCHING STATUS
The thermochromic and electrochromic window switching status and the outdoor and indoor environmental
conditions influencing switching status were monitored over the test periods. The nominal solar
transmittance (Tsol') and visible transmittance (Tvis') of the windows were determined by the ratio of
transmitted to incident flux, where:
Tsol' = Qin / Qout
Tvis' = Ein / Eout
Qin and Qout are vertical irradiance (W/m2) measured at the indoor surface of the window and the outdoor
surface of the window at the same vertical height above the ground. These measurements were taken using
radiation sensors (LICOR LI-200), which were limited to wavelengths within the range of 400-1,100 nm with
an error of less than 5% if measuring unobstructed sunlight. More information about these measurements
can be found in Appendix C.
Ein and Eout are vertical illuminance (lux), and are also measured at the indoor and outdoor surfaces of the
window. These measurements were taken using an illuminance sensor (LICOR LI-100), which is expected to
yield values to within 2% of measured value.
Since the sensor area was approximately 1 cm in diameter, readings were not representative of the actual
conditions across the entire window surface. The outdoor window was subject to non-uniform incident
radiation due to local shadowing from the overhang and reflected radiation off the cool white roof,
surrounding roof parapets, and HVAC equipment. The tint level across the face of the switchable windows
was also not uniform due to their switching characteristics.
Surface temperature measurements were made on the indoor and outdoor surfaces of the window.
Temperature probes were mounted on the glass using clear silicon and were subject to localized heating
from solar irradiance. Actual outdoor glass surface temperature can be 1-3°C lower than the measured
A Pilot Demonstration of Electrochromic and Thermochromic Windows in the Denver Federal Center, Building 41, Denver, Colorado Page 33
surface temperature under certain ambient conditions when the thermistor (temperature sensor) is
irradiated (see Appendix D). Effects of snow, ice, or rain on the surface temperature of the window were not
characterized.
INFRARED THERMOGRAPHY FIELD MEASUREMENTS
Because the thermochromic windows switched within a relatively narrow range of temperatures, a site visit
was made to characterize thermochromic switching patterns in the presence of non-uniform irradiation
across the surface of the window and given localized heating by the window frame.
Infrared surface temperature images were captured using an infrared camera (FLIR SC660). Numerous
infrared (IR) and visible images were collected together at 1-5 minute intervals over the course of two days
in late September (September 22-23, 2011). The weather conditions were generally clear, sunny skies with
moderate ambient temperatures (~25-35°C). The measurements were calibrated using additional
measurements as described in Appendix D. Calibrated infrared measurements were found to be within 1-2°C
of the surface temperature measurements made with the contact thermistors.
ENERGYPLUS BUILDING ENERGY SIMULATIONS
The EnergyPlus building energy simulation program was used to determine the annual energy performance
of the three window types. This program, developed by the U.S. Department of Energy (DOE) and released
as open source software, is the de facto standard used by the U.S. building industry and supersedes the prior
DOE- supported software tool, DOE-2 (and third-party releases of the tool such as eQuest). The software
uses inputs on the site, building geometry, building construction, internal equipment, lighting, occupant
loads, HVAC system, and schedules of use to estimate energy savings. These assumptions are detailed in
Appendix E.
The 300-ft length of the second floor monitored zone was modeled with a 16-ft deep perimeter zone, 32-ft
deep core zone, and conditioned plenum. The three interior walls and floor of the model were modeled as
adiabatic (no heat transfer between interior zones) and an air wall divided the perimeter and core zones.
The cool white roof surface in front of the window, overhang, and other obstructions were modeled. The
total conditioned floor area of the modeled zone was 14,400 ft2 (Figure 5).

A Pilot Demonstration of Electrochromic and Thermochromic Windows in the Denver Federal Center, Building 41, Denver, Colorado Page 34
Figure 5: Schematic view of the modeled zone that was used as input to the EnergyPlus simulations. (The colors are not an indication of the actual color of the surfaces – they simply depict the different planes of the
surfaces.)
Modeling of electrochromic and thermochromic windows is one of the many existing capabilities within
EnergyPlus (version 7.1). Several cases were modeled, where for each case, all the windows in the perimeter
zone were modeled to be the same type because incident radiation across the façade was non-uniform. This
enabled standard comparisons of energy use between the various cases.
As described in Section IV-B, measured spectral data for the thermochromic and electrochromic windows
were input into the Window 6 program and used to produce whole window data for use in EnergyPlus. For
the thermochromic windows, data were input into EnergyPlus for 31.1°C and 33.3°C, where the same data
for the tinted state were used for temperatures above 33.3°C and the same data for the clear state were
used for temperatures below 31.1°C. EnergyPlus calculates the heat balance of the thermochromic window
to determine the surface temperature of the thermochromic layer, then uses this temperature to determine
the thermochromic switching state in the next time step. Energy calculations were conducted at each 15-
minute time interval for the entire year. Non-uniform irradiance across individual windows produced by
obstructions or ground reflected irradiance was not modeled by EnergyPlus: incident irradiation was
computed as an average value across the window. This will have a negligible effect on annual results due to
the low percentage of hours that the window is at or near the critical switching temperature.
The recent release of EnergyPlus version 7.1 allows end users to model stepped control of electrochromic
windows using a new feature in EnergyPlus, so Window 6 data were input into EnergyPlus for each step or
level of tinting used at the site. The Phase II electrochromic control system logic was implemented within
EnergyPlus, where the hot deck or cold deck damper position for the perimeter zone of the prior time step
was used to determine the electrochromic state as well as the interior illuminance level (600 lux) at the
reference point (5 ft. depth from the window and 1.5 ft. above the floor).
The HVAC system was modeled as a multi-zone, constant volume system serving the perimeter and core
zones separately. A central boiler and chiller were modeled as would occur for the whole building, but the
capacity was sized based on the loads in the modeled zone. The system was designed to meet the outside
air requirements with an economizer but no heat recovery system.

A Pilot Demonstration of Electrochromic and Thermochromic Windows in the Denver Federal Center, Building 41, Denver, Colorado Page 35
The lighting system was modeled as in the existing building, with no daylighting controls.
OCCUPANT SURVEYS
Besides the potential energy impact, windows have a fundamental effect on how building occupants
experience a building, given they are highly visible and also connected with view. Because of this, switchable
windows introduce a potentially disruptive change in the occupants' environment, and it is, therefore,
important to understand how occupants experience them in terms of comfort and indoor environmental
quality. The independent variable of interest in this study is, therefore, the type of window that is installed
in the space where occupants usually work. The dependent variables that we were attempting to observe
were the occupants' perception of comfort and indoor environmental quality.
We assessed these variables by means of a survey, composed of three parts. The first part consisted of
questions about the occupants themselves (e.g., age, gender) and their attitudes towards the various
aspects of comfort being studied (e.g., visual, thermal and acoustic). For example, if occupants of one area
were much more sensitive to noise than occupants of another area, that would explain differences in
perceptions of acoustic comfort rather than differences between the windows installed in those two areas.
The other two parts of the survey were almost identical and contained questions about the occupants'
perceptions of comfort during the period, before and after changes to the space were made.
Two changes were made to the window systems, the first corresponding to Phase, I where the existing
windows were replaced with new windows, and the second corresponding to Phase II, where the control
system for the electrochromic windows were modified and switches to override the automatic controls
were added.
The first survey, therefore, was designed to determine the change in occupants' perception of the space
before and after the new technology was installed. This survey was issued at the conclusion of Phase I.
The second survey was designed to determine the change in occupants' perception of the space before and
after the changes to the control system were made, with a focus on whether the manual override switches
increased occupant satisfaction with the electrochromic windows. This survey was issued at the conclusion
of Phase II. More detailed information about the occupant surveys are provided in Appendix F.
D. INSTRUMENTATION PLAN
The following sensors were installed on one electrochromic window at locations that were at a sufficient
distance away from the edge of the frame to yield data representative of the general area of the whole
window:
indoor and outdoor radiation sensors on the face of the upper and lower panes of the window;
indoor and outdoor illuminance sensors on the lower pane of the window;
indoor glass surface temperature measured on the face of the upper and lower panes of the window;
and
indoor frame temperature of the window.

A Pilot Demonstration of Electrochromic and Thermochromic Windows in the Denver Federal Center, Building 41, Denver, Colorado Page 36
The following sensors were installed on one thermochromic window in the same manner:
indoor and outdoor radiation sensors on the face of the upper and lower panes of the window;
indoor and outdoor illuminance sensors on the lower pane of the window;
indoor and outdoor glass surface temperature measured on the face of the upper and lower panes of
the window; and
indoor frame temperature of the window.
The following measurements were made to monitor weather conditions and the indoor environment:
indoor dry-bulb air temperature;
outdoor dry-bulb air temperature 6 ft. and 7.5 ft. in front of the window;
outdoor dry-bulb air temperature on the roof above the monitored zone;
outdoor wind speed 1.5 ft. in front of the window;
outdoor global horizontal irradiance on the roof in front of the window; and
outdoor global horizontal irradiance on the roof above the monitored zone.
All data were sampled and recorded once every minute, every day over the entire monitored period. Data
from the electrochromic and HVAC manufacturers' control systems were also trended every minute, and
these data were compiled into a single database for analysis. Data were transmitted via cellular network to
LBNL on a daily basis. Data from the HVAC manufacturer were transmitted on a weekly basis. Redundant
outdoor measurements were made to avoid loss of data due to the frequent thunderstorms that occurred in
Denver. More detailed information about the measurements is given in Appendix G.
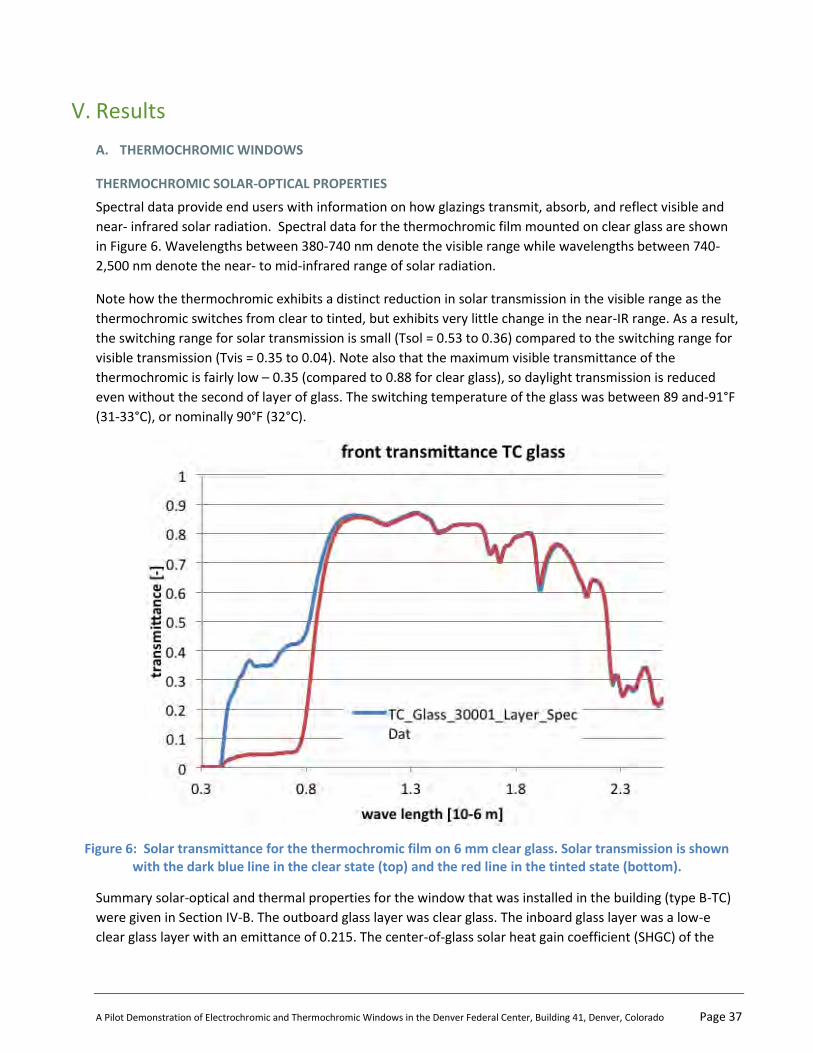
A Pilot Demonstration of Electrochromic and Thermochromic Windows in the Denver Federal Center, Building 41, Denver, Colorado Page 37
V. Results
A. THERMOCHROMIC WINDOWS
THERMOCHROMIC SOLAR-OPTICAL PROPERTIES
Spectral data provide end users with information on how glazings transmit, absorb, and reflect visible and
near- infrared solar radiation. Spectral data for the thermochromic film mounted on clear glass are shown
in Figure 6. Wavelengths between 380-740 nm denote the visible range while wavelengths between 740-
2,500 nm denote the near- to mid-infrared range of solar radiation.
Note how the thermochromic exhibits a distinct reduction in solar transmission in the visible range as the
thermochromic switches from clear to tinted, but exhibits very little change in the near-IR range. As a result,
the switching range for solar transmission is small (Tsol = 0.53 to 0.36) compared to the switching range for
visible transmission (Tvis = 0.35 to 0.04). Note also that the maximum visible transmittance of the
thermochromic is fairly low – 0.35 (compared to 0.88 for clear glass), so daylight transmission is reduced
even without the second of layer of glass. The switching temperature of the glass was between 89 and-91°F
(31-33°C), or nominally 90°F (32°C).
Figure 6: Solar transmittance for the thermochromic film on 6 mm clear glass. Solar transmission is shown with the dark blue line in the clear state (top) and the red line in the tinted state (bottom).
Summary solar-optical and thermal properties for the window that was installed in the building (type B-TC)
were given in Section IV-B. The outboard glass layer was clear glass. The inboard glass layer was a low-e
clear glass layer with an emittance of 0.215. The center-of-glass solar heat gain coefficient (SHGC) of the

A Pilot Demonstration of Electrochromic and Thermochromic Windows in the Denver Federal Center, Building 41, Denver, Colorado Page 38
insulating glass unit was moderately reduced when switched, from 0.48 to 0.35. The visible transmittance
(Tvis) of the insulating glass unit was reduced in the clear state and was further reduced when tinted, from
0.29 to 0.03. As expected, the U-value of the window was unaffected by the changes in solar transmission.
Note that the solar optical properties of the thermochromic insulating glass unit are dependent on the
substrate materials with which the thermochromic film is combined. The building site had new low-e
windows (type C) installed in 2005. With an inboard low-e glazing layer with an emittance of 0.035, this
insulating glass unit had a fairly high visible transmittance (Tvis=0.54) and a moderate solar heat gain
coefficient (SHGC=0.31). When the thermochromic film is combined with these glazing layers (Window type
C-TC), the center-of-glass SHGC drops to a range of 0.17 to 0.11 and the Tvis range drops to a range of 0.21
to 0.03. Note how the low-emittance coating was able to reduce radiative heat transfer significantly from
the absorptive thermochromic glazing layer to the indoors, thereby reducing the SHGC significantly.
Unfortunately, this insulating glass unit composition also reduces transmission of daylight.
The manufacturer indicated that they are working to develop a new series of thermochromic films that will
have different switching characteristics in the visible and near-infrared ranges of the solar spectrum. As a
result, the properties of thermochromic windows will vary depending on the type of thermochromic film
specified and the glazing layers with which the thermochromic film is combined. To determine which
combination results in the least energy use for a particular building application, engineering studies will be
required to compare the benefits of one combination over another.
This thermochromic technology relies on a combination of polarizers and liquid crystals to produce
thermochromism. Neither the spectral measurements nor the calculations made to determine the
properties of the window unit include the effect of polarization (i.e., both assume depolarized light). The
thermochromic material has a strong polarizing effect in its clear state and would act similar to polarizing
sunglasses, letting more light in one polarization than the other. In a real situation, this would affect light
incident at high angles and incident light that has been polarized (e.g., light reflected off of water and
daylight from blue skies). The manufacturer claims that the effective visible transmittance would be
significantly higher, approximately 0.34 instead of the calculated value of 0.29 given in this report.
Based on on-site observations of the windows, when the thermochromic windows switched, the color of the
window changed from a gray/yellowish tint to an almost black gray-green color. The thermochromic
windows also distorted the views to the outdoors, giving the impression of old wavy glass. Some of these
observations are noted in the section below on occupant response. The non-uniform appearance of the
window when switching is discussed in the sections below where infrared thermography and photographic
images were used to characterize switching patterns.
THERMOCHROMIC WINDOW SWITCHING CHARACTERISTICS BASED ON TRANSMISSION MEASUREMENTS
Thermochromic windows switch as a function of temperature; the thermochromic film is determined
primarily by the temperature of the outboard glass layer to which the film is adhered and by absorption of
incident solar radiation by the film itself. The temperature of the outboard glass layer is determined by
incident radiation, outdoor air temperature, and, to a lesser degree, by wind speed and indoor air
temperature. Since the indoor air temperature is kept fairly stable by the HVAC system, we relate
thermochromic switching performance to the outdoor environmental conditions.
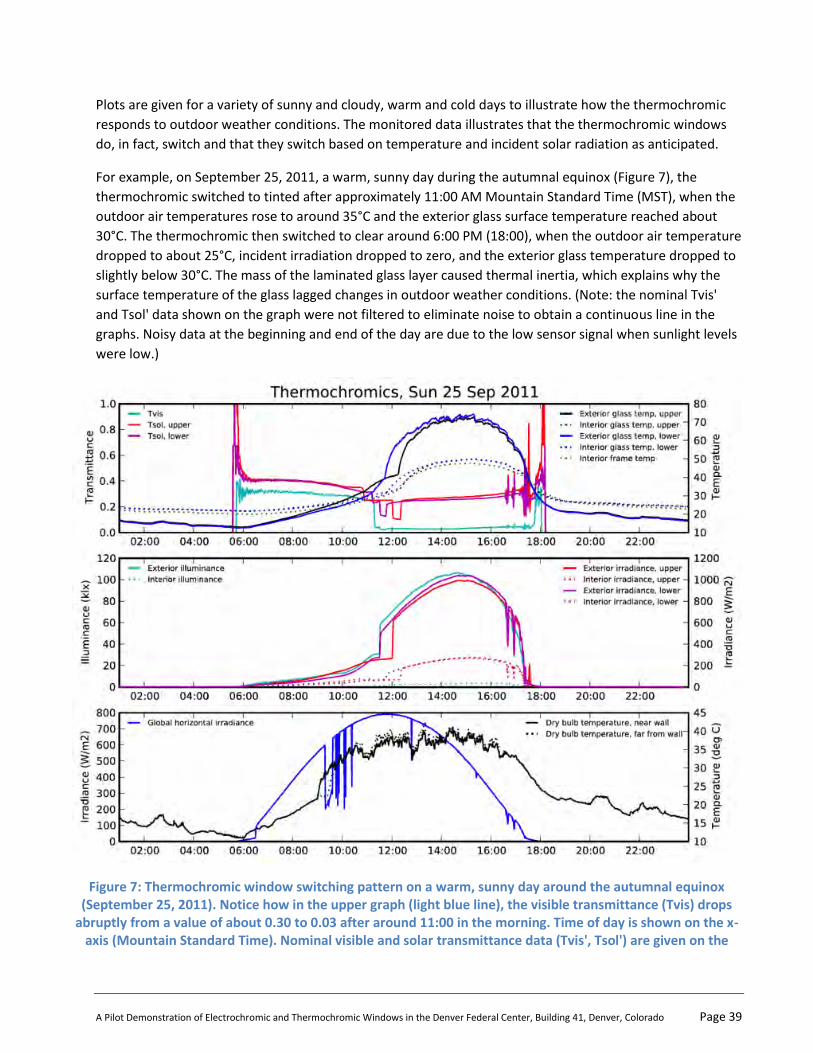
A Pilot Demonstration of Electrochromic and Thermochromic Windows in the Denver Federal Center, Building 41, Denver, Colorado Page 39
Plots are given for a variety of sunny and cloudy, warm and cold days to illustrate how the thermochromic
responds to outdoor weather conditions. The monitored data illustrates that the thermochromic windows
do, in fact, switch and that they switch based on temperature and incident solar radiation as anticipated.
For example, on September 25, 2011, a warm, sunny day during the autumnal equinox (Figure 7), the
thermochromic switched to tinted after approximately 11:00 AM Mountain Standard Time (MST), when the
outdoor air temperatures rose to around 35°C and the exterior glass surface temperature reached about
30°C. The thermochromic then switched to clear around 6:00 PM (18:00), when the outdoor air temperature
dropped to about 25°C, incident irradiation dropped to zero, and the exterior glass temperature dropped to
slightly below 30°C. The mass of the laminated glass layer caused thermal inertia, which explains why the
surface temperature of the glass lagged changes in outdoor weather conditions. (Note: the nominal Tvis'
and Tsol' data shown on the graph were not filtered to eliminate noise to obtain a continuous line in the
graphs. Noisy data at the beginning and end of the day are due to the low sensor signal when sunlight levels
were low.)
Figure 7: Thermochromic window switching pattern on a warm, sunny day around the autumnal equinox (September 25, 2011). Notice how in the upper graph (light blue line), the visible transmittance (Tvis) drops
abruptly from a value of about 0.30 to 0.03 after around 11:00 in the morning. Time of day is shown on the x- axis (Mountain Standard Time). Nominal visible and solar transmittance data (Tvis', Tsol') are given on the

A Pilot Demonstration of Electrochromic and Thermochromic Windows in the Denver Federal Center, Building 41, Denver, Colorado Page 40
uppermost graph as well as indoor and outdoor glass surface temperatures (°C). Incident and transmitted visible light or illuminance (klux) and incident and transmitted solar irradiance (W/m2) at the vertical window
surfaces are shown in the middle graph. Outdoor global horizontal irradiance and outdoor dry-bulb temperatures (°C) are illustrated in the lower graph.
During the winter, when outdoor air temperatures were lower, incident solar irradiation became the
primary trigger for switching the thermochromic to its tinted state. Incident radiation levels had to be above
about 650 W/m2 for the thermochromic to tint with outdoor air temperatures between 5 and 15°C, as
shown in Figure 8 for November 16, 2011. For this particular day, direct sun was never incident on the
façade, only diffuse radiation from the sky. Nevertheless, the thermochromic switched from a clear to tinted
state from about 12:00 PM until about 4:00 PM (16:00).
On cold, overcast days, the thermochromic window remained clear throughout the day, as shown in Figure 9
for October 26, 2011, when incident irradiation levels never rose above 200 W/m2 and the outdoor air
temperature was below 1°C throughout the day.

A Pilot Demonstration of Electrochromic and Thermochromic Windows in the Denver Federal Center, Building 41, Denver, Colorado Page 41
Figure 8: Thermochromic window switching pattern on a cold, sunny day (November 16, 2011). Thermochromic in this case switches to tinted from noon until 16:00 ST as indicated by the light blue line
(Tvis') in the top graph.

A Pilot Demonstration of Electrochromic and Thermochromic Windows in the Denver Federal Center, Building 41, Denver, Colorado Page 42
Figure 9: Thermochromic window switching pattern on a cold overcast day (October 26, 2011). In this case, the thermochromic window stays unswitched throughout the day as indicated by the light blue line (Tvis') in
the top graph.
This relationship is shown in Figure 10, where it is apparent that if the outdoor air temperature is below
about 5°C, the thermochromic is in the clear state, and, as the outdoor air temperatures increase, the
thermochromic is either in the clear or tinted state, depending on the mix of incident solar radiation and
outdoor air temperature. If the incident vertical irradiance exceeds about 400-600 W/m2, the
thermochromic is generally switched to the tinted state; beyond about 800 W/m2, the thermochromic is
predominantly switched to the tinted state. The scatterplots include all data for the 24-hour day over the
three-month period, but exclude data when solar irradiance levels were less than 5 W/m2.
The actual switching temperature of the thermochromic window correlates closely to that seen in the
laboratory (31-33°C). In Figure 11, Tvis' and the exterior surface temperature of the glass for the upper and
lower windows are shown in a scatterplot for the three-month period (September-December 2011). For
temperatures above about 30°C, the thermochromic is tinted, and, for temperatures below this threshold,
the thermochromic is for the most part clear. Note the high surface temperatures of the exterior

A Pilot Demonstration of Electrochromic and Thermochromic Windows in the Denver Federal Center, Building 41, Denver, Colorado Page 43
thermochromic glass layer. Although infrequent for this three-month monitored period, temperatures
reached 74°C.
Figure 10: Nominal visible transmittance (Tvis') of the thermochromic window as a function of outdoor dry bulb temperature (left) and incident vertical irradiance (right).
Figure 11: Nominal visible transmittance (Tvis') of the thermochromic window as a function of exterior glass surface temperature, measured on the upper (left graph) and lower (right graph) lites.
The switching patterns with respect to daylight admission and daylighting quality appear to be applicable
under hot sunny conditions: the thermochromic windows admit daylight in the morning when there is no
sunlight on the window, then switches to tinted to reduce sunlight in the afternoon. During the winter,
however, the thermochromic window still switches in the afternoon on sunny cold days when there is no
direct sunlight on the window, only diffuse daylight from the sky. On overcast cold days, the thermochromic
window admits daylight over the entire day. Unfortunately, discomfort glare and lighting energy use cannot
be derived from these data. Analysis of the occupant response data below provides some insights into end
user visual comfort and satisfaction with the indoor lighting quality.
HVAC heating and cooling status are not correlated to outdoor conditions for perimeter zones in typical
commercial office buildings. Offices have high internal gains due to the heat output from the high density of
people, equipment, and lights. Rejection of solar heat gain is typically required throughout the winter in

A Pilot Demonstration of Electrochromic and Thermochromic Windows in the Denver Federal Center, Building 41, Denver, Colorado Page 44
even cold climates. Whether or not the thermochromic reduces HVAC energy use is addressed in the
analysis of the building energy use simulations.
THERMOCHROMIC WINDOW SWITCHING CHARACTERISTICS AND APPEARANCE BASED ON GLASS SURFACE TEMPERATURE
The real world conditions at the Denver Federal Center presented a unique opportunity to evaluate the
uniformity of switching when incident solar radiation patterns across the window were non-uniform. Local
obstructions, such as the window framing, overhang, HVAC components, and reflected radiation off the
white roof, caused sunlit and shadowed areas across the thermochromic window. If the thermochromic had
a broad switching temperature range, then the appearance of the thermochromic window would be
uniform. This thermochromic window has a very narrow switching temperature range, which affected the
appearance of the window: some areas were tinted while other areas remained clear.
Comparing the visible and thermal image patterns in Figures 12 through 14, the apparent temperature of
transition measured from the outside surface was approximately 32°C. The transition in optical properties is
quite sharp, indicating that the critical switching temperature is within about a 1°C range. Note how the
glass surface temperature transition appears to be distributed in a broad gradient. Essentially, the optical
transition follows a single line of constant temperature in that gradient.

A Pilot Demonstration of Electrochromic and Thermochromic Windows in the Denver Federal Center, Building 41, Denver, Colorado Page 45
Figure 12: An infrared image of the dark tinted regions in the lower panes as the thermochromic transitions from clear to tinted with direct sun patches on the window. Image taken September 22, 2011, 11:57 AM ST.
Figure 13: A photographic image taken from perspective of the infrared camera at the same time as the image in Figure 12.

A Pilot Demonstration of Electrochromic and Thermochromic Windows in the Denver Federal Center, Building 41, Denver, Colorado Page 46
Figure 14: Interior view of the right hand four panes from the infrared image in Figure 12. The lower panes are in thermochromic transition (horizontal mirror image flipped to match exterior IR). The upper panes are clear because they are shaded by the overhang outside the window. The upper and right edges of the lower panes
are tinted due to shadowing by the frame and the middle and lower portions of the lower pane are tinted because the windows are in direct sun.
During the two days in September 2011 that the infrared thermography measurements were made, it was
again observed that thermochromic switching did not coincide solely with direct sun patterns, as shown in
Figure 12. Instead, thermochromic switching was instigated by a combination of outdoor air temperature
and total incident radiation (in this case diffuse radiation), beginning from the edges of the glass near the
frame, typically from the top down, before there was any direct sun on the windows. This may be in large
part a result of a large area of white reflective roof and mechanical ducts at the foot of these windows. The
reflected diffuse solar radiation appears to be enough to cause thermochromic switching before direct sun
hit the window when outdoor air temperatures were moderate (26°C).
One particular window, shown in Figures 15 through 17, had a long elevated duct surface directly below it.
This window switched first because it had the most favorable geometry for solar gain from reflection; other
windows switched later as incident radiation increased on that portion of the facade. Within the window,
the upper pane was in shadow and yet the upper portion of the upper window pane near the frame tended
to switch first, while the center portion of the pane remained clear. This was due to the larger solid angle

A Pilot Demonstration of Electrochromic and Thermochromic Windows in the Denver Federal Center, Building 41, Denver, Colorado Page 47
view of the roof reflective surfaces. The frame itself may also have warmed the glass edges by direct
absorption of reflected radiation as well as heat conducted from the nearby wall with its dark siding finish. A
final example of a more diffuse switching pattern is given in Figures 18 and 19.

A Pilot Demonstration of Electrochromic and Thermochromic Windows in the Denver Federal Center, Building 41, Denver, Colorado Page 48
Figure 15: Interior view of top down switching pattern when there is no direct sun on upper panes (horizontal mirror image flipped to match the exterior infrared image). The upper edge of the upper pane tinted before the center portion of the window even though the pane was shaded by the overhang. This edge tinting was due to reflected radiation from the roof surface and localized warming from the more conductive window
frame. Image taken September 22, 2011, 12:20 PM ST when the outdoor air temperature was 26°C.

A Pilot Demonstration of Electrochromic and Thermochromic Windows in the Denver Federal Center, Building 41, Denver, Colorado Page 49
Figure 16: Infrared surface temperatures, no direct sun on the upper panes. Image taken September 22, 2011, 12:20 PM ST when the outdoor air temperature was 26°C.
Figure 17: Photograph image of the exterior surface of the window in direct sun. Image taken September 22, 2011, 12:20 PM ST when the outdoor air temperature was 26°C.

A Pilot Demonstration of Electrochromic and Thermochromic Windows in the Denver Federal Center, Building 41, Denver, Colorado Page 50
Figure 18: Photographic images showing the switching pattern of the thermochromic glazing when direct sun has not yet covered the upper panes. Images given for September 23, 2011, 11:03 AM ST.
Figure 19: Infrared image (left) and photographic image (right) showing the thermal surface temperature patterns matching the switching pattern of thermochromic glazing when direct sun has not yet covered the
upper panes. Images given for September 23, 2011, 11:03 AM ST.
These non-uniform switching effects will not introduce significant adverse impacts on energy performance,
but it does point out the sensitivity of this type of thermochromic to details of surrounding surface geometry
and properties in a certain range of ambient conditions. The local non-uniform patterns generally do not last

A Pilot Demonstration of Electrochromic and Thermochromic Windows in the Denver Federal Center, Building 41, Denver, Colorado Page 51
for more than 30-60 minutes, but, overall, there is significant non-uniformity of window façade transmission
both within windows and between groups of windows along a large wall. The duration of this behavior could
be even longer under highly variable weather conditions.
THERMOCHROMIC WINDOW ANNUAL ENERGY SAVINGS
The following energy performance data were derived from the EnergyPlus simulations (Table 8 and Figures
20- 21). These results are given for the west-facing modeled zone to a depth of 48 ft. from the windows (see
Section IV-C for description and image of the modeled zone).
Reference case A – existing single pane clear windows with wood frames:
The single-pane clear glass window had a whole window SHGC of 0.59 and U-value of 4.55 W/m2K. The
thermochromic double pane window had a lower SHGC range of 0.33-0.43 and higher insulating
properties than the clear glass window.
The thermochromic window (B-TC) decreased window heat gains and heat losses by 50% and 51%,
respectively.
Sensible cooling energy use decreased by 26% and sensible heating energy use decreased by 13%. This is
the energy needed to simply offset thermal loads to maintain the setpoint temperature in the perimeter
zone, irrespective of type of HVAC system.
Annual HVAC electricity use due to cooling equipment (e.g., chiller, fans, and pumps) decreased 13%,
from 2.48 to 2.16 kWh/ft2-yr.
Annual boiler gas consumption for heating decreased 17%, from 34.34 to 28.53 kBtu/ft2-yr.
Peak cooling load decreased 32 %, from 7.05 W/ft2 to 4.79 W/ft2.
Chiller and cooling tower capacity decreased 12%, from 50.1 tons to 43.9 tons.
Table 8 allows one to determine the savings attributable to the thermochromic film. For example, 9% of
the total 50% reductions in window heat gains are due the thermochromic film. The 9% figure was
derived from the difference between the window (consisting of glass layers, low-e coating, gas fill,
spacers, and framing) with (B-TC) and without (B) the thermochromic film (50% - 41%).
Reference case B – double-pane low-e windows with thermally broken aluminum frames:
The double-pane low-e window (C) had a whole window SHGC of 0.30 and U-value of 2.75 W/m2K. The
thermochromic with the same low-e glass layers (C-TC) had a whole window SHGC of 0.19-0.13 and U- value
of 2.72 W/m2K.
The thermochromic window decreased window heat gains and heat losses by 58% and 4%, respectively.
Sensible cooling energy use decreased by 27% and sensible heating energy use increased by 19%.
Annual HVAC electricity use due to cooling equipment decreased 10%, from 2.14 to 1.93 kWh/ft2-yr.
Annual boiler gas consumption decreased 3%, from 28.20 to 27.28 kBtu/ft2-yr .
Peak cooling load decreased 21%, from 4.66 W/ft2 to 3.71 W/ft2.

A Pilot Demonstration of Electrochromic and Thermochromic Windows in the Denver Federal Center, Building 41, Denver, Colorado Page 52
Chiller and cooling tower capacity decreased 8%, from 43.34 tons to 39.76 tons.
Note that the impacts on daylight availability and lighting energy use were not evaluated. Lighting energy
use could be increased or decreased compared to a base case window with a manually-operated interior
shade. Energy use reductions are also contextually dependent. The data given above are for the Denver site,
where window area was moderate. For larger-area windows in perimeter zones, energy savings are
expected to be greater, assuming that the window system is appropriately designed for the building load
profile and climate.
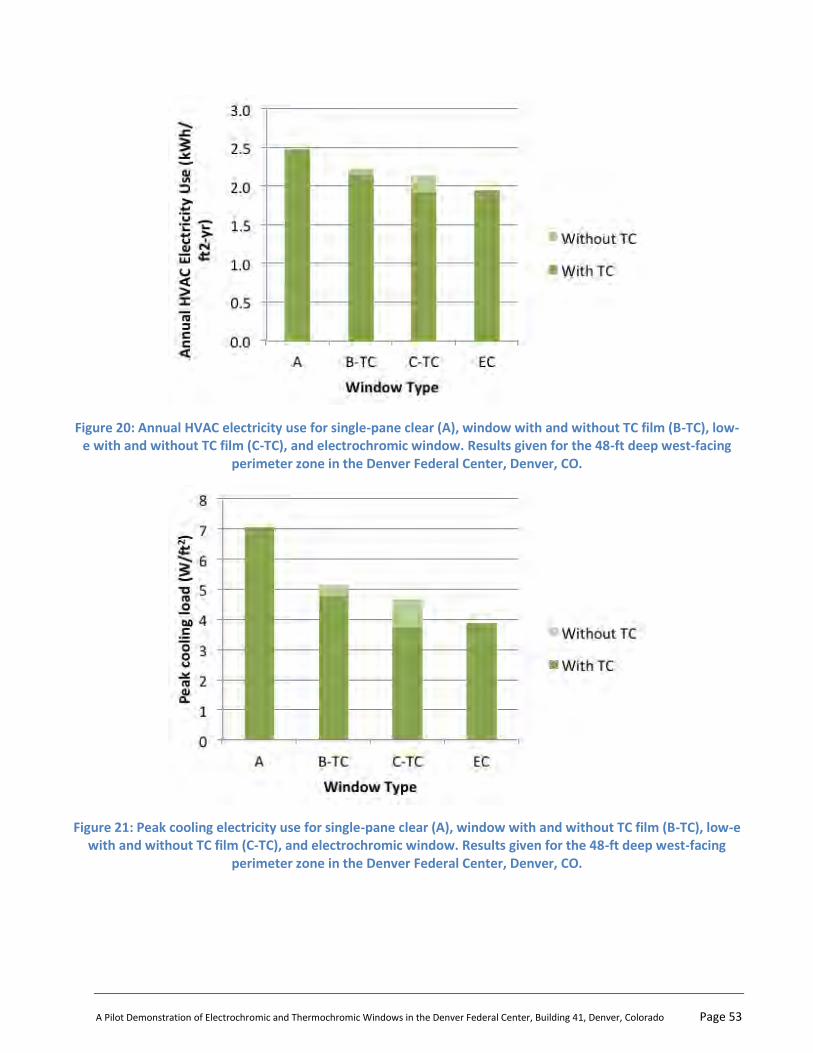
A Pilot Demonstration of Electrochromic and Thermochromic Windows in the Denver Federal Center, Building 41, Denver, Colorado Page 53
Figure 20: Annual HVAC electricity use for single-pane clear (A), window with and without TC film (B-TC), low- e with and without TC film (C-TC), and electrochromic window. Results given for the 48-ft deep west-facing
perimeter zone in the Denver Federal Center, Denver, CO.
Figure 21: Peak cooling electricity use for single-pane clear (A), window with and without TC film (B-TC), low-e with and without TC film (C-TC), and electrochromic window. Results given for the 48-ft deep west-facing
perimeter zone in the Denver Federal Center, Denver, CO.

A Pilot Demonstration of Electrochromic and Thermochromic Windows in the Denver Federal Center, Building 41, Denver, Colorado Page 54
Table 8: Energy Performance of Reference, Thermochromic, and Electrochromic Windows
A
Clear
B Window w/o TC
B-TC Window with TC
C Low-e
C-TC Low-e
with TC
EC Electro-chromic
Window heat gain kWh/ft2-yr 45.29 26.57 22.49 21.00 8.90 11.38
Savings vs. A 41% 50% 54% 80% 75%
Savings vs. C -27% -7% 58% 46%
Window heat loss kWh/ft2-yr 26.60 13.28 13.03 11.63 11.13 12.81
Savings vs. A 50% 51% 56% 58% 52%
Savings vs. C -14% -12% 4% -10%
Zone heating energy kWh/ft2-yr 2.03 1.69 1.77 1.73 2.05 2.09
Savings vs. A 17% 13% 15% -1% -3%
Savings vs. C 2% -2% -19% -21%
Zone cooling energy kWh/ft2-yr 3.97 3.21 2.93 2.84 2.06 2.20
Savings vs. A 19% 26% 28% 48% 45%
Savings vs. C -13% -3% 27% 23%
Annual HVAC kWh/ft2-yr 2.48 2.22 2.16 2.14 1.93 1.95
Savings vs. A 10% 13% 14% 22% 22%
Savings vs. C -4% -1% 10% 9%
Annual boiler gas kBtu/ft2-yr 34.34 29.37 28.53 28.20 27.28 27.76
Savings vs. A 14% 17% 18% 21% 19%
Savings vs. C -4% -1% 3% 2%
Peak cooling load W/ft2 7.05 5.16 4.79 4.66 3.71 3.87
Savings vs. A 27% 32% 34% 47% 45%
Savings vs. C -11% -3% 0% 21% 17%
Chiller capacity tons 25.9 23.4 22.7 22.4 20.6 20.9
Savings vs. A 10% 12% 13% 21% 20%
Savings vs. C -4% -1% 0% 8% 7%

A Pilot Demonstration of Electrochromic and Thermochromic Windows in the Denver Federal Center, Building 41, Denver, Colorado Page 55
A
Clear
B Window w/o TC
B-TC Window with TC
C Low-e
C-TC Low-e
with TC
EC Electro-chromic
Cooling tower tons 24.2 21.8 21.2 20.9 19.2 19.5
Savings vs. A 10% 12% 13% 21% 20%
Savings vs. C -4% -1% 0% 8% 7%
Chiller + Cooling tower capacity
tons 50.1 45.3 43.9 43.3 39.8 40.3
Savings vs. A 10% 12% 13% 21% 20%
Savings vs. C -4% -1% 0% 8% 7%
THERMOCHROMIC WINDOW ECONOMICS
RS Means [17] provides cost data for the building industry, where the costs are given for the general
Midwest. These costs represent a median value across the country. In the table below, the low-e materials
and installation costs were derived from Means, while the thermochromic window cost breakdown was
based on costs provided by the manufacturer. The manufacturer estimated a mature market, large volume
cost of $16/ft2 for the thermochromic film to be added to the insulating glass unit (including markups). All
costs are given as final cost to the end user (Table 9).
An economic analysis was performed where utility cost was assumed to be $0.20/kWh, assuming an
equivalent time-of-use rates schedule, $0.83/therm, 6% discount rate, and technology life time of 30 years.
Table 9: Estimated Costs for Installed Windows
Material ($/ft2) Labor ($/ft2) Total ($/ft2)
Low-e IGU 15 9 24
Low-e IGU + frame 19 23 42
TC IGU 31* 9 40
TC IGU + frame 35 23 58
* Note: This is an incremental cost of $16/ft2 above the cost of the low-e insulating glass unit (IGU).
As a basis for reference, in the case of replacing the existing single-pane windows (A) with new low-e
windows (C), the installed cost of $42/ft2 was used ($24/ft2 for the replacement of glazing plus $18/ft2 for
the replacement of the wood frame with a thermally-broken aluminum frame). The economics for this
scenario are:
Simple payback for the low-e windows is 21.5 years.
The net present value (NPV) including the initial investment is $26.89/ft2, with a net profit of -$15.11/ft2.
The cost of conserved energy is $0.31/kWh.

A Pilot Demonstration of Electrochromic and Thermochromic Windows in the Denver Federal Center, Building 41, Denver, Colorado Page 56
The internal rate of return is 2%. In the case of replacing the existing single-pane windows (A) with new
thermochromic low-e windows (C-TC), the installed cost of $58/ft2 was used. The economics for this
scenario are:
Simple payback for the thermochromic windows is 21 years.
The net present value (NPV) including the initial investment is $37.97/ft2 with a net profit of -$20.03/ft2.
The cost of conserved energy is $0.31/kWh.
The internal rate of return is 2%.
Notice that in this example, replacing the windows with a thermochromic window instead of a low-e
window results in a slightly lesser payback and the same IRR.
In the case of replacing the existing low-e windows (C) with a new thermochromic insulating glass unit (C-TC)
while retaining the existing window frame, the cost of $40/ft2 cost was used. The economics for this
scenario are:
Simple payback for the thermochromic windows is 20 years.
The net present value (NPV) including the initial investment is $11.09/ft2, with a net profit of -$4.91/ft2.
The cost of conserved energy is $0.29.
The internal rate of return is 3%.
The performance impacts on lighting energy use were not included in this analysis. To counteract the
reduction in daylight due to the lower visible transmittance range of the type C-TC thermochromic window
(Tvis=0.21- 0.03 4), the upper clerestory portion of the window could be used for daylighting by installing
high-transmittance low-e glass instead of thermochromic glass. This would lower lighting energy use but
raise HVAC energy use. Alternatively, daylight could be admitted from other windows or skylights that have
less exposure to sun (e.g., north-facing windows).
Note that these savings are given for a specific application where the window area was moderate (i.e.,
window- to-exterior-wall area ratio (WWR) was 0.27). HVAC energy savings due to thermochromic windows
could be greater with larger windows and greater solar exposure. Total annual energy savings could be
increased if the thermochromic film could be engineered to admit more daylight while still achieving
significant solar control, which would reduce lighting energy use. Cost-effectiveness could also be increased
if the capital cost for downsizing HVAC capacity was included for retrofit or new construction projects that
are considering improvements to the HVAC system. The real estate or market value of increased access to
outdoor views was also not included. Economic payback is highly dependent on context. In other, more
optimal applications, the economics could be more favorable.
4 Note that the manufacturer claims that due to polarization effects, the effective transmittance for indirect light from the blue sky is approximately 0.34. This claim could not be substantiated with the current measurement and rating procedure.

A Pilot Demonstration of Electrochromic and Thermochromic Windows in the Denver Federal Center, Building 41, Denver, Colorado Page 57
OCCUPANT RESPONSE TO THE THERMOCHROMIC WINDOWS
A PHASE I SURVEY
The Phase I survey was issued to occupants in January 2012, after the occupants had experienced the effects
of the thermochromic windows from September 1, 2011, to the time they filled out the survey. For each
occupant, we computed the difference in response regarding impressions before and after the switchable
glazing was installed. Before the thermochromic windows were installed, the occupants had double-hung
wood windows with single-pane clear glass, a manually operated interior fabric roller shade, and, on some
windows, a manually operated fabric exterior roller shade. Most occupants in the thermochromic area
worked in 51-inch high partitioned private cubicles, which started about 8 ft. from the window. Some
occupants worked in high efficiency workstations that were installed sometime in late summer 2011.
Characteristics of the respondents in the thermochromic area are given in Appendix F. There were 18
respondents (out of the 35 occupants working in the thermochromic area), 7 of which were in the
workstations nearest the windows, and a total of 12 respondents that were within 20 ft. of the windows.
Questions in Table 10 were analyzed. Descriptive statistics are shown in Table 11. Statistical significance was
determined using a paired t-test, which is appropriate for determining if there is a real difference (i.e., not
due to chance) between two observations of the same subjects.
Table 10: Questions regarding occupant impressions of the space
Question Response Options
Temperature during warm/hot weather
1 (Too cold)
2 3 (Just right)
4 5 (Too hot)
Temperature during cool/cold weather
1 (Too cold)
2 3 (Just right)
4 5 (Too hot)
Light level 1 (Too dark/gloomy)
2 3 (Just right)
4 5 (Too bright)
Level of glare 1 (Not perceptible)
2 (Perceptible)
3 (Acceptable)
4 (Uncomfortable)
5 (Intolerable)
Bright light on my task made it difficult to read or see
1 (Disagree)
2 3 (Somewhat agree)
4 5 (Agree)
There was enough daylight in the space
1 (Disagree)
2 3 (Somewhat agree)
4 5 (Agree)
The windows looked aesthetically pleasing
1 (Disagree)
2 3 (Somewhat agree)
4 5 (Agree)
The windows allowed too much outside noise into the space
1 (Disagree)
2 3 (Somewhat agree)
4 5 (Agree)

A Pilot Demonstration of Electrochromic and Thermochromic Windows in the Denver Federal Center, Building 41, Denver, Colorado Page 58
Table 11: Statistics of occupant change in response
Question Average response Average change
Standard deviation p-value
Before After
Thermochromics n = 19
Temperature during warm/hot weather 3.44 3.35 -0.06 0.93 0.79
Temperature during cool/cold weather 2.80 2.94 0.13 0.52 0.33
Light level 3.19 2.94 -0.25 1.00 0.33
Level of glare 3.38 3.13 -0.27 0.70 0.16
Bright light on my task made it difficult to read or see
3.00 2.69 -0.33 1.35 0.35
There was enough daylight in the space 3.81 3.38 -0.47 1.55 0.26
The windows looked aesthetically pleasing
2.81 2.69 0.00 1.46 1.00
The windows allowed too much outside noise into the space
1.87 1.40 -0.50 0.94 0.07
If p-value ≤ 0.05, then the result is statistically significant (at the 95% level or greater). Underlined, boldface
p-values are within the range of statistical significance. Posed questions are given in Table 10.
Findings from the Phase I survey were as follows:
The average changes in response to questions about thermal comfort, light level, level of glare, task
visibility, daylight level, aesthetic impressions, and noise level were small and not statistically significant,
suggesting a minimal difference between old existing windows and the new thermochromic windows, if
at all.
There was a small decrease in the perception of noise coming in through the windows, close to the 95%
level of statistical significance (p-value was 0.07), but this effect was due to the change from single-pane
double-hung windows to fixed, double-pane windows, which are acoustically more sound-proof.
Occupants were asked whether the space would be more visually comfortable if the shades on the
windows were made operable. The largest group of responses was "yes" (Table 12).
Occupants were asked whether the space would be more visually comfortable if the tinting/untinting of
the windows was operated manually instead of automatically. The largest group of responses was "it
would not make any difference" (Table 12).
When open-ended comments were solicited, occupants wrote about several issues, which are
summarized in Table 13. The most mentioned issue was the need for operable shades (6 mentions).
Glare (3) and unsatisfactory appearance (3) were also mentioned, as well as tinting at odd times (2),

A Pilot Demonstration of Electrochromic and Thermochromic Windows in the Denver Federal Center, Building 41, Denver, Colorado Page 59
spatially uneven tinting (2), and gloominess of the space (2). One occupant mentioned distortions of the
view to the outside ("blotchy").
Additional comments were made about how the windows changed occupants' perceptions of outdoor
weather patterns. In a separate study in the same area [18], occupants said that the windows made it
look like it was storming outside and that it looked like it was cloudy and depressing when it was actually
sunny outside.
GSA staff occasionally talked to occupants. One complaint is how the glass distorted the outdoor views.
The glass was perceived as being wavy or having a slightly bubbly appearance.
Table 12: Questions regarding desirability of control
Thermochromics
n = 18 Electrochromics
n = 19
Would this space be more visually comfortable if there were operable shades on the windows?
Yes 28% 37%
No 17% 11%
No difference 6% 21%
No response 50% 32%
Would this space be more visually comfortable if the darkening/lightening of the windows was operated manually instead of automatically?
Yes 22% 37%
No 22% 0%
No difference 39% 42%
No response 17% 21%

A Pilot Demonstration of Electrochromic and Thermochromic Windows in the Denver Federal Center, Building 41, Denver, Colorado Page 60
Table 13: Open-ended question on areas for improvement: number of respondents that mentioned each issue
Issue Thermochromics
n = 18 Electrochromics
n = 19
Window has unsatisfactory appearance 3 1
Window distorts outside view 1 0
Window gives misleading impression of the outdoor environment 0 5
Shades needed 6 3
Window tints at odd times 2 1
Window tints unevenly (spatially) 2 1
Space is gloomy 2 4
Occupant experiences glare 3 4
Space gets too hot 0 1
No response 6 7
The lack of a statistically significant difference in perceptions of indoor environmental quality is somewhat
surprising given the significant difference in the appearance of the windows. Part of this may be due to the
high partitions that blocked direct views of the windows. A small percentage of the occupants had indirect
views of the conventional south-facing windows, but, even within this group, the high partitions blocked
views to the south. The primary source of view and light were from the thermochromic windows.
B PHASE II SURVEY
The Phase II survey was issued to occupants in June 2012, after the occupants had experienced the effects of
the thermochromic windows from September 1, 2011, to the time they filled out the survey. This time,
occupants had experienced the windows for both winter and summer solar conditions. Characteristics of the
respondents in the thermochromic area for this second phase are given in Appendix F. There were 33
responses total, 11 of which were in the thermochromic area, with 5 nearest the windows, and a total of 7
respondents that were within 20 ft. of the windows.
We compared average occupant responses from the Phase I and II survey questions (Table 14). For the
thermochromic area, there was a highly statistically significant (p=0.005) decrease in perceived temperature
during warm/hot weather compared to Phase I conditions and to the existing window condition. The
thermochromic window was thought to have improved the thermal environment. For all other responses,
there were no statistically significant changes in occupant response.

A Pilot Demonstration of Electrochromic and Thermochromic Windows in the Denver Federal Center, Building 41, Denver, Colorado Page 61
Table 14: Average occupant response in the thermochromic zone for the Phase I and II surveys
Phase I Survey Phase II Survey p-value
Question Average response
Standard deviation
Average response
Standard deviation
Equal variance
Unequal variance
Temperature during warm/hot weather
3.35 0.79 2.27 0.79 0.00 0.00
Temperature during cool/cold weather
2.94 0.83 3.00 1.18 0.88 0.89
Light level 2.94 1.30 2.91 1.14 0.95 0.95
Level of glare 3.13 1.36 2.78 1.09 0.52 0.49
Bright light on my task made it difficult to read or see
2.69 1.70 2.36 1.69 0.63 0.63
There was enough daylight in the space
3.38 1.26 3.91 1.45 0.32 0.33
The windows looked aesthetically pleasing
2.69 1.35 2.55 1.37 0.79 0.79
The windows allowed too much outside noise into the space
1.40 0.63 1.27 0.65 0.62 0.62
If p-value ≤ 0.05, then the result is statistically significant (at the 95% level or greater). Underlined, boldface
p-values are within the range of statistical significance. Posed questions are given in Table 10.
DURABILITY
As mentioned in Section III-A, the durability or life of the thermochromic film is dependent on exposure to
heat and ultraviolet radiation. Durability of the film's adhesive is affected by thermal stress induced by a
rapid rate of change in the glass temperature.
A stress test was conducted on the thermochromic film by the NREL, where the results of the test were
released as confidential information to the manufacturer [19]. The current test protocol defined by the
ASTM E2141-10 Standard for Electrochromic Devices is to expose the thermochromic film to solar irradiance
at elevated temperature and determine if an acceptable level of degradation has occurred (e.g., percent
difference in appearance and properties of the film). However, the thermochromic is not cycled (heated up
to the high temperature then cooled down), therefore, NREL notes that this is not an approved test to
predict durability. The average temperature of the devices during environmental testing is 169-171°F (76-
77°C). Two samples were exposed for 4,672 and 27,000 hours and found to have no visible degradation.
The number of hours that the film is at these elevated or very cold temperatures is dependent on the
climate, window or skylight orientation, and degree of shading on the window. EnergyPlus was used to
estimate the total and cumulative hours of exposure for this particular application. The total number of
hours per year that the thermochromic is at any given temperature is shown in Figure 22. The cumulative
number of hours that the thermochromic is at or above a given temperature is shown in Figure 23. The

A Pilot Demonstration of Electrochromic and Thermochromic Windows in the Denver Federal Center, Building 41, Denver, Colorado Page 62
number of hours the thermochromic is at or above 60°C is 89 hours per year, so, if exposed for 30 years, the
total number of hours of exposure would be 2,670 hours for this west-facing facade. Note that at the actual
site, thermochromic glass temperatures of 74°C were measured. This is either due to the measurement,
since the thermistor (temperature sensor) yields a reading that is 3.6-5.4°F (2-3°C) greater than the actual
glass temperature, if irradiated, or due to an underestimate of the reflected irradiance in the simulation.
Figure 22: Number of hours per year that the surface temperature of the thermochromic window was at a given temperature. For example, the thermochromic window was at a temperature of 32°F (0°C) for 150 hours
in the year. Data were generated using EnergyPlus simulations.

A Pilot Demonstration of Electrochromic and Thermochromic Windows in the Denver Federal Center, Building 41, Denver, Colorado Page 63
Figure 23: Number of cumulative hours that the temperature of the thermochromic layer was at or above the temperature given on the x-axis (graph above) or at or below the temperature given on the x-axis (graph
below). For example, the number of cumulative hours that the thermochromic was at or below 32°F (0°C) was about 660 hours in the year.
The hours of exposure are used to assess the durability of the thermochromic film but not the durability of
the seals. If there is a large temperature difference between the inner and outer pane, it stresses the
adhesives used to seal the glass layers to the IGU spacer. Seal failure can lead to condensation in the IGU
and loss of any noble gas used within the cavity between the glass layers, reducing insulating properties. It
can also lead to degradation of the thermochromic material. This is unlikely to be a significant issue for
thermochromic windows since there are applications with dark tinted glass, but further investigation is
warranted since, unlike tinted glass, the thermochromic tints and un-tints with temperature.
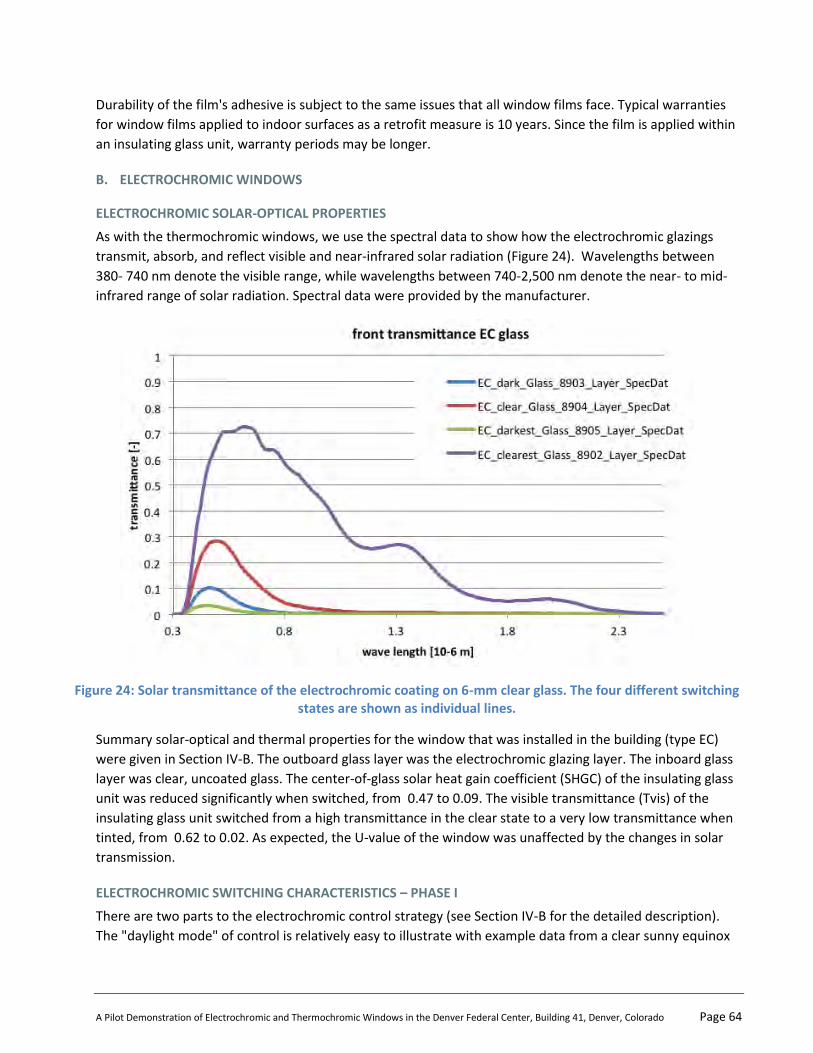
A Pilot Demonstration of Electrochromic and Thermochromic Windows in the Denver Federal Center, Building 41, Denver, Colorado Page 64
Durability of the film's adhesive is subject to the same issues that all window films face. Typical warranties
for window films applied to indoor surfaces as a retrofit measure is 10 years. Since the film is applied within
an insulating glass unit, warranty periods may be longer.
B. ELECTROCHROMIC WINDOWS
ELECTROCHROMIC SOLAR-OPTICAL PROPERTIES
As with the thermochromic windows, we use the spectral data to show how the electrochromic glazings
transmit, absorb, and reflect visible and near-infrared solar radiation (Figure 24). Wavelengths between
380- 740 nm denote the visible range, while wavelengths between 740-2,500 nm denote the near- to mid-
infrared range of solar radiation. Spectral data were provided by the manufacturer.
Figure 24: Solar transmittance of the electrochromic coating on 6-mm clear glass. The four different switching states are shown as individual lines.
Summary solar-optical and thermal properties for the window that was installed in the building (type EC)
were given in Section IV-B. The outboard glass layer was the electrochromic glazing layer. The inboard glass
layer was clear, uncoated glass. The center-of-glass solar heat gain coefficient (SHGC) of the insulating glass
unit was reduced significantly when switched, from 0.47 to 0.09. The visible transmittance (Tvis) of the
insulating glass unit switched from a high transmittance in the clear state to a very low transmittance when
tinted, from 0.62 to 0.02. As expected, the U-value of the window was unaffected by the changes in solar
transmission.
ELECTROCHROMIC SWITCHING CHARACTERISTICS – PHASE I
There are two parts to the electrochromic control strategy (see Section IV-B for the detailed description).
The "daylight mode" of control is relatively easy to illustrate with example data from a clear sunny equinox

A Pilot Demonstration of Electrochromic and Thermochromic Windows in the Denver Federal Center, Building 41, Denver, Colorado Page 65
day, September 27, 2011 (Figure 25). The electrochromic window switched gradually over the course of the
day starting from its clearest state at sunrise (6:00 AM MST), switching to the 20% tinted state at around
9:00 AM, switching to the 6% tinted state when the sun came around to the plane of the window around
noon, then switching to the 2% fully tinted state between 13:00-15:00 when incident solar radiation was
most intense on the southwest façade. The window stepped back up to clear between 15:00 and 17:00 with
the sun setting around 17:45. The switching pattern toward the end of the day was counterintuitive because
the sun orb dropped lower in the sky (< 50° after 13:30) and was likely seen by occupants until 17:30,
assuming that the roof parapet obscured views of the sunset from 17:30 to 18:00. It is during this time one
would want the electrochromic to be at its darkest 2% state. (The manufacturer indicates that they would
typically implement the glare mode of control but was not permitted to do so on this project because GSA
was focused primarily on maximizing energy savings.)
Data for the three-month period when the electrochromic windows were controlled by the daylight mode
are shown in Figure 26 as a function of incident exterior vertical illuminance. Here, we notice that the
nominal visible transmittance (Tvis') of the electrochromic window steps down to lower levels as incident
exterior illuminance levels increase, illustrating that this aspect of the control system is responding as
intended.
To illustrate the HVAC mode of control, we show when the electrochromic windows were in the HVAC mode
and the corresponding outdoor air temperature readings from the LBNL monitoring system. Control of the
electrochromic windows, however, was based on readings from the HVAC control system's temperature
sensor.
Figure 25 (September 27, 2011) shows how the daylight mode was overridden by the HVAC mode during the
night and early morning hours (3:00-7:30) when outdoor air temperatures were below 59°F (15°C), as
indicated by the window mode value of 125 on the upper graph. The daylight mode remained in effect from
7:30 to 23:00. The transition from daylight to HVAC then back to daylight mode after 23:00 may be
explained by the slight rise in outdoor air temperature. Figure 27 (October 7, 2011) provides another
example of how the daylight and HVAC modes operate on a day when the outdoor temperature was both
below the 59°F (15°C) threshold and above the 89°F (31.7°C) threshold.

A Pilot Demonstration of Electrochromic and Thermochromic Windows in the Denver Federal Center, Building 41, Denver, Colorado Page 66
Figure 25: Phase I electrochromic switching pattern on a warm, sunny day around the autumnal equinox (September 27, 2011). Notice how in the upper graph (light blue line), the nominal visible transmittance
("Tvis" on the graph) drops from 60% to 20% at around 9:00 in the morning, reduces further to 2% between 13:00-15:00, then steps back up to clear around between 15:00 and 17:00. The HVAC control mode, indicated by the dark blue line in the top graph, is in effect when the tint command value is 125. Time of day is shown on the x-axis (Mountain Standard Time). Nominal visible and solar transmittance data (Tvis', Tsol') are given
on the uppermost graph. Incident and transmitted visible light or illuminance (klux) and incident and transmitted solar irradiance (W/m2) at the vertical window surfaces are given in the middle graph. Outdoor
global horizontal irradiance and outdoor dry-bulb temperatures (°C) are given in the lower graph.

A Pilot Demonstration of Electrochromic and Thermochromic Windows in the Denver Federal Center, Building 41, Denver, Colorado Page 67
Figure 26: Phase I nominal visible transmittance of the electrochromic window (y-axis) versus the exterior vertical illuminance (klux). As the outdoor illuminance increased, the daylight mode of the automatic controls
decreased the tint level of the electrochromic window.

A Pilot Demonstration of Electrochromic and Thermochromic Windows in the Denver Federal Center, Building 41, Denver, Colorado Page 68
Figure 27: Phase I electrochromic switching pattern on a warm, sunny day (October 7, 2011) where the outdoor air temperature was above and below the threshold range over the course of day. The HVAC control mode, indicated by the dark blue line in the top graph, is in effect when the tint command value is 125. When
the value is 175, the daylight control mode is in effect (largely between 12:00 and 14:30).

A Pilot Demonstration of Electrochromic and Thermochromic Windows in the Denver Federal Center, Building 41, Denver, Colorado Page 69
Figure 28: Phase I electrochromic switching pattern on a cold, sunny winter day (November 16, 2011) where the outdoor air temperature was below the threshold range over the entire day. The HVAC control mode,
indicated by the dark blue line in the top graph, is in effect when the tint command value is 125.
Figure 28 (November 16, 2011) shows how the HVAC heating mode was in effect for the entire winter day
with outdoor air temperatures less than 15°C all day. During this clear sunny day, the electrochromic
window was in the fully clear state throughout the afternoon when the sun was in the plane of the window
and low in the sky. This may have caused visual discomfort. Peak exterior irradiance levels occurred in the
afternoon at 14:30, with transmitted solar irradiance reaching levels of 350-400 W/m2.
To more thoroughly evaluate the HVAC control mode, we determined the amount of time that the outdoor
air temperature was within a specific temperature range (bars shown in 1°C increments in Figure 29) and
then the percentage of that time that the control system was in the HVAC mode (line on the graph). For this
calculation, we used the outdoor air temperature data from the HVAC control system, which was recorded
in 15-minute time steps, so, in the figure, the bin count represents the number of 15-minute time steps.
The control system should be in the HVAC heating mode for outdoor air temperatures less than 59°F (15°C).
We see for temperatures less than about 52-59°F (11-15°C) that the system was in the HVAC heating mode
for 100% of the time as intended. There is also a sharp decrease in the percentage of time at 59°F (15°C),

A Pilot Demonstration of Electrochromic and Thermochromic Windows in the Denver Federal Center, Building 41, Denver, Colorado Page 70
indicating that the control system was working within the deadband allotted. With these data, we concluded
that the lower bound threshold trigger for HVAC control was working as intended over the course of the
three-month period from September to December 2011. The bars on the graph show the total number of
15-minute intervals that the outdoor air temperature was within a specific 1.8°F (1°C) temperature range.
Note that the system was never in the HVAC cooling mode since outdoor air temperatures were never
greater than the 89°F (31.7°C) threshold.
It is interesting to note that for the majority of this winter monitored period, the electrochromic windows
were in the HVAC heating mode and, therefore, set to the fully clear state.
Figure 29: The amount of time that the outdoor air temperature was within a specific temperature range (bars shown in 1°C increments, left y-axis) and the percentage of that time that the Phase I control system was in
the HVAC mode (line on the graph, right y-axis).
ELECTROCHROMIC SWITCHING CHARACTERISTICS – PHASE II
In Phase II, the control system was modified to take scheduled occupancy into account and to rely on the
HVAC damper position, instead of outside air temperature, to determine heating and cooling status of the
HVAC system. LBNL worked with the manufacturer to commission and fine-tune the system. There were a
few remaining control issues but these caused little disruption to the occupants since they occurred during
unoccupied hours. Occupants had the option to override the automatic system with manually-operated
switches. These switches were used regularly by the occupants.
Figure 30 (April 25, 2012) shows operations on a typical occupied work day. Tint level, as indicated by Tvis'
on the graph, varied throughout the day in response to occupancy, light levels, HVAC mode, and user

A Pilot Demonstration of Electrochromic and Thermochromic Windows in the Denver Federal Center, Building 41, Denver, Colorado Page 71
override (note, all control signals are not shown on the graph). The windows admitted solar heat gains in the
morning due to cool outdoor temperatures, then blocked solar heat gains in the afternoon as outdoor
temperatures rose to 95°F (35°C). For the unoccupied period at the beginning of the day (0:00-7:00 MST/
6:00 Daylight Savings Time (DST)), the windows were fully clear. Outdoor air temperatures ranged from 50-
59°F (10-15°C) during the hours leading up to sunrise. After scheduled occupancy occurred (7:00 MST/ 6:00
DST), the windows were switched to the daylight mode, resulting in a 20% tint level, which reduced solar
transmittance down to a low level of 10 W/m2. From 8:00 to 10:00, the windows were switched to fully
clear, due to the high heating HVAC mode, perhaps to compensate for reduced solar loads that occurred the
hour before. Transmitted solar radiation increased to about 100 W/m2 (middle graph). Then, for the rest of
the day, the windows were tinted as outdoor temperatures increased up to 95°F (35°C) and the HVAC mode
was cooling. The windows were manually switched to 20% clear between 11:23 and 12:10 and then fully
clear between 16:15 and 18:15, perhaps to increase daylight. The windows remained clear after sunset at
18:00 until midnight (note that Tvis' and Tsol' data are invalid (zero) at night).
This example illustrates the complexity of the HVAC-based control of the electrochromic window system in
this west-facing perimeter zone on days when heating then cooling occurs over the course of the day. It is
also illustrative of the trade-offs between HVAC minimization objectives and the occupants' desire for
daylight, as indicated by the use of the manual override switches. Occupant response is discussed in the
following sections.

A Pilot Demonstration of Electrochromic and Thermochromic Windows in the Denver Federal Center, Building 41, Denver, Colorado Page 72
Figure 30: Phase II electrochromic switching pattern on a cool then hot spring day (April 25, 2012). The HVAC control mode, indicated by the dark blue line in the top graph, is in effect when the tint command value is
125.
ELECTROCHROMIC ANNUAL ENERGY SAVINGS
The following energy performance data were derived from the EnergyPlus simulations, assuming the Phase
II control algorithm (results are summarized in Table 8 and Figures 20-21). These results are given for the
west- facing modeled zone to a depth of 48 ft. from the windows (see Section IV-C for description and image
of the modeled zone).
Reference case A – existing single-pane clear windows with wood frames:
The single-pane clear glass window had a whole window SHGC of 0.59 and U-value of 4.55 W/m2K. The
electrochromic double-pane window had a lower SHGC range of 0.13-0.43 and greater insulating
properties than the clear glass window.
The electrochromic window decreased window heat gains and heat losses by 75% and 52%, respectively.

A Pilot Demonstration of Electrochromic and Thermochromic Windows in the Denver Federal Center, Building 41, Denver, Colorado Page 73
Sensible cooling energy use decreased by 45% and sensible heating energy use increased by 3%. This is
the energy needed to simply offset thermal loads to maintain the setpoint temperature in the perimeter
zone, irrespective of type of HVAC system.
Annual HVAC electricity use due to cooling equipment (e.g., chiller, fans, and pumps) decreased 22%,
from 2.48 to 1.95 kWh/ft2-yr.
Annual boiler gas consumption for heating decreased 19%, from 34.34 to 27.76 kBtu/ft2-yr.
Peak cooling load decreased 45%, from 7.05 W/ft2 to 3.87 W/ft2.
Chiller and cooling tower capacity decreased 20%, from 50.11 tons to 40.32 tons.
Reference case B – double-pane low-e windows with thermally broken aluminum frames:
The double-pane low-e window had a SHGC of 0.30 and U-value of 2.75 W/m2K.
The electrochromic window decreased window heat gains by 46% and increased heat losses by 10%
compared to the low-e window.
Sensible cooling energy use decreased by 23% and sensible heating energy use increased by 21%.
Annual HVAC electricity use due to cooling equipment decreased 9%, from 2.14 to 1.95 kWh/ft2-yr.
Annual boiler gas consumption decreased 2%, from 28.20 to 27.76 kBtu/ft2-yr.
Peak cooling load decreased 17%, from 4.66 W/ft2 to 3.87 W/ft2.
Chiller and cooling tower capacity decreased 7%, from 43.34 tons to 40.32 tons.
Note that the impacts on daylight availability and lighting energy use were not evaluated. Depending on the
control algorithm, lighting energy use could be increased or decreased compared to a base case window
with a manually-operated interior shade. Energy use reductions are also contextually dependent. The data
given above are for the Denver site, where window area was moderate. For larger-area windows in
perimeter zones with dimmable lighting in a hotter climate zone, energy savings are expected to be greater,
assuming a more optimal control algorithm.
ELECTROCHROMIC ECONOMICS
RS Means provides cost data for the building industry, where the costs are given for the general Midwest.
These costs represent a median value across the country. In the table below, the low-e materials and
installation costs were derived from Means, while the electrochromic window cost breakdown was based on
costs provided by the manufacturer. The manufacturer estimated a mature market, large volume
incremental cost of $37/ft2 for the electrochromic glazing, high quality framing, controls, installation,
equipment, project management, and 25% markup. All costs are given as final cost to the end user (Table
15).
An economic analysis was performed where utility cost was assumed to be $0.20/kWh, assuming an
equivalent time-of-use rates schedule, $0.83/therm, 6% discount rate, and technology life time of 30 years.

A Pilot Demonstration of Electrochromic and Thermochromic Windows in the Denver Federal Center, Building 41, Denver, Colorado Page 74
Table 15: Estimated Costs for Installed Windows
Material ($/ft2) Labor ($/ft2) Total ($/ft2)
Low-e IGU 15 9 24
Low-e IGU + frame 19 23 42
EC IGU 49 12 61
EC IGU + frame 53 26 79
Note: Includes all markups.
As a basis for reference, in the case of replacing the existing single-pane windows (A) with new low-e
windows (C), the cost of $42/ft2 was used. The economics for this scenario are:
Simple payback for the low-e windows is 21.5 years.
The net present value (NPV) including the initial investment is $26.89/ft2, with a net profit of -$15.11/ft2.
The cost of conserved energy is $0.31/kWh.
The internal rate of return (IRR) is 2%.
In the case of replacing the existing single-pane windows with new electrochromic windows, the cost of
$79/ft2 was used. The economics for this scenario are:
Simple payback for the electrochromic windows is 32.7 years.
The NPV including the initial investment is $33.25/ft2, with a net profit of -$45.75/ft2. The cost of
conserved energy is $0.48/kWh.
The IRR is -1%.
Notice that, in this example, replacing the windows with an electrochromic window instead of a low-e
window results in an increased payback of 11.2 years and an IRR of -1%. In the case of replacing the existing
low-e windows with a new electrochromic insulating glass unit while retaining the existing framing, the cost
of $61/ft2 cost was used. The economics for this scenario are:
Simple payback for the electrochromic windows is 54 years.
The NPV including the initial investment is $9.37/ft2, with a net profit of -$27.63/ft2. The cost of
conserved energy is $0.79/kWh.
The IRR is -3%.
Note that these savings are given for a specific application where the window area was moderate (window-
to- exterior-wall area ratio (WWR) was 0.27). Energy savings due to electrochromic windows would be
greater with larger windows, greater solar exposure (particularly in hotter climates), if the automated
control algorithm was designed to minimize lighting energy use through daylighting as well as HVAC energy
use, and if the capital cost for downsizing HVAC capacity was included for retrofit or new construction
projects that are considering improvements to the HVAC system. The value of increased access to outdoor

A Pilot Demonstration of Electrochromic and Thermochromic Windows in the Denver Federal Center, Building 41, Denver, Colorado Page 75
views was also not included. Economic payback is highly dependent on context. In other, more optimal
applications, the economics would be more favorable.
OCCUPANT RESPONSE TO THE ELECTROCHROMIC WINDOWS
A PHASE I SURVEY
The Phase I survey was issued to occupants in January 2012 after the occupants had experienced the effects
of the electrochromic windows from mid-June 2011 to the time they filled out the survey. For each
occupant, we computed the difference in response regarding impressions before and after the switchable
glazing was installed, where for the "after" case, occupants were asked to consider only the period when the
electrochromic windows were fully commissioned, from September 15, 2011, to the time they filled out the
survey. Before the electrochromic windows were installed, the occupants had double-hung wood windows
with single pane clear glass, a manually operated interior fabric roller shade, and, on some windows, a
manually operated fabric exterior roller shade. All the occupants in the electrochromic area worked in 51-
inch high partitioned private cubicles, which started about 8 ft. from the window.
Characteristics of the respondents in the electrochromic area are given in Appendix F. There were 19
respondents (out of the 35 occupants working in the electrochromic area). All six occupants working in the
first row of workstations nearest the windows responded to the survey. For each occupant, we computed
the difference in response regarding impressions before and after the switchable glazing was installed.
Questions in Table 10 were analyzed. Descriptive statistics are shown in Table 16. Statistical significance was
determined using a paired t-test, which is appropriate for determining if there is a real (i.e., not due to
chance) difference between two observations of the same subjects.
Table 16: Statistics of occupant change in response
Average response
Average change
Standard deviation p-value
Question Before After
Electrochromics n = 19
Temperature during warm/hot weather 2.81 2.75 -0.06 0.77 0.75
Temperature during cool/cold weather 2.75 2.88 0.13 0.34 0.16
Light level 2.81 2.06 -0.75 1.18 0.02
Level of glare 2.63 2.50 -0.13 1.02 0.63
Bright light on my task made it difficult to read or see
1.88 1.87 -0.07 0.59 0.67
There was enough daylight in the space 3.63 2.60 -1.13 1.60 0.02
The windows looked aesthetically pleasing 3.13 2.93 -0.20 1.74 0.66
The windows allowed too much outside noise into the space
1.63 1.27 -0.33 0.62 0.06

A Pilot Demonstration of Electrochromic and Thermochromic Windows in the Denver Federal Center, Building 41, Denver, Colorado Page 76
If p-value ≤ 0.05, then the result is statistically significant (at the 95% level or greater). Underlined, boldface
p-values are within the range of statistical significance. Posed questions are given in Table 10.
Findings from the Phase I survey were as follows:
Regarding light levels, occupants perceived the space as darker than before, a result that was
statistically significant at the 98% level. The average response decreased from 3.13, where 3 is
"somewhat agree that there was enough daylight in the space" to 2.60, an average change of -1.13.
There was no statistically significant difference in the change in average occupant response for glare or
aesthetic impressions.
There was a small decrease in perception of noise coming in through the windows, close to the 95%
level of statistical significance (p-value was 0.06).
Occupants were asked whether the space would be more visually comfortable if the shades on the
windows were made operable. The largest group of responses was "yes" (7 out of the 19 respondents,
Table 12).
Occupants were asked whether the space would be more visually comfortable if the tinting/untinting of
the windows was operated manually instead of automatically. The largest group of responses was "it
would not make any difference" (Table 12).
When open-ended comments were solicited, occupants wrote about several issues, which are
summarized in Table 13. The most mentioned issue was that the windows give misleading impressions
of the outdoor environment (five mentions), mostly because the windows gave the impression that it
was very overcast or dark outside even when it was sunny ("it almost looked like night"; "I thought it
was going to rain or snow and it was just the windows"). Glare was also frequently mentioned (4), as
well as gloominess (4), and the need for operable shading (3). Unsatisfactory appearance, tinting at odd
times, uneven tinting, and space gets too hot, were all mentioned by one occupant each.
Additional comments were made about how the windows changed occupants' perceptions of outdoor
weather patterns. In a separate study [18], occupants said that the windows made it look like it was
cloudy outside in the middle of the day, regardless of the conditions outside; that it always looks like it is
cloudy, raining or dusk, making it hard to enjoy the sunshine outside; and that it looks gloomy outside,
making occupants depressed every afternoon.
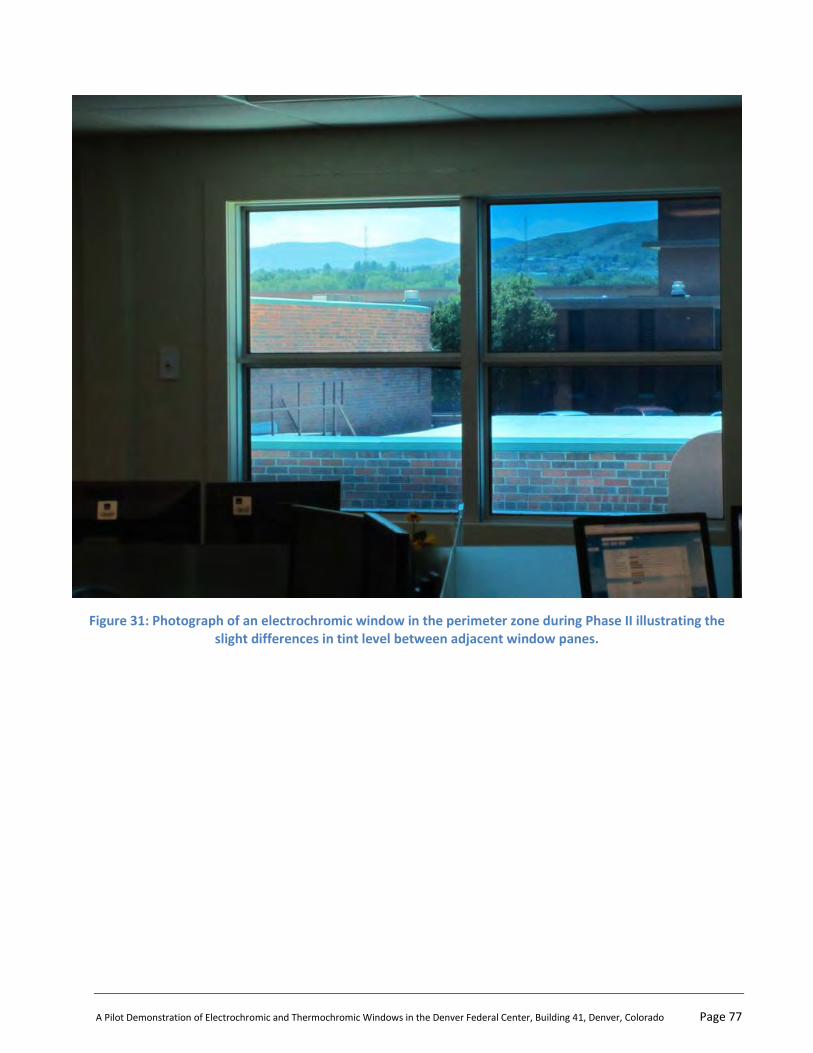
A Pilot Demonstration of Electrochromic and Thermochromic Windows in the Denver Federal Center, Building 41, Denver, Colorado Page 77
Figure 31: Photograph of an electrochromic window in the perimeter zone during Phase II illustrating the slight differences in tint level between adjacent window panes.

A Pilot Demonstration of Electrochromic and Thermochromic Windows in the Denver Federal Center, Building 41, Denver, Colorado Page 78
Figure 32: Photograph of the electrochromic window a few minutes after starting to switch. We were unable to obtain images of the windows switching at the Denver Federal Center, but images taken at the National
Renewable Energy Laboratory's Research Support Facility [20] illustrate the variation in coloration while switching.
When the electrochromic windows were switched to the tinted mode, the glazing visible transmittance
ranged from 0.21 to as low as 0.02. The window area was also moderate and the high partitions obstructed
incoming daylight. When tinted, all windows in the area were switched to the same tinted mode and there
was no other source of daylight in the area. In the two example days given for September and October
(Figures 26 and 27), the electrochromic windows were switched to tinted from about 9:00 AM to 4:00 PM
MST when the daylight mode was in effect. During the winter period, the windows were maintained at a
clear state throughout the day when the HVAC mode was in effect, as shown in the example day in
November (Figure 28). In a prior study [13], occupants were able to switch the upper and lower panes of a
window separately, and occupants tended to switch at least one of the upper panes to clear to increase
room brightness.

A Pilot Demonstration of Electrochromic and Thermochromic Windows in the Denver Federal Center, Building 41, Denver, Colorado Page 79
B PHASE II SURVEY
The Phase II survey was issued to occupants in June 2012 after the occupants had experienced the effects of
the Phase II electrochromic windows from mid-February 2012 to the time they filled out the survey. For
each occupant, we computed the difference in response regarding impressions before and after installation
of the manual override controls. Some of the occupants working in the electrochromic area now worked in
low partitioned workstations adjacent to the electrochromic windows. There were a total of 8 responses
from the 36 occupants in the electrochromic area. Six of the respondents were in the workstations next to
the windows.
We compared average occupant responses from the Phase I questions to the average responses from Phase
II. Results are shown on Table 17. Statistical significance was determined using unpaired t-tests, both for
equal and unequal variance, since we could not be sure that the assumption held true that the January and
June populations had the same variance. The unpaired t-test is appropriate for determining if there is a real
difference (i.e., not due to chance) between the average response of two sets of different subjects.
The only statistically significant change was an increase in perceived sufficiency of daylight levels in the
space (average value before manual controls was 2.60, then increased to 4.13 with manual controls). Since
this increase could be simply due to an increase in available daylight, given the difference in time of year
between the first and second surveys, a similar analysis was done for the low-e window reference zone.
Results are shown in Table 18, and, although they show a smaller increase in perceived sufficiency of
daylight levels, the increased perception is not statistically significant. Therefore, the Phase II electrochromic
control system (automated + manual override switches) was likely the cause of the increased perception
that there was enough daylight in the space.
Table 17: Average occupant response in the zone with electrochromic windows for Phases I and II, before and after installation of manual controls
Phase I – Before Phase II – After p-value
Question Average response
Standard deviation
Average response
Standard deviation
Equal variance
Unequal variance
Temperature during warm/hot weather 2.75 0.86 3.13 1.55 0.45 0.54
Temperature during cool/cold weather 2.88 0.96 3.00 1.29 0.80 0.82
Light level 2.06 1.06 3.00 1.20 0.06 0.08
Level of glare 2.50 1.03 2.38 1.41 0.81 0.83
Bright light on my task made it difficult to read or see
1.87 1.25 2.75 1.58 0.15 0.20
There was enough daylight in the space 2.60 1.50 4.13 0.83 0.02 0.01
The windows looked aesthetically pleasing
2.93 1.39 3.25 1.28 0.60 0.59
The windows allowed too much outside noise into the space
1.27 0.59 1.13 0.35 0.54 0.48
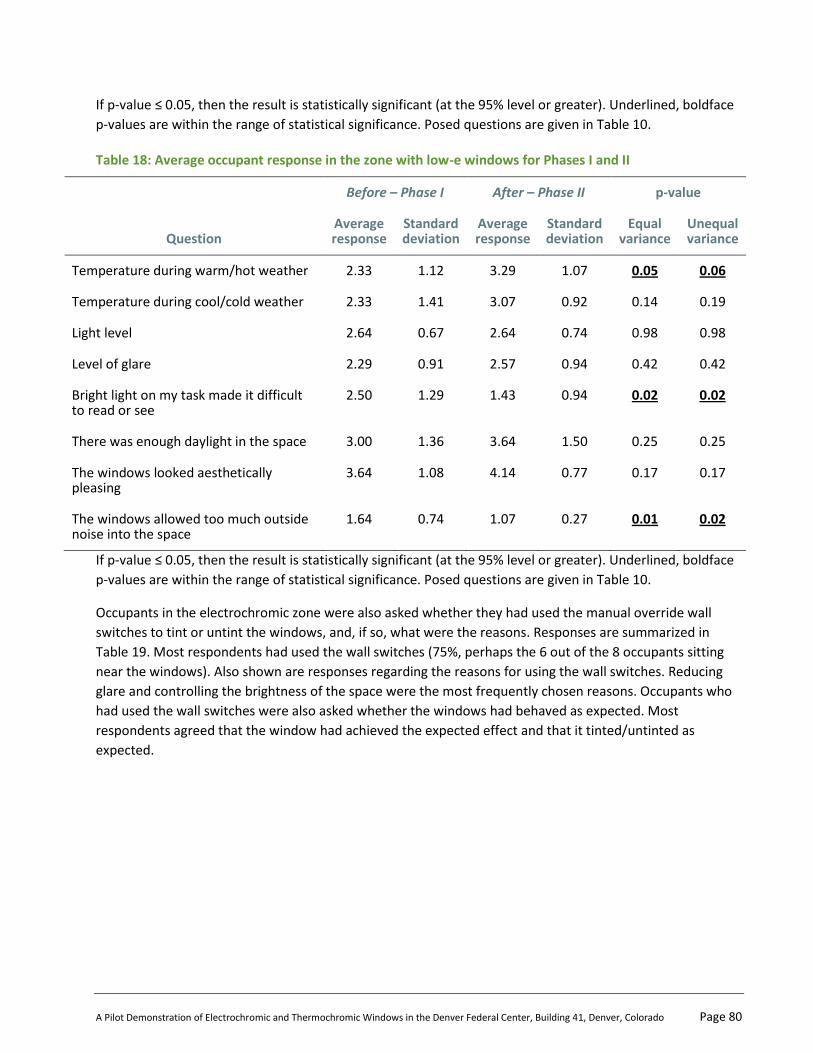
A Pilot Demonstration of Electrochromic and Thermochromic Windows in the Denver Federal Center, Building 41, Denver, Colorado Page 80
If p-value ≤ 0.05, then the result is statistically significant (at the 95% level or greater). Underlined, boldface
p-values are within the range of statistical significance. Posed questions are given in Table 10.
Table 18: Average occupant response in the zone with low-e windows for Phases I and II
Before – Phase I After – Phase II p-value
Question Average response
Standard deviation
Average response
Standard deviation
Equal variance
Unequal variance
Temperature during warm/hot weather 2.33 1.12 3.29 1.07 0.05 0.06
Temperature during cool/cold weather 2.33 1.41 3.07 0.92 0.14 0.19
Light level 2.64 0.67 2.64 0.74 0.98 0.98
Level of glare 2.29 0.91 2.57 0.94 0.42 0.42
Bright light on my task made it difficult to read or see
2.50 1.29 1.43 0.94 0.02 0.02
There was enough daylight in the space 3.00 1.36 3.64 1.50 0.25 0.25
The windows looked aesthetically pleasing
3.64 1.08 4.14 0.77 0.17 0.17
The windows allowed too much outside noise into the space
1.64 0.74 1.07 0.27 0.01 0.02
If p-value ≤ 0.05, then the result is statistically significant (at the 95% level or greater). Underlined, boldface
p-values are within the range of statistical significance. Posed questions are given in Table 10.
Occupants in the electrochromic zone were also asked whether they had used the manual override wall
switches to tint or untint the windows, and, if so, what were the reasons. Responses are summarized in
Table 19. Most respondents had used the wall switches (75%, perhaps the 6 out of the 8 occupants sitting
near the windows). Also shown are responses regarding the reasons for using the wall switches. Reducing
glare and controlling the brightness of the space were the most frequently chosen reasons. Occupants who
had used the wall switches were also asked whether the windows had behaved as expected. Most
respondents agreed that the window had achieved the expected effect and that it tinted/untinted as
expected.

A Pilot Demonstration of Electrochromic and Thermochromic Windows in the Denver Federal Center, Building 41, Denver, Colorado Page 81
Table 19: Questions regarding use of manual electrochromic controls
Did you use the wall switches to tint or untint the windows? (n = 8)
Yes 75%
No 25%
When you used the wall switches, what was the reason (please check all that apply)? (n = 6)
To reduce glare from daylight/sunlight 3
To reduce glare when the sun is directly visible 3
To increase the overall brightness of the space 3
To reduce the overall brightness of the space 2
To get a better view 1
To reduce the heat from the sun 1
To decrease the level of visual stimulus from the outside 1
Other (please specify) 1
To increase visual privacy 0
To reduce cold draft from the window 0
When you used the wall switches, did the window succeed in achieving the effects you indicated? (n = 6)
Yes 83%
No 17%
When you used the wall switches, did the window tint/untint as expected? (n = 6)
Yes 83%
No 17%
As for being able to manually control window tint, before installation, it appears most occupants didn't have
a negative view, but didn't necessarily view it positively either. Once installed, however, the majority of the
respondents in the electrochromic zone used the controls and with mostly satisfactory results. Table 19
shows that the controls were used to increase light levels in the space but also decrease glare, so it is
possible that the availability of manual control is related to the observed overall increase in perceived
daylight level in the electrochromic zone. Another possible cause of this change in perception could be the
change in furniture arrangements between Phases I and II.

A Pilot Demonstration of Electrochromic and Thermochromic Windows in the Denver Federal Center, Building 41, Denver, Colorado Page 82
The number of manual overrides were tallied for the period from February 12 to June 30, 2012 (Table 20).
One window group was overridden frequently, about 40% of all work days, while the others were
overridden significantly less: 3-7% of all work days.
Table 20: Number and Duration of Time when Occupants Manually Overrode the Automatic Control System
Window group 1 2 3 4
# of overrides 497 94 42 114
Total override duration (hours) 349.5 62.7 24.1 62.9
Total override duration (% of total hours) 39% 7% 3% 7%
Avg override duration (hours) 0.70 0.67 0.57 0.55
Avg daily # of overrides 5.0 0.9 0.4 1.2
Avg daily override duration (hours) 3.53 0.63 0.24 0.64
*Assuming 9-hour work days only for the period of February 12 to June 30, 2012.
DURABILITY
The durability of electrochromic windows has been evaluated by NREL, where the results of the test are
released as confidential information to the manufacturer [21]. The electrochromic window has been found
by NREL to meet the requirements of the ASTM Standard E2141-02, where the electrochromic was
successfully cycled over 54,000 times between its maximum visible (photopic) transmittance and one-fourth
(1:4) of the maximum transmittance state without significant degradation (<2%) while irradiated with a
minimum of a 1.0 UV-sun equivalent (of an AM 1.5 global solar spectrum) and an elevated temperature of
85°C. The Denver installation cycles the electrochromic window between its maximum visible transmittance
and one-thirtieth (1:30) of the maximum transmittance state. NREL will be working with industry to increase
the stringency of the cycling tests in the future. For reference, an electrochromic window switched once per
day would be cycled a total of 11,000 times over 30 years.

A Pilot Demonstration of Electrochromic and Thermochromic Windows in the Denver Federal Center, Building 41, Denver, Colorado Page 83
VI. Summary Findings and Conclusions
A. OVERALL TECHNOLOGY ASSESSMENT
This pilot study was designed to enable GSA to explore and evaluate the various practical aspects of post-
occupancy performance associated with the thermochromic and electrochromic technologies, both of which
are estimated to be at the late R&D stage/level of technology readiness (cost reduction and performance
improvement stage).
GSA personnel in Region 8 were able to witness and experience the two technologies directly, understand
how the windows switch, and observe the impacts the technologies had on the quality and comfort of the
indoor environment while conducting critical computer-based tasks. Since dynamic windows must trade-off
solar control (tint) versus daylighting (untint) on a real-time basis, the GSA project team was able to provide
feedback on whether the balance between trade-offs was achieved at an acceptable level, even though their
stated primary objective was to minimize HVAC energy use. Findings were as follows:
For both technologies, the windows operated as intended and yielded significant reductions in HVAC
energy use compared to the existing single-pane clear glazed windows.
The energy savings achieved in this project were illustrative of the potential of chromogenic windows to
reduce HVAC, energy use when west-facing windows of moderate size (window-to-wall ratio of 0.27) are
used in a 1940s commercial office building in a hot/cold climate such as Denver, Colorado.
o For the thermochromic (TC) windows:
The thermochromic windows installed in the Denver Federal Center (type B-TC)
yielded about the same reductions in HVAC energy use as the reference low-e
windows compared to the existing single-pane clear glass windows.
If the solar control range of the thermochromic window was lowered with the
addition of a very low emittance coating (type C-TC), then annual HVAC electricity
use due to cooling equipment (e.g., chiller, fans, and pumps) decreased 22%, from
2.48 to 1.93 kWh/ft2-yr, compared to the existing single-pane clear glass windows,
or 8% lower than the low-e window.
Peak cooling load decreased 47% with the C-TC window, from 7.05 W/ft2 to 3.71
W/ft2, which, in turn, could enable downsizing of HVAC cooling equipment (chiller
and cooling tower) by 21%, from 50.1 tons to 39.8 tons, if such a renovation was
under consideration.
Annual boiler gas consumption for heating by the C-TC window decreased 17%,
from 34.34 to 27.28 kBtu/ft2-yr.
If the existing single-pane clear glass windows were replaced with low-e windows
then the payback would be 21.5 years based on energy savings alone. Assuming an
added cost of $16/ft2–glass for the thermochromic film over the low-e window in a
mature market with a large volume application, the C-TC thermochromic would
reduce the simple payback by 0.5 years to 21 years, and the internal rate of return

A Pilot Demonstration of Electrochromic and Thermochromic Windows in the Denver Federal Center, Building 41, Denver, Colorado Page 84
would be the same as the low-e window, or 2%, assuming a 30-year life, 6%
discount rate, and utility costs of $0.20/kWh and $0.83/therm.
The performance impacts on lighting energy use were not included in this analysis.
To counteract the reduction in daylight due to the lower visible transmittance range
of the type C-TC thermochromic window (Tvis=0.21-0.03), the upper clerestory
portion of the window could be used for daylighting by installing high-transmittance
low-e glass instead of thermochromic glass. This would lower lighting energy use
but raise HVAC energy use. Alternatively, daylight could be admitted from other
windows or skylights that have less exposure to sun (e.g., north-facing windows).
o For the electrochromic windows:
Annual HVAC electricity use due to cooling equipment (e.g., chiller, fans, and
pumps) decreased 22%, from 2.48 to 1.95 kWh/ft2-yr, compared to the existing
single-pane clear glass windows.
Peak cooling load decreased 45%, from 7.05 W/ft2 to 3.87 W/ft2 , which, in turn,
would enable downsizing of HVAC cooling equipment (chiller and cooling tower) by
20%, from 50.1 tons to 40.3 tons, if such a renovation was under consideration.
Annual boiler gas consumption for heating decreased 19%, from 34.34 to 27.76
kBtu/ft2- yr.
If the existing single-pane clear glass windows were replaced with low-e windows,
then the payback would be 21.5 years based on energy savings alone. Assuming an
added cost of $37/ft2–glass for the electrochromic window and controls over the
low-e window in a mature market with a large volume application, the simple
payback would be increased by 11.2 years to 32.7 years, and the internal rate of
return would be -1%, assuming a 30-year life, 6% discount rate, and utility costs of
$0.20/kWh and $0.83/therm.
Since lighting controls were not installed in this building, the performance impacts
on lighting energy use were not included in this analysis. The electrochromic
windows have a visible transmittance range of Tvis=0.01-0.50 and, therefore, have
the potential to daylight the perimeter zone, depending on how the windows are
controlled.
The quality of the indoor environment produced by the two types of switchable windows was perceived
as statistically comparable to that provided by the existing windows. Anecdotal comments and use of
the manual override switches suggested that occupants preferred more daylight, less glare, and greater
connection to the outdoors.
The following conclusions can be drawn on the technology class as a whole:
Switchable thermochromic (TC) windows passively switch based on the temperature of the
thermochromic layer, whether it be a polymer film or a coating on glass. There are various types of
thermochromic materials, each of which differs in color, transparency, switching temperature, and
switching temperature range (narrow over a 2-3°F range or broad, continuous switching over a 30°F

A Pilot Demonstration of Electrochromic and Thermochromic Windows in the Denver Federal Center, Building 41, Denver, Colorado Page 85
range). All of these aspects can be further modified by the combination of the thermochromic layer with
the glass substrate, and low-e coating of the window. The pilot demonstration illustrates how a
particular TC switches and under what combination of outdoor environmental conditions (primarily
incident solar irradiance and outdoor air temperature, assuming an ambient indoor air temperature of
about 72°F). With spectrophotometer data of the various types of TC layer or coatings, GSA can now use
the Window 7 and EnergyPlus simulation tools to evaluate the energy-savings and indoor environmental
conditions that will result from this technology for any building application.
The same can be said for electrochromic (EC) windows. The pilot demonstration illustrated that EC
windows can be controlled manually and by a building automation system, or both, and that the
resultant energy- efficiency performance will be dependent on how the EC windows are controlled.
Window 7 and EnergyPlus simulation tools can be used to determine the optimum control algorithm for
a specific building application.
In the case of both the thermochromic and electrochromic windows, the manufacturer claimed that the
product could be engineered to achieve a more acceptable and energy-efficient balance between
daylight and solar control.
o For the thermochromic window, a lower switching temperature (closer to 72°F), a broader
switching temperature range (20°F), a higher maximum visible transmittance (Tvis-
max=0.60-0.70), and a lower solar transmittance is desired for commercial buildings with
high internal loads, such as offices. This is an area of significant research within the material
science community.
o For the electrochromic window, lower cost windows are needed to shorten the payback and
increase market adoption. Well-conceived and executed control algorithms combined with
good architectural design are needed to produce both an energy-efficient and acceptable
indoor environment.
In both cases, further, more detailed, monitored investigations in occupied buildings are needed to
verify claims and assess occupant response before recommendation for broad deployment across GSA's
buildings portfolio can be made.
BEST PRACTICE
Thermochromic windows offer variable solar control that is likely to result in reduced HVAC energy use,
peak demand, and HVAC chiller capacity in internally load dominated commercial buildings, such as office
buildings, and in buildings where envelope loads drive perimeter zone energy use, such as residential
buildings. These windows are likely to be cost-effective for retrofit applications where the existing windows
have poor solar control, particularly if frame replacement is not needed. The windows may increase lighting
energy use, particularly if windows are small. The manufacturer indicated that future product developments
will likely increase energy-efficiency performance and daylighting performance.
Electrochromic windows enable automated regulation of solar radiation and daylight so that HVAC and
lighting energy use can be minimized. In prior simulation and field studies in test rooms, electrochromic
windows were found to reduce perimeter zone energy use significantly in internally load dominated
commercial buildings, such as office buildings, with large-area windows that had significant solar exposure.
Savings were greater in hotter climates. Savings were also dependent on achieving an adequate balance
A Pilot Demonstration of Electrochromic and Thermochromic Windows in the Denver Federal Center, Building 41, Denver, Colorado Page 86
between minimizing HVAC and lighting energy use while meeting occupant requirements for comfort and an
acceptable indoor environment.
BARRIERS AND ENABLERS TO ADOPTION
Thermochromic windows with a narrow switching temperature range (e.g., 1.8-3.6°F (1-2°C),) such as that
evaluated in this study, exhibit a mottled appearance when switching if there is localized shading or other
outdoor surroundings that cause incident radiation to be non-uniform across the window. Therefore,
aesthetics may be a market barrier. There are other types of thermochromic windows that do not exhibit
this appearance. From the exterior, the windows appear dark when switched, which some architects may
find objectionable since current design trends are to specify clear, transparent glass (Tvis of 0.50 or greater)
for aesthetics and daylighting.
For electrochromic windows, the primary barrier to adoption is cost. Making electrochromic windows work
to minimize energy use and satisfy occupant requirements is also a significant challenge and will require
more time for manufacturers to develop mature market solutions that enable routine, reliable control in a
turnkey fashion. Like the thermochromic windows, the aesthetics of electrochromic windows may be a
barrier for some building applications where it is important to maintain a uniform appearance across the
exterior façade. The owner or facility manager will need to decide whether to permit some areas of the
façade to be controlled differently from other areas (e.g., either automatically due to different setpoints or
algorithms or manually if occupants are permitted to override automatic control). The electrochromic
windows switch from a clear to a very dark tinted appearance from the outdoors, which may be
objectionable to some architects.
Electrochromic windows enable significant reductions in both HVAC and lighting peak electricity loads, if
coupled with daylight responsive lighting controls, and so offer an opportunity to enable use of low-energy
cooling strategies, such as radiant cooling or underfloor air distribution systems, where control of perimeter
zone loads is essential for maintaining thermal comfort. Integration with the HVAC system at the very early
stages of design also enables significant downsizing of HVAC equipment, which can improve the cost-
effectiveness of electrochromic windows.
RECOMMENDATIONS FOR INSTALLATION, COMMISSIONING, TRAINING, AND CHANGE MANAGEMENT
For thermochromic windows, there is no difference in installation practices compared to conventional
windows. Commissioning is not required. Occupants should be informed about how the windows work – this
has been found to increase end user acceptance of innovative technologies. The terms of the expected
lifetime and warranty should be clarified with the manufacturer.
Electrochromic windows will require more care than traditional windows to install, since installation involves
the use of an electrician. For factory-built windows, the electronics and sensors can be installed with the
framed window unit to minimize electrical work at the job site. For curtainwall systems and similar systems
of framing, all wiring details through the framing channel in the windows should be checked prior to
applying the final pressure plates or finishes.
Commissioning of the related electronics and control algorithm associated with electrochromic windows
should be called out in the procurement specifications as a defined task, where each aspect of the control
algorithm is verified (ideally by an independent party) as working in each zone as intended prior to final sign-

A Pilot Demonstration of Electrochromic and Thermochromic Windows in the Denver Federal Center, Building 41, Denver, Colorado Page 87
off and payment on the job. Depending on the design of the control algorithm, commissioning may need to
be done when furniture is in place, especially if sensors are placed to measure interior conditions, such as
daylight level. The control system should be specified with diagnostics capabilities to enable facility
managers to detect, trend, and correct erroneous operations.
Training of facilities personnel will be required so that they understand both the design intent of the
electrochromic window control system and how to adjust settings to address occupant complaints without
significantly undermining the intent of the control system. Occupants should be informed of the intent of
the energy efficiency measures. This has been found in other studies to be a significant contributing factor
to occupant satisfaction with the overall building.
FUTURE WORK
As thermochromic window products emerge on the market, it will be essential to understand how the
technology performs for different building types in different climates. The simulation tools are now
available. Future work should include parametric building energy simulation studies to evaluate the HVAC
and lighting energy use performance and economic viability of thermochromic windows for different
applications. The simulations should evaluate alternative thermochromic window types that are better
suited to the unique demands of the building application (e.g., thermochromics with a lower switching
temperature, higher visible transmittance range (e.g., 0.40-0.60), and lower solar control range). The
properties of these alternative thermochromics should be verified through spectrophotometer
measurements and these data should be used for the simulations. Occupant response studies are also
needed to obtain more conclusive results on end user comfort and satisfaction with the quality of the indoor
environment. The study should include a statistically significant number of occupants (n>30 respondents)
that have more direct exposure to the window, as would occur in open plan areas with low-height partitions
or in private offices, and be conducted over at least a six- month period to capture both winter and summer
conditions.
Although the electrochromic window technology is simple to switch, optimal integration of this technology
within buildings is made complex by the interactions and demands of occupants performing a variety of
tasks, by HVAC and lighting operations, and by variable climatic conditions. More work is needed to
understand these complex interactions and to define simple, robust, reliable, and cost-effective hardware
and software solutions to meet the varying demands over the life of the building. To accelerate market
adoption and instill confidence in this technology, additional third-party monitored demonstrations will be
required to verify energy-efficiency performance and assess end user satisfaction, similar to thermochromic
windows.

A Pilot Demonstration of Electrochromic and Thermochromic Windows in the Denver Federal Center, Building 41, Denver, Colorado Page 88
VII. Appendices
A. REFERENCES
[1] Arasteh, D., S. Selkowitz, J. Apte, Zero Energy Windows, Proceedings of the 2006 ACEEE Summer Study
on Energy Efficiency in Buildings, August 13-18, 2006, Pacific Grove, CA,
http://gaia.lbl.gov/btech/papers/60049.pdf
[2] 2010 Buildings Energy Data Book. U.S. Department of Energy, Building Technologies Program, Energy
Efficiency and Renewable Energy. Tables 1.1.1 and 1.2.3.
[3] Lee, E.S., S. Selkowitz, V. Bazjanac, V. Inkarojrit, C. Kohler. 2002. High-performance commercial
building façades. http://gaia.lbl.gov/btech/papers/50502.pdf
[4] Eleanor S. Lee, Stephen Selkowitz, Glenn Hughes, Robert Clear, Greg Ward, John Mardaljevic, Judy Lai,
Mehlika Inanici, Vorapat Inkarojrit. Daylighting the New York Times Headquarters Building: Final
Report. 2005. Lawrence Berkeley National Laboratory, Berkeley, CA.
http://gaia.lbl.gov/btech/papers/57602.pdf
[5] RavenWindow Product Specifications, Version 1.1, 30 July 2010. Also, U.S. Patent 8,169,685:
http://www.google.com/patents?id=Sg8OAgAAEBAJ&pg=PA3&lpg=PA3&dq=8,169,685&source=bl&ot
s=yx Aw28jRu2&sig=YlMMVbuGtVpbjoLr3MP96WfJBhQ&hl=en&sa=X&ei=LtdIUMXQJM-
30AGcnYHQBA&ved=0CC8Q6AEwAA - v=onepage&q=8,169,685&f=false
[6] Iowa Energy Center Test of Thermochromic Windows (last visited 9/30/12):
http://www.eereblogs.energy.gov/buildingenvelope/file.axd?file=2011%2F2%2FPleotint+Article ther
moc hromic.pdf
[7] Lee, E.S., X. Pang, S. Hoffmann, C.H. Goudey. A. Thanachareonkit. 2012. Empirical results for polymer
thermochromic windows for commercial building applications and some observations on material
science development objectives. Accepted for publication in Solar Energy Materials & Solar Cells,
March 29, 2013.
[8] Demonstration of thermochromic windows in the Research Support Facility, National Renewable
Energy Laboratory. http://www.nrel.gov/sustainable nrel/pdfs/51742.pdf
[9] http://sageglass.com/, visited June 24, 2012.
[10] Clear, R.D., V. Inkarojrit, E.S. Lee. 2006. Subject responses to electrochromic windows. Energy and
Buildings 38(7):758-779. http://gaia.lbl.gov/btech/papers/57125.pdf
[11] Lee, E.S., S.E. Selkowitz, R.D. Clear, D.L. DiBartolomeo, J.H. Klems, L.L. Fernandes, G.J. Ward, V.
Inkarojrit, M. Yazdanian. 2006. Advancement of electrochromic windows: Final report. California
Energy Commission, PIER publication CEC-500-2006-052. LBNL-59821.
http://windows.lbl.gov/comm perf/Electrochromic/ec reso tero.html
[12] NREL Research Support Facility. http://www.commercialwindows.org/case nrel.php

A Pilot Demonstration of Electrochromic and Thermochromic Windows in the Denver Federal Center, Building 41, Denver, Colorado Page 89
[13] Lee, E.S., E.S. Claybaugh, M. LaFrance. 2012. End User Impacts of Automated Electrochromic Windows
in a Pilot Retrofit Application. Energy and Buildings 47 (2012) 267-284.
[14] DOD Environmental Security Technology Certification Program, Low-Cost, High-Energy-Saving Dynamic
Windows. http://www.serdp.org/Program-Areas/Energy-and-Water/Energy/Conservation-and-
Efficiency/EW-201252/EW-201252
[15] Mitchell, R., C. Kohler, J. Klems, M. Rubin, D. Arasteh. 2008. Window 6.2/ Therm 6.2 Research version
user manual. http://windows.lbl.gov/software/window/6/WINDOW6.2-THERM6.2ResearchDoc.pdf
[16] Winkelmann, F.C., Modeling Windows in EnergyPlus, Proc. Building Simulation 2001, IBPSA, Rio de
Janeiro, September 2001.
[17] RS Means 2012, Published by Reed Construction Data.
[18] Comparative analysis of window performance: Denver Federal Center, October 28, 2011. Prepared by
SCS Engineers, Commerce City, CO for GSA Region 8.
[19] National Renewable Energy Laboratory, confidential letter can be obtained directly from Ravenbrick,
July 2012.
[20] http://evstudio.com/controlling-western-sun-glare-with-electrochromic-windows-at-nrel/, visited
September 15, 2012.
[21] National Renewable Energy Laboratory, confidential letter can be obtained directly from Sage
Electrochromics, December 17, 2004.
[22] Griffith, B., D. Türler, H. Goudey. Infrared Thermography Systems, and article in The Encyclopedia of
Imaging Science and Technology, Joseph P. Hornak, Editor. John Wiley and Sons. 2000
[23] Griffith, B., H. Goudey, D. Arasteh. Infrared Thermography Measurements of Window Thermal Test
Specimen: Surface Temperatures. ASHRAE Symposium Transactions. 2001
[24] FLIR SC660 IR Camera Data Sheet.
http://www.flir.com/uploadedFiles/Thermography APAC/Products/Product Literture/FLIR SC660
Infrared Camera Datasheet au.pdf

A Pilot Demonstration of Electrochromic and Thermochromic Windows in the Denver Federal Center, Building 41, Denver, Colorado Page 90
B. GLOSSARY
Infrared radiation (IR)
Infrared electromagnetic radiation with wavelengths greater than 0.7 microns. Short- wave infrared radiation is from 770-2500 nm (0.77-2.5 microns). Long-wave infrared is defined by wavelengths greater than or equal to 2.6 microns.
Low-e (low-emittance) coating
A thin (<100 nm) metal, metal oxide, or multilayer coating deposited on glass to reduce its thermal infrared emittance and radiative heat transfer.
Nominal visible transmittance (Tvis')
Monitored visible transmittance at the window in the field test as expressed as the ratio of the vertical illuminance transmitted through the window at the indoor face of the glass divided by the incident vertical illuminance at the outdoor face of the glass. It is expressed as a number between 0 and 1.
Nominal solar transmittance (Tsol')
Monitored solar transmittance at the window in the field test as expressed as the ratio of the solar irradiance transmitted through the window at the indoor face of the glass divided by the incident solar irradiance at the outdoor face of the glass. It is expressed as a number between 0 and 1.
Solar heat gain coefficient (SHGC)
The fraction of solar radiation admitted through a window including both directly transmitted and absorbed radiation that is released inward to the building. The SHGC has replaced the shading coefficient (SC) as the standard indicator of solar control. It is expressed as a number between 0 and 1. The lower the value, the less solar heat the window transmits.
Solar transmittance (Tsol)
The fraction of solar radiation transmitted by the glazing system between the limits of 300 to 2500 nanometers at normal incidence. It is expressed as a number between 0 and 1.
U-value The heat transmission per unit time through a unit area of material or construction (including the boundary air films on the surface of the material) induced by a unit temperature difference between the environments on each side of the material. The lower the U-value, the greater the insulating value or the window's resistance to heat flow. Also known as the U-factor.
Window-to-wall ratio (WWR)
The ratio of the total area of the windows (glass area plus frame) divided by the total area of the floor-to-floor exterior wall.
Visible transmittance (Tvis)
The fraction of solar radiation transmitted by the glazing system between the limits of 380 to 770 nanometers at normal incidence. It is weighted according to the photopic response of the human eye and is expressed as a number between 0 and 1.

A Pilot Demonstration of Electrochromic and Thermochromic Windows in the Denver Federal Center, Building 41, Denver, Colorado Page 91
C. APPENDIX A: FLOOR PLANS SHOWING FURNITURE LAYOUTS FOR PHASES I AND II
Figure A-1. Floor plan view of the west perimeter zone for Phase I.
Figure A-2. Floor plan view of the west perimeter zone for Phase I.

A Pilot Demonstration of Electrochromic and Thermochromic Windows in the Denver Federal Center, Building 41, Denver, Colorado Page 92
Figure A-3. Enlarged view of the thermochromic area for Phase I (top) and Phase II (bottom).

A Pilot Demonstration of Electrochromic and Thermochromic Windows in the Denver Federal Center, Building 41, Denver, Colorado Page 93
Figure A-4. Enlarged view of the electrochromic area for Phase I (top) and Phase II (bottom).

A Pilot Demonstration of Electrochromic and Thermochromic Windows in the Denver Federal Center, Building 41, Denver, Colorado Page 94
Figure A-5. Enlarged view of the electrochromic area for Phase I (top) and Phase II (bottom).

A Pilot Demonstration of Electrochromic and Thermochromic Windows in the Denver Federal Center, Building 41, Denver, Colorado Page 95
D. APPENDIX B: SPECTRAL MEASUREMENTS OF THE THERMOCHROMIC WINDOWS
At LBNL, measurements of glazing solar spectral transmittance and reflectance are typically taken using a
spectrophotometer (Perkin Elmer Lambda 950) at room temperature. Spectral data for the four states of the
electrochromic window were provided by the manufacturer using this instrument.
Because thermochromic glazings switch based on temperature, an alternative measurement procedure was
developed so that the samples could be measured at elevated temperatures. A framing structure
incorporating a heating element was built to hold the glazing sample at the edges (Figure B-1). The sample
was heated and allowed to equilibrate over a 30-min period, then the entire assembly was inserted into the
spectrophotometer and measured at 5 nm increments over the 0-2500 nm range, with each incremental
measurement taking approximately 5 min. The surface temperature of the thermochromic filter was
simultaneously measured at four locations across the sample to verify that the sample temperature was
stable over the period of the measurement. The thermistor located in the center of the glazing sample was
used to define the surface temperature for the spectral measurement.
Figure B-1: Thermochromic sample heated at edges.

A Pilot Demonstration of Electrochromic and Thermochromic Windows in the Denver Federal Center, Building 41, Denver, Colorado Page 96
E. APPENDIX C: ACCURACY OF SOLAR IRRADIANCE MEASUREMENTS
There are a few qualifiers on the measurements used to characterize the switching status of the
thermochromic and electrochromic windows. While the sensors used were of high quality, the following
impacts are practical outcomes of conducting measurements in occupied buildings where minimal intrusion
is desired. The accuracy of the indoor solar irradiance measurements will be affected by the spectral
response of the switchable windows. Since both the thermochromic and electrochromic windows switch
predominantly in the visible range of the solar spectrum, this effect is expected to be small.
For both indoor irradiance and illuminance measurements, the full 180° field of view of the sensor will be
blocked by the edges of the window. The sensors were placed as far away from the edge of the window to
minimize this effect while adhering to the wishes of GSA to have the sensors be minimally intrusive. The
sensors were cosine corrected up to a ±80° angle of incidence.
For the interior readings, upper and lower sensors were positioned 0.28 m away from the edge of the
window. While electrochromic windows switch faster closer to the bus bars, readings are likely to be
indicative of the tint level within a few percent since this effect is minor.
A Pilot Demonstration of Electrochromic and Thermochromic Windows in the Denver Federal Center, Building 41, Denver, Colorado Page 97
F. APPENDIX D: CALIBRATION AND ACCURACY OF INFRARED THERMOGRAPHY MEASUREMENTS
Infrared (IR) thermography is used for the study of heat transfer through windows and, at LBNL, we have
focused on measurements in a controlled laboratory environment to enable accurate quantitative surface
temperature results [22, 23]. Some of these techniques were included in the field thermography work
described below, however, the limitations of measuring windows in the field introduce some compromises
that reduce the accuracy from the typical ±0.5°C that can be attained from thermography in a more
controlled environment. The instrument used to measure IR surface temperature images was a FLIR SC660
infrared camera using a microbolometer focal plane array sensor with 640x480 pixels [24]. The sensitivity of
the sensor is less than 0.03°C. The infrared camera was fitted with a 45° opening angle lens allowing it to
measure a relatively wide subject area from a limited distance.
To contribute to the study of the thermochromic glazing, it was necessary to perform the infrared imaging
from the outside of the building. The outer layer of the dual pane window is the thermochromic active layer
and the insulating air space and inner pane prevents measurement of the thermochromic layer surface
temperature from the inside. Exterior IR measurements are more challenging than interior field
measurements because interior wall and surface temperatures provide a fairly uniform background
radiation enclosure, while outdoor surroundings can be highly varied, especially when comparing
background thermal radiation from the ground and buildings to that from a clear sky. It is important to
consider these background radiation temperatures and non-uniformities when composing an IR
thermography measurement because typical building surfaces with an emissivity between 0.86 and 0.9
reflect enough of this background radiation that a compensation is necessary to measure an accurate
temperature of the surface of interest. The emissivity of the glass is known to be 0.86 for the long-wave
infrared (750-1300 nm) wavelengths the camera measures [22, 23]. A strip of aluminum foil tape (shown in
Figure D-1) was applied next to the windows to allow measurement of a reflection of the thermal infrared
background radiation temperature as well as assess top to bottom uniformity of the background. Using the
measured reflection off the foil tape allows separation of the reflected portion of the signal from the
emitted portion that contains the information about the surface temperature of interest. The background
correction formula is presented in previous work on thermography [22, 23], or is typically built into the IR
camera software interface.

A Pilot Demonstration of Electrochromic and Thermochromic Windows in the Denver Federal Center, Building 41, Denver, Colorado Page 98
Figure D-1: IR camera setup and view of a thermochromic façade
Using the reflective foil tape, the thermal radiation background temperature was measured to be around
86°F (30°C) on the first day and -0.4°F (-18°C) the second day, although it varied somewhat during each day.
This very low temperature is a result of orienting the camera such that the specular reflection off the glass
was that of the clear sky. The camera was placed low on the one-story roof opposite the second story
windows under study. The view of the camera is oriented slightly upward to avoid the reflection of the non-
uniform objects on the roof of the opposite building; hence the sky became the background.
As a confirmation of the IR temperature accuracy after applying the background correction, spot IR
temperatures from a couple of the images in each daily series were compared to the surface mounted
thermistors on the glass. IR and visible images were taken at the same time (September 22, 2011 11:57
MST). At this time, the shaded top sensor (diffuse/indirect solar gain, 303 W/m2) measured 87°F (30.5°C)
with IR and 88.2°F (31.2°C) with the thermistor. The bottom sensor (in direct sun, 662 W/m2) measured
104.2°F (40.1°C) with IR and 107.4°F (41.9°C) with the thermistor. Ambient temperature at the time of these
measurements was 77°F (25°C) and global horizontal solar radiation was 856 W/m2. Given the challenging
field measurement conditions, it is an encouraging confirmation of field IR thermography accuracy that,
after the background correction, IR measurements were within 1-2°C of contact measurements. A second
spot check the following day at a time with more intense direct solar radiation revealed a similar 1-2°C
deviation from the contact sensors. Part of this error may lie in the temperature difference between the
surface of the clear silicone fastening the sensor to the glass and the thermistor sensor bead inside. The thin
layer of silicon rubber is small thermal resistance between the ambient cooled surface and the thermistor
bead where most local solar absorption occurs, hence the higher measured thermistor temperatures. Still,

A Pilot Demonstration of Electrochromic and Thermochromic Windows in the Denver Federal Center, Building 41, Denver, Colorado Page 99
any non-uniformity in background radiation, including gradients in the sky or clouds, as well as changes
throughout the day, may introduce error in the infrared measurement.
Furthermore, IR camera measurements are most reliable in relative terms rather than absolute. Typically, in
laboratory experiments the IR camera would also measure the temperature of a known reference emitter (a
temperature controlled plate) to provide an absolute reference temperature for further correction after the
background correction. A reference emitter was not used for these measurements for reasons of
experimental setup practicality and no fixed reference offset was applied to the image. However the IR and
contact thermistor spot check comparison was within 1-2°C, which is quite good for less controlled field
thermography. The sensitive portion of the thermistor bead and surface over the sensor measured by the IR
camera were not thermally identical, though, so there is reason to believe they would not be at an identical
temperature. As a result, the thermistor cannot serve as a highly reliable external absolute reference, but
provides reasonable confidence check of the IR results.
Another feature demonstrated by the IR measurements is the influence of solar radiation on contact
measurements of glass. In direct sun, the temperature of the thermistor bead mounted to the glass with
clear silicone compared to that of a nearby location on the glass demonstrates some temperature offset.
Approximately 2-3 inches away from the thermistor beads, the IR glass surface temperatures were
measured to be 98.6°F (37°C) in the sun and 82.4°F (28°C) in the shade for the measurements presented in
Figure D-2. These glass surface temperatures with no sensor present are about 4.5-5.4°F (2.5-3°C) lower
compared to the bead IR temperature reported above. This observation is consistent with the expectation
that higher solar absorption associated with the opaque thermistor bead and wire mounted to the glass will
raise the local temperature under direct solar radiation. It is a limitation of contact surface temperature
measurements, in general, that they cannot measure the surface temperature without changing the local
solar optical properties. This results in a shift of local temperature, when the sensor does not transmit,
absorb and reflect solar radiation in the same way as the glass on which it is mounted. This particular IR
measurement indicates that measurements from the contact thermistors under direct solar radiation (with
similar radiation and ambient temperature) should be assumed to measure higher than the glass
temperature without the sensor in place, by about 5.4°F (3°C), but this value can vary depending on ambient
conditions. A second measurement the following day under more extreme direct solar conditions (97°F
(36°C) outdoor air temperature and ~1000 W/m2 incident vertical irradiance at the window) had 1-2°C offset
between the sensor location and the bare glass. The lower offset is likely because the heavy tint condition of
the glass was absorbing nearly as much as the opaque sensor. More error is expected when the window
transmission is high but receiving radiation, which, for a thermochromic, would be just before and during
transition, or under diffuse conditions. Also, the ambient conditions are important to the differential heat
transfer rates between the glass and sensor. Air temperature and the strength of convection relative to
radiation will drive this offset to different values.

A Pilot Demonstration of Electrochromic and Thermochromic Windows in the Denver Federal Center, Building 41, Denver, Colorado Page 100
G. APPENDIX E: SUMMARY OF ENERGYPLUS ASSUMPTIONS
Details of the building construction, lighting, equipment, and occupant density, and schedules used in the
EnergyPlus model are given below.
Table E-1. EnergyPlus model inputs
Exterior Wall Construction Wood siding covered by tin, 2x4 studs 16" on center, no drywall, installation board
Lighting Power density Perimeter Zone: 0.33 W/ft2, core zone: 0.67 W/ft2. Schedule refers to Table E-2.
HVAC schedule Monday to Friday 5:30 AM to 5:00 PM. Off during weekend and holidays.
People Exterior zone peak: 21 people, Interior zone peak: 102 people. Schedule refers to Table E-2.
Interior equipment Perimeter zone: 0.5 W/ft2, core zone: 1 W/ft2. Schedule refers to Table E-2.
Table E-2: Schedules for lighting, interior equipment and occupancy power use
Lighting
Time (hour) 1 2 3 4 5 6 7 8 9 10 11 12
% of design value during weekday 0 0 0 0 0 0 0 5 10 90 90 90
% of design value during weekend 0 0 0 0 0 0 0 0 0 0 0 0
Time (hour) 13 14 15 16 17 18 19 20 21 22 23 24
% of design value during weekday 50 90 90 90 90 0 0 0 0 0 0 0
% of design value during weekend 0 0 0 0 0 0 0 0 0 0 0 0
Equipment
Time (hour) 1 2 3 4 5 6 7 8 9 10 11 12
% of design value during weekday 30 30 30 30 30 30 30 30 30 90 90 90
% of design value during weekend 0 0 0 0 0 0 0 0 0 0 0 0
Time (hour) 13 14 15 16 17 18 19 20 21 22 23 24
% of design value during weekday 80 90 90 90 90 30 30 30 30 30 30 30
% of design value during weekend 0 0 0 0 0 0 0 0 0 0 0 0

A Pilot Demonstration of Electrochromic and Thermochromic Windows in the Denver Federal Center, Building 41, Denver, Colorado Page 101
Occupancy
Time (hour) 1 2 3 4 5 6 7 8 9 10 11 12
% of design value during weekday 0 0 0 0 0 0 0 10 75 75 75 75
% of design value during weekend 0 0 0 0 0 0 0 0 0 0 0 0
Time (hour) 13 14 15 16 17 18 19 20 21 22 23 24
% of design value during weekday 50 75 75 75 75 0 0 0 0 0 0 0
% of design value during weekend 0 0 0 0 0 0 0 0 0 0 0 0

A Pilot Demonstration of Electrochromic and Thermochromic Windows in the Denver Federal Center, Building 41, Denver, Colorado Page 102
H. APPENDIX F: METHODS USED TO ASSESS OCCUPANT RESPONSE
Surveys were issued to occupants in the three areas where the three types of windows were installed. These
"zones" were designated as zone A with the thermochromic windows, zone B with the electrochromic
windows, and zone C with the low-e windows and operable roller shades (in zones A and B, the operable
shades were fully raised and fixed so that they could not be used). Zone C was included to enable testing of
whether the effects observed in the switchable window zones were likely to be due to the presence of
switchable windows or to some other cause.
The Phase I survey was issued on January 4, 2012, after the occupants were exposed to the thermochromic
windows and the electrochromic windows with the Phase I conditions. The thermochromic windows
operated as intended as soon as they were installed, so occupants in the thermochromic area responded to
solar conditions that occurred from September 1, 2011, to December 31, 2011. Automated control of the
electrochromic windows was commissioned in the occupied space from June 20 to September 15, 2011, so
occupants were asked to restrict their responses, to the extent possible, to the time frame that the ECs were
operating as intended (September 15 to December 31, 2011). The survey was open until January 27, 2012.
Survey questions were issued on-line and are given below.
The Phase II survey was issued June 4-15, 2012. The survey was modified to a) exclude the questions about
the period before the new switchable windows were installed and b) include additional questions about the
experiences that the occupants had with the manual controls of the electrochromic windows. The
thermochromic windows worked as intended throughout the test period (February 21, 2012, to June 30,
2012). The Phase II electrochromic windows with manual override controls were installed on February 21,
2012, and were commissioned by March 13, 2011, so occupants were asked to restrict their responses to
the time frame that the electrochromic windows were operating as intended (March 13 to June 30, 2012).
Solar conditions were representative of the vernal equinox to summer solstice period. Survey questions
were again issued on-line and are given below.
With the Phase I Survey, the main objective was to identify changes in the occupants' perceptions of the
space. Since the two sets of responses (i.e., before and after the installation) are given at the same time, we
know that they come from the same occupant. For this reason, a paired t-test was used as a test of
statistical significance. With respect to the electrochromic windows and the Phase II survey, since we only
asked questions about the new Phase II condition, we could not establish correspondence between
individual Phase I and II responses due to the fact that the surveys were anonymous. Asking the occupant to
give two sets of responses (for before and after Phase II) would not have yielded useful data because the
two phases occurred under significantly different weather conditions and would have confounded the
results. For the Phase II survey results, we, therefore, used unpaired t-tests.
When comparing effects from different zones, we performed both equal variance and unequal variance
tests, to account for the possibility of populations with different variances. In all tests, we used 95% as the
threshold for statistical significance.
Summaries of characteristics of the populations (e.g., age, gender) and attitudes towards comfort are given
after the survey forms for Phases I and II.

A Pilot Demonstration of Electrochromic and Thermochromic Windows in the Denver Federal Center, Building 41, Denver, Colorado Page 103
PHASE I SURVEY
Information to be provided to the GSA contact in charge of issuing the survey:
A survey has been developed to understand how occupants experience the switchable window technologies
being demonstrated at Building 41 of the Denver Federal Center, mainly in terms of visual and thermal
comfort. This survey is to be issued to occupants of the areas with electrochromic and thermochromic
windows, as well as of a third area with non-switchable windows, with the intent of understanding the
effect that the different types of chromogenic window have on occupant comfort both relative to each
other and to non-switchable windows.
Occupants of the three areas mentioned above are to be reached by an email notification from the facility
manager with a letter from LBNL researchers introducing the survey and linking to the survey website.
Participation in the online survey is anonymous and voluntary. The invitation letter, as well as the survey,
are shown in the following pages.
A Pilot Demonstration of Electrochromic and Thermochromic Windows in the Denver Federal Center, Building 41, Denver, Colorado Page 104
Re: Energy-efficient window survey
Berkeley, November 29, 2011
Dear Madam/Sir,
As part of GSA's evaluation of the energy efficient windows in the Denver Federal Center Building 41, the
Lawrence Berkeley National Laboratory has been asked to survey how people working in this building
experience these windows.
We are writing to invite you to participate in this survey. Participation is voluntary, and you may stop
completing the survey at any time. We estimate that it will take approximately 15 minutes of your time to
complete the survey. This survey is anonymous and responses will not be individually identifiable, although
it is possible that the combination of age, gender and office location might conceivably make it possible for
someone reviewing the data to figure out which response is yours.
To fill out the survey, please follow the link below:
https://www.surveymonkey.com/s/SF8J65L
The results of this survey will contribute to the advancement and improvement of energy efficient window
technologies in the United States. We hope you decide to participate and look forward to your response.
We would be happy to address any questions or issues related to this survey: please contact Luis Fernandes
at [email protected] or Dana Coolbroth at [email protected].
Sincerely,
Building Technologies Program
Environmental Energy Technologies
Division Lawrence Berkeley National Laboratory

A Pilot Demonstration of Electrochromic and Thermochromic Windows in the Denver Federal Center, Building 41, Denver, Colorado Page 105
SWITCHABLE WINDOW SURVEY
PARTICIPANT INFORMATION
Thank you for taking the time to participate in this survey about how people experience variable tint
windows in an office space!
This survey is designed to determine your level of satisfaction and comfort resulting from the use of this new
technology. The survey is being conducted by the Windows and Daylighting Group at the Lawrence Berkeley
National Laboratory (LBNL) to better understand the impact of new energy-efficient window technologies
on end users.
Variable-tint or "switchable" windows have glass with a special thin-film coating that either tints when they
become hotter (thermochromic windows) or tints based on a signal from a computer-controlled system
(electrochromic windows). The idea is to reduce heating, cooling, and lighting loads as the weather changes
or as other changes occur over the life of the building.
These two types of windows have been installed in order to evaluate energy use and occupant impacts as
part of the General Services Administration (GSA) "Green Proving Ground" program.
We estimate that it will take approximately 15 minutes of your time to complete the survey.
Please read this explanation of the procedure and your rights as a research subject before filling out any
of the survey.
Participation in this research is VOLUNTARY. You have the right to not take part in this study or to stop
taking part at any time. Simply do not click the online survey link provided or you can quit your web browser
at any point during the survey.
Participating in this study poses no known risks to you. The data will be analyzed and summarized by an
outside group (LBNL) who does not know your identity. No names, e-mail addresses, or IP addresses will be
associated with the questionnaire. If GSA requests access to the survey data, the data will not contain any
information that can identify you directly. However, the combination of age, gender and office location
might conceivably make it possible for someone reviewing the data to figure out which response is yours.
No individuals will be identified in final reports or other public documents. Your survey responses will be
stored electronically by LBNL researchers directly involved in this project.
There is no direct benefit to you from the research, although it is possible that it may lead to the
identification and eventual addressing of comfort or workplace quality issues in the office area you work in.
LBNL is not offering any payment or remuneration for completing the survey. We hope that the research will
benefit society by helping the development of switchable window systems that potentially provide a more
comfortable, energy efficient, and higher quality work environment.
Procedure
An online questionnaire will be given to you. To ensure anonymity of your response, please do not
provide your name in any of the responses. It consists of three parts:

A Pilot Demonstration of Electrochromic and Thermochromic Windows in the Denver Federal Center, Building 41, Denver, Colorado Page 106
o Part A includes questions on your personal preferences in a work environment.
o Part B includes questions on your impressions about your space before the new, switchable
windows were installed in your part of the building.
o Part C includes questions about your impressions about your space after the new windows
were installed in your area of the building, where your response will be focused on the
predominant type of switchable window near your space.
o NOTE: if you work in an area that does not have switchable windows, you will not be asked
to complete Part B of the questionnaire.
Please do not discuss your impressions with anyone else before they complete their participation in the
survey because you could bias other participants or prospective subjects.
Any further questions you have about taking part in this study can be answered by Luis Fernandes at (510)
495- 8892. If you have any questions about your rights or treatment as a participant in this research project,
please contact the Berkeley Lab Human and Animal Regulatory Committees at (510) 486-5399 or
Thanks again for your help towards the goal of attaining a more energy-efficient and pleasant work
environment!
Building Technologies Program
Lawrence Berkeley National Laboratory

A Pilot Demonstration of Electrochromic and Thermochromic Windows in the Denver Federal Center, Building 41, Denver, Colorado Page 107
INFORMED CONSENT
I have read and understood the Participant Information and consent to my participation in this study.
a. Yes
b. No
[Note for Human Subjects Committee: online survey will be set up so that participant will not be able to
continue if answer to this question is b) No]

A Pilot Demonstration of Electrochromic and Thermochromic Windows in the Denver Federal Center, Building 41, Denver, Colorado Page 108
INSTRUCTIONS
We would like you to answer the questions in this questionnaire. Please fill out this questionnaire as
completely as possible. If there is any question you are unable to answer or do not want to answer, just skip
it and go on to the next one. Please respond to all of the items as openly and honestly as possible. Try to
answer all the questions based on your impressions. There are no right or wrong answers; it is only your
opinions that are important.

A Pilot Demonstration of Electrochromic and Thermochromic Windows in the Denver Federal Center, Building 41, Denver, Colorado Page 109
Part A Background Information
1. Which of the zones indicated in the image above is your habitual workspace in? Note: Zone C extends to the right of the area shown in the figure above.
a. Zone A
b. Zone B
c. Zone C
2. Counting from the windows, which cubicle row is your workspace in? For example, the red triangle in the figure above is in the fifth row from the windows.
Note: if your workspace is not a cubicle, please estimate your distance from the window using the figure above to determine row number.
d. First
e. Second
f. Third
g. Fourth
h. Fifth
3. What is your gender?
i. Male
j. Female
4. Are you…
k. Under 40 years old?
l. 40 or over?

A Pilot Demonstration of Electrochromic and Thermochromic Windows in the Denver Federal Center, Building 41, Denver, Colorado Page 110
5. Please assign a rating from 1 to 5 for what you feel is the importance of the following items in creating a pleasant and productive work environment, with 1 being the least important and 5 being the most important.
Item Rating
Unimportant Very
Important
1 2 3 4 5
a) Good temperature control |----|----|----|----|----|----|----|----|----|----|----|----|----|----|----|----|
b) Windows |----|----|----|----|----|----|----|----|----|----|----|----|----|----|----|----|
c) Controllable lights or windows |----|----|----|----|----|----|----|----|----|----|----|----|----|----|----|----|
d) No noise |----|----|----|----|----|----|----|----|----|----|----|----|----|----|----|----|
e) Other (specify) __________________
|----|----|----|----|----|----|----|----|----|----|----|----|----|----|----|----|
6. Please assign a rating from 1 to 5 for your sensitivity to the following items, with 1 being not sensitive, 3 being moderately sensitive, and 5 being very sensitive.
Item Rating
Least
Sensitive Moderately
Sensitive Very
Sensitive
1 2 3 4 5
a) Glare |----|----|----|----|----|----|----|----|----|----|----|----|----|----|----|----|
b) Cold |----|----|----|----|----|----|----|----|----|----|----|----|----|----|----|----|
c) Heat |----|----|----|----|----|----|----|----|----|----|----|----|----|----|----|----|
d) Gloominess |----|----|----|----|----|----|----|----|----|----|----|----|----|----|----|----|
7. When you perform your work tasks, what is your preferred light level in your workspace?
Very Low Low Moderate Bright Very Bright
1 2 3 4 5
Light level |----|----|----|----|----|----|----|----|----|----|----|----|----|----|----|----|

A Pilot Demonstration of Electrochromic and Thermochromic Windows in the Denver Federal Center, Building 41, Denver, Colorado Page 111
Part B Before new, switchable windows were installed…
NOTE: Complete this part ONLY if you work in Zones A or B.
For this part, please answer based on your impressions of the time before the new windows were installed
in your zone of the building. If possible and relevant, project back about six months to a year.
1. Which task type did you perform most of the time?
Task Choose one
Telephone ____
Reading and writing on paper ____
Computer ____
Other (please specify) _______________________
2. Which direction did you face most of the time?
Task Choose one
Towards window ____
With the window to one side ____
Away from Window ____
Other (please specify) _______________________

A Pilot Demonstration of Electrochromic and Thermochromic Windows in the Denver Federal Center, Building 41, Denver, Colorado Page 112
3. Please assign a rating from 1 to 5 (or N/A = not applicable) to the following conditions in your work space.
Item Rating
Too Cold Just Right Too Hot
1 2 3 4 5
a) Temperature during warm/hot weather
|----|----|----|----|----|----|----|----|----|----|----|----|----|----|----|----| N/A
Too Cold Just Right Too Hot
1 2 3 4 5
b) Temperature during cool/cold weather
|----|----|----|----|----|----|----|----|----|----|----|----|----|----|----|----| N/A
Too
Dark/Gloomy Just Right Too Bright
1 2 3 4 5
c) Light level |----|----|----|----|----|----|----|----|----|----|----|----|----|----|----|----|
4. Please rate the level of glare in your work space.
Not
Perceptible Perceptible Acceptable Uncomfortable Intolerable
1 2 3 4 5
Level of glare |----|----|----|----|----|----|----|----|----|----|----|----|----|----|----|----|
5. Indicate your level of agreement/disagreement (disagree = 1, agree = 5) with the following statements:
Disagree Somewhat
agree Agree
1 2 3 4 5
a) Bright light on my task made it difficult to read or see
|----|----|----|----|----|----|----|----|----|----|----|----|----|----|----|----|
b) The shades blocked the view |----|----|----|----|----|----|----|----|----|----|----|----|----|----|----|----| N/A
c) There was enough daylight in the space
|----|----|----|----|----|----|----|----|----|----|----|----|----|----|----|----|
d) The windows looked aesthetically pleasing
|----|----|----|----|----|----|----|----|----|----|----|----|----|----|----|----|
e) The windows allowed too much outside noise into the space
|----|----|----|----|----|----|----|----|----|----|----|----|----|----|----|----|

A Pilot Demonstration of Electrochromic and Thermochromic Windows in the Denver Federal Center, Building 41, Denver, Colorado Page 113
6. Did you or anyone in the space raise or lower the window shades at any time?
a. Yes
b. No
c. The windows in my area did not have operable shades

A Pilot Demonstration of Electrochromic and Thermochromic Windows in the Denver Federal Center, Building 41, Denver, Colorado Page 114
Part C After the new windows were installed…
For this part, please answer based on your impressions of the time after the new windows were installed in
your zone (A, B, or C) of the building. The installation of these windows was completed and made to operate
properly on or around the following dates:
Zone A: August 31, 2011
Zone B: September 15, 2011 (installed earlier but working as intended after this date)
Zone C: before 2009
1. Which task type did you perform most of the time?
Task Choose one
Reading and writing on paper ____
Computer ____
Telephone ____
Other (please specify) _______________________
2. Which direction did you face most of the time?
Task Choose one
Towards window ____
With the window to one side ____
Away from Window ____
Other (please specify) _______________________

A Pilot Demonstration of Electrochromic and Thermochromic Windows in the Denver Federal Center, Building 41, Denver, Colorado Page 115
3. Please assign a rating from 1 to 5 (or N/A) to the following conditions in your work space.
Item Rating
Too Cold Just Right Too Hot
1 2 3 4 5
a) Temperature during warm/hot weather
|----|----|----|----|----|----|----|----|----|----|----|----|----|----|----|----| N/A
Too Cold Just Right Too Hot
1 2 3 4 5
b) Temperature during cool/cold weather
|----|----|----|----|----|----|----|----|----|----|----|----|----|----|----|----| N/A
Too
Dark/Gloomy Just Right Too Bright
1 2 3 4 5
c) Light level |----|----|----|----|----|----|----|----|----|----|----|----|----|----|----|----|
4. Please rate the level of glare in your work space.
Not
Perceptible Perceptible Acceptable Uncomfortable Intolerable
1 2 3 4 5
Level of glare |----|----|----|----|----|----|----|----|----|----|----|----|----|----|----|----|
5. Indicate your level of agreement/disagreement (disagree = 1, agree = 5) with the following statements:
Disagree Somewhat
agree Agree
1 2 3 4 5
a) Bright light on my task made it difficult to read or see
|----|----|----|----|----|----|----|----|----|----|----|----|----|----|----|----|
b) The tinting/untinting of the windows was annoying
|----|----|----|----|----|----|----|----|----|----|----|----|----|----|----|----| N/A
c) The shades blocked the view |----|----|----|----|----|----|----|----|----|----|----|----|----|----|----|----| N/A
d) There was enough daylight in the space
|----|----|----|----|----|----|----|----|----|----|----|----|----|----|----|----|

A Pilot Demonstration of Electrochromic and Thermochromic Windows in the Denver Federal Center, Building 41, Denver, Colorado Page 116
Disagree Somewhat
agree Agree
1 2 3 4 5
e) The windows looked aesthetically pleasing
|----|----|----|----|----|----|----|----|----|----|----|----|----|----|----|----|
f) The windows allowed too much outside noise into the space
|----|----|----|----|----|----|----|----|----|----|----|----|----|----|----|----|
6. Did you or anyone in the space raise or lower the window shades at any time?
7. Yes
8. No
9. The windows in my area do not have operable shades
10. Answer only if your answer to the previous question was c). Would this space be more visually comfortable if there were operable shades on the windows?
11. Yes
12. No
13. It would not make any difference
14. Answer only if you work in zones A or B. Would this space be more visually comfortable if the darkening/lightening of the windows was operated manually instead of automatically?
15. Yes
16. No
17. It would not make any difference

A Pilot Demonstration of Electrochromic and Thermochromic Windows in the Denver Federal Center, Building 41, Denver, Colorado Page 117
18. Answer only if you work in zones A or B. Please provide any comments that you feel would be helpful in improving the tinting/untinting operation of the windows.
THANK YOU!
Thank you for taking the time to participate in this survey! We will send an update with summary results of
this study once they are available.

A Pilot Demonstration of Electrochromic and Thermochromic Windows in the Denver Federal Center, Building 41, Denver, Colorado Page 118
PHASE II SURVEY
SWITCHABLE WINDOW SURVEY
PARTICIPANT INFORMATION
Thank you for taking the time to participate in this survey about how people experience variable tint
windows in an office space!
This survey is designed to determine your level of satisfaction and comfort resulting from the use of this new
technology. The survey is being conducted by the Windows and Daylighting Group at the Lawrence Berkeley
National Laboratory (LBNL) to better understand the impact of new energy-efficient window technologies
on end users.
The variable-tint or "switchable" windows in this study have glass with a special thin-film coating that either
tints when they become hotter (thermochromic windows) or tints based on a signal from a computer-
controlled system (electrochromic windows). The idea is to reduce heating, cooling, and lighting loads as the
weather changes or as other changes occur over the life of the building.
These two types of windows have been installed in order to evaluate energy use and occupant impacts as
part of the General Services Administration (GSA) "Green Proving Ground" program.
We estimate that it will take approximately 15 minutes of your time to complete the survey.
Please read this explanation of the procedure and your rights as a research subject before filling out any
of the survey.
Participation in this research is VOLUNTARY. You have the right to not take part in this study or to stop
taking part at any time. Simply do not click the online survey link provided or you can quit your web browser
at any point during the survey.
Participating in this study poses no known risks to you. The data will be analyzed and summarized by an
outside group (LBNL) who does not know your identity. No names, e-mail addresses, or IP addresses will be
associated with the questionnaire. If GSA requests access to the survey data, the data will not contain any
information that can identify you directly. However, the combination of age, gender and office location
might conceivably make it possible for someone reviewing the data to figure out which response is yours.
No individuals will be identified in final reports or other public documents. Your survey responses will be
stored electronically by LBNL researchers directly involved in this project.
There is no direct benefit to you from the research, although it is possible that it may lead to the
identification and eventual addressing of comfort or workplace quality issues in the office area you work in.
LBNL is not offering any payment or remuneration for completing the survey. We hope that the research will
benefit society by helping the development of switchable window systems that potentially provide a more
comfortable, energy efficient, and higher quality work environment.

A Pilot Demonstration of Electrochromic and Thermochromic Windows in the Denver Federal Center, Building 41, Denver, Colorado Page 119
Procedure
An online questionnaire will be given to you. To ensure anonymity of your response, please do not
provide your name in any of the responses. It consists of two parts:
o Part A includes questions on your personal preferences in a work environment.
o Part B includes questions about your impressions about your space during the last two
months of window operation, where your response will be focused on the predominant
type of window in your space.
o NOTE: if you work in an area that does not have switchable windows, you will not be asked
to complete some of the questions.
Please do not discuss your impressions with anyone else before they complete their participation in the
survey because you could bias other participants or prospective subjects.
Any further questions you have about taking part in this study can be answered by Luis Fernandes at (510)
495-8892. If you have any questions about your rights or treatment as a participant in this research project,
please contact the Berkeley Lab Human and Animal Regulatory Committees at (510) 486-5399 or
Thanks again for your help towards the goal of attaining a more energy-efficient and pleasant work
environment!
Building Technologies Program
Lawrence Berkeley National Laboratory

A Pilot Demonstration of Electrochromic and Thermochromic Windows in the Denver Federal Center, Building 41, Denver, Colorado Page 120
INFORMED CONSENT
I have read and understood the Participant Information and consent to my participation in this study.
a. Yes
b. No
[Note for Human Subjects Committee: online survey will be set up so that participant will not be able to
continue if answer to this question is b) No]

A Pilot Demonstration of Electrochromic and Thermochromic Windows in the Denver Federal Center, Building 41, Denver, Colorado Page 121
INSTRUCTIONS
We would like you to answer the questions in this questionnaire. Please fill out this questionnaire as
completely as possible. If there is any question you are unable to answer or do not want to answer, just skip
it and go on to the next one. Please respond to all of the items as openly and honestly as possible. Try to
answer all the questions based on your impressions. There are no right or wrong answers; it is only your
opinions that are important.

A Pilot Demonstration of Electrochromic and Thermochromic Windows in the Denver Federal Center, Building 41, Denver, Colorado Page 122
Part A Background Information
2. Which of the zones indicated in the image above is your habitual workspace in? Note: Zone C extends to the right of the area shown in the figure above.
a. Zone A
b. Zone B
c. Zone C
3. Counting from the windows, which cubicle row is your workspace in? For example, the red triangle in the figure above is in the fifth row from the windows.
Note: if your workspace is not a cubicle, please estimate your distance from the window using the figure above to determine row number.
a. First
b. Second
c. Third
d. Fourth
e. Fifth
4. What is your gender?
a. Male
b. Female
5. Are you…
a. Under 40 years old?
b. 40 or over?

A Pilot Demonstration of Electrochromic and Thermochromic Windows in the Denver Federal Center, Building 41, Denver, Colorado Page 123
6. Please assign a rating from 1 to 5 for what you feel is the importance of the following items in creating a pleasant and productive work environment, with 1 being the least important and 5 being the most important.
Item Rating
Unimportant Very
Important
1 2 3 4 5
a) Good temperature control |----|----|----|----|----|----|----|----|----|----|----|----|----|----|----|----|
b) Windows |----|----|----|----|----|----|----|----|----|----|----|----|----|----|----|----|
c) Controllable lights or windows |----|----|----|----|----|----|----|----|----|----|----|----|----|----|----|----|
d) No noise |----|----|----|----|----|----|----|----|----|----|----|----|----|----|----|----|
e) Other (specify) __________________
|----|----|----|----|----|----|----|----|----|----|----|----|----|----|----|----|
7. Please assign a rating from 1 to 5 for your sensitivity to the following items, with 1 being not sensitive, 3 being moderately sensitive, and 5 being very sensitive.
Item Rating
Least
Sensitive Moderately
Sensitive Very
Sensitive
1 2 3 4 5
a) Glare |----|----|----|----|----|----|----|----|----|----|----|----|----|----|----|----|
b) Cold |----|----|----|----|----|----|----|----|----|----|----|----|----|----|----|----|
c) Heat |----|----|----|----|----|----|----|----|----|----|----|----|----|----|----|----|
d) Gloominess |----|----|----|----|----|----|----|----|----|----|----|----|----|----|----|----|
8. When you perform your work tasks, what is your preferred light level in your workspace?
Very Low Low Moderate Bright Very Bright
1 2 3 4 5
Light level |----|----|----|----|----|----|----|----|----|----|----|----|----|----|----|----|

A Pilot Demonstration of Electrochromic and Thermochromic Windows in the Denver Federal Center, Building 41, Denver, Colorado Page 124
Part B In the last 2 MONTHS:
For this part, please answer based on your impressions and experiences during the last two months.
1. Which task type did you perform most of the time?
Task Choose one
Reading and writing on paper ____
Computer ____
Telephone ____
Other (please specify) _______________________
2. Which direction did you face most of the time?
Task Choose one
Towards window ____
With the window to one side ____
Away from Window ____
Other (please specify) _______________________

A Pilot Demonstration of Electrochromic and Thermochromic Windows in the Denver Federal Center, Building 41, Denver, Colorado Page 125
3. Please assign a rating from 1 to 5 (or N/A) to the following conditions in your work space.
Item Rating
Too Cold Just Right Too Hot
1 2 3 4 5
a) Temperature during warm/hot weather
|----|----|----|----|----|----|----|----|----|----|----|----|----|----|----|----| N/A
Too Cold Just Right Too Hot
1 2 3 4 5
b) Temperature during cool/cold weather
|----|----|----|----|----|----|----|----|----|----|----|----|----|----|----|----| N/A
Too
Dark/Gloomy Just Right Too Bright
1 2 3 4 5
c) Light level |----|----|----|----|----|----|----|----|----|----|----|----|----|----|----|----|
4. Please rate the level of glare in your work space.
Not
Perceptible Perceptible Acceptable Uncomfortable Intolerable
1 2 3 4 5
Level of glare |----|----|----|----|----|----|----|----|----|----|----|----|----|----|----|----|
5. Indicate your level of agreement/disagreement (disagree = 1, agree = 5) with the following statements:
Disagree Somewhat
agree Agree
1 2 3 4 5
a) Bright light on my task made it difficult to read or see
|----|----|----|----|----|----|----|----|----|----|----|----|----|----|----|----|
b) The tinting/untinting of the windows was annoying
|----|----|----|----|----|----|----|----|----|----|----|----|----|----|----|----| N/A
c) The shades blocked the view
|----|----|----|----|----|----|----|----|----|----|----|----|----|----|----|----| N/A
d) There was enough daylight in the space
|----|----|----|----|----|----|----|----|----|----|----|----|----|----|----|----|

A Pilot Demonstration of Electrochromic and Thermochromic Windows in the Denver Federal Center, Building 41, Denver, Colorado Page 126
Disagree Somewhat
agree Agree
1 2 3 4 5
e) The windows looked aesthetically pleasing
|----|----|----|----|----|----|----|----|----|----|----|----|----|----|----|----|
f) The windows allowed too much outside noise into the space
|----|----|----|----|----|----|----|----|----|----|----|----|----|----|----|----|
g) The wall switches allowed the window to be manually controlled in a satisfactory way
|----|----|----|----|----|----|----|----|----|----|----|----|----|----|----|----| N/A
h) The speed at which the windows tinted/untinted was satisfactory
|----|----|----|----|----|----|----|----|----|----|----|----|----|----|----|----| N/A
6. Did you or anyone in the space raise or lower the window shades at any time?
a. Yes
b. No
c. The windows in my area do not have operable shades
7. Answer only if your answer to the previous question was c). Would this space be more visually comfortable if there were operable shades on the windows?
d. Yes
e. No
f. It would not make any difference

A Pilot Demonstration of Electrochromic and Thermochromic Windows in the Denver Federal Center, Building 41, Denver, Colorado Page 127
8. Answer only if you work in zone B. Did you use the wall switches to tint or untint the windows?
g. Yes
h. No
9. Answer only if you work in zone B AND if you answered "Yes" to question 8. When you used the wall switches, what was the reason? (please check all that apply)
i. To reduce glare from daylight/sunlight
j. To reduce the overall brightness of the space
k. To increase visual privacy
l. To reduce the heat from the sun
m. To reduce cold draft from the window
n. To decrease the level of visual stimulus from the outside
o. Other (please specify)____________________
10. Answer only if you work in zone B AND if you answered "Yes" to question 8. When you used the wall switches, did the window succeed in achieving the effects you indicated in your answer(s) to question 9?
p. Yes
q. No
11. If your answer to question 10 was "No", please describe what you expected and what happened instead.
12. Answer only if you work in zone B AND if you answered "Yes" to question 8. When you used the wall switches, did the window tint/untint as expected?
r. Yes
s. No
13. If your answer to question 11 was "No", please describe what you expected and what happened instead.

A Pilot Demonstration of Electrochromic and Thermochromic Windows in the Denver Federal Center, Building 41, Denver, Colorado Page 128
14. Answer only if you work in zones A or B. Please provide any additional comments that you feel would be helpful in improving the tinting/untinting operation of the windows.
THANK YOU!
Thank you for taking the time to participate in this survey! We will send an update with summary results of
this study once they are available.

A Pilot Demonstration of Electrochromic and Thermochromic Windows in the Denver Federal Center, Building 41, Denver, Colorado Page 129
PHASE I SURVEY RESPONSES: SUMMARY OF POPULATION CHARACTERISTICS AND ATTITUDES TOWARD COMFORT
We obtained 68 responses to the first survey. 12 of those responses were empty, or nearly empty, leaving us
with 56 valid responses, of which 18 in zone A (thermochromic), 19 in zone B (electrochromic) and 19 in
zone C (low-e). The characteristics of the population are shown in Table F-1. Table F-2 shows responses
regarding occupants' attitudes towards comfort. Responses regarding task type and workstation orientation
are shown in Table F-3.
Table F-1 Population characteristics (Phase I survey)
Window
A Thermochromic
n = 18 B Electrochromic
n = 19 C Reference
n = 19
Cubicle row (counting from window)
1 39% 32% 16%
2 28% 11% 11%
3 28% 21% 16%
4 6% 16% 21%
5 0% 21% 32%
No response 0% 0% 5%
Gender
Female 28% 58% 53%
Male 72% 42% 42%
No response 0% 0% 5%
Age
< 40 33% 63% 47%
>= 40 67% 37% 53%

A Pilot Demonstration of Electrochromic and Thermochromic Windows in the Denver Federal Center, Building 41, Denver, Colorado Page 130
Table F-2 Population attitudes (Phase I survey)
Window
Thermochromic
n = 18 Electrochromic
n = 19 Reference
n = 19
Please assign a rating from 1 to 5 for what you feel is the importance of the following items in creating a pleasant and productive work environment, with 1 being the least important and 5 being the most important.
Good temperature control
1 (Unimportant) 0% 0% 0%
2 0% 0% 5%
3 0% 11% 16%
4 33% 42% 5%
5 (Very important) 67% 37% 74%
No response 0% 11% 0%
Windows
1 (Unimportant) 0% 0% 5%
2 6% 5% 5%
3 11% 21% 5%
4 33% 16% 58%
5 (Very important) 50% 47% 26%
No response 0% 11% 0%
Controllable lights or windows
1 (Unimportant) 0% 0% 0%
2 6% 21% 5%
3 17% 11% 26%
4 56% 42% 32%
5 (Very important) 22% 16% 32%
No response 0% 11% 5%

A Pilot Demonstration of Electrochromic and Thermochromic Windows in the Denver Federal Center, Building 41, Denver, Colorado Page 131
Window
Thermochromic
n = 18 Electrochromic
n = 19 Reference
n = 19
No noise
1 (Unimportant) 0% 5% 5%
2 11% 11% 32%
3 11% 42% 37%
4 39% 26% 16%
5 (Very important) 28% 5% 5%
No response 11% 11% 5%
Please assign a rating from 1 to 5 for your sensitivity to the following items, with 1 being not sensitive, 3 being moderately sensitive, and 5 being very sensitive.
Glare
1 (Least sensitive) 0% 16% 0%
2 0% 16% 21%
3 39% 32% 42%
4 11% 11% 26%
5 (Very sensitive) 44% 16% 11%
No response 6% 11% 0%
Cold
1 (Least sensitive) 6% 5% 5%
2 6% 11% 16%
3 50% 16% 21%
4 17% 26% 32%
5 (Very sensitive) 17% 32% 26%
No response 6% 11% 0%

A Pilot Demonstration of Electrochromic and Thermochromic Windows in the Denver Federal Center, Building 41, Denver, Colorado Page 132
Window
Thermochromic
n = 18 Electrochromic
n = 19 Reference
n = 19
Heat
1 (Least sensitive) 6% 11% 0%
2 6% 11% 21%
3 28% 26% 26%
4 44% 16% 16%
5 (Very sensitive) 11% 26% 37%
No response 6% 11% 0%
Gloominess
1 (Least sensitive) 6% 5% 0%
2 17% 11% 5%
3 39% 5% 37%
4 11% 37% 26%
5 (Very sensitive) 22% 32% 32%
No response 6% 11% 0%
When you perform your work tasks, what is your preferred light level in your workspace?
1 (Very low) 0% 0% 0%
2 (Low) 11% 5% 0%
3 (Moderate) 33% 42% 53%
4 (Bright) 50% 42% 47%
5 (Very bright) 0% 0% 0%
No response 6% 11% 0%

A Pilot Demonstration of Electrochromic and Thermochromic Windows in the Denver Federal Center, Building 41, Denver, Colorado Page 133
Table F-3 Task and orientation responses (Phase I survey)
Before installation After installation
Thermochr.
n = 18 Electrochr.
n = 19 Reference
n = 19 Thermochr.
n = 18 Electrochr.
n = 19 Reference
n = 19
Which task type did you perform most of the time?
Reading and writing on paper 6% 0% 0% 6% 0% 0%
Computer 83% 84% 58% 89% 84% 89%
Telephone 0% 0% 0% 0% 0% 0%
Other 6% 0% 0% 0% 0% 0%
No response 6% 16% 42% 6% 16% 11%
Which direction did you face most of the time?
Towards window 39% 47% 32% 44% 47% 68%
With the window to one side 6% 11% 11% 6% 11% 0%
Away from window 44% 26% 16% 44% 26% 16%
Other 0% 0% 0% 0% 0% 0%
No response 11% 16% 42% 6% 16% 16%

A Pilot Demonstration of Electrochromic and Thermochromic Windows in the Denver Federal Center, Building 41, Denver, Colorado Page 134
PHASE II SURVEY RESPONSES: SUMMARY OF POPULATION CHARACTERISTICS AND ATTITUDES TOWARD COMFORT
The second survey had 37 responses overall, 33 of which valid. Of the valid responses, 11 were in zone A
(thermochromic), 8 in zone B (electrochromic) and 14 in zone C (low-e). The characteristics of the population
and their attitudes towards comfort are shown in Tables F-4 and F-5. Responses regarding task type and
workstation orientation are shown in Table F-6.
Table F-4 Population characteristics (Phase II survey)
Window
Thermochromic
n = 11 Electrochromic
n = 8 Reference
n = 15
Cubicle row (counting from window)
1 45% 75% 13%
2 18% 0% 7%
3 27% 25% 20%
4 0% 0% 0%
5 9% 0% 47%
No response 0% 0% 13%
Gender
Female 36% 50% 53%
Male 64% 50% 47%
No response 0% 0% 0%
Age
< 40 9% 88% 47%
>= 40 82% 13% 53%

A Pilot Demonstration of Electrochromic and Thermochromic Windows in the Denver Federal Center, Building 41, Denver, Colorado Page 135
Table F-5 Population attitudes (Phase II survey)
Window
Thermochromic n = 11 Electrochromic n = 8 Reference n = 15
Please assign a rating from 1 to 5 for what you feel is the importance of the following items in creating a pleasant and productive work environment, with 1 being the least important and 5 being the most important.
Good temperature control
1 (Unimportant) 0% 0% 0%
2 0% 0% 0%
3 9% 0% 7%
4 9% 25% 20%
5 (Very important) 82% 75% 67%
No response 0% 0% 7%
Windows
1 (Unimportant) 0% 0% 0%
2 0% 0% 0%
3 45% 13% 0%
4 27% 38% 47%
5 (Very important) 18% 50% 47%
No response 9% 0% 7%
Controllable lights or windows
1 (Unimportant) 0% 0% 0%
2 0% 13% 13%
3 27% 0% 0%
4 18% 50% 60%
5 (Very important) 45% 38% 20%
No response 9% 0% 7%

A Pilot Demonstration of Electrochromic and Thermochromic Windows in the Denver Federal Center, Building 41, Denver, Colorado Page 136
Window
Thermochromic n = 11 Electrochromic n = 8 Reference n = 15
No noise
1 (Unimportant) 0% 0% 13%
2 0% 25% 27%
3 18% 50% 27%
4 36% 25% 27%
5 (Very important) 36% 0% 0%
No response 9% 0% 7%
Please assign a rating from 1 to 5 for your sensitivity to the following items, with 1 being not sensitive, 3 being moderately sensitive, and 5 being very sensitive.
Glare
1 (Least sensitive) 18% 25% 20%
2 9% 25% 13%
3 36% 13% 33%
4 27% 25% 20%
5 (Very sensitive) 9% 13% 7%
No response 0% 0% 7%
Cold
1 (Least sensitive) 0% 0% 13%
2 9% 25% 13%
3 36% 25% 33%
4 9% 13% 13%
5 (Very sensitive) 36% 38% 20%
No response 9% 0% 7%

A Pilot Demonstration of Electrochromic and Thermochromic Windows in the Denver Federal Center, Building 41, Denver, Colorado Page 137
Window
Thermochromic n = 11 Electrochromic n = 8 Reference n = 15
Heat
1 (Least sensitive) 9% 13% 7%
2 0% 25% 7%
3 27% 13% 27%
4 18% 13% 40%
5 (Very sensitive) 36% 38% 13%
No response 9% 0% 7%
Gloominess
1 (Least sensitive) 0% 0% 7%
2 9% 13% 13%
3 27% 38% 20%
4 9% 25% 40%
5 (Very sensitive) 55% 25% 13%
No response 0% 0% 7%
When you perform your work tasks, what is your preferred light level in your workspace?
1 (Very low) 0% 0% 0%
2 (Low) 18% 13% 7%
3 (Moderate) 18% 13% 47%
4 (Bright) 45% 75% 40%
5 (Very bright) 18% 0% 0%
No response 0% 0% 7%
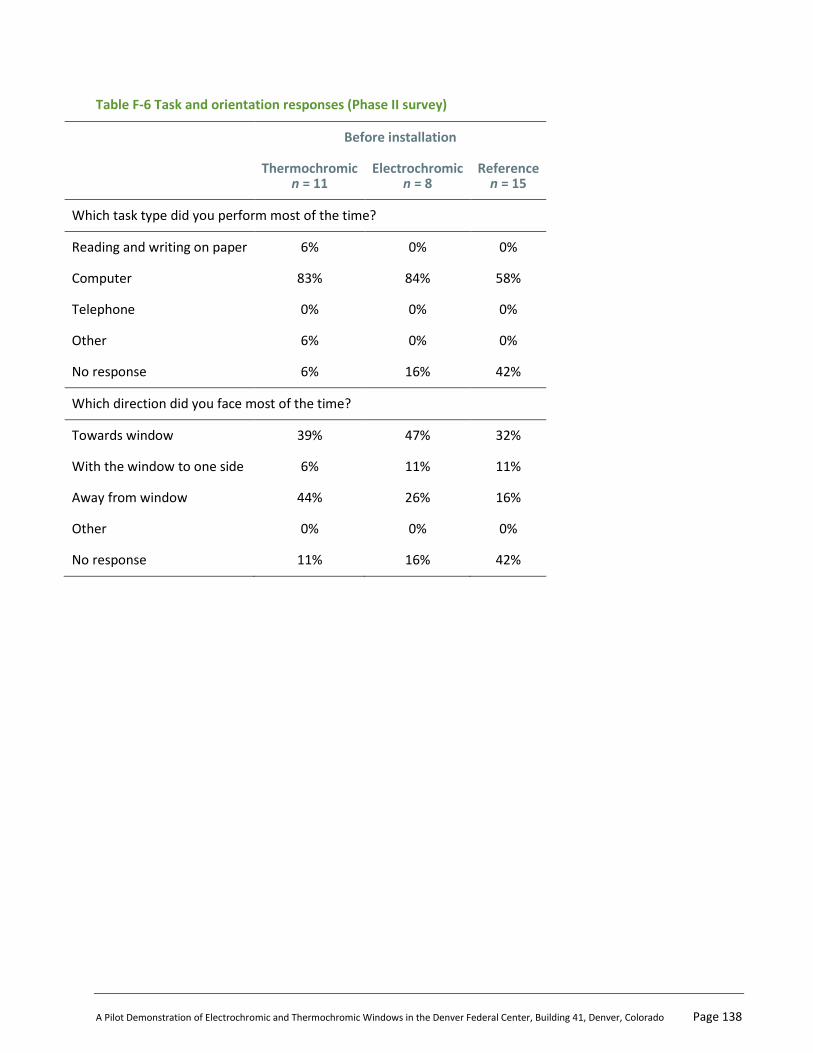
A Pilot Demonstration of Electrochromic and Thermochromic Windows in the Denver Federal Center, Building 41, Denver, Colorado Page 138
Table F-6 Task and orientation responses (Phase II survey)
Before installation
Thermochromic
n = 11 Electrochromic
n = 8 Reference
n = 15
Which task type did you perform most of the time?
Reading and writing on paper 6% 0% 0%
Computer 83% 84% 58%
Telephone 0% 0% 0%
Other 6% 0% 0%
No response 6% 16% 42%
Which direction did you face most of the time?
Towards window 39% 47% 32%
With the window to one side 6% 11% 11%
Away from window 44% 26% 16%
Other 0% 0% 0%
No response 11% 16% 42%

A Pilot Demonstration of Electrochromic and Thermochromic Windows in the Denver Federal Center, Building 41, Denver, Colorado Page 139
I. APPENDIX G: SUMMARY OF MONITORED DATA
Monitored data from indoor and outdoor sensors were logged using separate data acquisition systems. A
redundant set of outdoor measurements were taken using a second data acquisition system to guard
against loss of data due to the frequent thunderstorms that occurred in Denver. Data from the loggers and
from the electrochromic manufacturer were transmitted via cellular network on a nightly basis to LBNL for
analysis. Data from the HVAC vendor were transmitted to LBNL via email separately on a weekly basis.
The following sensors were used to make the measurements:
Temperature: Thermistors, YSI 44016, ±0.1°C
Wind speed and direction: Anemometer, Onset S-WCA-M003, ±5° for direction, greater of ±1.1 m/s or
4% of reading for speed
Solar radiation or irradiance: Pyranometer, LI-COR LI-200, ±5% of reading
Illuminance: Photometer, LI-COR LI-210, ±5% of reading
The following table provides details on the installed locations of the sensors. Data were sampled and
recorded one time per minute, 24/7, over the entire monitored period.
Table G-1 Sensors
Sensor Approximate location
Interior Measurements
Electrochromic window
Vertical irradiance (Upper pane) 11 inches down from upper window top edge, 11 inches from west window edge
Vertical irradiance (Lower pane) 11 inches down from lower window top edge, 11 inches from west window edge
Interior Glass Temp (Upper pane) 10 inches down from upper window top edge, 8 inches from west window edge
Interior Glass Temp (Lower pane) 10 inches down from lower window top edge, 8 inches from west window edge
Interior Frame Temp 8 inches from west window jamb on horizontal muntin
Vertical illuminance (Lower pane) 10.5 inches down from top edge , 11 inches from east window edge
Thermochromic window
Vertical irradiance (Upper pane) 10 inches down from upper window top edge, 12.5 inches from west window edge
Vertical irradiance (Lower pane) 10 inches down from lower window top edge, 12.5 inches from west window edge

A Pilot Demonstration of Electrochromic and Thermochromic Windows in the Denver Federal Center, Building 41, Denver, Colorado Page 140
Sensor Approximate location
Interior Glass Temp (Upper pane) 10.5 inches down from upper window top edge, 8 inches from west window edge
Interior Glass Temp (Lower pane) 10.5 inches down from lower window top edge, 8 inches from west window edge
Interior Frame Temp 8 inches from west window jamb on horizontal muntin
Interior Ambient Temp 1 ft. from ceiling, 2 ft. from window wall
Vertical illuminance (Lower pane) 10 inches down from lower window top edge, 10 inches from east window edge
Exterior Measurements-Primary data acquisition unit
Dry-bulb temperature 7.5 ft. from wall, 30 inches above roof
Dry-bulb temperature 6 ft. from wall, 30 inches above roof
Vertical irradiance Upper EC 11 inches from top window edge
Vertical irradiance Lower EC 11 inches from bottom window edge
Vertical illuminance EC 11 inches from bottom window edge
Global Horizontal irradiance Top of stair railing, lower roof
Dry-bulb temperature 12 ft. from wall, 30 inches above roof
Exterior TC Glass Temp Upper 10.5 inches down from upper window top edge, 8 inches from west window edge
Exterior TC Glass Temp Lower 10.5 inches down from lower window top edge, 8 inches from west window edge
Vertical irradiance Upper TC 11 inches from top window edge
Vertical irradiance Lower TC 11 inches from bottom window edge
Vertical illuminance TC 11 inches from bottom window edge
Exterior Measurements-Secondary data acquisition unit
Vertical irradiance EC 11 inches from bottom window edge
Vertical irradiance TC 11 inches from bottom window edge
Exterior TC Glass Temp Lower 10.5 inches down from lower window top edge, 8 inches from west window edge
Wind speed and direction 1.5 ft. from wall, 48 inches above roof

A Pilot Demonstration of Electrochromic and Thermochromic Windows in the Denver Federal Center, Building 41, Denver, Colorado Page 141
Sensor Approximate location
Dry-bulb temperature 6 ft. from wall, 30 inches above roof
Global Horizontal irradiance Top of stair railing, lower roof
Vertical illuminance EC 11 inches from bottom window edge
Vertical illuminance TC 11 inches from bottom window edge