a pilot of the jolly phonics programme in the teaching of...
TRANSCRIPT
A pilot of the Jolly Phonics
programme in the teaching of
reading and writing of English in
Ghana
ii
1 Contents
Tables and Figures ........................................................................................................................................................... iii
Abbreviations ................................................................................................................................................................... iv
Acknowledgements .......................................................................................................................................................... iv
About Universal Learning Solutions ................................................................................................................................. iv
1 Introduction .............................................................................................................................................................. 5
1.1 Aims and objectives .......................................................................................................................................... 5
1.2 Overview of Jolly Phonics programme .............................................................................................................. 5
1.3 Overview of Jolly Phonics pilot in Ghana .......................................................................................................... 5
2 Methodology ............................................................................................................................................................. 6
3 Results and discussion .............................................................................................................................................. 7
3.1 Profile of respondents....................................................................................................................................... 7
3.2 Summary of results: Class 1 .............................................................................................................................. 8
3.2.1 Did the pupils taught using Jolly Phonics outperform those at the control schools? .............................. 8
3.2.2 Did all groups of pupils perform better?................................................................................................. 12
3.3 Summary of results: KG1 ................................................................................................................................. 13
3.3.1 Did the pupils taught using Jolly Phonics make more progress than those at the control schools? ...... 13
3.3.2 Did all groups of pupils perform better?................................................................................................. 14
3.4 Other findings ................................................................................................................................................. 15
3.4.1 Local language ......................................................................................................................................... 15
3.4.2 Greater enthusiasm for literacy teaching and learning .......................................................................... 15
4 Challenges ............................................................................................................................................................... 16
5 Conclusions ............................................................................................................................................................. 17
6 Recommendations .................................................................................................................................................. 18
Appendix A: List of pilots ................................................................................................................................................ 19
Appendix B: Contents of Jolly Phonics Starter Kit ....................................................................................................... 20
Appendix C: Raw data ................................................................................................................................................. 21
Profile of respondents ............................................................................................................................................. 21
Tabulated assessment results: KG 1 ........................................................................................................................ 21
Tabulated assessment results: Class 1 .................................................................................................................... 22

iii
Tables and Figures
Table 4.1: No. of respondents .......................................................................................................................................... 7
Table 4.2: Total average relative scores: Class 1 .............................................................................................................. 8
Figure 4.1: % of respondents who spoke English at home ............................................................................................... 7
Figure 4.2: Main languages spoken at home .................................................................................................................... 8
Figure 4.3: Literacy scores for each assessment: Class 1 .................................................................................................. 9
Figure 4.4: Number of letter sounds correctly identified: Class 1 .................................................................................... 9
Figure 4.5: Burt Reading test: raw score and Figure 4.6: Mean reading age (in months) ......................................... 10
Figure 4.7: Sentence reading score ................................................................................................................................. 10
Figure 4.8: Number of words written correctly .............................................................................................................. 11
Figure 4.9: Listening comprehension score .................................................................................................................... 11
Figure 4.10: Comparison of literacy score: gender ......................................................................................................... 12
Figure 4.11: Comparison of literacy score: main language spoken at home .................................................................. 12
Figure 4.12: Number of letter sounds correctly identified: KG 1.................................................................................... 13
Figure 4.13: No of words read correctly at the experimental and control schools: KG1 ............................................... 14
Figure 4.14: Comparison of letter sound knowledge by gender and English spoken at home: KG1 ............................. 14
Figure 4.15: Comparison of whole word reading by gender and English spoken at home: KG1 ................................... 15
iv
Abbreviations ECD Early Childhood Development
EGRA Early Grade Reading Assessment
GES Ghana Education Service
NALAP National Accelerated Literacy Programme
ULS Universal Learning Solutions
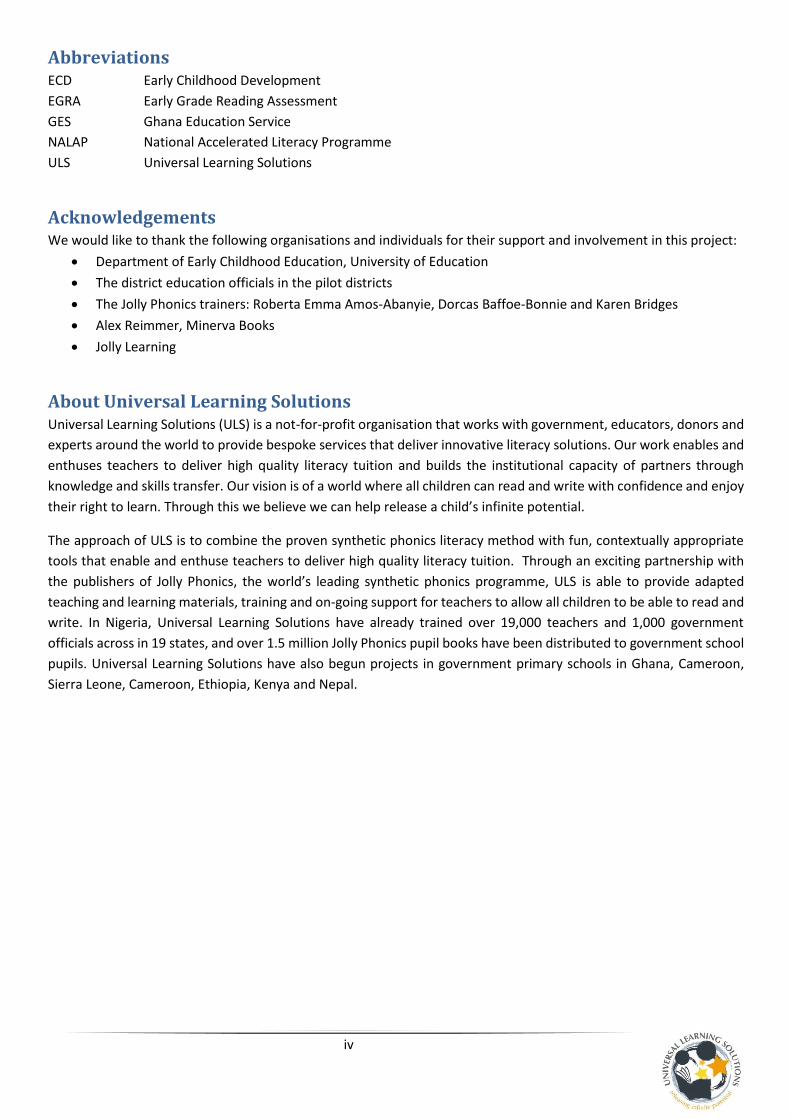
Acknowledgements We would like to thank the following organisations and individuals for their support and involvement in this project:
Department of Early Childhood Education, University of Education
The district education officials in the pilot districts
The Jolly Phonics trainers: Roberta Emma Amos-Abanyie, Dorcas Baffoe-Bonnie and Karen Bridges
Alex Reimmer, Minerva Books
Jolly Learning
About Universal Learning Solutions Universal Learning Solutions (ULS) is a not-for-profit organisation that works with government, educators, donors and
experts around the world to provide bespoke services that deliver innovative literacy solutions. Our work enables and
enthuses teachers to deliver high quality literacy tuition and builds the institutional capacity of partners through
knowledge and skills transfer. Our vision is of a world where all children can read and write with confidence and enjoy
their right to learn. Through this we believe we can help release a child’s infinite potential.
The approach of ULS is to combine the proven synthetic phonics literacy method with fun, contextually appropriate
tools that enable and enthuse teachers to deliver high quality literacy tuition. Through an exciting partnership with
the publishers of Jolly Phonics, the world’s leading synthetic phonics programme, ULS is able to provide adapted
teaching and learning materials, training and on-going support for teachers to allow all children to be able to read and
write. In Nigeria, Universal Learning Solutions have already trained over 19,000 teachers and 1,000 government
officials across in 19 states, and over 1.5 million Jolly Phonics pupil books have been distributed to government school
pupils. Universal Learning Solutions have also begun projects in government primary schools in Ghana, Cameroon,
Sierra Leone, Cameroon, Ethiopia, Kenya and Nepal.

5
1 Introduction
1.1 Aims and objectives The aim of this evaluation was to assess the impact of the Jolly Phonics programme on early grade reading outcomes,
which has been piloted in the teaching of reading and writing of English in government primary schools in Ghana.
Specifically, the objectives of the evaluation were to:
1. To determine if the synthetic phonics approach of teaching reading and writing of English, and specifically the
Jolly Phonics programme, leads to faster progress in the pupils’ reading and writing ability in English than those
pupils not taught using the programme.
2. To determine whether the Jolly Phonics programme is effective for all student groups (gender, ECD experience
and language spoken at home).
1.2 Overview of Jolly Phonics programme With Jolly Phonics the pupils are first taught the letter sounds of English (so the sounds of the letters, not their names).
They are then taught how to ʻblendʼ those sounds together to read words (so d-o-g makes ʻdogʼ). In this way the
spoken word ʻdogʼ is made, or synthesised (hence synthetic’ phonics). It gives children the ability to read out new
words for themselves. It also enables them to write words by segmenting the word into its sounds, and then writing
the letters for those sounds. Pupils are then taught “tricky words” that do not follow the sound system. The letter
sounds are taught alongside culturally appropriate stories, songs, and actions that make learning the sounds both
memorable and fun.
The Jolly Phonics programme has now been used for over 20
years and has been endorsed for use in all schools in countries
such as the Gambia and Trinidad and Tobago and
recommended by the government in other countries, such as
the UK and Nigeria. It also used in government schools in
countries as diverse as Cameroon, Sierra Leone, Kenya,
Uganda, Nepal, India, Mexico, Seychelles, Philippines and Fiji.
1.3 Overview of Jolly Phonics pilot in Ghana The Jolly Phonics programme has been piloted in 6 government schools per district, within 11 districts covering all of
the regions of Ghana apart from Volta. The first of these pilots was initiated in May 2013. For these pilots Jolly Learning
has philanthropically provided 60 Jolly Phonics Starter Kits, 4,800 Pupil Books and funded training for the teachers and
headteachers in the pilot schools as well as the district education officials. The market value of these materials and
training is £30,000, and these pilots have reached approximately 3,000 children. These pilots have been implemented
in close partnership and collaboration with the relevant district education officials. Due to the positive impact on
pupils’ literacy levels and the strong uptake of the programme, many districts have now
extended the programme beyond the pilot schools with over 250 government schools
using the programme and approximately 1,000 teachers having been trained. Two
additional districts have also now begun to use the programme. A list of the districts
involved in the pilots is given in Appendix A.
At the beginning of each pilot 2 days of training in Jolly Phonics was given and was typically attended by the KG1 to
Class 3 teachers and head teacher from each of the pilot schools as well as the district education officials. This training
covered the key skills of the Jolly Phonics programme. Each school was given a Jolly Phonics Starter Kit (see Appendix
B for contents) and one set of Jolly Phonics Pupil Books 1 and 2 and the Jolly Phonics Teacher Book.
“I have attended a lot of
workshops but none of
them as rich and
resourceful as this.”
Teacher, Ahafo Ano South

6
2 Methodology The assessment of the impact of the Jolly Phonics programme on pupils’ literacy levels was focused on KG1 and Class
1 to provide a cross section of the age groups using the programme. The evaluation was also conducted across a range
of districts and types of schools using the programme. The evaluation in KG1 was conducted in the Catholic schools in
Western region and government schools in Bolgatanga, Upper East. At Class 1 the evaluation was conducted in the
government schools in Ahafo Ano South, Ashanti region and the Catholic schools in Western region. In Bolgatanga and
the Western region the Jolly Phonics training took place in September and October 2014 respectively. In Ahafo Ano
South, the training took place the previous academic year in January 2013.
At the schools where the teachers had received training in Jolly Phonics and had the Jolly Phonics materials, the
experimental schools, teachers used the Jolly Phonics programme as part of their literacy lessons. At the schools not
using the Jolly Phonics programme, the control schools, the teachers were wholly using the literacy programme
provided by Ghana Education Service (GES).
The evaluation and assessments were undertaken by the Department of Early Childhood Education at the University
of Education, Winneba. In each of the evaluations, a sample number of pupils were randomly selected from both
schools using Jolly Phonics (experimental schools) and those schools that were not (control schools). The control
schools were selected to be as demographically similar to the experimental schools and be located closely to the
experimental schools. In the KG1 classes, a baseline assessment was undertaken in November 2014 and an end-line
assessment conducted in June 2015. Unfortunately due to the Jolly Phonics programme already having been used in
Ahafo Ano South the previous academic year (2013/14), it was not possible to conduct a baseline assessment at Class
1. Therefore for Class 1 just an end-line assessment was conducted in July 2015 in both the control and experimental
schools.
The literacy assessments used combined elements of the Early Grade Reading Assessment (EGRA) and Burt Reading
test. At KG1 pupils were tested in their letter sounds knowledge and whole word reading, whereas at Class 1 the full
assessment was conducted with the following literacy skills being assessed:
Letter sounds
Whole word reading
Sentence reading
Word writing
Listening comprehension
A context interview was also undertaken with each pupil to ascertain age, gender, poverty indicators, language(s)
spoken at home, whether English is spoken at home and ECD experience.
7
3 Results and discussion
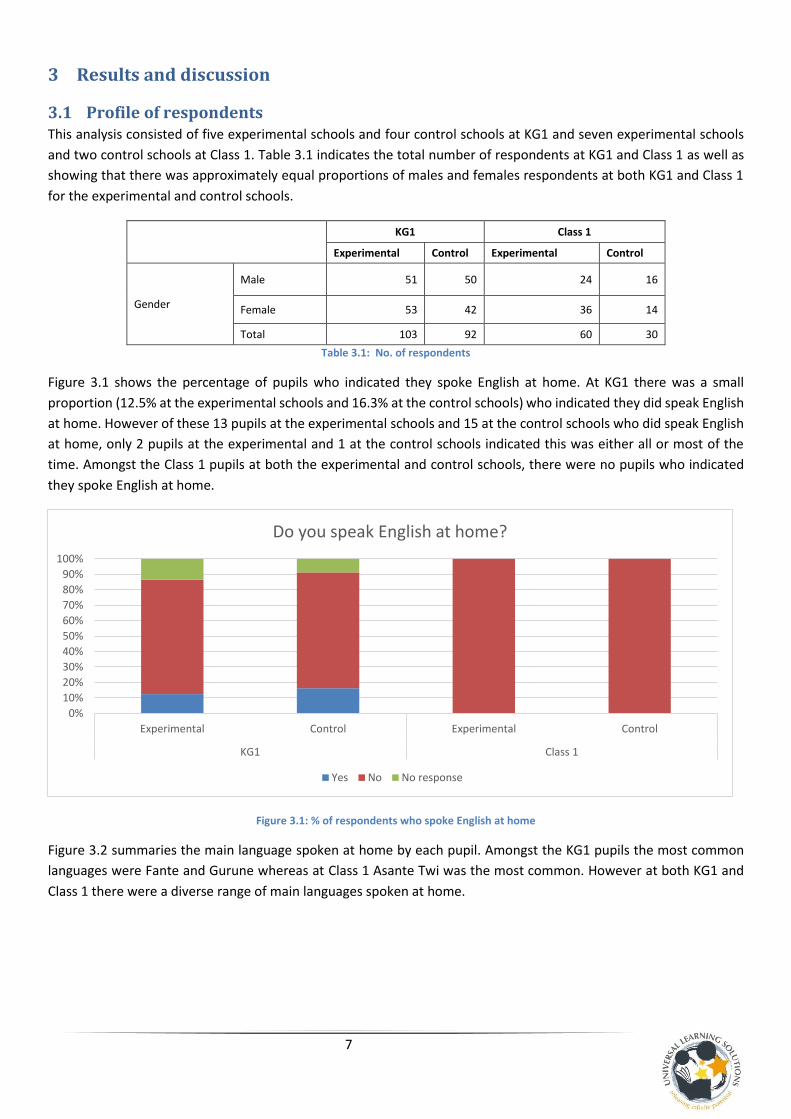
3.1 Profile of respondents This analysis consisted of five experimental schools and four control schools at KG1 and seven experimental schools
and two control schools at Class 1. Table 3.1 indicates the total number of respondents at KG1 and Class 1 as well as
showing that there was approximately equal proportions of males and females respondents at both KG1 and Class 1
for the experimental and control schools.
KG1 Class 1
Experimental Control Experimental Control
Gender
Male 51 50 24 16
Female 53 42 36 14
Total 103 92 60 30
Table 3.1: No. of respondents
Figure 3.1 shows the percentage of pupils who indicated they spoke English at home. At KG1 there was a small
proportion (12.5% at the experimental schools and 16.3% at the control schools) who indicated they did speak English
at home. However of these 13 pupils at the experimental schools and 15 at the control schools who did speak English
at home, only 2 pupils at the experimental and 1 at the control schools indicated this was either all or most of the
time. Amongst the Class 1 pupils at both the experimental and control schools, there were no pupils who indicated
they spoke English at home.
Figure 3.1: % of respondents who spoke English at home
Figure 3.2 summaries the main language spoken at home by each pupil. Amongst the KG1 pupils the most common
languages were Fante and Gurune whereas at Class 1 Asante Twi was the most common. However at both KG1 and
Class 1 there were a diverse range of main languages spoken at home.
0%
10%
20%
30%
40%
50%
60%
70%
80%
90%
100%
Experimental Control Experimental Control
KG1 Class 1
Do you speak English at home?
Yes No No response

8
Figure 3.2: Main languages spoken at home
3.2 Summary of results: Class 1
3.2.1 Did the pupils taught using Jolly Phonics outperform those at the control schools?
The following section analyses the results of the literacy assessments conducted
with the Class 1 pupils. Firstly the overall results for the experimental and control
schools will be compared and then each specific assessed literacy skill will be
discussed in turn.
Table 3.2 and Figure 3.3 shows the relative post-test score for each assessed
literacy skill and the overall mean score for the experimental and control schools.
Since the maximum score for each section of the literacy assessment was not the
same, the score for each section was multiplied by the relevant factor to give a
score out of 100. These relative scores then allowed the score for each section to
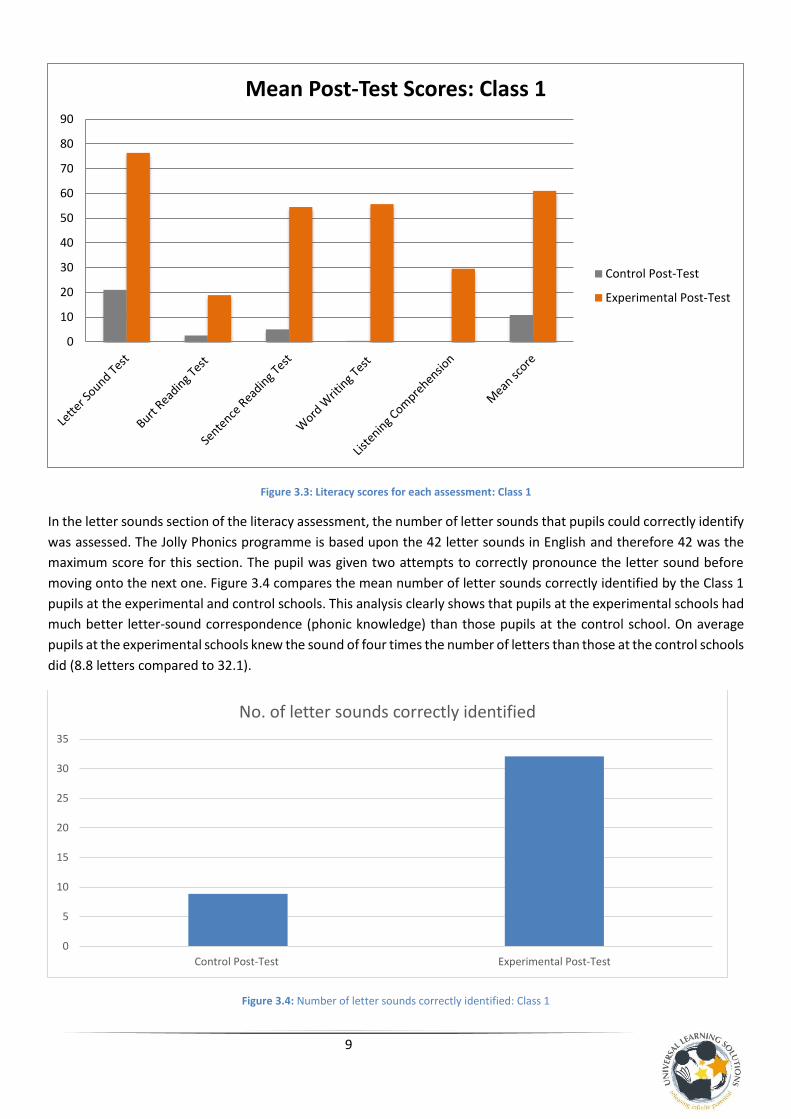
be compared. From Table 3.2 and Figure 3.3 it is clear that the pupils at the experimental schools outperformed the
pupils at the control schools markedly for every assessed literacy skill. This demonstrates that pupils taught using the
Jolly Phonics programme had a better literacy ability on average than those not taught using the programme.
Group
Relative score (out of 100)
Letter Sound Test
Burt Reading Test
Sentence Reading Test
Word Writing Test
Listening Comprehension
Mean score
Control 21.03 2.55 5.00 0.33 0.00 10.80
Experimental 76.35 18.89 54.51 55.66 29.55 60.99
Table 3.2: Total average relative scores: Class 1
0%
20%
40%
60%
80%
100%
Experimental Control
Main home language: KG1 (Western and Bolagantga)
English Fante Gurune
Ahanta/Fante Other No response
0%
20%
40%
60%
80%
100%
Experimental Control
Main home language: Class 1 (Ahafo Ano South and Western)
Asante Twi Dagati Fante Other
“It has been a wonderful experience
using and working with Jolly Phonics
and the programme has helped me
to achieve outstanding results in my
reception class. Even struggling
children are able to catch up with the
rest of the class in very little time. We
have not had a dull moment with
Jolly Phonics, it is interactive and
enjoyable for children!” Teacher,
Ahafo Ano South
9
Figure 3.3: Literacy scores for each assessment: Class 1
In the letter sounds section of the literacy assessment, the number of letter sounds that pupils could correctly identify
was assessed. The Jolly Phonics programme is based upon the 42 letter sounds in English and therefore 42 was the
maximum score for this section. The pupil was given two attempts to correctly pronounce the letter sound before
moving onto the next one. Figure 3.4 compares the mean number of letter sounds correctly identified by the Class 1
pupils at the experimental and control schools. This analysis clearly shows that pupils at the experimental schools had
much better letter-sound correspondence (phonic knowledge) than those pupils at the control school. On average
pupils at the experimental schools knew the sound of four times the number of letters than those at the control schools
did (8.8 letters compared to 32.1).
Figure 3.4: Number of letter sounds correctly identified: Class 1
0
10
20
30
40
50
60
70
80
90
Mean Post-Test Scores: Class 1
Control Post-Test
Experimental Post-Test
0
5
10
15
20
25
30
35
Control Post-Test Experimental Post-Test
No. of letter sounds correctly identified
10
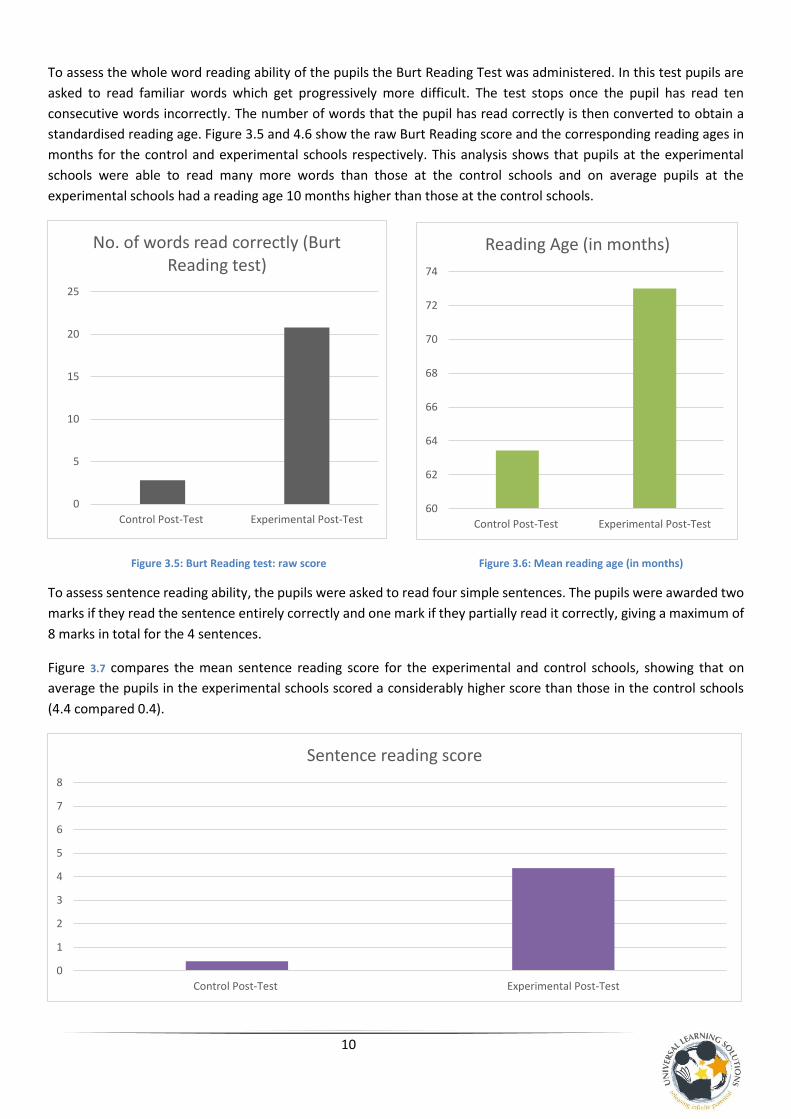
To assess the whole word reading ability of the pupils the Burt Reading Test was administered. In this test pupils are
asked to read familiar words which get progressively more difficult. The test stops once the pupil has read ten
consecutive words incorrectly. The number of words that the pupil has read correctly is then converted to obtain a
standardised reading age. Figure 3.5 and 4.6 show the raw Burt Reading score and the corresponding reading ages in
months for the control and experimental schools respectively. This analysis shows that pupils at the experimental
schools were able to read many more words than those at the control schools and on average pupils at the
experimental schools had a reading age 10 months higher than those at the control schools.
Figure 3.5: Burt Reading test: raw score Figure 3.6: Mean reading age (in months)
To assess sentence reading ability, the pupils were asked to read four simple sentences. The pupils were awarded two
marks if they read the sentence entirely correctly and one mark if they partially read it correctly, giving a maximum of
8 marks in total for the 4 sentences.
Figure 3.7 compares the mean sentence reading score for the experimental and control schools, showing that on
average the pupils in the experimental schools scored a considerably higher score than those in the control schools
(4.4 compared 0.4).
0
5
10
15
20
25
Control Post-Test Experimental Post-Test
No. of words read correctly (Burt Reading test)
60
62
64
66
68
70
72
74
Control Post-Test Experimental Post-Test
Reading Age (in months)
0
1
2
3
4
5
6
7
8
Control Post-Test Experimental Post-Test
Sentence reading score

11
Figure 3.7: Sentence reading score
The pupils’ word reading ability was assessed by asking the pupils to write 10 simple words, with one mark being
awarded for each word written correctly. Figure 3.8 compares the mean number of words written correctly by the
pupils at the experimental and control schools. On average pupils at the experimental schools could on average write
5.57 words correctly compared to the average pupil at the control schools reading 0.03 words correctly.
Figure 3.8: Number of words written correctly
To assess the pupils’ listening comprehension, the pupils were read a short passage by the assessor and then answered
four questions orally on the passage. One mark was awarded for each correct answer, giving a maximum of 4 marks.
Figure 3.9 compares the listening comprehension scores at the experimental and control schools and shows the mean
scores were 2.4 and 0 respectively. On average with pupils at the experimental schools able to answer more than 2
questions correctly compared to the pupils at the control schools not answering any of the questions correctly,
demonstrates the improvement in listening comprehension the Jolly Phonics programme caused.
Figure 3.9: Listening comprehension score
0
1
2
3
4
5
6
7
8
9
10
Control Post-Test Experimental Post-Test
Number of words correctly written
0
1
2
3
4
Control Post-Test Experimental Post-Test
Listening comprehension score
12
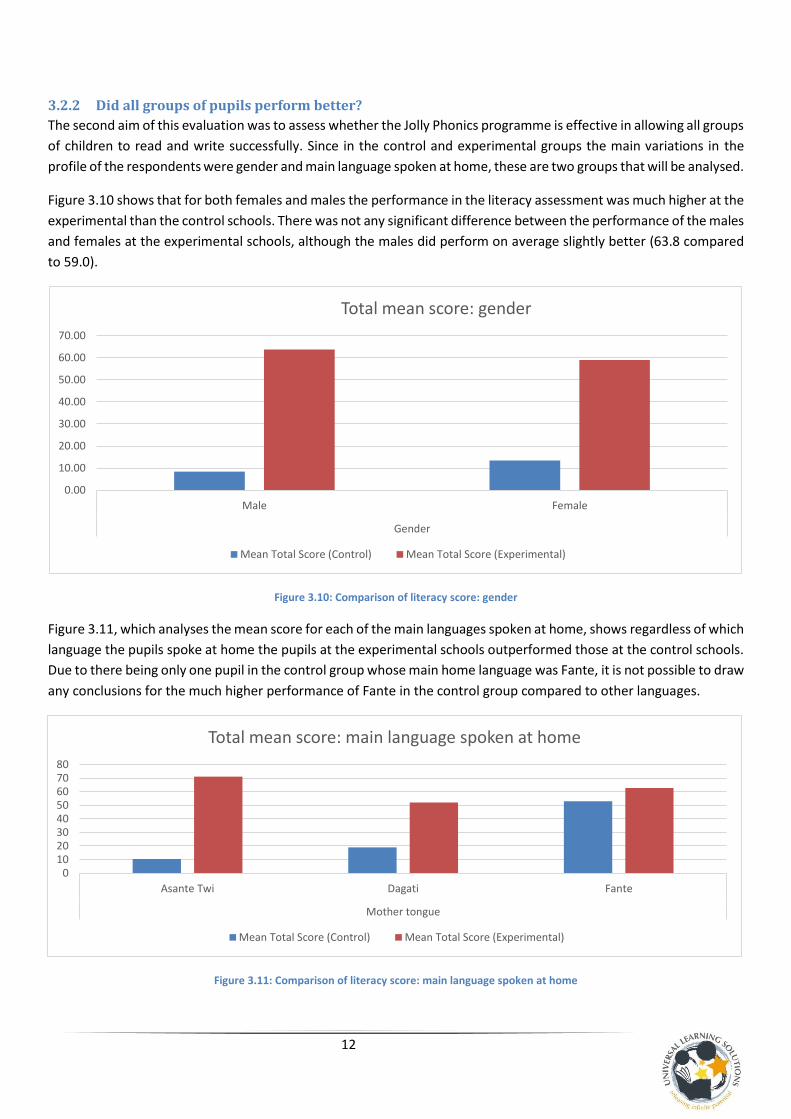
3.2.2 Did all groups of pupils perform better?
The second aim of this evaluation was to assess whether the Jolly Phonics programme is effective in allowing all groups
of children to read and write successfully. Since in the control and experimental groups the main variations in the
profile of the respondents were gender and main language spoken at home, these are two groups that will be analysed.
Figure 3.10 shows that for both females and males the performance in the literacy assessment was much higher at the
experimental than the control schools. There was not any significant difference between the performance of the males
and females at the experimental schools, although the males did perform on average slightly better (63.8 compared
to 59.0).
Figure 3.10: Comparison of literacy score: gender
Figure 3.11, which analyses the mean score for each of the main languages spoken at home, shows regardless of which
language the pupils spoke at home the pupils at the experimental schools outperformed those at the control schools.
Due to there being only one pupil in the control group whose main home language was Fante, it is not possible to draw
any conclusions for the much higher performance of Fante in the control group compared to other languages.
Figure 3.11: Comparison of literacy score: main language spoken at home
0.00
10.00
20.00
30.00
40.00
50.00
60.00
70.00
Male Female
Gender
Total mean score: gender
Mean Total Score (Control) Mean Total Score (Experimental)
01020304050607080
Asante Twi Dagati Fante
Mother tongue
Total mean score: main language spoken at home
Mean Total Score (Control) Mean Total Score (Experimental)
13
3.3 Summary of results: KG1
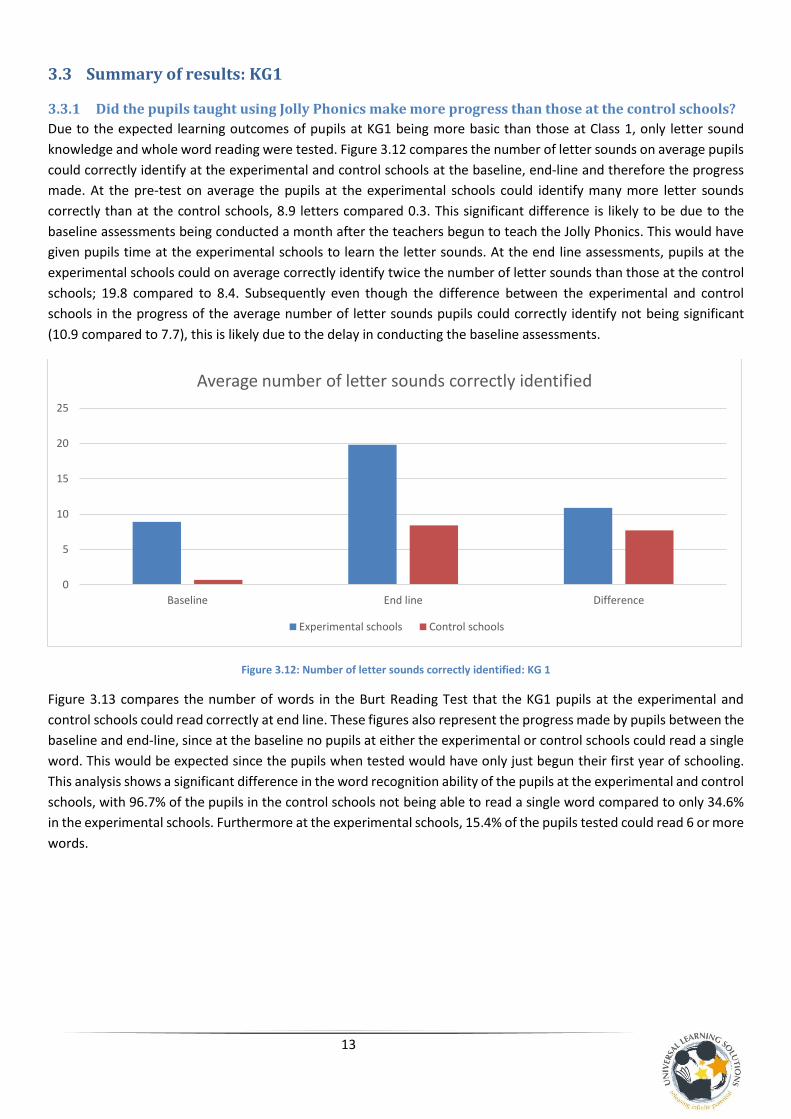
3.3.1 Did the pupils taught using Jolly Phonics make more progress than those at the control schools?
Due to the expected learning outcomes of pupils at KG1 being more basic than those at Class 1, only letter sound
knowledge and whole word reading were tested. Figure 3.12 compares the number of letter sounds on average pupils
could correctly identify at the experimental and control schools at the baseline, end-line and therefore the progress
made. At the pre-test on average the pupils at the experimental schools could identify many more letter sounds
correctly than at the control schools, 8.9 letters compared 0.3. This significant difference is likely to be due to the
baseline assessments being conducted a month after the teachers begun to teach the Jolly Phonics. This would have
given pupils time at the experimental schools to learn the letter sounds. At the end line assessments, pupils at the
experimental schools could on average correctly identify twice the number of letter sounds than those at the control
schools; 19.8 compared to 8.4. Subsequently even though the difference between the experimental and control
schools in the progress of the average number of letter sounds pupils could correctly identify not being significant
(10.9 compared to 7.7), this is likely due to the delay in conducting the baseline assessments.
Figure 3.12: Number of letter sounds correctly identified: KG 1
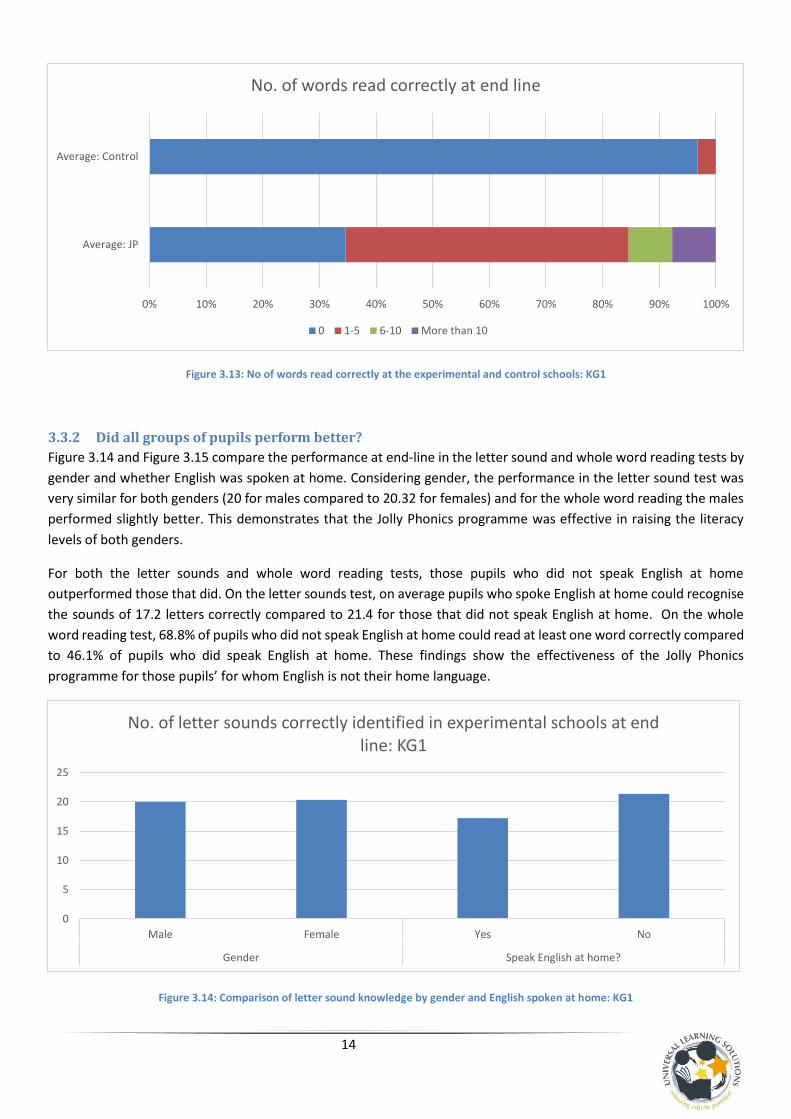
Figure 3.13 compares the number of words in the Burt Reading Test that the KG1 pupils at the experimental and
control schools could read correctly at end line. These figures also represent the progress made by pupils between the
baseline and end-line, since at the baseline no pupils at either the experimental or control schools could read a single
word. This would be expected since the pupils when tested would have only just begun their first year of schooling.
This analysis shows a significant difference in the word recognition ability of the pupils at the experimental and control
schools, with 96.7% of the pupils in the control schools not being able to read a single word compared to only 34.6%
in the experimental schools. Furthermore at the experimental schools, 15.4% of the pupils tested could read 6 or more
words.
0
5
10
15
20
25
Baseline End line Difference
Average number of letter sounds correctly identified
Experimental schools Control schools
14
Figure 3.13: No of words read correctly at the experimental and control schools: KG1
3.3.2 Did all groups of pupils perform better?
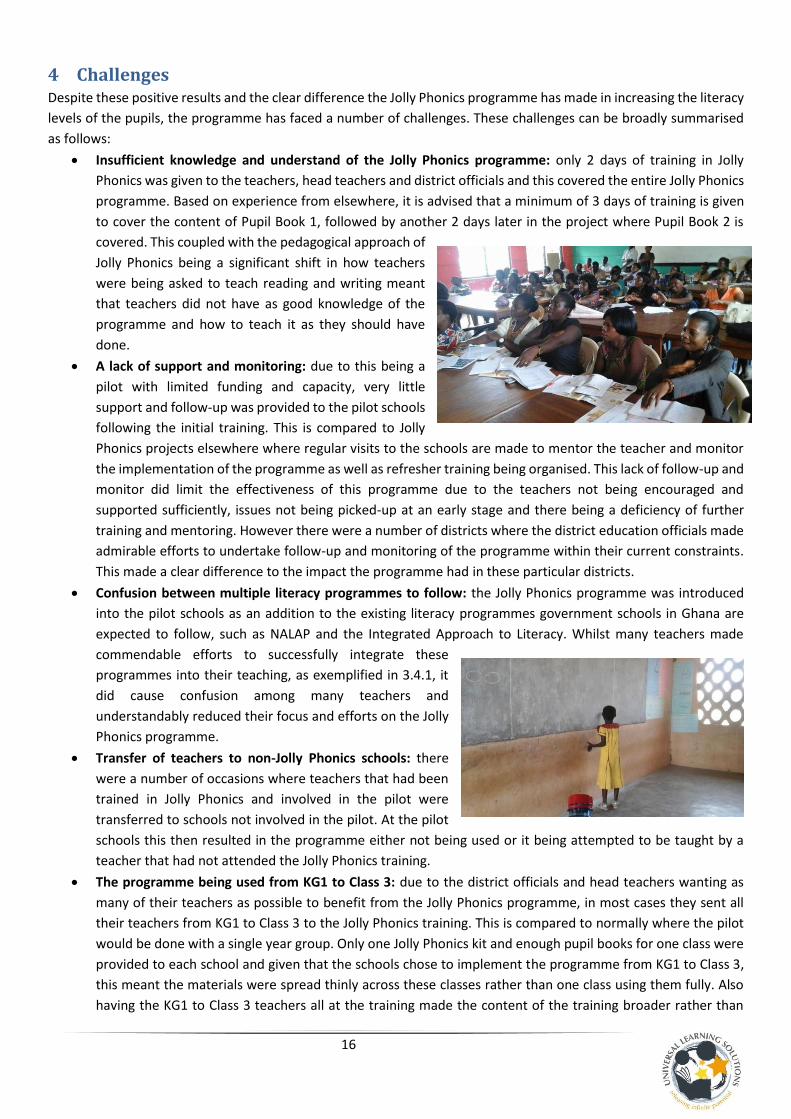
Figure 3.14 and Figure 3.15 compare the performance at end-line in the letter sound and whole word reading tests by
gender and whether English was spoken at home. Considering gender, the performance in the letter sound test was
very similar for both genders (20 for males compared to 20.32 for females) and for the whole word reading the males
performed slightly better. This demonstrates that the Jolly Phonics programme was effective in raising the literacy
levels of both genders.
For both the letter sounds and whole word reading tests, those pupils who did not speak English at home
outperformed those that did. On the letter sounds test, on average pupils who spoke English at home could recognise
the sounds of 17.2 letters correctly compared to 21.4 for those that did not speak English at home. On the whole
word reading test, 68.8% of pupils who did not speak English at home could read at least one word correctly compared
to 46.1% of pupils who did speak English at home. These findings show the effectiveness of the Jolly Phonics
programme for those pupils’ for whom English is not their home language.
Figure 3.14: Comparison of letter sound knowledge by gender and English spoken at home: KG1
0% 10% 20% 30% 40% 50% 60% 70% 80% 90% 100%
Average: JP
Average: Control
No. of words read correctly at end line
0 1-5 6-10 More than 10
0
5
10
15
20
25
Male Female Yes No
Gender Speak English at home?
No. of letter sounds correctly identified in experimental schools at end line: KG1

15
Figure 3.15: Comparison of whole word reading by gender and English spoken at home: KG1
3.4 Other findings
3.4.1 Local language
Even though the Jolly Phonics programme is designed and focused on teaching
children to read and write in English, the teachers at the schools involved in the
pilots have also been successfully using the programme in teaching local
language. This has allowed teachers to
integrate the Jolly Phonics programme
into the National Literacy Acceleration Programme (NALAP) and the
Integrated Approach to Literacy.
3.4.2 Greater enthusiasm for literacy teaching and learning
It was found that the fun and multisensory approach of Jolly Phonics which includes actions, songs and stories led to
greater enthusiasm in the teaching and learning of literacy amongst teachers, parents and pupils.
This greater enthusiasm has led to:
Increased student attendance at schools using Jolly Phonics. For
example the Municipal Training Officer, Effutu Municipality
commented “there has been a very high level of enthusiasm from
both the pupils and teachers in the programme and therefore pupils
who used to miss schools under flimsy excuses now do not want to
miss school as a result of the programme”.
Pupils taking their learning in reading and writing beyond the
classroom. For example a teacher from Ahafo Ano South observed “seeing children use the actions to spell
words among themselves during their break periods outside the classroom”.
Parents sending their pupils to schools using the Jolly Phonics programme. For example a school in Accra
attributed its increased enrolment from 90 to 120 once they begun using the Jolly Phonics programme, to the
success the programme was having.
0% 10% 20% 30% 40% 50% 60% 70% 80% 90% 100%
Male
Female
Yes
No
Ge
nd
erSp
eak
Engl
ish
at
ho
me?
No. of words read correctly in experimental schools at end line: KG1
0 1-5 6-10 More than 10
“These same Jolly Phonics sounds have
helped in the teaching of our own local
dialect since almost all the letters have
the same sounds” Teacher, Winneba
district.
“We have been able to implement the
Jolly Phonics programme through the
fusion of the Fante (L1) in teaching the
pupils without any difficulty” Municipal
Training Officer, Effutu Municipality
16
4 Challenges Despite these positive results and the clear difference the Jolly Phonics programme has made in increasing the literacy
levels of the pupils, the programme has faced a number of challenges. These challenges can be broadly summarised
as follows:
Insufficient knowledge and understand of the Jolly Phonics programme: only 2 days of training in Jolly
Phonics was given to the teachers, head teachers and district officials and this covered the entire Jolly Phonics
programme. Based on experience from elsewhere, it is advised that a minimum of 3 days of training is given
to cover the content of Pupil Book 1, followed by another 2 days later in the project where Pupil Book 2 is
covered. This coupled with the pedagogical approach of
Jolly Phonics being a significant shift in how teachers
were being asked to teach reading and writing meant
that teachers did not have as good knowledge of the
programme and how to teach it as they should have
done.
A lack of support and monitoring: due to this being a
pilot with limited funding and capacity, very little
support and follow-up was provided to the pilot schools
following the initial training. This is compared to Jolly
Phonics projects elsewhere where regular visits to the schools are made to mentor the teacher and monitor
the implementation of the programme as well as refresher training being organised. This lack of follow-up and
monitor did limit the effectiveness of this programme due to the teachers not being encouraged and
supported sufficiently, issues not being picked-up at an early stage and there being a deficiency of further
training and mentoring. However there were a number of districts where the district education officials made
admirable efforts to undertake follow-up and monitoring of the programme within their current constraints.
This made a clear difference to the impact the programme had in these particular districts.
Confusion between multiple literacy programmes to follow: the Jolly Phonics programme was introduced
into the pilot schools as an addition to the existing literacy programmes government schools in Ghana are
expected to follow, such as NALAP and the Integrated Approach to Literacy. Whilst many teachers made
commendable efforts to successfully integrate these
programmes into their teaching, as exemplified in 3.4.1, it
did cause confusion among many teachers and
understandably reduced their focus and efforts on the Jolly
Phonics programme.
Transfer of teachers to non-Jolly Phonics schools: there
were a number of occasions where teachers that had been
trained in Jolly Phonics and involved in the pilot were
transferred to schools not involved in the pilot. At the pilot
schools this then resulted in the programme either not being used or it being attempted to be taught by a
teacher that had not attended the Jolly Phonics training.
The programme being used from KG1 to Class 3: due to the district officials and head teachers wanting as
many of their teachers as possible to benefit from the Jolly Phonics programme, in most cases they sent all
their teachers from KG1 to Class 3 to the Jolly Phonics training. This is compared to normally where the pilot
would be done with a single year group. Only one Jolly Phonics kit and enough pupil books for one class were
provided to each school and given that the schools chose to implement the programme from KG1 to Class 3,
this meant the materials were spread thinly across these classes rather than one class using them fully. Also
having the KG1 to Class 3 teachers all at the training made the content of the training broader rather than
17
focusing on the curriculum for a particular year group. This ‘dilution’ of the pilot by it being spread across KG1
to Class 3 is likely to have limited the impact of the programme in a particular class and therefore the results
of the KG1 and Class 1 pupils tested as part of this evaluation.
Uncoordinated expansion of the programme: in a number of the districts where pilots were undertaken, the
district education officials observed in the pilot schools how effective the programme was being in helping
children to read and write and received positive feedback from teachers, parents and head teachers. This
caused the district officials to extend the Jolly Phonics programme to more schools, and in some cases all the
schools in the district. In these cases, it was often the district education officials who delivered the training for
these additional schools. Whilst the initiative of these officials in doing this was very praiseworthy and
encouraging, these officials had only received basic training in Jolly Phonics themselves and were therefore
could not be expected to have the knowledge and experience of the programme to train others. Furthermore
these additional schools were teaching the programme with none of the Jolly Phonics materials. Whilst this
allowed more children to at least benefit to some extent from the Jolly Phonics programme, the
implementation and effectiveness of it was poor. This also presented a challenge for the evaluation since some
schools initially selected as control schools were exposed to the Jolly Phonics programme during the
programme being expanded. More investigation is required to determine how this exposure at the control
schools has impacted the schools and pupils abilities.
5 Conclusions The aim of this project was to pilot the Jolly Phonics programme in the
teaching of reading and writing of English in government primary schools
in Ghana and assess its impact on early grade reading outcomes. Through
this evaluation it has been determined that the synthetic phonics
approach of teaching reading and writing of English, and specifically the
Jolly Phonics programme, leads to greater progress in the pupils’ reading
and writing ability in English than those pupils not taught using the
programme, in both Kindergaten 1 and Class 1. This evaluation has also shown that the Jolly Phonics programme is
effective for all student groups (gender and language spoken at home). Despite this programme being focused on
teaching children to read and write in English, feedback from teachers and
district education officials have indicated that the Jolly Phonics programme
can also be used to successfully teach reading and writing in the local
language. The programme was also found to have increased levels of
enthusiasm in the teaching and learning of literacy among pupils, teachers
and parents and subsequently led to examples of increased attendance of
pupils and even enrolment at schools using the programme as well as pupils
extending their learning to beyond the classroom.
However there have also been some significant challenges faced in this project which are likely to have reduced the
impact this programme has had in the pilot schools. The insufficient training provided in Jolly Phonics initially and the
also the lack of any detailed monitoring and follow-up at the pilot schools has resulted in the teachers having only a
partial knowledge and understanding of the programme. Using the Jolly Phonics programme alongside the current
literacy programmes being used in all government schools, namely NALAP and the Integrated Approach to Literacy,
“Identification of letter sounds using the Jolly
Phonics programme is 100 times better than
our old methods where all the letter names
have to be first taught. To the kids quick word
formation, reading, writing and spelling are
now easy and fun. To me as a teacher, teaching
other subjects aside English is now at ease since
my kids can read anything”. Teacher, Winneba
District
“With my experience as a supervisor for the
Early Childhood Department in the district, I
have realised that Jolly Phonics is performing
reading and spelling magic due to its usage of
a multi- sensory approach to teaching synthetic
phonics.” ECD Coordinator Ahafo Ano South

18
also caused confusion for teachers. There were other challenges
such as the programme being used from KG1 to Class 1 rather than
just in one year group and teachers in the non-pilot schools also
being exposed to the programme. These latter two challenges
were as a result of the head teachers and district education
officials seeing the need for Jolly Phonics and the positive impact
it was having in the pilot schools. Despite this presenting a
challenge in terms of having a rigorous evaluation, this also
demonstrates the strong demand for the Jolly Phonics programme
amongst district education officials, head teachers, teachers and parents. Lastly, the transfer of teachers who had
been trained in Jolly Phonics to non-pilot schools also presented a challenge and compromised the impact of the
programme at some schools.
6 Recommendations This evaluation of the pilot of the Jolly Phonics programme in government schools in Ghana has shown that those KG1
and Class 1 pupils taught using the programme outperformed those that were not across all assessed literacy skills.
Based on these findings it is therefore recommended that the Jolly Phonics
programme should be used in all government schools across Ghana in the
teaching of reading and writing. The findings of this evaluation provide strong
evidence that adopting the Jolly Phonics programme for all schools would lead to
a significant improvement in the early grade literacy rates in Ghana.
However to address the challenges identified in this pilot project, the following is recommended:
Sufficient initial training in the Jolly Phonics programme should be provided at the beginning of the
programme to enable the teachers to teach using the programme successfully. A minimum of 3 days training
has found to be most effective from elsewhere.
A regular programme of refresher training and mentoring and support for the teachers using the Jolly Phonics
programme is implemented, including regular schools visits and ongoing support mechanisms.
Regular and rigorous monitoring of the programme by an external team is implemented as a core part of the
programme. This should include lesson
observations, work scrutiny and discussions with
the head teacher. This will ensure that the teachers
are implementing the programme correctly as well
as providing ongoing recommendations and
improvement.
A more focused programme which begins with a
single year group in each school and then extends
into subsequent classes in the second year of the
programme and beyond. This will ensure that the
materials, training, support and monitoring is focused on a few number of teachers and thus maximise the
effectiveness of the programme.
“Jolly Phonics should be made
compulsory in Ghana especially in our
public schools and it should start
from K. G 1 through to Primary 6”
Teacher, Winneba
19
Appendix A: List of pilots Ahafo Ano South, Ashanti
Cape Coast, Central
Catholic Schools, Greater Accra
New Juaben, Eastern
Catholic Schools, Western
Winneba, Central
Ga West, Greater Accra
Bolgatanga, Upper East
Tamale, Northern
Nkoranza North, Brong-Ahafo
Wa, Upper West
Ga South, Greater Accra (not involved in formal pilot)
Garrison schools in Suyani, Brong Ahafo (not involved in formal pilot)

20
Appendix B: Contents of Jolly Phonics Starter Kit The Phonics Handbook
Jolly Phonics DVD
Jolly Phonics Wall Frieze
Jolly Phonics Letter Sound Strips
Finger Phonics Big Books 1-7
Jolly Phonics Word Book
Jolly Phonics Cards
Jolly Phonics Alternative Spelling and Alphabet Posters
Jolly Phonics Tricky Word Wall Flowers
Jolly Songs
Jolly Readers Level 1 – Complete Set of 18 different storybooks
Jolly Readers Level 2 – Complete Set of 18 different storybooks
In addition to the Jolly Phonics Starter Kit Extended, each school will be provided with:
40 copies Jolly Phonics Pupil Book 1, black-and-white
40 copies Jolly Phonics Pupil Book 2, black-and-white
4 copies Jolly Phonics Teacher’s Book, black-and-white
21
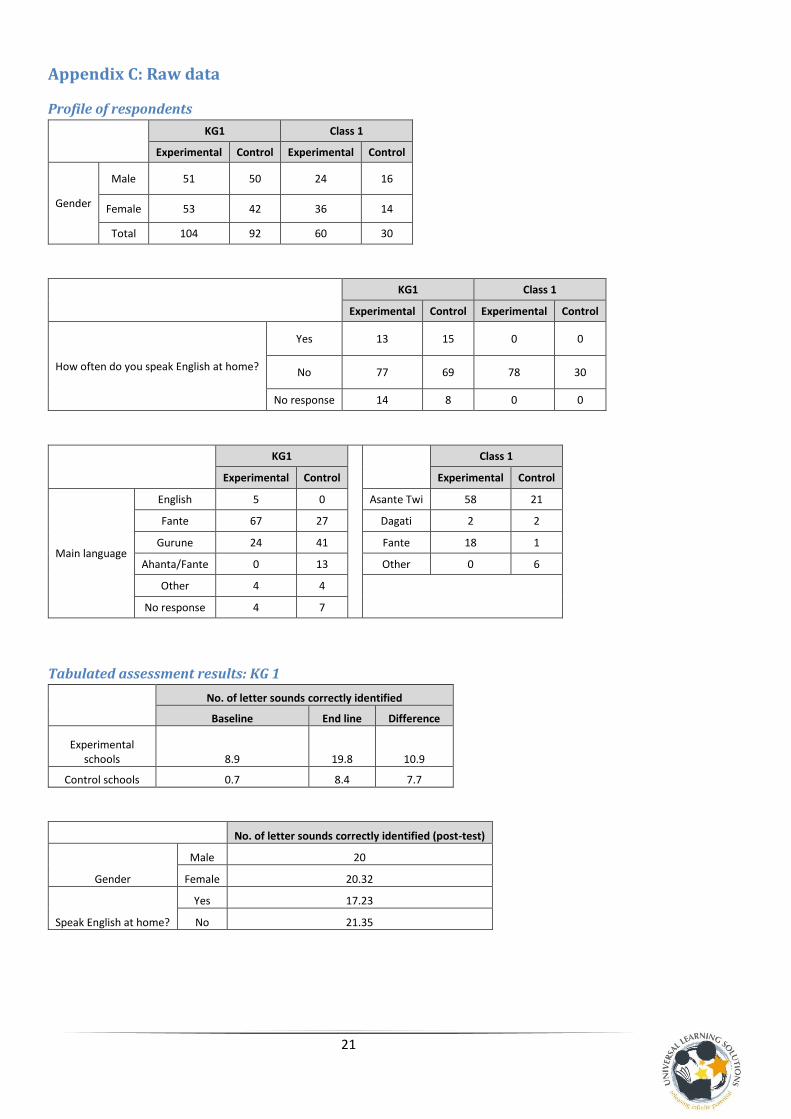
Appendix C: Raw data
Profile of respondents
KG1 Class 1
Experimental Control Experimental Control
Gender
Male 51 50 24 16
Female 53 42 36 14
Total 104 92 60 30
KG1 Class 1
Experimental Control Experimental Control
How often do you speak English at home?
Yes 13 15 0 0
No 77 69 78 30
No response 14 8 0 0
KG1
Class 1
Experimental Control Experimental Control
Main language
English 5 0 Asante Twi 58 21
Fante 67 27 Dagati 2 2
Gurune 24 41 Fante 18 1
Ahanta/Fante 0 13 Other 0 6
Other 4 4
No response 4 7
Tabulated assessment results: KG 1
No. of letter sounds correctly identified
Baseline End line Difference
Experimental schools 8.9 19.8 10.9
Control schools 0.7 8.4 7.7
No. of letter sounds correctly identified (post-test)
Gender
Male 20
Female 20.32
Speak English at home?
Yes 17.23
No 21.35
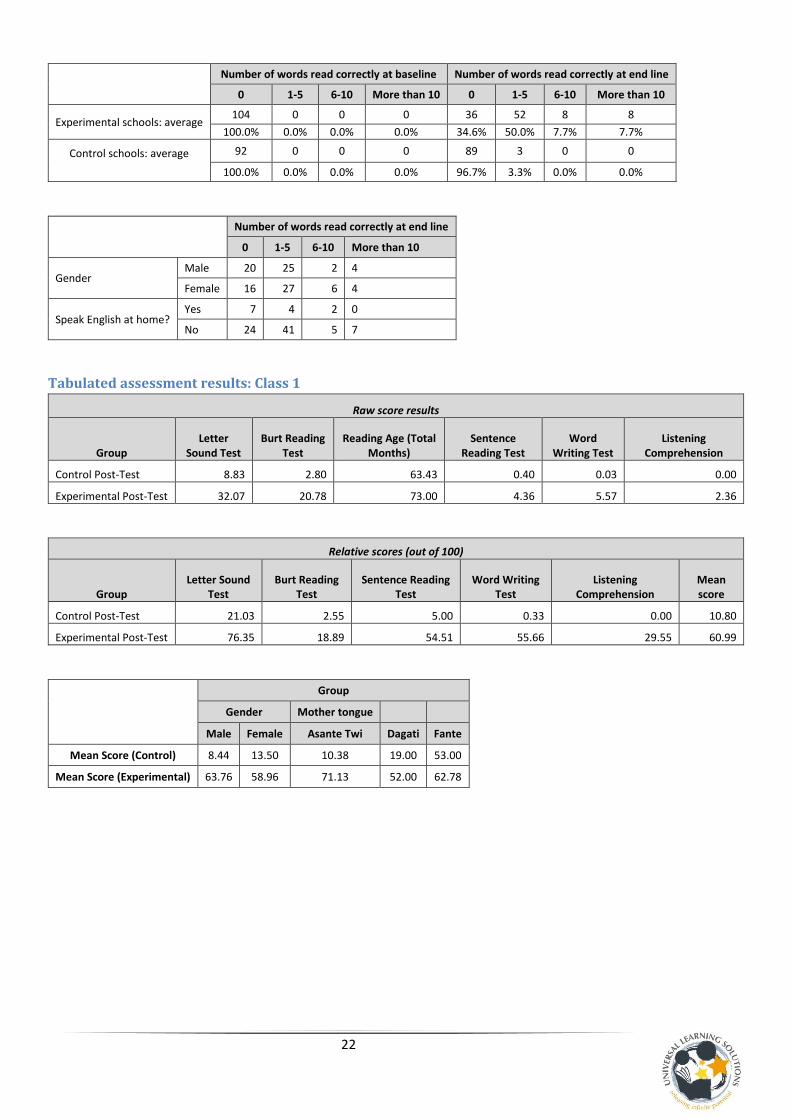
22
Number of words read correctly at baseline Number of words read correctly at end line
0 1-5 6-10 More than 10 0 1-5 6-10 More than 10
Experimental schools: average 104 0 0 0 36 52 8 8
100.0% 0.0% 0.0% 0.0% 34.6% 50.0% 7.7% 7.7%
Control schools: average
92 0 0 0 89 3 0 0
100.0% 0.0% 0.0% 0.0% 96.7% 3.3% 0.0% 0.0%
Number of words read correctly at end line
0 1-5 6-10 More than 10
Gender Male 20 25 2 4
Female 16 27 6 4
Speak English at home? Yes 7 4 2 0
No 24 41 5 7
Tabulated assessment results: Class 1
Raw score results
Group Letter
Sound Test Burt Reading
Test Reading Age (Total
Months) Sentence
Reading Test Word
Writing Test Listening
Comprehension
Control Post-Test 8.83 2.80 63.43 0.40 0.03 0.00
Experimental Post-Test 32.07 20.78 73.00 4.36 5.57 2.36
Relative scores (out of 100)
Group Letter Sound
Test Burt Reading
Test Sentence Reading
Test Word Writing
Test Listening
Comprehension Mean score
Control Post-Test 21.03 2.55 5.00 0.33 0.00 10.80
Experimental Post-Test 76.35 18.89 54.51 55.66 29.55 60.99
Group
Gender Mother tongue
Male Female Asante Twi Dagati Fante
Mean Score (Control) 8.44 13.50 10.38 19.00 53.00
Mean Score (Experimental) 63.76 58.96 71.13 52.00 62.78