a planar electroosmotic micropump - microelectromechanical...
TRANSCRIPT

672 JOURNAL OF MICROELECTROMECHANICAL SYSTEMS, VOL. 11, NO. 6, DECEMBER 2002
A Planar Electroosmotic MicropumpChuan-Hua Chen and Juan G. Santiago
Abstract—Electroosmotic (EO) micropumps use field-inducedion drag to drive liquids and achieve high pressures in a compactdesign with no moving parts. An analytical model applicable toplanar, etched-structure micropumps has been developed. Thismodel consists of pressure and flow relations in addition to ananalytical expression that can be used to estimate the thermody-namic efficiency of planar EO pumps. The analytical model wasapplied to guide the design of a pump consisting of an etched EOflow chamber for near-optimal hydraulic power performance. Toachieve high efficiency, the working fluid used was deionized (DI)water with a conductivity of 3.0 10 4 S/m(pH = 5 7). The EOmicropump was fabricated on a soda-lime glass substrate usingstandard microlithography and chemical wet etching techniques.The active pumping volume of the device consists of a wet-etchedflow channel 1–mm long in the flow direction and 0.9 m by38-mm in cross section. The pump performance agrees wellwith the theoretical model. The pump can produce a maximumpressure of 0.33 atm and a maximum flow rate of 15 L/min minat 1 kV. [791]
Index Terms—Electroosmotic (EO) pump, high pressure, Jouleheating effects, microfabrication, microfluidics, thermodynamicefficiency.
I. INTRODUCTION
E LECTROOSMOTIC (EO) pumping is the motion of bulkliquid caused by the application of an electric field to a
channel with a charged wall. Most surfaces spontaneously ac-quire a finite charge density when in contact with an aqueoussolution [1]. In the case of contact between glass (or silica) andan aqueous electrolyte liquid, the glass surface becomes chargeddue to the deprotonation of surface silanol groups. Fig. 1 shows aschematic representation of the electric double layer that formsas a result of this deprotonation. The charged surface attractscounter-ions and repels co-ions. In a simple model of the chargedistribution, the plane separating the inner immobile layer andthe outer diffuse layer is called the shear plane. The zeta poten-tial ( ) of the double layer is the potential at the shear plane.The thickness of the electrical double layer is on the order ofthe Debye length ( ) of the solution. If an external electricalfield is applied parallel to the dielectric wall, Coulombic forcesare exerted on the mobile ions in the net positive layer abovethe shear plane and the electromigration of these ions forces thebulk liquid motion through viscous interaction, as depicted inFig. 2 [1].
Manuscript received December 20, 2001; revised June 20, 2002. This workwas supported by DARPAR under Contract F33615-99-C-1442. The work ofC.-H. Chen was funded by the William R. and Sara Hart Kimball Stanford Grad-uate Fellowship. Subject Editor A. J. Ricco.
The authors are with the Department of Mechanical Engineering, StanfordUniversity, Stanford, CA 94305 USA (e-mail: [email protected];[email protected]).
Digital Object Identifier 10.1109/JMEMS.2002.805055
Fig. 1. Schematic of the structure of the electric double layer: Glass acquiresa negative surface charge upon contact with an aqueous solution. The surfacecharge attracts dissolved counter-ions and repels co-ions, resulting in a chargeseparation. The zeta potential (�) is the potential at the shear plane and theDebye length (� ) is the characteristic thickness of the double layer. A layerof immobile positive ions immediately adjacent to the wall is called the Sternlayer.
Fig. 2. Basic flow principle of EO pumps: In EO flow, mobile ions in thediffuse counter-ion layer of the electric double layer are driven by an externallyapplied electrical field. These moving ions drag along bulk liquid throughviscous force interaction. The effects of EO and pressure forces on the velocityprofile can be superposed linearly (as shown schematically on the lower right).
High-pressure capacity, millimeter-scale, porous-media-based EO pumps have recently been demonstrated [2], [3]. Apressure capacity of 24 atm has been achieved with a nominalpore diameter of 1.1 m and an applied voltage of 2 kV[3]. High pressures ( 0.1 atm) are desirable in many mi-crosystems such as two-phase convection cooling systems formicroelectronics [4] and liquid dosing systems for bioanalyticalapplications [5]. However, many of the current fabricationtechniques of porous-media EO pumps are not compatible withstandard microfabrication processes and this poses a significantobstacle to the chip-level integration of EO pumps into mi-crosystems. This paper addresses the challenge by fabricatingan EO micropump using standard microelectromechanicalsystems (MEMS) technology. In addition to high pressurecapacity, EO micropumps have several other advantages overother types of microfabricated pumps. First, EO micropumpshave no moving solid parts and have much simpler designs than
1057-7157/02$17.00 © 2002 IEEE

CHEN AND SANTIAGO: PLANAR ELECTROOSMOTIC MICROPUMP 673
typical mechanical micropumps which require componentssuch as check valves and actuated diaphragms [5]. Second,EO micropumps can pump working fluids of a wide range ofconductivity including organic solvents such as acetonitrile( 10 S/m) [3], deionized water (e.g., 10 S/m) [3], [6] andbuffered, high-conductivity aqueous solutions (1 S/m) [7].Pumping of typical biochemical buffer solutions is essentialfor biomedical applications. In contrast, other nonmechanical(field-driven) types of micropumps are typically confined tofluids of narrower range of conductivity. For example, magne-tohydrodynamic micropumps use high conductivity workingliquids (typically 1 S/m) [8] and electrohydrodynamic micro-pumps typically use only low conductivity liquids (typically10 –10 S/m) [9].
This paper presents an analytical model for planar, etched EOpumps based on flow between two infinite plates and presents anestimate of the thermodynamic efficiency of planar EO pumps.We have used this model to guide the design and fabrication ofa planar EO micropump etched in glass. After a brief discussionof the microfabrication, the paper presents experimental resultsof the performance of the pump, including pressure capacity,flow rate and thermodynamic efficiency.
II. ELECTROOSMOTICFLOW MODEL
A schematic of the pumping channel is shown in Fig. 3 withthe bulk pump flow in the -direction. There are three impor-tant figures of merit associated with a pump: pressure capacity,flow rate and thermodynamic efficiency. Since the depth of thepump channel is much smaller than the length and width (whichare of order 1 mm and 1 cm, respectively) and the Reynoldsnumber based on the 0.9m channel depth in our applicationis small ( ); the flow can be approximated as one-di-mensional, fully developed laminar EO flow between parallelplates [10], [11]. The governing equation is reduced to a bal-ance of pressure, viscous stress and an electrostatic body force[11],
(1)
where is viscosity and is velocity along the flow direction;is pressure gradient along the flow direction and is as-
sumed to be uniform; is electric charge density and isexternal electric field which is assumed to be uniform along theflow direction. In the second equality of (1), the Poisson equa-tion is invoked, where is permittivity and is electric potential.
For uniform surface conditions, the electric potential, ,can be divided into two parts [11]
(2)
where is the potential due to externally applied field andis the potential distribution in the liquid due to the charged
surface and has a maximum value equal to the zeta potential ()at the shear plane. The general solution to (1) can be obtained as
(3)
Given our assumptions, the only unknown in (3) is .
Fig. 3. Pump geometry and coordinate system: An ideal planar pump has alarge flow area with and a high surface to volume ratio. The pump described hereis a wide, short and shallow structure as depicted schematically in the figure.The driving electric field and EO flow are in thex-direction. The parameterhis defined as the half depth of the pumping channel. The pump presented in thispaper was wet etched in soda-lime glass and had dimensions ofD = 0:9 �m,W = 38 mm andL = 1 mm. The relatively large cross section was requiredfor high flow rates of 15�L/min at 1 kV and the small depth allowed for thegeneration of 0.3 atm at 1 kV.
There has been considerable theoretical development forelectrokinetic flow between infinite parallel plates. Under theassumption of Boltzmann charge distribution, Burgreen andNakache [12] presented a general solution for and thesolution is valid for arbitrary zeta potential. Their analysis isaccomplished without invoking the Debye-Huckel approxima-tion [1], [11]. Qu and Li [13] recently presented a model thataccounts for overlapped electric double layers and, therefore,relaxes the assumption of a simple, flat-wall Boltzmann chargedistribution. For many EO pumps of interest, however, the zetapotential is usually not very large, so Debye-Huckel approxi-mation can be assumed to simplify the analysis. We apply theDebye-Huckel approximation to keep the derivations relativelysimple and applicable to quick design estimates of pumpperformance. We also describe the accuracy of this assumptionwhen appropriate. The analysis we present can be extended tohigh zeta potential cases (i.e., the non-Debye-Huckel case) byapplying the closed-form solution of Burgreen and Nakache[12]. Lastly, for reasons that will become clear below, anoptimized EO pump should not have double-layer overlappingeffects and we, therefore, apply a simple Boltzmann model forthe charge distribution at each wall of the planar EO pump.
To further simplify the relations derived here, we assumeelectric neutrality in the bulk of a solution of symmetric elec-trolyte such that , where is the ionic concen-tration in the bulk liquid and the subscripts “” and “ ” indicatepositive and negative ions, respectively. The Poisson-Boltzmanndistribution of the ions in the diffuse double layer is then [11],
(4)
where is the charge number, is the Faraday constant, isthe universal gas constant, andis the temperature of workingfluid. In practice, the velocity profiles predicted by the Debye-Huckel approximation are valid for nondimensionalized poten-tials of magnitude [1]. For such low potentials,the potential distribution is [14],
(5)
where is the Debye length defined as
(6)

674 JOURNAL OF MICROELECTROMECHANICAL SYSTEMS, VOL. 11, NO. 6, DECEMBER 2002
Integrating the velocity profile across the cross section, theflow rate of the EO channel is
(7)
where is a nondimensional channel half height defined as
(8)
and the function is
(9)
Equation (9) can be interpreted as a correction factor that ac-counts for finite-double-layer effects. In the thin-double-layerlimit ( ), approaches unity as shown in Fig. 4.
For zero counter pressure, the flow rate is a maximum de-scribed as
(10)
The maximum pressure is achieved for zero net flow rate so that
(11)
where is the voltage applied on the pump ( ). Alinear relation between pressure and flow rate is obtained bysubstituting (10) and (11) into (7), to obtain
(12)
Equations (10) and (11) offer important guidelines for the ge-ometrical design of planar EO pumps. A shallow depth () isdesirable for high pressure capacity, a large width () is de-sirable for large flow rate and a short length () is desirable forhigh electric field (and therefore large flow rate at relatively lowvoltage). Equation (12) can be used to predict the flow rate ofthe pump under various counter pressures.
Both flow rate and pressure capacity are dependent on thecorrection factor, , caused by finite-double-layer effects.Fig. 4 plots the correction function as a function of elec-trokinetic half height . The plot suggests for relativelygood pump performance (e.g., ). The lower pumppressure and flow rate performance for is caused by thevelocity deficit associated with the finite double layers and thefact that less positive charges are available to generate a pres-sure force. Note that for low values of, the total charges inthe pumping volume are less than the total wall charges. Forvalues of less than about 5, decreasing channel depth doesnot necessarily increase the pressure capacity, which is an im-portant consideration for designers.
III. A NALYSIS ON THERMODYNAMIC EFFICIENCY
We analyze the thermodynamic effciency of a planar EOpump by evaluating the power dissipation in the flow. The First
Fig. 4. Functions describing finite-double-layer effects:f(h ) is a correctionfactor that appears in flow rate and pressure relations;g(h ) appears in theexpression for viscous dissipation; andr(h ) appears in the expression for Jouleheating. All three nondimensional parameters depend on the nondimensionalelectrokinetic half-height,h .f(h ) approaches one for large values ofh , whileg(h ) andr(h ) approach zero for largeh , i.e., in the thin-double-layer limit.
Law thermodynamic efficiency is defined as useful pressurework over total power consumption. The formulation for thepower consumed by an EO slot pump can be derived from aFirst Law analysis of a system in which a pump drives a fluidicload. This formulation is given in the Appendix and one resultis (A19) for the total energy consumed by the pump,. Thetotal energy can be divided into three parts as follows:
(13)
where is the pressure work output produced by the pumpand and are, respectively, viscous dissipation andelectrical Joule heating dissipated in the pump. Note that asteady state, unidirectional velocity field is implied in thesecond equality of this equation.
Another result of a First Law analysis on a pump and loadsystem is given by (A18) for the pressure work output of thepump:
(14)
Because of the linear relatinoship between pressure and flowrate ((12)), (10), (11) and (14) can be combined to show that themaximum pressure work occurs at
(15)

CHEN AND SANTIAGO: PLANAR ELECTROOSMOTIC MICROPUMP 675
Next, the viscous dissipation for the pumping liquid is
(16)
where
(17)
can be interpreted as a correction factor that results fromfinite-double-layer effects on viscous dissipation and is plottedin Fig. 4.
The electrical Joule heating power term is
(18)
The electrical field in the integrand is assumed to be uniform andthe electrical conductivity can be expressed (for a symmetric,dilute electrolyte) in terms of the ionic concentrations and molarconductivities as
(19)
Again, to derive a simple analytical relation useful in initial de-signs of EO pumps, the two molar conductivities can be as-sumed equal so that . Substituting (4) into (19),
(20)
Defining a bulk conducitivity in terms of the bulk concentra-tion of ions, we have
(21)
Invoking the Debye-Huckel approximation for lowand substituting into (20)
(22)
Lastly, the electrical Joule heating term ((18)) can be integratedanalytically as
(23)
where,
(24)
is a correction factor which accounts for finite-double-layer effects on Joule heating and is plotted in Fig. 4. If theDeybe-Huckel approximation is not assumed, the relation forconductivity, (20), can be applied to numerically integrate (18)and evaluate the Joule heating power. Numerical integration
(using Mathematica 4.0, Wolfram Research, Inc.) shows that for, the Debye-Huckel approximation is 99, 98,
and 90% accurate for , 10, and 1, respectively. Hence,the conductivity approximation (22) is typically valid for inte-gration of Joule heating when , as long as thedouble layer overlap is negligible. Note that this range coincideswith the range of applicability of the Debye-Huckel approxima-tion to calculate the potential distributions suggested by Hunter[1].
Since pressure work is maximum when ,the theoretical maximum thermodynamic efficiency can be ex-pressed as
(25)
where each of the terms are evaluated using (14)–(24). When(11) is used to evaluate pressure, scales as
. Therefore, is independent of electric field as long as theworking fluid properties are invariant to electric field. An inter-esting limit of this equation is obtained for the case of a smallDebye length ( ), where ,and and the efficiency expression is reducedto
for (26)
Note that, in the thin-Debye-length limit, the maximum valueof thermodynamic efficiency is independent of external elec-tric field since viscous dissipation is evaluated at
.In practice, thermodynamic efficiency can be calculated from
measured values as
(27)
where is the external voltage applied on the pump andisthe current in the pump circuit.
The three power dissipation terms in the thermodynamic ex-pression ((25)) are plotted as a function of nondimensional con-centration in Fig. 5. Nondimensional concentration is defined as
(28)
where is the concentration at which and accordingto (6),
(29)
This nondimensional concentration definition is useful in con-ceptualizing the design of optimal working fluid conditions for agiven planar pump. The three power dissipation terms are nondi-mensionalized by the pressure work at the thin-double layerlimit
(30)
The viscous dissipation term of (16) initially grows very quicklyas the velocity profile changes from the parabolic profile associ-ated with [11] and develops into the case where we have

676 JOURNAL OF MICROELECTROMECHANICAL SYSTEMS, VOL. 11, NO. 6, DECEMBER 2002
Fig. 5. Nondimensional power terms in energy balance equation: The figureshows a plot of nondimensional power consumption terms that appear in thethermodynamic efficiency relation ((25)) as a function of nondimensionalconcentration. All of the terms are nondimesnionalized by the pressurework at the thin-double-layer limit. Pressure work reaches a plateau in thethin-Debye-length, highc regime. The viscous dissipation term for EOflow dominates over pressure-driven flow work for thin-Debye-length limits(high c ) due to the high shear rate in this regime. The nondimensionalJoule heating term is the primary mechanism of power consumption attypical working conditions of EO pumps. This plot was generated for aunivalent symmetric electrolyte in a 0.9-�m-deep channel (h = 0:45 �m),with the following nondimensional parameters:zF�=(RT ) = 1:9 and(�� j =("�) )(D =3) = 4:0 where� j is evaluated atc = cusing (21).
two, nonoverlapping electric double layers whose shear ratesare directly proportional to . At values of low (e.g., below5), the viscous dissipation term essentially equals the pressurework associated with the system. and overlap in thisregime because both pressure and EO flow components haveparabolic flow profiles (see (14) and (16)). In the dilute limit,Joule heating is a linear function of concentration for the sameelectrolytes and is a major mechanism of power consumptionat typical working conditions of EO pumps. Because of the as-sumption of linearly superposed electric double layers used inthis paper, the simple model presented here is expected to besufficiently accurate for values of greater than about 4 [13].
Next, we consider the thermodynamic efficiency of an EOpump as predicted by (25). Fig. 6 shows a plot of thermody-namic efficiency as function of the nondimensional concentra-tion . For the range of nondimensional concentrations consid-ered here, the predicted thermodynamic efficiency varies from1.3% to zero. This relatively low efficiency is typical of EOpumps as most of the energy associated with EO pumping is dis-sipated by Joule heating due to the ionic conduction of workingfluid. The plot shows that the peak thermodynamic efficiencyoccurs at a nondimensional ionic concentration of 3.6 (
). At low ionic concentrations, the electrical double layersspan a significant fraction of the channel dimension. In thisregime, finite double layers cause a velocity deficit and a pres-sure reduction ((3)) which reduce the amount of useful hydraulicpower delivered by the system. Since the Joule heating term of(23) is a strong function of increasing concentration, ionic cur-rent dissipation of energy eventually dominates for increasing
. The Joule heat dissipation therefore decreases thermody-namic efficiency at values of greater than 3.6. Optimum per-formance is achieved in balancing the competing influences of
Fig. 6. Thermodyamic efficiency as a function of concentration:Thermodynamic efficiency reaches a peak value of 1.3% at a nondimensionalconcentration of 3.6 (c = 1:9). The maximum results from the competinginfluences of double-layer overlap (which limits efficiency at low concentration)and Joule heating (which dominates at high concentration). This plot wasgenerated for a univalent symmetric electrolyte in a 0.9-�m-deep channel(h = 0:45 �m), with nondimensional parameterszF�=(RT ) = 1:9 and(�� j =("�) )(D =3) = 4:0.
double-layer overlap and Joule heating. This analysis is quali-tatively supported by experimental data presented by Ganet al.[15]. Ganet al. reported a porous-media pump with character-istic pore sizes of 2 to 5m. Capillary pumps have expressionsfor pressure capacity and flow rate similar to (10) and (11) andpressure capacity scales linearly with flow rate for a fixed ge-ometry [3]. In Fig. 3 of Gan’s paper, the ratio of flow rate tocurrent is plotted against the aqueous solution concentration ofNH OH (their working fluid). Since the voltage in their mea-surements is held constant for all concentration values, this datais proportional to the thermodynamic efficiency of their pumpas shown by (27). The flow rate per current versus concentra-tion plot reported by Ganet al. is qualitatively very similar toour predicted thermodynamic efficiency versus nondimensionalconcentration (Fig. 6). A quantitative comparison between ourmodel and the data of Ganet al. is not possible because pres-sure head values versus concentration are not available for theirexperiments.
Fig. 6 offers an important design guideline. Namely, low ionicconcentration is generally preferred for high thermodynamic ef-ficiency as long as finite-double-layer effects are not important.In order to reduce power consumption and increase thermody-namic efficiency, we chose deionized (DI) water as the workingfluid because of its low ionic conductivity. The DI water usedin this paper had an ionic conductivity of 3.010 S/m. Anestimate based on the conductivity of carbonic acid yields anionic concentration of 7.5 M (see Section V). Though not atits peak value, the thermodynamic efficiency at 7.5M (corre-sponding to ) is still sufficiently high. A reason to choosewater or aqueous solutions as working fluids is water’s high la-tent heat capacity (for heat transfer applications) and its com-patibility with many biological buffers of interest. The pumpcan also be operated using buffered (strongly conductive) solu-tions with a significant decrease in thermodynamic efficiency,as mentioned in the introduction.

CHEN AND SANTIAGO: PLANAR ELECTROOSMOTIC MICROPUMP 677
Fig. 7. Fabrication of planar EO micropump: Two 50� 75� 1.2 mmsoda-lime glass substrates were wet-etched to produce the pumping channeland fluid reservoirs. Two through-holes were drilled in the center of the twofluid reservoirs to serve as fluidic interconnects. The glass substrates werethermally bonded together. The two etch masks (top) and a schematic of asection view of the micropump cutting through the two interconnect holes(bottom) were shown schematically. The vertical dimensions of the sectionview were exaggerated for clarity. The pumping channel was0:9 �m� 38 mmin cross section and 1 mm long in the flow direction.
IV. FABRICATION AND EXPERIMENTAL SETUP
An EO micropump was fabricated using two pieces of50 75 1.2 mm soda-lime glass substrates (Cat. M6142,Baxter Healthcare, McGaw Park, IL) as shown in Fig. 7.Standard microlithography techniques were used to generatephotoresist etch masks (S1813, Shipley, Marlborough, MA).Chemical wet etching using BOE, buffered oxide etch (6:1 Am-monium Fluoride to Hydrofluoric Acid, Ashaland Chemical,Columbus, OH) was applied to fabricate the pumping channeland fluid reservoirs. Two access holes were drilled using dia-mond tipped bits in the top coverslip of the device and alignedwith the center of the fluid reservoirs to serve as connectionsto external plumbing. After etching, drilling and cleaning, thetop wall and pump structure substrates were thermally bondedtogether at a maximum temperature of 575C. Fig. 8 showsthe assembly of the micropump. PEEK fittings (Cat. F120X,Upchurch Scientific, Oak Harbor, WA) were connected to theaccess holes using UV curable epoxy (Cat. 35241, Loctite,Hartford, CT) and stainless steel unions (Cat. U322, UpchurchScientific) were attached to serve as both interconnects andelectrodes. Because of the low currents (10 A) associatedwith the performance of these pumps and large surface area( 0.5 cm ) of the electrodes, electrode reactions were negli-gible in characterizing pump performance (see also Assumption1 in the Appendix). Finally, the micropump was connected tothe outside fluid reservoir and characterization setup.
Fig. 7 presents the details associated with the pumpingchannel. The pump geometry was defined by the etching timeand etch masks. The depth () of the etched pumping channelwas 0.9 m and the depth of the etched fluid reservoirs was11 m. The two fluid reservoirs (deeper trenches in the glasssubstrate) were 1 mm apart and this distance defines the length( ) of the pump. The total width of the channel was 40 mm.Eight equally distributed 0.25-mm-wide ribs were incorporated
Fig. 8. Image of the assembled pump with electrodes and fluidic interconnects:PEEK fittings were glued around interconnect holes drilled through the top glasspiece of the pump. Stainless steel unions served as electrodes. The anode wasconnected to a container of deionized water (shown on the left side of the image)and the cathode was connected to the test section.
Fig. 9. Characterization setup: When high voltage is applied, theelectroosmotic micropump drives working fluid from the outer liquidreservoir to the test section. The test section for the characterization setupwas composed of a circular silica capillary with an inner diameter of 700�m.When the test section tube is open, maximum flow rate is measured by tracingthe flow front. When the test tube is closed, both flow rate and counter pressureare measured simultaneously.
to improve the structural rigidity. These ribs reduced theeffective width ( ) of the pump to 38 mm. One challengein the microfabrication of planar EO pumps arose from theshallow ( 1 m) feature of the pumping channels required toachieve working pressures per voltage of order 10atm/V.Because the depth of the pump was controlled by timed-etchtechniques, a relatively weak etchant (6:1 BOE) was chosen.Also, the thermal bonding was found to be very sensitive tothe bonding process including maximum temperature, durationand the amount and distribution of weight applied to promotebonding. The glass substrates were first cleaned using a piranhacleaning solution (4:1 Sulfuric Acid to Hydrogen Peroxide).The two substrates were then aligned and placed in a dentaloven (Centuriun Q200, Ney Dental, Bloomfield, CT) forbonding. A stainless steel weight of 6 kg was centered on topof the substrates. The oven cycle began at 200C, ramped at10 C/min to 575 C, dwelled at 575C for 90 min and cooleddown to 200 C after 30 min. The pressure in the oven was keptbelow 3 kPa during the bonding.
The pump pressure and flow rate characterization setup isshown in Fig. 9. High voltage was supplied using a ModelSL6PN30, Spellman supply (Hauppauge, NY). The workingfluid was driven from an external liquid reservoir and through
678 JOURNAL OF MICROELECTROMECHANICAL SYSTEMS, VOL. 11, NO. 6, DECEMBER 2002
the system. The outflow from the downstream reservoir wasdirected into a pressure measurement section consisting of acircular silica capillary with an inner diameter of 700m (Cat.2000029, Polymicro Technologies, Phoenix, AZ). When thesystem was operated with the capillary closed, the pump streamcompressed a column of air within the capillary and the motionof the meniscus within the capillary was recorded optically toprovide a measurement of both back pressure and flow rate.Maximum flow rate was measured with the capillary open (i.e.,with negligible back pressure). The electrical current of thepump circuit was monitored by a multimeter (Model 89-IV,Fluke, Everett, WA).
The major source of error for the flow rate measurement wasprobably the evaporation of the working fluid at the flow frontfor the open tube case and the uncertainty in recording the flowfront for the closed tube case. The absolute error in the flowrate measurement was estimated to be within 0.05L/min. Themajor source of error for pressure measurement was the ambi-guity associated with the total length of the test section. Theabsolute error in the pressure measurement was estimated to bewithin 0.04 atm. These absolute errors were small compared totypical flow rate and pressure measurements.
All of the experiments described here were conducted onthe same micropump. Once filled, the pump remained filledwith DI water. In order to maintain similar initial conditions,the working fluid was, for each run, extracted from the sameDI water container. The pump was flushed with DI for sev-eral minutes with a high-performance liquid chromatographypump (Model LC-10Atvp, Shimadzu, Columbia, MD) beforeeach experiment.
V. PUMP CHARACTERIZATION RESULTS ANDDISCUSSION
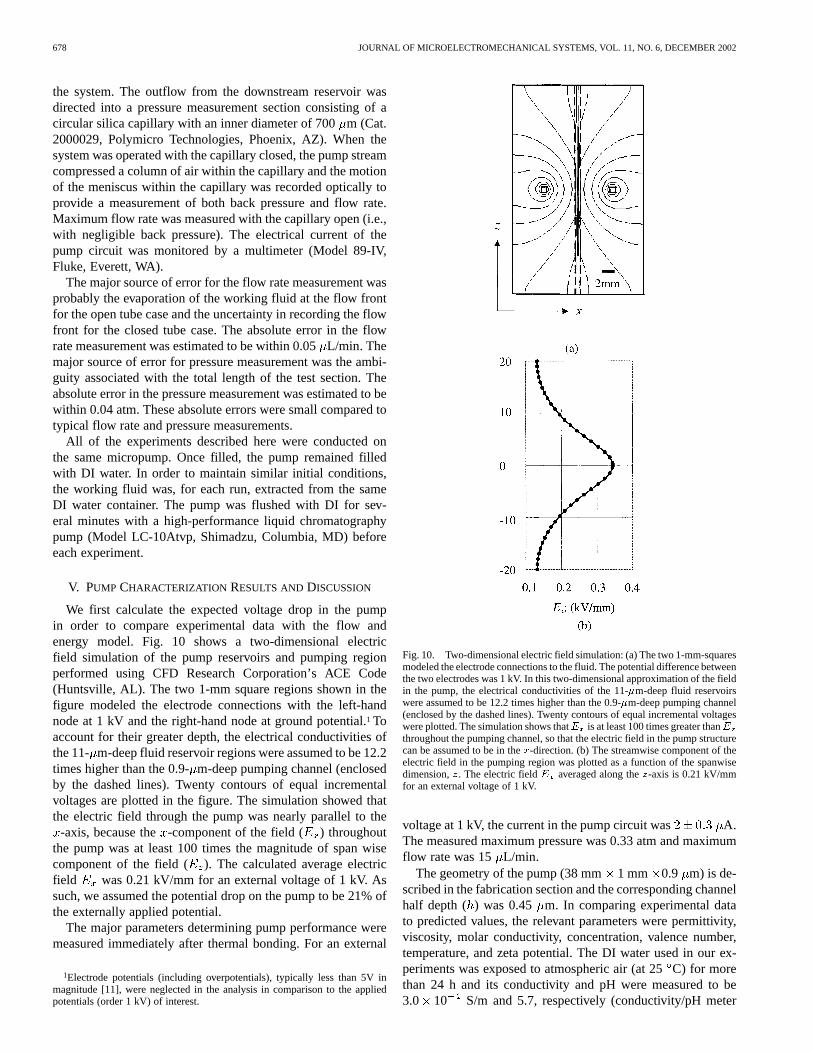
We first calculate the expected voltage drop in the pumpin order to compare experimental data with the flow andenergy model. Fig. 10 shows a two-dimensional electricfield simulation of the pump reservoirs and pumping regionperformed using CFD Research Corporation’s ACE Code(Huntsville, AL). The two 1-mm square regions shown in thefigure modeled the electrode connections with the left-handnode at 1 kV and the right-hand node at ground potential.1 Toaccount for their greater depth, the electrical conductivities ofthe 11- m-deep fluid reservoir regions were assumed to be 12.2times higher than the 0.9-m-deep pumping channel (enclosedby the dashed lines). Twenty contours of equal incrementalvoltages are plotted in the figure. The simulation showed thatthe electric field through the pump was nearly parallel to the
-axis, because the-component of the field ( ) throughoutthe pump was at least 100 times the magnitude of span wisecomponent of the field ( ). The calculated average electricfield was 0.21 kV/mm for an external voltage of 1 kV. Assuch, we assumed the potential drop on the pump to be 21% ofthe externally applied potential.
The major parameters determining pump performance weremeasured immediately after thermal bonding. For an external
1Electrode potentials (including overpotentials), typically less than 5V inmagnitude [11], were neglected in the analysis in comparison to the appliedpotentials (order 1 kV) of interest.
Fig. 10. Two-dimensional electric field simulation: (a) The two 1-mm-squaresmodeled the electrode connections to the fluid. The potential difference betweenthe two electrodes was 1 kV. In this two-dimensional approximation of the fieldin the pump, the electrical conductivities of the 11-�m-deep fluid reservoirswere assumed to be 12.2 times higher than the 0.9-�m-deep pumping channel(enclosed by the dashed lines). Twenty contours of equal incremental voltageswere plotted. The simulation shows thatE is at least 100 times greater thanEthroughout the pumping channel, so that the electric field in the pump structurecan be assumed to be in thex-direction. (b) The streamwise component of theelectric field in the pumping region was plotted as a function of the spanwisedimension,z. The electric fieldE averaged along thez-axis is 0.21 kV/mmfor an external voltage of 1 kV.
voltage at 1 kV, the current in the pump circuit was A.The measured maximum pressure was 0.33 atm and maximumflow rate was 15 L/min.
The geometry of the pump (38 mm1 mm 0.9 m) is de-scribed in the fabrication section and the corresponding channelhalf depth ( ) was 0.45 m. In comparing experimental datato predicted values, the relevant parameters were permittivity,viscosity, molar conductivity, concentration, valence number,temperature, and zeta potential. The DI water used in our ex-periments was exposed to atmospheric air (at 25C) for morethan 24 h and its conductivity and pH were measured to be3.0 10 S/m and 5.7, respectively (conductivity/pH meter

CHEN AND SANTIAGO: PLANAR ELECTROOSMOTIC MICROPUMP 679
Model 1671, Jenco Instruments, San Diego, CA). Water reactswith atmospheric COto create carbonic acid and so the ionicconductivity of our DI was assumed to be dominated by Hand HCO ions. To calculate the ionic concentration of the DIwater, we used the arithmetic average molar conductivities ofthe H and HCO ions. The ionic concentration was estimatedto be 7.5 M.2 Zeta potential was assumed to be a typical valueof 50 mV for DI water of pH and ionic concentrationof 7.5 M as reported by Gu and Li for soda-lime glass and DIwater [17].
Working fluid properties (viscosity, permittivity, and conduc-tivity) were evaluated at the estimated average temperature in-side the pump3(details of our temperature estimation procedurewill be discussed later in this section). At 1 kV, the tempera-ture rise due to electrical Joule heating was 7C. The workingfluid properties were therefore evaluated at 32C, the assumedsteady-state temperature inside the pump at 1 kV. Using ourmodel, the Debye length was 0.11m, which corresponded toa nondimensional half height of (or a nondimensionalconcentration of ). Since , we neglected the ef-fect of overlapping double layers and used the above model toevaluate the pump performance. The correction factor was0.76, so the pressure and flow rate capacities were nearly op-timal. The theoretical predictions were atm [see(11)] and L/min [see (10)]. These predictions wereof the same order of magnitude of the respective experimentalvalues of 0.33 atm and 15L/min. The discrepancy between thepredicted and measured flowrate and pressure values was prob-ably due to the limitations of the simple model. For example, themodel used a uniform electric field value based on the expectedvolume average of the nonuniform field in the pump. Further,as discussed later, the depth of the pumping channel was prob-ably reduced slightly during and after the bonding process. Themodel predicted a power consumption (due to pressure work,viscous dissipation, and Joule heating) of 0.58 mW [see (13)where ] and a theoretical efficiency of 0.81%[see (25)]. For a 0.21 kV voltage drop across the pump, theactual power consumption of the pump () was measured as0.42 mW and the experimental efficiency [see (27)] was 0.49%.These experimental values compared fairly well with the model.Note that the thermodynamic efficiency is independent of elec-tric field and is therefore more intrinsic to an EO pump thanpressure and flow rate performances. Also, power consumptionis less susceptible to errors associated with nonuniform flow be-cause it is mostly determined by the effects of Joule heating.
Despite the favorable initial value of the thermodynamic ef-ficiency of the pump, the performance of the pump was foundto vary significantly over an extended period of characterization
2At 25 C, the molar conductivity of H and HCO are 3.5�10 and4.5�10 m S/mol, respectively, [16]. The estimated ionic concentrationis obtained using (21) where� assumes an average molar conductivity of2.0�10 m S/mol.
3For 25 C < T < 80 C, the temperature dependence of permittivity is athird-order polynomial fit provided by Lide [16]. The temperature dependenceof viscosity is a fourth-order polynomial fit to the data provided by Kays etal. [18]. The molar conductivity is assumed to have a temperature coefficientof 2%, i.e.,�(T ) = �(25 C)[1 + 0:02(T � 25)], which is the JIS stan-dard (Japanese Standard Association). At 32C, the expected properties arethe following:" = 6:7 � 10 C=(V � m), � = 0:76� 10 kg=(m � s),� = 2:3 � 10 m S/mol.
experiments. Experiments were conducted for a period of morethan eight weeks. These tests showed a significant long-termdegradation of pump performance. In any given day, the pres-sure, flow rate, and current performance for a given electricfield were quite repeatable and, to within experimental uncer-tainty, constant. However, the maximum flow rate of the pumpat 1 kV was observed to degrade from an initial maximum valueof 15 L/min to 0.2 L/min over a period of 2 mo. In order toinvestigate the possibility of the degradation in wall charge, theglass surface of the pump was flushed with a 1 M sodium hy-droxide solution for 10 h and then flushed with DI water for2 h. The sodium hydroxide treatment slowly etched a thin layerof the glass channel surface and deprotonated surface silanolgroups. After this treatment, the flow rate of the pump increasedby only 50% of the 0.2 L/min value. In contrast to the flow ratedegradation, the long-term maximum pressure performance ofthe pump remained constant during the eight-week degradationof the flow rate. The latter observation and the slight effect ofsodium hydroxide treatment indicate that the degradation wasnot due to a uniform decrease in the surface wall charge.
The decrease in pump performance was probably dueto a collapse and bonding of sections of the 0.9-m-deeppumping channel which were far from the supporting ribs ofthe structure. Microscopic visualization of the flow throughthe pump using Fluorescein dye and a 60x water-immersionobjective (LumPlanFI 60x/0.90w, Olympus, Melville, NY)showed regions where the top and bottom walls of the pumphad bonded together. Further evidence of this structure collapsewere diffraction patterns parallel to and near the edges of thepump channel (vertical) walls and those of the ribs. At thetime of the measurements presented below (Figs. 11 and 12),the pump operation had degraded to the point where the ex-perimentally measured thermodynamic efficiency was around0.04%. This extremely low thermodynamic efficiency valuewas probably an underestimation because it used the initial,uncollapsed area of the etched channel. This efficiency shouldbe interpreted as a worst-case estimate since the long-term flowrate measurements indicated that the cross-sectional area of thepump was certainly much less than the initial value. Becauseof the rib structures used, the structure maintained a maximumgap depth of 0.9 m with smaller gap dimensions in the regionsbetween ribs. The large gaps that remained in the structurelimited the maximum pressure generation of the device toapproximately the initial value while the collapse drasticallydecreased flow rate performance. This long-term effect is animportant consideration for designers of planar EO pumps.
As we have indicated above, this long-term degradationprocess was rather slow and at a given day, the experimentaldata for pressure, flow rate, and current performance at agiven external voltage was still repeatable within experimentaluncertainty. Therefore, in the subsequent sections, we presentdata obtained at the seventh week after the pump was bonded.Fig. 11 shows the run-to-run repeatable linear relationshipbetween flow rate and counter pressure. This data set wasobtained for a 3-kV potential and the current in the pumpcircuit was A. The linear relationship is predicted by(12) and has been observed in other studies [3]. The linearrelationship supports the assumption that EO flow and pressure
680 JOURNAL OF MICROELECTROMECHANICAL SYSTEMS, VOL. 11, NO. 6, DECEMBER 2002
Fig. 11. Flow rate and pressure measurements: The experiment shown wasfor a 3 kV potential and a current of 7�A. There is a linear relationship (with aregression coefficientR = 0:994) between flow rate and associated counterpressure as predicted by the model. The extrapolations yield a maximumflow rate of 2.5�L/min and a maximum pressure capacity of 1.5 atm. Theexperimental thermodynamic efficiency for this case is 0.035%.
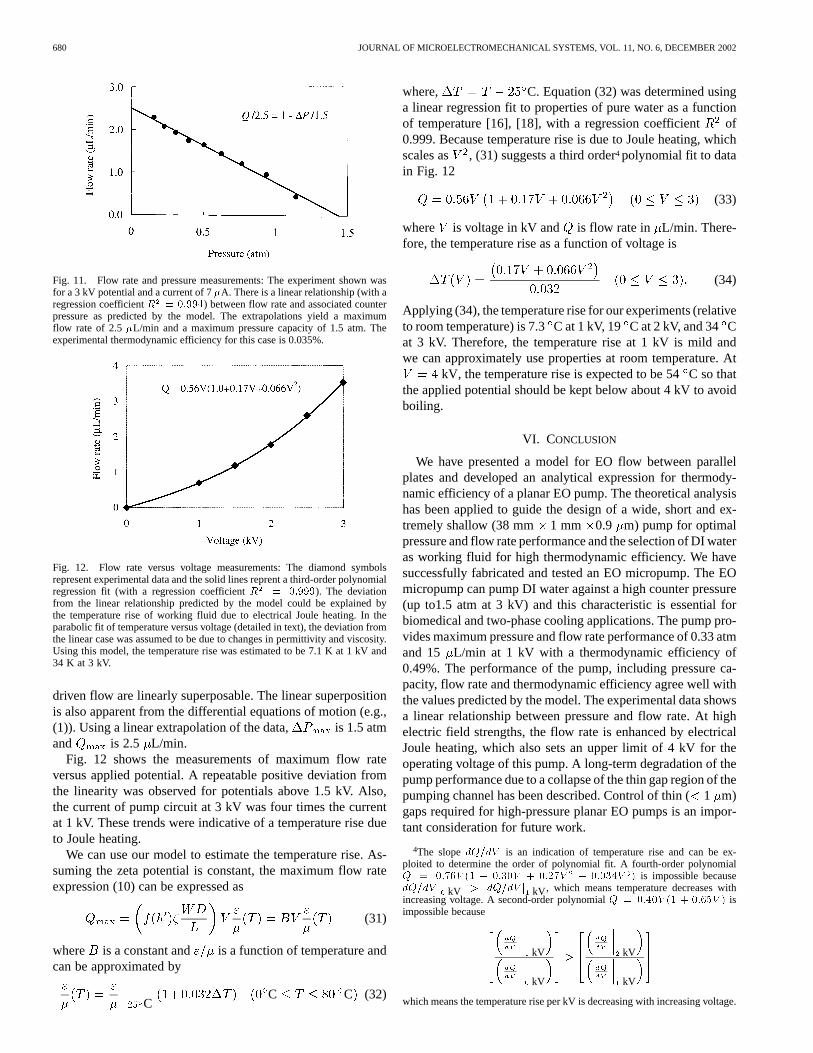
Fig. 12. Flow rate versus voltage measurements: The diamond symbolsrepresent experimental data and the solid lines reprent a third-order polynomialregression fit (with a regression coefficientR = 0:999). The deviationfrom the linear relationship predicted by the model could be explained bythe temperature rise of working fluid due to electrical Joule heating. In theparabolic fit of temperature versus voltage (detailed in text), the deviation fromthe linear case was assumed to be due to changes in permittivity and viscosity.Using this model, the temperature rise was estimated to be 7.1 K at 1 kV and34 K at 3 kV.
driven flow are linearly superposable. The linear superpositionis also apparent from the differential equations of motion (e.g.,(1)). Using a linear extrapolation of the data, is 1.5 atmand is 2.5 L/min.
Fig. 12 shows the measurements of maximum flow rateversus applied potential. A repeatable positive deviation fromthe linearity was observed for potentials above 1.5 kV. Also,the current of pump circuit at 3 kV was four times the currentat 1 kV. These trends were indicative of a temperature rise dueto Joule heating.
We can use our model to estimate the temperature rise. As-suming the zeta potential is constant, the maximum flow rateexpression (10) can be expressed as
(31)
where is a constant and is a function of temperature andcan be approximated by
CC C (32)
where, C. Equation (32) was determined usinga linear regression fit to properties of pure water as a functionof temperature [16], [18], with a regression coefficient of0.999. Because temperature rise is due to Joule heating, whichscales as , (31) suggests a third order4 polynomial fit to datain Fig. 12
(33)
where is voltage in kV and is flow rate in L/min. There-fore, the temperature rise as a function of voltage is
(34)
Applying (34), the temperature rise for our experiments (relativeto room temperature) is 7.3C at 1 kV, 19 C at 2 kV, and 34Cat 3 kV. Therefore, the temperature rise at 1 kV is mild andwe can approximately use properties at room temperature. At
kV, the temperature rise is expected to be 54C so thatthe applied potential should be kept below about 4 kV to avoidboiling.
VI. CONCLUSION
We have presented a model for EO flow between parallelplates and developed an analytical expression for thermody-namic efficiency of a planar EO pump. The theoretical analysishas been applied to guide the design of a wide, short and ex-tremely shallow (38 mm 1 mm 0.9 m) pump for optimalpressure and flow rate performance and the selection of DI wateras working fluid for high thermodynamic efficiency. We havesuccessfully fabricated and tested an EO micropump. The EOmicropump can pump DI water against a high counter pressure(up to1.5 atm at 3 kV) and this characteristic is essential forbiomedical and two-phase cooling applications. The pump pro-vides maximum pressure and flow rate performance of 0.33 atmand 15 L/min at 1 kV with a thermodynamic efficiency of0.49%. The performance of the pump, including pressure ca-pacity, flow rate and thermodynamic efficiency agree well withthe values predicted by the model. The experimental data showsa linear relationship between pressure and flow rate. At highelectric field strengths, the flow rate is enhanced by electricalJoule heating, which also sets an upper limit of 4 kV for theoperating voltage of this pump. A long-term degradation of thepump performance due to a collapse of the thin gap region of thepumping channel has been described. Control of thin (1 m)gaps required for high-pressure planar EO pumps is an impor-tant consideration for future work.
4The slopedQ=dV is an indication of temperature rise and can be ex-ploited to determine the order of polynomial fit. A fourth-order polynomialQ = 0:76V (1 � 0:30V + 0:27V � 0:034V ) is impossible becausedQ=dV j kV > dQ=dV j kV, which means temperature decreases withincreasing voltage. A second-order polynomialQ = 0:40V (1 + 0:65V ) isimpossible because
kV
kV
> kV
kV
which means the temperature rise per kV is decreasing with increasing voltage.

CHEN AND SANTIAGO: PLANAR ELECTROOSMOTIC MICROPUMP 681
Fig. 13. Schematic of an EO-pump-driven system: The EO pump is connectedto a fluidic load by two identical flow passages (see text for details). The arrowsdenote the flow direction for a negatively charged pump wall (e.g., glass wall incontact with DI water). The dotted control volume is for the pump and the dashedcontrol volume is for the frictional load, which accounts for both the actualfluidic load and the flow passages. For the system of EO pump and frictionalload together, the electrical power input is equal to the heat loss through theboundary (walls) of the system. In all cases, control surfaces adjacent to a wallinclude the electrical double layer.
Useful extensions of the modeling work presented here wouldinclude the effects of overlapping electric double layers and highzeta potentials. The present model accounts for the increasedconductivity near the wall caused by the double layer ((23)),but does not account for the effects of ionic conduction throughthe immobile ions of the electrical double layer (i.e., the Sternlayer). Future work on these pumps will include the incorpora-tion of additional supporting structures to prevent the possiblecollapse of the pump channel walls and the evaluation of the useof other (e.g., stiffer) silica- or silicon-based substrate materials.
APPENDIX
DERIVATION OF THE TOTAL ENERGY EQUATION
The total energy equation of an EO pump can be derived by acombined thermodynamic and fluid mechanics analysis on thesystem of an EO pump with a frictional load as shown schemat-ically in Fig. 13. The analysis is carried out with the followingassumptions:
1) Electrochemical reaction (e.g., dissociation of HO into Hand O ) is negligible. Therefore, the reaction products andthe heat of reaction are neglected and unsteady effects dueto electrochemical reaction are neglected.5
5For the initial pump data, the current is 2�A at 1 kV, which corresponds toa voltage drop of 0.21 kV on the pump (see paragraphs 1–4 of Section V fordetails). Since the majority of the working fluid is HO, we use the dissociationof water into hydrogen and oxygen at 1 atm and 25C to illustrate the effectsof electrochemical reaction. The current of 2�A yields an electron flow rateof 2.0� 10 mol/s and a HO dissociation rate of 1.0�10 mol/s.Accordingly, 15 nL/min of H and 7.5 nL/min of O are generated at thecathode and anode, respectively, and 0.011 nL/min of HO is dissociated [18].First, these volumetric rates are negligible compared to the measured flow rateof 15 �L/min. Second, the energy required to dissociate liquid phase HO is2.9�10 J/mol [16], so the dissociation of 1.0�10 mol/s H O consumes2.9�W, which is small compared to the measured power consumption of 0.42mW.
2) The pump and load system is at steady state with negligiblegravitational effects.
3) The EO pump is connected to the fluidic load by two iden-tical flow passages. For simplicity, the flow passages arelumped together with the actual fluidic load to form the totalfrictional load.
The last assumption ensures that the velocity profiles at theinlet and outlet of the frictional load are identical. For open-loopsystems, we can assume that both the outflow from the frictionalload and the inflow to the pump have the same temperature andpressure (at atmospheric condition). Applying the conservationof mass, we essentially close the loop by connecting the outletof frictional load to the inlet of the pump. These assumptions aretherefore applicable to most EO-pump-driven microsystems.
We first take a look at the mechanical energy equation forthe frictional load, which can be derived from the momentumequation [19],
(A1)
where is the density, is the velocity, is the pressure, andis the stress tensor.6 Applying the tensor identity [19]
(A2)
and integrating the mechanical energy equation over the volumeof the frictional load:
(A3)
where is the control volume for the load. Applying the di-vergence theorem [19] to the second term on the right hand sideof (A3) and expanding
(A4)
where is the unit normal vector for the control surface andis the load control surface. This expansion shows how viscousshear work is identically zero for a judicious choice of controlvolume. Because of the no slip condition, at the channelwall, there is no viscous work on the wall. Further, since the ve-locity profile is the same for both the inlet and the outlet, theviscous work at the inlet and outlet surfaces cancel. Similar ar-guments can be used to show that, at steady state, the term de-scribing the advection of kinetic energy (left hand side of (A3))
6We follow Bird et al. in the initial formulation of mechanical energy andtotal energy equations except in the sign of the stress tensor, which is oppositeto that of Bird’s formulation, as is typical in contemporary analyzes [10], [11],[18].

682 JOURNAL OF MICROELECTROMECHANICAL SYSTEMS, VOL. 11, NO. 6, DECEMBER 2002
is also zero. Therefore, evaluation of (A3) at steady state yieldssimply
(A5)
which states that pressure work on the frictional load is balancedby the viscous dissipation in the load.
The total (differential) energy equation for the pump fluidflow is [19], [20],
(A6)
where is the enthalpy (in this Appendix only), is theviscous dissipation [19] and is the electrical dissipationwhere is the electrical field and is current flux (excludingthe flux due to flow advection, see Castellanos [20]). At steadystate
(A7)
and
(A8)
The integral form of the energy equation for the pump controlvolume is then
(A9)
where is the control volume for the pump. Similarly, theintegral energy equation for the frictional load is
(A10)
where there is no Joule heating term for the frictional load.Next, we consider a control volume that includes both pump
and load. In this system, the enthalpy flux at the walls is zero andthe working fluid is subject to a steady thermodynamic cycle.Hence
(A11)
where we have again invoked the divergence theorem. Thisequation can also be interpreted as the enthalpy-flux-conser-vation condition at the interface between the pump and loadcontrol volumes. Adding (A9) and (A10) and applying (A5)and (A11), we have
(A12)
Using the divergence theorem and the thermodynamic cycleargument
(A13)
where is the heat flux normal to the wall (with outward fluxdefined as positive).
Finally, we can relate this formulation to the total energy inputfrom the pump’s power supply. The total energy input is at a rateof
(A14)
where is the applied voltage andis the total current suppliedby the power supply. From the first law of thermodynamics, thetotal energy input into the combined pump and load system iseventually dissipated through heat transfer to the surroundingsplus the small amount required to support electrochemical reac-tions so that
(A15)
where is the rate of heat transfer, and are therate (e.g., in mol/s) and heat of reaction (e.g., in J/mol) of thethelectrochemical reaction. Neglecting the electrochemical reac-tion as per Assumption 1
(A16)
which combined with (A12) and (A13) will yield the total en-ergy equation as
(A17)
where and are the viscous and electrical dissipationterms, respectively. Note that by the thermodynamic cycle ar-gument, the desired pressure work on the frictional loadcan be evaluated on the pump as
(A18)
As before, (A18) can also be interpreted as the interface condi-tion between the two system control volumes (in this case, thecondition that fluid velocities be equal at the interface and pres-sure forces be equal in magnitude and opposite in sign).
For unidirectional EO flow between parallel plates with uni-form viscosity, by assuming Ohm’s law for the current flux sothat [20], (A17) can finally be reduced to
(A19)
where is velocity evaluated using (3) and conductivityhas a -dependence due to double layer effects. This equation

CHEN AND SANTIAGO: PLANAR ELECTROOSMOTIC MICROPUMP 683
shows that the total energy supplied by the power supply can beexpressed in terms of the pressure work, viscous dissipation andJoule heating of the pump volume. The formulation presentedhere traces the energy flux in the electroosmotically pumpedsystem throughout the entire pump and load. Power enters thepump as electrical energy (at the rate of ) and exits throughthe surface of the entire pump and load system as heat ().One important result is that the energy equation describing thedissipation of the total power input ((A17)) is dependent on onlythe ion flux and velocity field within the pump, as well as thetotal pressure difference across the pump. The relation is inde-pendent of the characteristics of the load (e.g., heat transfer andflow conditions) other than the fact that the load determines therequired pressure capacity.
ACKNOWLEDGMENT
The authors gratefully acknowledge Dr. A. Kumar andMr. T. Carver for their help in the design and fabrication of thepump; and Dr. S. Zeng and Dr. J. C. Mikkelsen for their help indesigning experiments and helpful discussions regarding pumpperformance data.
REFERENCES
[1] R. J. Hunter,Zeta Potential in Colloidal Science: Principles and Appli-cations. London: Academic, 1981, pp. 1–58.
[2] P. H. Paul, D. W. Arnold, and D. J. Rakestraw, “Electrokinetic generationof high pressures using porous microstructures,” in�-TAS 98, Banff,Canada, 1998.
[3] S. Zeng, C. H. Chen, J. C. Mikkelsen Jr., and J. G. Santiago, “Fabricationand characterization of electroosmotic micropumps,”Sensors Actuat. B,vol. 79, pp. 107–114, 2001.
[4] L. Jiang, J. Koo, S. Zeng, J. C. Mikkelson, L. Zhang, P. Zhou, J. Maveety,A. T. Quan, T. W. Kenny, J. G. Santiago, and K. E. Goodson, “Two-phasemicrochannel heat sinks for an VLSI cooling system,” in17th Ann. IEEESemiconductor Thermal Measurement and Management Symp., 2001,pp. 153–157.
[5] S. Shoji and M. Esashi, “Microflow devices and systems,”J. Mi-cromechan. Microeng., vol. 4, pp. 157–171, 1994.
[6] C. H. Chen, S. Zeng, J. C. Mikkelsen Jr., and J. G. Santiago, “Microfab-ricated electrokinetic pump,” inProc. ASME 2000, vol. MEMS 1, 2000,pp. 523–528.
[7] N. Chiem and D. J. Harrison, “Microchip-based capillary elec-trophoresis for immunoassays: Analysis of monoclonal antibodies andtheophylline,”Analyt. Chem., vol. 69, pp. 373–378, 1997.
[8] J. Jang and S. S. Lee, “Theoretical and experimental study of MHD(magnetohydrodynamic) micropump,”Sensors Actuat. A, vol. 80, pp.84–89, 2000.
[9] A. Richter, A. Plettner, K. A. Hofmann, and H. Sandmaier, “A micro-machined electrohydrodynamic (EHD) pump,”Sensors Actuat. A, vol.29, pp. 159–168, 1991.
[10] R. L. Panton,Incompressible Flow, 2nd ed. New York: Wiley, 1995,pp. 148–154.
[11] R. F. Probstein,Physicochemical Hydrodynamics, 2nd ed. New York:Wiley, 1994, pp. 165/190–174/202.
[12] D. Burgreen and F. R. Nakache, “Electrokinetic flow in ultrafine capil-lary slits,” J. Phys. Chem., vol. 68, no. 5, pp. 1084–1091, 1964.
[13] W. Qu and D. Li, “A model for overlapped EDL fields,”J. Colloid In-terface Sci., vol. 224, pp. 397–407, 2000.
[14] J. Th. G. Overbeek,Colloid Science, H. R. Kruyt, Ed. Amsterdam:Elsevier, 1952, vol. 1, pp. 197–209.
[15] W. Gan, L. Yang, Y. He, R. Zeng, M. L. Cervera, and M. de la Guardia,“Mechanism of porous core electroosmotic pump flow injection systemand its application to determination of chromium (VI) in waste-water,”Talanta 51, pp. 667–675, 2001.
[16] Handbook of Chemistry and Physics, 76th ed., D. R. Lide, Ed., CRC,New York, 1995, p. 5-2, 5-90/91, 6-193.
[17] Y. G. Gu and D. Q. Li, “The zeta-potential of glass surface in contactwith aqueous solutions,”J. Colloid Interface Sci., vol. 226, no. 2, pp.328–339, 2000.
[18] K. M. Kays and M. E. Crawford,Convective Heat and Mass Transfer,3rd ed. New York: McCraw-Hill, 1993, p. 39/544/547/550.
[19] R. B. Bird, W. E. Stewart, and E. N. Lightfoot,Transport Phe-nomena. New York: Wiley, 1960, p. 81/322/731.
[20] A. Castellanos, Ed.,Electrohydrodynamics. New York: Springer-Verlag Wien, 1998, p. 24/70/74.
Chuan-Hua Chen received the B.S. degree in me-chanics from Beijing University and the M.S. degreein mechanical engineering from Stanford University,Stanford, CA.
He is currently a Ph.D. candidate at the Stanford’sMechanical Engineering Department. He is amember of the Stanford Microfluidics Laboratoryand his research interests include electroosmoticmicropumps, electrokinetic micromixing, andon-chip biochemical reaction kinetics.
Juan G. Santiagoreceived the Ph.D. degree in me-chanical engineering from the University of Illinoisat Urbana-Champaign (UIUC).
He has been a Senior Member of the TechnicalStaff with the Aerospace Corporation (1995–1997)and a Research Scientist with UIUC’s Beckman Insti-tute (1997–1998). Since 1998, he has been an Assis-tant Professor of Mechanical Engineering of StanfordUniversity where he specializes in microscale fluidmechanics, microscale optical flow diagnostics, andmicrofluidic system design. His research includes the
investigation of transport phenomena and optimization of systems involving mi-croscale fluid pumping, electrophoretic injections and separations, sample con-centration methods and rapid micromixing processes. The applications of thisresearch include microfabricated bioanalytical systems for drug discovery andcooling systems for microelectronics.