a plastic optical fiber sensing system for bridge
TRANSCRIPT

sensors
Article
A Plastic Optical Fiber Sensing System for BridgeDeflection Measurement
Dong Yang , Jin-Qi Wang, Wei-Xin Ren * and Jing Zhang
School of Civil Engineering, Hefei University of Technology, Hefei 230009, China; [email protected] (D.Y.);[email protected] (J.-Q.W.); [email protected] (J.Z.)* Correspondence: [email protected]
Received: 5 December 2019; Accepted: 13 January 2020; Published: 15 January 2020�����������������
Abstract: Deflection is one of the key parameters that reflects the state of a bridge. However, deflectionmeasurement is difficult for a bridge that is under operation. Most existing sensors and measuringtechniques often do not meet the requirements for health monitoring for various types of bridges.Therefore, based on changes of optical fiber intensity, a novel sensing system using connected pipes tomeasure bridge deflection in different positions is proposed in this paper. As an absolute reference, theliquid level position along the structure is adopted for the deflection measurement, and an additionalexternal reference to the ground is not needed in this system. The proposed system consists of threeparts: connected pipes to connect the measurement points along the structure, liquid to fill in theconnected pipes, and the sensing element to detect the change of level. A plastic optical fiber sensorbased on the intensity change is used as the sensing element of the developed system. Then, a set ofexperimental tests are conducted for performance evaluation purposes. Results show that this systemhas an accurate linear response and high reliability under various environmental conditions. Thedeflection of the test beam measured by the sensor agrees with linear variable differential transformer(LVDT) within an error margin of 2.1%. The proposed system shows great potential applicability forfuture health monitoring of long-span bridges.
Keywords: deflection measurement; connected pipe system; long-span bridge; liquid level sensor;plastic optical fiber sensor
1. Introduction
Structural health monitoring (SHM) is performed to ensure structural operation safety, whichinvolves structural response acquisition, damage-sensitive feature extraction, and structural healthstate analysis using extracted features. For SHM, proper sensor selection and placement are extremelyessential and necessary to determine the quality of collected structural responses, in turn revealingthe health condition. Deflection is one of the most important parameters in bridge SHM because itcan represent the integral stiffness of the structure, and thus is closely reflected to its load capacity.However, the measurement of bridge deflection is one of the fundamental problems. For bridges, itis difficult to install the existing deflection transducers firmly because most bridges span rivers, seastraits, highways, and mountainous terrain. Therefore, a more convenient, easier to set up, and moreaffordable deflection monitoring system for bridges has become one of the current urgent requirements.
Over the past few years, a large number of bridge deflection monitoring attempts have beenconducted. Dial gauges and linear variable differential transformers (LVDTs) are traditional instrumentsfor direct bridge deflection measurement. Measurement can be achieved by those direct measuringtools in both static and dynamic areas. However, using a fixed platform near or under the measurementpoints as a reference point is inevitable. The transducers should be installed by connecting the referencepoint and measurement point of the measuring object. However, the gaps between the reference point
Sensors 2020, 20, 480; doi:10.3390/s20020480 www.mdpi.com/journal/sensors

Sensors 2020, 20, 480 2 of 14
and measurement point can be unpredictable if locations of the bridges are uncertain. A temporaryscaffold is helpful to solve this problem, but additional apparatuses will cause larger errors and extracosts. Furthermore, those direct measurement technologies are unsuitable when bridges have a largebottom space [1,2]. To overcome these problems, other automatic deflection measurement techniquesare usually used for bridges. Bridge deflection measurement can be performed without accessing thestructure for either the observation or to connect the platform to the ground [3].
Global positioning systems (GPS), acceleration-based methods, strain-based methods, lasertechnology, radar technology, microwave interferometers, connected pipe systems, and so on areall automatic measurement techniques. Among them, GPS has shown good practicability in recentyears. It has been successfully applied to measure the deflection of long-span bridges and the onlyequipment required is a GPS receptor antenna, which should be installed at the observation points.Good environmental suitability and long-term reliability can be achieved [4,5]. As a developingtechnology, GPS has practical difficulties in its application. Achievable accuracy is a major barrier, andit is affected by many factors and limitations, such as tracking enough satellites with well-distributedgeometries during the lifecycle of a structure. Moreover, the high cost is another practical problem inGPS-based deflection measurement.
For acceleration-based methods, the dynamic response of the deflection can be obtained bydouble integration of corresponding acceleration responses with appropriate baseline corrections [6].Faulkner et al. [7] proposed that in order to obtain the bridge displacement time history by numericalintegration, the sampling rate is an important factor in the process of acceleration acquisition, andseveral bridge displacement response calculation methods using measured acceleration data wereevaluated. Lee et al. [8] integrated the acceleration data in the frequency domain to estimate thestructural deflection. Park et al. [9] developed a low-cost, acceleration-based wireless displacementmonitoring system for civil engineering structures. The acceleration-based method is convenient,low-cost, and attractive, but lacks reliability in field testing.
For strain-based displacement estimation, Wang et al. [10] proposed a strain-sensor-basedmethod to estimate the displacement response using the strain mode shapes of beam structures.Glaser et al. [11] determined the mode shape of a beam structure based on corresponding curvatureand strain measurements. Numerical simulations and experimental investigations were presented toverify his proposed method. The strain-based methods, similar to the acceleration-based methods, arealso sensitive to noise, and complex algorithms are involved in extracting displacement from strain,which make their use difficult for practical applications.
Zhang et al. [12] focused on remote monitoring of vibration displacement responses of twolong-span bridges using the Gamma portable radar interferometer, which is a developed multimodemicrowave interferometric radar system. Liu et al. [13] monitored dynamic responses usingground-based microwave interferometry and then analyzed ancient bridge vibration using theextreme-point symmetric mode decomposition method. However, the mentioned devices are high-costand the corresponding method is difficult to use for in-site implementation.
Vision-based methods offer a good substitute to bridge deflection measurement. Vicente et al. [14]presented a new laser- and video-based displacement transducer for monitoring of structuraldisplacements and rotations. The proposed system combines laser beams, LED lights, and a digitalvideo camera. This system was proposed for static and slow-varying displacement monitoring.Lydon et al. [15] presented a non-contact, multipoint displacement measurement system basedon multiple synchronized wireless cameras, and calculated the displacements using the computervision technique, providing a valuable insight into the states of bridge structures in operationalconditions. Feng et al. [16] developed a subpixel template matching technique based vision sensorsystem for non-contact measurement of structural displacement. Xu et al. [17] proposed a low-cost,vision-based system for multipoint displacement measurement using a consumer-grade camera forvideo acquisition and a custom-developed package for video processing. However, there are still lotsof problems with this system, such as difficulties with stable camera mounting [18], measurement

Sensors 2020, 20, 480 3 of 14
errors derived from lighting changes [19], and light refraction caused by atmospheric effects, especiallyfor long-range measurements.
One of the effective methods is a connected pipe system, which is applicable to both short- andlong-term structural deflection monitoring by employing the liquid leveling system as a deflectionreference. This technology has been developed over more than 40 years and many research studieshave illustrated its efficiency [20,21]. Liu et al. [22] discussed a connected pipe system based deflectionmonitoring and condition evaluation for a suspension bridge in China, and a series of load tests werealso conducted to validate the proposed system. Zhu et al. [23] presented the health monitoring systemon Dafosi Bridge. The deflections of this bridge were mainly obtained through a communicatingoptoelectronic pipe sensor, namely the connected pipe system. Ye et al. [24] proposed a liquid levelsensing system to monitor the static and dynamic deflections of a bridge. The sensing elements of thissystem were pressure transmitters, and this system was improved by a step-type pipeline to removethe interference of the inclination angle [25].
This research proposes an improved connected pipe system for bridge deflection monitoring andthe plastic optical fiber is used to fabricate the liquid level sensing element in the system. Compared toother sensing techniques for level acquisition, the plastic optical fiber is less expensive and is easy toinstall and maintain. More importantly, on the application side [26], it is easy to construct and theinterrogation is simple and very low-cost. To obtain the deflection from the system, a simple formularelated to the variation of the liquid level is also applied.
2. Connected Pipe System for Bridge Deflection Monitoring
The connected pipe method consists of the pipe system, liquid, cylinders attached at the structure,and the liquid level sensing element, which is the element used for deflection acquisition. The connectedpipe system and sensing element are discussed in Sections 2.1 and 2.2, respectively. The manufactureof the sensing element is presented in Section 2.3.
2.1. Principle of the Connected Pipe System
The connected pipe system is a well-established tool used to perform static structural deflectionmonitoring. This system is cost-effective, easy to install, precise, and is a reference for free structuralvertical displacement monitoring technology, especially for long-span bridges.
In fact, this system is operated by a set of connected pipes and cylinders that are filled with theappropriate amount of liquid, and all connected cylinders are installed to the selected points at thestructure for relative vertical displacement measurements. The pipes and cylinders should also beextended to the bridge bearing or any point that can be considered a fixed point. In general, the liquidlevel will maintain a constant value in every cylinder along the whole system. The vertical deflectionof the structure will mean the positions of the cylinders vary, but the liquid level will still stay thesame. This will mean the relative height between the liquid level and the cylinders will vary, equalingthe vertical displacement of the structure. Moreover, the reading of the liquid level at the referencepoint should be subtracted from the values of vertical displacement, so that the calibrated verticaldisplacement can be obtained. The operating principle of the connected pipe system for the structuralrelative vertical displacement measurement is shown in Figure 1. Here, “A” is the measuring point ata bridge and “R” is the fixed point, which is the bridge bearing in most cases.

Sensors 2020, 20, 480 4 of 14Sensors 2020, 20, x 4 of 14
Figure 1. Fundamental principal of the connected pipe system.
The vertical displacement at “A” can be presented as:
( ) ( )i 0 i 0A t A,t R ,t R ,th h H h HΔ = − − −, (1)
where hΔ is the vertical deflection, iA t
h , and 0A t
H , are the distances between the top of the
cylinder and the liquid level when the structure is underformed and deformed at point “A”, respectively;
iR th , and
0R tH , are the distances between the top of the cylinder and the liquid level
when the structure is underformed and deformed at the reference point, respectively. Identically, the vertical displacement of other positions can also be obtained in the same way. In this system, the variants of the liquid level at the reference point and the selected points are all able to be measured by the plastic optical fiber sensing element =. Moreover, according to the variation of the level at the reference point, the state of the connected pipe system can be monitored by the sensor located at the reference point.
In general, the connected pipe system should be efficient and highly accurate, while the sensing element should be applicable if the whole system is installed properly. However, errors are inevitable, which often reduce the accuracy of the system. The common errors of the system and the strategies to eliminate the errors are discussed as follows: (1) The effect of temperature variations at different locations along the whole system is one of the error sources. (2) The air bubbles that exist in the system cause dramatic measurement error. These problems are difficult to avoid during the installation and operation of the system. One of considerations for avoiding errors is to eliminate the bubbles inside the pipe system, and Equation (1) can be helpful for removing temperature variations. Essentially, with careful consideration and installation, it is possible to minimize errors.
Another problem is the choice of liquid. Water is the most commonly selected liquid, and liquids with various characteristics can be used for different conditions, such as oil for extreme cold conditions because of its low freeze point. When adopting liquids with various densities, the sensitivity of the sensor can also be changed.
2.2. Basic Theory of the Liquid Level Sensor
As the sensing element, the liquid level sensor measures the distance variations between the top of the cylinder and the liquid level, which is equivalent to the vertical structural displacement at the selected point. As a substitute for a conventional electrical sensor, the proposed plastic optical fiber sensor (POFS) is simpler, easier to use, and low-cost. In truth, there are several types of fiber optic sensors, some of which are based on intensity change and others based on a Fabry-Perot interferometer. Antunes et al. [27] reviewed fiber Bragg grating (FBG) based structural health monitoring techniques in recent years. Tennyson et al. [28] summarized the implementation of FBG-based structural health monitoring for innovative bridges in Canada. Moreover, Higuera et al. [29]
Figure 1. Fundamental principal of the connected pipe system.
The vertical displacement at “A” can be presented as:
∆h =(hA,ti −HA,t0
)−
(hR,ti −HR,t0
)(1)
where ∆h is the vertical deflection, hA,ti and HA,t0 are the distances between the top of the cylinderand the liquid level when the structure is underformed and deformed at point “A”, respectively; hR,ti
and HR,t0 are the distances between the top of the cylinder and the liquid level when the structure isunderformed and deformed at the reference point, respectively. Identically, the vertical displacementof other positions can also be obtained in the same way. In this system, the variants of the liquid levelat the reference point and the selected points are all able to be measured by the plastic optical fibersensing element =. Moreover, according to the variation of the level at the reference point, the state ofthe connected pipe system can be monitored by the sensor located at the reference point.
In general, the connected pipe system should be efficient and highly accurate, while the sensingelement should be applicable if the whole system is installed properly. However, errors are inevitable,which often reduce the accuracy of the system. The common errors of the system and the strategiesto eliminate the errors are discussed as follows: (1) The effect of temperature variations at differentlocations along the whole system is one of the error sources. (2) The air bubbles that exist in the systemcause dramatic measurement error. These problems are difficult to avoid during the installation andoperation of the system. One of considerations for avoiding errors is to eliminate the bubbles insidethe pipe system, and Equation (1) can be helpful for removing temperature variations. Essentially,with careful consideration and installation, it is possible to minimize errors.
Another problem is the choice of liquid. Water is the most commonly selected liquid, and liquidswith various characteristics can be used for different conditions, such as oil for extreme cold conditionsbecause of its low freeze point. When adopting liquids with various densities, the sensitivity of thesensor can also be changed.
2.2. Basic Theory of the Liquid Level Sensor
As the sensing element, the liquid level sensor measures the distance variations between the topof the cylinder and the liquid level, which is equivalent to the vertical structural displacement at theselected point. As a substitute for a conventional electrical sensor, the proposed plastic optical fibersensor (POFS) is simpler, easier to use, and low-cost. In truth, there are several types of fiber opticsensors, some of which are based on intensity change and others based on a Fabry-Perot interferometer.Antunes et al. [27] reviewed fiber Bragg grating (FBG) based structural health monitoring techniquesin recent years. Tennyson et al. [28] summarized the implementation of FBG-based structural healthmonitoring for innovative bridges in Canada. Moreover, Higuera et al. [29] discussed four successfully

Sensors 2020, 20, 480 5 of 14
applied optical fiber sensor (OFS) technologies in SHM, and also summarized other useful fiber optictechnologies for SHM. On this basis, a novel POFS for liquid level measurement is discussed here.The setup of the proposed sensor is presented in Figure 2. This sensor is installed in the cylinderand connected to the system, and deflection can be obtained by the liquid height variation inside thecylinders when the bridge structure deforms.
Sensors 2020, 20, x 5 of 14
discussed four successfully applied optical fiber sensor (OFS) technologies in SHM, and also summarized other useful fiber optic technologies for SHM. On this basis, a novel POFS for liquid level measurement is discussed here. The setup of the proposed sensor is presented in Figure 2. This sensor is installed in the cylinder and connected to the system, and deflection can be obtained by the liquid height variation inside the cylinders when the bridge structure deforms.
Figure 2. Optical-fiber-based liquid sensor setup. Note: PTFE = polytetrafluoroethylene.
The proposed POFS contains a floating block, two polytetrafluoroethylene (PTFE) tubes, and plastic optical fibers. The working principle of the sensor is based on the Archimedes principle. The floating block is suspended by its buoyancy. When the structure deforms, the distance between the top of the cylinders and the liquid level varies accordingly. Therefore, the positions of the floating blocks in the cylinders will be changed due to buoyancy, reflecting the deflection of corresponding points of the structure. The polytetrafluoroethylene (PTFE) tubes and plastic optical fibers then transfer the deflection to the intensity change in the optical fiber. As Figure 2 shows, d is the magnitude of the gap between the separated fibers that equals the distance variation between the floating block and the top of the cylinder. Thus, by measuring d, the bridge deflection can be obtained, which the proposed POFS was designed for. The cylinder is plastic, and a rigid base is designed for this cylinder to make this cylinder easy to install at selected points of the structures. The internal suspended body is composed of cystosepiment and its density is apparently lower than the liquid, meaning it will always float on top of the liquid.
The basic principle of the proposed POFS mainly depends on the light intensity modulation with the distance change between the two cleaved plastic optical fibers. Here, the two cleaved glass fibers are secured by PTFE tubes to form the sensing gauge, and the separation of the cleaved ends varies. Hence, the light intensity in the circuit will be changed according to the distance in the tube when the structure deforms. The attachment of the PTFE tube to the cylinders, allowing displacement to be transferred to the sensor without loss, is critical. The relationship between d and intensity loss is well discussed in [30], and the operating principle is illustrated in Figure 3. The relative motion of the two-faced POFS renders the output light intensity variation. The relationship between the light intensity and the gaps of the POFS will be presented briefly as follows. Light emits from the source fiber, assuming that the energy distribution is homogeneous; its half-angle at the apex is denoted as θmax; D is the diameter of the fiber; d is the displacement to be measured; and the intensity loss is equivalent to the logarithm of the receiving fiber core area and the total area ratio, which can be given as:
Figure 2. Optical-fiber-based liquid sensor setup. Note: PTFE = polytetrafluoroethylene.
The proposed POFS contains a floating block, two polytetrafluoroethylene (PTFE) tubes, andplastic optical fibers. The working principle of the sensor is based on the Archimedes principle. Thefloating block is suspended by its buoyancy. When the structure deforms, the distance between the topof the cylinders and the liquid level varies accordingly. Therefore, the positions of the floating blocksin the cylinders will be changed due to buoyancy, reflecting the deflection of corresponding pointsof the structure. The polytetrafluoroethylene (PTFE) tubes and plastic optical fibers then transfer thedeflection to the intensity change in the optical fiber. As Figure 2 shows, d is the magnitude of the gapbetween the separated fibers that equals the distance variation between the floating block and the topof the cylinder. Thus, by measuring d, the bridge deflection can be obtained, which the proposed POFSwas designed for. The cylinder is plastic, and a rigid base is designed for this cylinder to make thiscylinder easy to install at selected points of the structures. The internal suspended body is composedof cystosepiment and its density is apparently lower than the liquid, meaning it will always float ontop of the liquid.
The basic principle of the proposed POFS mainly depends on the light intensity modulation withthe distance change between the two cleaved plastic optical fibers. Here, the two cleaved glass fibersare secured by PTFE tubes to form the sensing gauge, and the separation of the cleaved ends varies.Hence, the light intensity in the circuit will be changed according to the distance in the tube whenthe structure deforms. The attachment of the PTFE tube to the cylinders, allowing displacement tobe transferred to the sensor without loss, is critical. The relationship between d and intensity loss iswell discussed in [30], and the operating principle is illustrated in Figure 3. The relative motion ofthe two-faced POFS renders the output light intensity variation. The relationship between the lightintensity and the gaps of the POFS will be presented briefly as follows. Light emits from the sourcefiber, assuming that the energy distribution is homogeneous; its half-angle at the apex is denotedas θmax; D is the diameter of the fiber; d is the displacement to be measured; and the intensity loss

Sensors 2020, 20, 480 6 of 14
is equivalent to the logarithm of the receiving fiber core area and the total area ratio, which can begiven as:
η= −10 log10
(
D2 + d tanθmax
)2(D2
)2
(2)
Sensors 2020, 20, x 6 of 14
2
max
10 2
D d tan2=-10 log
D2
θη
+
(2)
To simplify Equation (2), this becomes:
2
10 max2d=-10 log 1 tanD
η θ +
(3)
Figure 3. The schematic diagram of the sensing principle.
In addition, the stiffness and length of the PTFE tube may limit the amount of stretch, as well as the limited measuring range of the displacement. The measurement range also depends on the power of the light source. In this paper, a normal LED light source is applied for verification, its power is 20 mW, and the visible wavelength is 630 nm.
2.3. Manufacture of Liquid Level Sensing Element
The proposed sensor is low-cost, simple, and easy to be implemented. However, the quality of the cutting surface and U-fiber fixation are crucial for the working performance of the sensor. In this study, face machining was conducted by hot cutting and the ends were polished after cutting, as shown in Figure 4. The U-fiber fixation was handled by a U-shape glass tube, shown in Figure 5.
Figure 4. Equipment used for plastic optical fiber end cutting.
Figure 3. The schematic diagram of the sensing principle.
To simplify Equation (2), this becomes:
η= −10 log10
(1 +
2dD
tanθmax
)2
(3)
In addition, the stiffness and length of the PTFE tube may limit the amount of stretch, as well asthe limited measuring range of the displacement. The measurement range also depends on the powerof the light source. In this paper, a normal LED light source is applied for verification, its power is20 mW, and the visible wavelength is 630 nm.
2.3. Manufacture of Liquid Level Sensing Element
The proposed sensor is low-cost, simple, and easy to be implemented. However, the quality of thecutting surface and U-fiber fixation are crucial for the working performance of the sensor. In this study,face machining was conducted by hot cutting and the ends were polished after cutting, as shown inFigure 4. The U-fiber fixation was handled by a U-shape glass tube, shown in Figure 5.
Sensors 2020, 20, x 6 of 14
2
max
10 2
D d tan2=-10 log
D2
θη
+
(2)
To simplify Equation (2), this becomes:
2
10 max2d=-10 log 1 tanD
η θ +
(3)
Figure 3. The schematic diagram of the sensing principle.
In addition, the stiffness and length of the PTFE tube may limit the amount of stretch, as well as the limited measuring range of the displacement. The measurement range also depends on the power of the light source. In this paper, a normal LED light source is applied for verification, its power is 20 mW, and the visible wavelength is 630 nm.
2.3. Manufacture of Liquid Level Sensing Element
The proposed sensor is low-cost, simple, and easy to be implemented. However, the quality of the cutting surface and U-fiber fixation are crucial for the working performance of the sensor. In this study, face machining was conducted by hot cutting and the ends were polished after cutting, as shown in Figure 4. The U-fiber fixation was handled by a U-shape glass tube, shown in Figure 5.
Figure 4. Equipment used for plastic optical fiber end cutting. Figure 4. Equipment used for plastic optical fiber end cutting.

Sensors 2020, 20, 480 7 of 14Sensors 2020, 20, x 7 of 14
Figure 5. U-shaped plastic optical fiber fixing device.
3. Experimental Validation
To develop an advanced POFS-based connected pipe system, the plastic optical fibers can support this sensing technology to achieve better application. Compared to traditional sensors, the intensity-based POFs have more advantages, including immunity to electromagnetic interference, higher accuracy, smaller size, better anti-interference ability, and stability for long-distance transmission. As the sensing element is sensitive to the fiber diameter, bending radius of the U-shaped fiber, and the temperature variation, effective selection of the appropriate parameters for this element is difficult.
3.1. Setup for the Liquid Level Sensor Validation
A prototype of the POFS is fabricated for validation purpose. The full range of the sensor is designed to be 20 mm and the resolution is about 0.1 mm. Figure 6 shows the experimental setup of the proposed prototype. The POFS is installed in the cylinder, and a syringe is used for liquid injection to make the liquid level of the container vary. In order to evaluate the performance of proposed POFS and assure the effectiveness of the POFS-based connected pipe system in bridge deflection monitoring, laboratory tests are further carried out. The linearity, accuracy, and repeatability of the POFS are evaluated, and the stability and environment effect are also considered in the lab tests. Two cylinders with proposed sensors are assembled. They are connected by acrylic pipes and filled with water in the setup. The level is controlled by the volume of the injected water.
Figure 6. Experimental setup of a liquid level sensor. Note: DAQ = data acquisition; LED = light-emitting diode.
Figure 5. U-shaped plastic optical fiber fixing device.
3. Experimental Validation
To develop an advanced POFS-based connected pipe system, the plastic optical fibers cansupport this sensing technology to achieve better application. Compared to traditional sensors, theintensity-based POFs have more advantages, including immunity to electromagnetic interference,higher accuracy, smaller size, better anti-interference ability, and stability for long-distance transmission.As the sensing element is sensitive to the fiber diameter, bending radius of the U-shaped fiber, and thetemperature variation, effective selection of the appropriate parameters for this element is difficult.
3.1. Setup for the Liquid Level Sensor Validation
A prototype of the POFS is fabricated for validation purpose. The full range of the sensor isdesigned to be 20 mm and the resolution is about 0.1 mm. Figure 6 shows the experimental setup ofthe proposed prototype. The POFS is installed in the cylinder, and a syringe is used for liquid injectionto make the liquid level of the container vary. In order to evaluate the performance of proposed POFSand assure the effectiveness of the POFS-based connected pipe system in bridge deflection monitoring,laboratory tests are further carried out. The linearity, accuracy, and repeatability of the POFS areevaluated, and the stability and environment effect are also considered in the lab tests. Two cylinderswith proposed sensors are assembled. They are connected by acrylic pipes and filled with water in thesetup. The level is controlled by the volume of the injected water.
Sensors 2020, 20, x 7 of 14
Figure 5. U-shaped plastic optical fiber fixing device.
3. Experimental Validation
To develop an advanced POFS-based connected pipe system, the plastic optical fibers can support this sensing technology to achieve better application. Compared to traditional sensors, the intensity-based POFs have more advantages, including immunity to electromagnetic interference, higher accuracy, smaller size, better anti-interference ability, and stability for long-distance transmission. As the sensing element is sensitive to the fiber diameter, bending radius of the U-shaped fiber, and the temperature variation, effective selection of the appropriate parameters for this element is difficult.
3.1. Setup for the Liquid Level Sensor Validation
A prototype of the POFS is fabricated for validation purpose. The full range of the sensor is designed to be 20 mm and the resolution is about 0.1 mm. Figure 6 shows the experimental setup of the proposed prototype. The POFS is installed in the cylinder, and a syringe is used for liquid injection to make the liquid level of the container vary. In order to evaluate the performance of proposed POFS and assure the effectiveness of the POFS-based connected pipe system in bridge deflection monitoring, laboratory tests are further carried out. The linearity, accuracy, and repeatability of the POFS are evaluated, and the stability and environment effect are also considered in the lab tests. Two cylinders with proposed sensors are assembled. They are connected by acrylic pipes and filled with water in the setup. The level is controlled by the volume of the injected water.
Figure 6. Experimental setup of a liquid level sensor. Note: DAQ = data acquisition; LED = light-emitting diode. Figure 6. Experimental setup of a liquid level sensor. Note: DAQ = data acquisition; LED =
light-emitting diode.
Sensors 2020, 20, 480 8 of 14
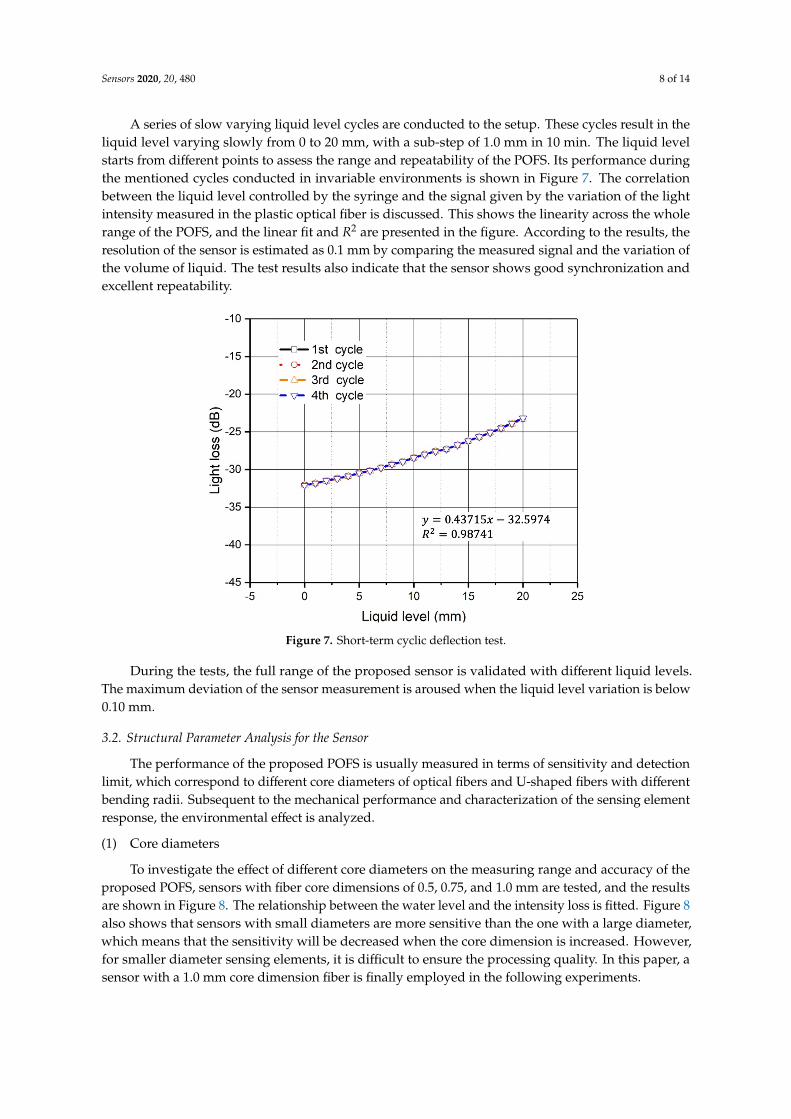
A series of slow varying liquid level cycles are conducted to the setup. These cycles result in theliquid level varying slowly from 0 to 20 mm, with a sub-step of 1.0 mm in 10 min. The liquid levelstarts from different points to assess the range and repeatability of the POFS. Its performance duringthe mentioned cycles conducted in invariable environments is shown in Figure 7. The correlationbetween the liquid level controlled by the syringe and the signal given by the variation of the lightintensity measured in the plastic optical fiber is discussed. This shows the linearity across the wholerange of the POFS, and the linear fit and R2 are presented in the figure. According to the results, theresolution of the sensor is estimated as 0.1 mm by comparing the measured signal and the variation ofthe volume of liquid. The test results also indicate that the sensor shows good synchronization andexcellent repeatability.
Sensors 2020, 20, x 8 of 14
A series of slow varying liquid level cycles are conducted to the setup. These cycles result in the liquid level varying slowly from 0 to 20 mm, with a sub-step of 1.0 mm in 10 min. The liquid level starts from different points to assess the range and repeatability of the POFS. Its performance during the mentioned cycles conducted in invariable environments is shown in Figure 7. The correlation between the liquid level controlled by the syringe and the signal given by the variation of the light intensity measured in the plastic optical fiber is discussed. This shows the linearity across the whole range of the POFS, and the linear fit and are presented in the figure. According to the results, the resolution of the sensor is estimated as 0.1 mm by comparing the measured signal and the variation of the volume of liquid. The test results also indicate that the sensor shows good synchronization and excellent repeatability.
Figure 7. Short-term cyclic deflection test.
During the tests, the full range of the proposed sensor is validated with different liquid levels. The maximum deviation of the sensor measurement is aroused when the liquid level variation is below 0.10 mm.
3.2. Structural Parameter Analysis for the Sensor
The performance of the proposed POFS is usually measured in terms of sensitivity and detection limit, which correspond to different core diameters of optical fibers and U-shaped fibers with different bending radii. Subsequent to the mechanical performance and characterization of the sensing element response, the environmental effect is analyzed.
(1) Core diameters
To investigate the effect of different core diameters on the measuring range and accuracy of the proposed POFS, sensors with fiber core dimensions of 0.5, 0.75, and 1.0 mm are tested, and the results are shown in Figure 8. The relationship between the water level and the intensity loss is fitted. Figure 8 also shows that sensors with small diameters are more sensitive than the one with a large diameter, which means that the sensitivity will be decreased when the core dimension is increased. However, for smaller diameter sensing elements, it is difficult to ensure the processing quality. In this paper, a sensor with a 1.0 mm core dimension fiber is finally employed in the following experiments.
Figure 7. Short-term cyclic deflection test.
During the tests, the full range of the proposed sensor is validated with different liquid levels.The maximum deviation of the sensor measurement is aroused when the liquid level variation is below0.10 mm.
3.2. Structural Parameter Analysis for the Sensor
The performance of the proposed POFS is usually measured in terms of sensitivity and detectionlimit, which correspond to different core diameters of optical fibers and U-shaped fibers with differentbending radii. Subsequent to the mechanical performance and characterization of the sensing elementresponse, the environmental effect is analyzed.
(1) Core diameters
To investigate the effect of different core diameters on the measuring range and accuracy of theproposed POFS, sensors with fiber core dimensions of 0.5, 0.75, and 1.0 mm are tested, and the resultsare shown in Figure 8. The relationship between the water level and the intensity loss is fitted. Figure 8also shows that sensors with small diameters are more sensitive than the one with a large diameter,which means that the sensitivity will be decreased when the core dimension is increased. However,for smaller diameter sensing elements, it is difficult to ensure the processing quality. In this paper, asensor with a 1.0 mm core dimension fiber is finally employed in the following experiments.

Sensors 2020, 20, 480 9 of 14Sensors 2020, 20, x 9 of 14
Figure 8. Plastic optical fiber sensor (POFS) performance test with different core diameters.
(2) Bending radius
Considering the effect of the bending radius of the proposed POFS, the experiment was conducted to compare the sensitivity of the sensor with different U-shaped fiber bending radii of 10, 12.5, 15, and 20 mm. As shown in Figure 9, different lines illustrate the performance of the U-shaped sensing element with different bending radii. In the figure, the relationship between liquid level and intensity loss are presented, and the lines of the water level and intensity loss are fitted. According to the results, the intensity loss of the sensing element with the large bending radius is similar to the one with the small bending radius, which means that the influence of the bending radius is limited. Meanwhile, it reveals that the bending radius has a critical value, and when the bending radius of the U-shaped POFS is larger than it, the effect of the change of the bending radius is negligible and tends to be stabilized.
(3) Influence of the temperature
To develop an advanced POFS-based connected pipe system, the intensity-change-based POFS can support this sensing technology to achieve a better effect on the liquid level sensing element of this system. To investigate the temperature effect on the proposed POFS, an experiment is conducted in a small chamber, in which the temperatures varies from −5 °C to 40 °C. According to the results obtained from the test, as shown in Figure 10, the temperature variation has little effect on the proposed sensor. In the described conditions, the approximated periodic measurement error is less than 1%.
2
y 0.45053 38.555740.98008
xR
= −=
2
y 0.44642 35.093150.98219
xR
= −=
2
y 0.43715 32.59740.98741
xR
= −=1 1.0mmD =
2 0.75mmD =
3 0.5mmD =
1 1.0mmD =
2 0.75mmD =
3 0.5mmD =
0 2 4 6 8 10 12 14 16 18 20 22 24
-35
-30
-25
-20
-15
-10
Liquid Level(mm)
Test Cycle 1Test Cycle 2Test Cycle 3Test Cycle 4
Ligh
t Los
s(dB
)
Figure 8. Plastic optical fiber sensor (POFS) performance test with different core diameters.
(2) Bending radius
Considering the effect of the bending radius of the proposed POFS, the experiment was conductedto compare the sensitivity of the sensor with different U-shaped fiber bending radii of 10, 12.5, 15,and 20 mm. As shown in Figure 9, different lines illustrate the performance of the U-shaped sensingelement with different bending radii. In the figure, the relationship between liquid level and intensityloss are presented, and the lines of the water level and intensity loss are fitted. According to the results,the intensity loss of the sensing element with the large bending radius is similar to the one with thesmall bending radius, which means that the influence of the bending radius is limited. Meanwhile, itreveals that the bending radius has a critical value, and when the bending radius of the U-shaped POFSis larger than it, the effect of the change of the bending radius is negligible and tends to be stabilized.
(3) Influence of the temperature
To develop an advanced POFS-based connected pipe system, the intensity-change-based POFScan support this sensing technology to achieve a better effect on the liquid level sensing element of thissystem. To investigate the temperature effect on the proposed POFS, an experiment is conducted in asmall chamber, in which the temperatures varies from −5 ◦C to 40 ◦C. According to the results obtainedfrom the test, as shown in Figure 10, the temperature variation has little effect on the proposed sensor.In the described conditions, the approximated periodic measurement error is less than 1%.

Sensors 2020, 20, 480 10 of 14Sensors 2020, 20, x 10 of 14
Figure 9. POFS performance test with different bending radii.
Figure 10. POFS performance test at different temperatures.
4. Experimental Study
4.1. Experimental Setup
The experimental setup in this study is shown in Figure 11, which is composed of four components: connected pipes, plastic optical fiber liquid level sensors, data (obtained via data acquisition, DAQ), and a simple supported beam. The scheme for the use of multiple sensors is depicted in Figure 11a. Each sensor forms an independent channel together with its own light source and photodiode, and then the signal in each channel can be acquired by DAQ. In addition, the mentioned light source and photodiode are inexpensive and easy to purchase. Figure 11b is a photo of the installed system in the laboratory.
1 20mmR =
2 15mmR =
3 12.5mmR =
4 10mmR =
2
y 0.43754 31.87290.98855
xR
= −
=
2
y 0.43718 32.17280.98849
xR
= −
=
2
y 0.43715 32.59740.98741
xR
= −
=
2
y 0.43705 39.57280.98845
xR
= −
=
1R
2R
3R
4R
0 2 4 6 8 10 12 14 16 18 20 22 24
-35
-30
-25
-20
-15
Ligh
t Los
s(dB
)
Liquid Level(mm)
-5 0 5 10 15 20 25 30 35 40-29.88
-29.86
-29.84
-29.82
-29.80
-29.78
-29.76
Li
ght L
oss(
dB)
Temperature(°C)
Test Cycle 1 Test Cycle 2 Test Cycle 3 Test Cycle 4
Figure 9. POFS performance test with different bending radii.
Sensors 2020, 20, x 10 of 14
Figure 9. POFS performance test with different bending radii.
Figure 10. POFS performance test at different temperatures.
4. Experimental Study
4.1. Experimental Setup
The experimental setup in this study is shown in Figure 11, which is composed of four components: connected pipes, plastic optical fiber liquid level sensors, data (obtained via data acquisition, DAQ), and a simple supported beam. The scheme for the use of multiple sensors is depicted in Figure 11a. Each sensor forms an independent channel together with its own light source and photodiode, and then the signal in each channel can be acquired by DAQ. In addition, the mentioned light source and photodiode are inexpensive and easy to purchase. Figure 11b is a photo of the installed system in the laboratory.
1 20mmR =
2 15mmR =
3 12.5mmR =
4 10mmR =
2
y 0.43754 31.87290.98855
xR
= −
=
2
y 0.43718 32.17280.98849
xR
= −
=
2
y 0.43715 32.59740.98741
xR
= −
=
2
y 0.43705 39.57280.98845
xR
= −
=
1R
2R
3R
4R
0 2 4 6 8 10 12 14 16 18 20 22 24
-35
-30
-25
-20
-15
Ligh
t Los
s(dB
)
Liquid Level(mm)
-5 0 5 10 15 20 25 30 35 40-29.88
-29.86
-29.84
-29.82
-29.80
-29.78
-29.76
Li
ght L
oss(
dB)
Temperature(°C)
Test Cycle 1 Test Cycle 2 Test Cycle 3 Test Cycle 4
Figure 10. POFS performance test at different temperatures.
4. Experimental Study
Experimental Setup
The experimental setup in this study is shown in Figure 11, which is composed of four components:connected pipes, plastic optical fiber liquid level sensors, data (obtained via data acquisition, DAQ),and a simple supported beam. The scheme for the use of multiple sensors is depicted in Figure 11a.Each sensor forms an independent channel together with its own light source and photodiode, andthen the signal in each channel can be acquired by DAQ. In addition, the mentioned light source andphotodiode are inexpensive and easy to purchase. Figure 11b is a photo of the installed system inthe laboratory.

Sensors 2020, 20, 480 11 of 14Sensors 2020, 20, x 11 of 14
(a)
(b)
Figure 11. Experimental set-up of the deflection test: (a) the scheme for the employment of the POFS-based deflection monitoring system; (b) the installed system in the laboratory.
A four-point bending test is employed, with the step-loading imposed on the simple supported beam increased from 10 to 90 kN, with a 10 kN increase at each step. Figure 12 shows the load placement of the static load test. The proposed deflection monitoring system is installed on the beam, and a water container is deployed at a fixed point outside the beam. Cylinders and containers are connected by acrylic pipes, and water is applied as liquid injected inside the system. Three LVDTs, whose measure error is less than 0.001 mm, are employed to measure the deflection of the beam. The original displacement data, measured after the weights are placed at specific locations, are compared with the LVDT results later. The results are presented in Figure 13.
Figure 12. Load placement in the experiment.
0.75m 0.75m 0.75m 0.75m
1.00m 1.00m 1.00m
POF Sensor Load Load
LED
O/E
DAQ
PC
Beam Communicating Pipes
Elvation
Figure 11. Experimental set-up of the deflection test: (a) the scheme for the employment of thePOFS-based deflection monitoring system; (b) the installed system in the laboratory.
A four-point bending test is employed, with the step-loading imposed on the simple supportedbeam increased from 10 to 90 kN, with a 10 kN increase at each step. Figure 12 shows the loadplacement of the static load test. The proposed deflection monitoring system is installed on the beam,and a water container is deployed at a fixed point outside the beam. Cylinders and containers areconnected by acrylic pipes, and water is applied as liquid injected inside the system. Three LVDTs,whose measure error is less than 0.001 mm, are employed to measure the deflection of the beam. Theoriginal displacement data, measured after the weights are placed at specific locations, are comparedwith the LVDT results later. The results are presented in Figure 13.
Sensors 2020, 20, x 11 of 14
(a)
(b)
Figure 11. Experimental set-up of the deflection test: (a) the scheme for the employment of the POFS-based deflection monitoring system; (b) the installed system in the laboratory.
A four-point bending test is employed, with the step-loading imposed on the simple supported beam increased from 10 to 90 kN, with a 10 kN increase at each step. Figure 12 shows the load placement of the static load test. The proposed deflection monitoring system is installed on the beam, and a water container is deployed at a fixed point outside the beam. Cylinders and containers are connected by acrylic pipes, and water is applied as liquid injected inside the system. Three LVDTs, whose measure error is less than 0.001 mm, are employed to measure the deflection of the beam. The original displacement data, measured after the weights are placed at specific locations, are compared with the LVDT results later. The results are presented in Figure 13.
Figure 12. Load placement in the experiment.
0.75m 0.75m 0.75m 0.75m
1.00m 1.00m 1.00m
POF Sensor Load Load
LED
O/E
DAQ
PC
Beam Communicating Pipes
Elvation
Figure 12. Load placement in the experiment.

Sensors 2020, 20, 480 12 of 14
Sensors 2020, 20, x 12 of 14
(a)
(b)
Figure 13. Comparison of the experiment results: (a) results at mid-span of the beam; (b) results at the quarter-span of the beam. Note: FEM = Finite element method.
The experimental results can provide useful information on the proposed system for real bridge applications. Figure 13 shows the displacements obtained in the quarter- and mid-span points of the beam during the load cycles. The results were achieved with sampling every 1 min, and each sample was obtained according to the average of 10 readings when the sampling rate was 1Hz. After this smoothing procedure, the residual perturbations resulting from the disturbance of the beam can be removed. In Figure 13, it is obvious that the displacements obtained in different sections of the simple supported beam during the load cycles were found to accord well with the numerical results and results of LVDTs, especially for the deflection of the mid-span. Regardless of whether the deflection increases or decreases, the proposed system always performs well when measuring the beam deflection.
Figure 13. Comparison of the experiment results: (a) results at mid-span of the beam; (b) results at thequarter-span of the beam. Note: FEM = Finite element method.
The experimental results can provide useful information on the proposed system for real bridgeapplications. Figure 13 shows the displacements obtained in the quarter- and mid-span points of thebeam during the load cycles. The results were achieved with sampling every 1 min, and each samplewas obtained according to the average of 10 readings when the sampling rate was 1 Hz. After thissmoothing procedure, the residual perturbations resulting from the disturbance of the beam can beremoved. In Figure 13, it is obvious that the displacements obtained in different sections of the simplesupported beam during the load cycles were found to accord well with the numerical results and resultsof LVDTs, especially for the deflection of the mid-span. Regardless of whether the deflection increasesor decreases, the proposed system always performs well when measuring the beam deflection.

Sensors 2020, 20, 480 13 of 14
5. Conclusions
In this paper, a POFS-based connected pipe system for bridge deflection measurement is proposed,and it is validated by a series of experiments. The developed system consists of a connected pipe and anovel plastic optical fiber liquid level sensor. The basic principle, fabrication, and characteristics of theproposed system are discussed in detail. Lab tests are conducted to reveal the linearity, accuracy, andstability of the developed system, and the deflection of the test beam is measured by the sensor, whichagrees with LVTD within 0.1 mm. The effects of the environment on the proposed system are alsodiscussed in this paper. Under conditions of varying temperatures, stable responses can be observed.The developed sensor presents a variation of 1.90% with the temperature varying from −5 to 40 ◦Cand the sensibility of sensor is of the order of 0.44 dB/mm of displacement. The proposed systemshows excellent potential to be a robust bridge deflection monitoring technology for structural healthmonitoring systems.
The ability to build a distributed structural deflection monitoring network based on the proposedPOFS-based connected pipe system without any fixed reference point in situ is a great advantage for civilstructure monitoring, especially for long-span bridges. Some further works are still needed, for exampleexploring advanced sensor fabrication technologies and applications of novel materials for POFS inorder to enhance the stability and sensitivity and reduce the cost of this type of monitoring technology.
Author Contributions: Conceptualization, methodology, validation, formal analysis, investigation,writing—original draft preparation, writing—review and editing, D.Y.; validation, formal analysis, andinvestigation, J.-Q.W.; conceptualization, resources, supervision, and project administration, W.-X.R.;writing—review and editing, J.Z. All authors have read and agreed to the published version of the manuscript.
Funding: This research was funded by the National Natural Science Foundation of China (grant number 51308175and 51608162).
Conflicts of Interest: The authors declare no conflict of interest.
References
1. Lee, J.J.; Shinozuka, M. A vision-based system for remote sensing of bridge displacement. NDT E Int. 2006,39, 425–431. [CrossRef]
2. Hou, X.; Yang, X.; Huang, Q. Using inclinometers to measure bridge deflection. J. Bridge Eng. 2005, 10,564–569. [CrossRef]
3. Yoneyama, S.; Kitagawa, A.; Iwata, S.; Tani, K.; Kikuta, H. Bridge deflection measurement using digitalimage correlation. Exp. Tech. 2007, 31, 34–40. [CrossRef]
4. Watson, C.; Watson, T.; Coleman, R. Structural monitoring of cable-stayed bridge: Analysis of GPS versusmodeled deflections. J. Surv. Eng. 2007, 133, 23–28. [CrossRef]
5. Nickitopoulou, A.; Protopsalti, K.; Stiros, S. Monitoring dynamic and quasi-static deformations of largeflexible engineering structures with GPS: Accuracy, limitations and promises. Eng. Struct. 2006, 28, 1471–1482.[CrossRef]
6. Park, K.-T.; Kim, S.-H.; Park, H.-S.; Lee, K.-W. The determination of bridge displacement using measuredacceleration. Eng. Struct. 2005, 27, 371–378. [CrossRef]
7. Faulkner, B.C. Determination of Bridge Response Using Acceleration Data; Virginia Transportation ResearchCouncil: Charlottesville, VA, USA, 1996.
8. Lee, S.-G.; Lee, M.-T. Integration of measured acceleration to determine the vibration characteristics ofbridges. Comput. Struct. Eng. 1996, 9, 107–115.
9. Park, J.-W.; Sim, S.-H.; Jung, H.-J. Development of a wireless displacement measurement system usingacceleration responses. Sensors 2013, 13, 8377–8392. [CrossRef]
10. Wang, Z.-C.; Geng, D.; Ren, W.-X.; Liu, H.-T. Strain modes based dynamic displacement estimation of beamstructures with strain sensors. Smart Mater. Struct. 2014, 23, 125045. [CrossRef]
11. Glaser, R.; Caccese, V.; Shahinpoor, M. Shape monitoring of a beam structure from measured strain orcurvature. Exp. Mech. 2012, 52, 591–606. [CrossRef]

Sensors 2020, 20, 480 14 of 14
12. Zhang, B.; Ding, X.; Werner, C.; Tan, K.; Zhang, B.; Jiang, M.; Zhao, J.; Xu, Y. Dynamic displacementmonitoring of long-span bridges with a microwave radar interferometer. ISPRS J. Photogramm. Remote Sens.2018, 138, 252–264. [CrossRef]
13. Liu, X.; Lu, Z.; Yang, W.; Huang, M.; Tong, X. Dynamic monitoring and vibration analysis of ancient bridgesby ground-based microwave interferometry and the ESMD method. Remote Sens. 2018, 10, 770. [CrossRef]
14. Vicente, M.; Gonzalez, D.; Minguez, J.; Schumacher, T. A novel laser and video-based displacement transducerto monitor bridge deflections. Sensors 2018, 18, 970. [CrossRef] [PubMed]
15. Lydon, D.; Lydon, M.; del Rincón, J.M.; Taylor, S.E.; Robinson, D.; O’Brien, E.; Catbas, F.N. Development andField Testing of a Time-Synchronized System for Multi-Point Displacement Calculation Using Low-CostWireless Vision-Based Sensors. IEEE Sens. J. 2018, 18, 9744–9754. [CrossRef]
16. Feng, D.; Feng, M.; Ozer, E.; Fukuda, Y. A vision-based sensor for noncontact structural displacementmeasurement. Sensors 2015, 15, 16557–16575. [CrossRef]
17. Xu, Y.; Brownjohn, J.; Kong, D. A non-contact vision-based system for multipoint displacement monitoringin a cable-stayed footbridge. Struct. Control Health Monit. 2018, 25, e2155. [CrossRef]
18. Ribeiro, D.; Calçada, R.; Ferreira, J.; Martins, T. Non-contact measurement of the dynamic displacement ofrailway bridges using an advanced video-based system. Eng. Struct. 2014, 75, 164–180. [CrossRef]
19. Brownjohn, J.M.W.; Xu, Y.; Hester, D. Vision-based bridge deformation monitoring. Front. Built Environ.2017, 3, 23. [CrossRef]
20. Cho, N.; Kim, N.; Jang, J.; Chang, S. Estimation of deflection curve of bridges using fiber optic strain sensors.In Proceedings of the Smart Structures and Materials 2000: Smart Systems for Bridges, Structures, andHighways, New Port Beach, CA, USA, 6–8 March 2000; pp. 339–348.
21. Vurpillot, S.; Inaudi, D.; Scano, A. Mathematical model for the determination of the vertical displacementfrom internal horizontal measurements of a bridge. In Proceedings of the Smart Structures and Materials1996: Smart Systems for Bridges, Structures, and Highways, San Diego, CA, USA, 25–29 February 1996;pp. 46–53.
22. Liu, Y.; Deng, Y.; Cai, C. Deflection monitoring and assessment for a suspension bridge using a connectedpipe system: A case study in China. Struct. Control Health Monit. 2015, 22, 1408–1425. [CrossRef]
23. Zhu, Y.; Fu, Y.; Chen, W.; Huang, S. Online deflection monitoring system for Dafosi cable-stayed bridge.J. Intell. Mater. Syst. Struct. 2006, 17, 701–707. [CrossRef]
24. Ye, X.; Chen, B. Condition assessment of bridge structures based on a liquid level sensing system: Theory,verification and application. Arab. J. Sci. Eng. 2019, 44, 4405–4424. [CrossRef]
25. Ye, X.; Sun, Z.; Cai, X.; Mei, L. An Improved Step-Type Liquid Level Sensing System for Bridge StructuralDynamic Deflection Monitoring. Sensors 2019, 19, 2155. [CrossRef] [PubMed]
26. Kuang, K.; Quek, S.; Maalej, M. Assessment of an extrinsic polymer-based optical fibre sensor for structuralhealth monitoring. Meas. Sci. Technol. 2004, 15, 2133. [CrossRef]
27. Antunes, P.; Lima, H.; Alberto, N.; Bilro, L.; Pinto, P.; Costa, A.; Rodrigues, H.; Pinto, J.; Nogueira, R.;Varum, H. Optical sensors based on fiber Bragg gratings for structural health monitoring. In New Developmentsin Sensing Technology for Structural Health Monitoring; Springer: Basel, Switzerland, 2011; pp. 253–295.
28. Tennyson, R.; Mufti, A.; Rizkalla, S.; Tadros, G.; Benmokrane, B. Structural health monitoring of innovativebridges in Canada with fiber optic sensors. Smart Mater. Struct. 2001, 10, 560. [CrossRef]
29. Lopez-Higuera, J.M. Fiber optic sensors in structural health monitoring. In Proceedings of the 2010 Conferenceon Optical Fiber Communication (OFC/NFOEC), Collocated National Fiber Optic Engineers Conference,San Diego, CA, USA, 21–25 March 2010; pp. 1–20.
30. Yang, D.; Li, D.; Kuang, K. Fatigue crack monitoring in train track steel structures using plastic optical fibersensor. Meas. Sci. Technol. 2017, 28, 105103. [CrossRef]
© 2020 by the authors. Licensee MDPI, Basel, Switzerland. This article is an open accessarticle distributed under the terms and conditions of the Creative Commons Attribution(CC BY) license (http://creativecommons.org/licenses/by/4.0/).