a plea for adaptive data analysis an introduction to hht norden e. huang research center for...
Post on 20-Dec-2015
215 views
TRANSCRIPT

A Plea for Adaptive Data Analysis
An Introduction to HHT
Norden E. HuangResearch Center for Adaptive Data Analysis
National Central University

Ever since the advance of computer, there is an explosion of data.
The situation has changed from a thirsty for data to that of drinking from a fire hydrant.
We are drowning in data, but thirsty for
knowledge!

Henri Poincaré
Science is built up of facts*,
as a house is built of stones;
but an accumulation of facts is no more a science
than a heap of stones is a house.
* Here facts are indeed data.

Scientific Activities
Collecting, analyzing, synthesizing, and theorizing are the core of scientific activities.
Theory without data to prove is just hypothesis.
Therefore, data analysis is a key link in this continuous loop.

Data Analysis
Data analysis is too important to be left to the mathematicians.
Why?!

Different Paradigms IMathematics vs. Science/Engineering
• Mathematicians
• Absolute proofs
• Logic consistency
• Mathematical rigor
• Scientists/Engineers
• Agreement with observations
• Physical meaning
• Working Approximations

Different Paradigms IIMathematics vs. Science/Engineering
• Mathematicians
• Idealized Spaces
• Perfect world in which everything is known
• Inconsistency in the different spaces and the real world
• Scientists/Engineers
• Real Space
• Real world in which knowledge is incomplete and limited
• Constancy in the real world within allowable approximation

Rigor vs. Reality
As far as the laws of mathematics refer to reality, they are not certain; and as far as they are certain, they do not refer to reality.
Albert Einstein

Data Processing and Data Analysis
• Processing [proces < L. Processus < pp of Procedere = Proceed: pro- forward + cedere, to go] : A particular method of doing something.
• Data Processing >>>> Mathematically meaningful parameters
• Analysis [Gr. ana, up, throughout + lysis, a loosing] : A separating of any whole into its parts, especially with an examination of the parts to find out their nature, proportion, function, interrelationship etc.
• Data Analysis >>>> Physical understandings

Traditional Data Analysis
All traditional ‘data analysis’ methods are either developed by or established according to mathematician’s rigorous rules. They are really ‘data processing’ methods.
In pursue of mathematic rigor and certainty, however, we are forced toidealize, but also deviate from, the reality.

Traditional Data Analysis
As a result, we are forced to live in a pseudo-real world, in which all processes are
Linear and Stationary

削足適履
Trimming the foot to fit the shoe.

Available ‘Data Analysis’ Methodsfor Nonstationary (but Linear) time series
• Spectrogram• Wavelet Analysis• Wigner-Ville Distributions• Empirical Orthogonal Functions aka Singular Spectral
Analysis• Moving means• Successive differentiations

Available ‘Data Analysis’ Methodsfor Nonlinear (but Stationary and Deterministic)
time series
• Phase space method• Delay reconstruction and embedding• Poincaré surface of section• Self-similarity, attractor geometry & fractals
• Nonlinear Prediction
• Lyapunov Exponents for stability

Typical Apologia
• Assuming the process is stationary ….
• Assuming the process is locally stationary ….
• As the nonlinearity is weak, we can use perturbation approach ….
Though we can assume all we want, but
the reality cannot be bent by the assumptions.

掩耳盜鈴
Stealing the bell with muffed ears

Motivations for alternatives: Problems for Traditional Methods
• Physical processes are mostly nonstationary
• Physical Processes are mostly nonlinear
• Data from observations are invariably too short
• Physical processes are mostly non-repeatable.
Ensemble mean impossible, and temporal mean might not be meaningful for lack of stationarity and ergodicity. Traditional methods are inadequate.

The job of a scientist is to listen carefully to nature, not to tell nature how to behave.
Richard Feynman
To listen is to use adaptive method and let the data sing, and not to force the data to fit preconceived modes.
The Job of a Scientist
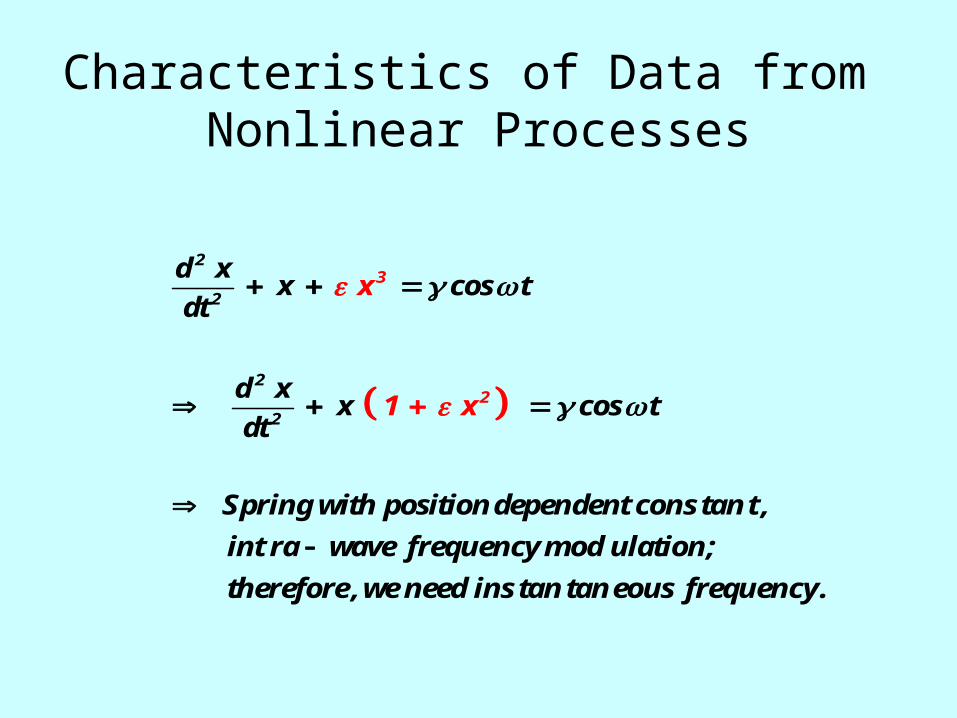
Characteristics of Data from Nonlinear Processes
32
2
2
22
d xx cos t
dt
d xx cos t
dt
Spring with positiondependent cons tan t ,
int ra wave frequency mod ulation;
therefore ,we need ins tan
x
1
taneous frequenc
x
y.

Duffing Pendulum
2
22( co .) s1
d xx tx
dt
x

Duffing Equation : Data

p
2 2 1 / 2 1
i ( t )
For any x( t ) L ,
1 x( )y( t ) d ,
t
then, x( t )and y( t ) form the analytic pairs:
z( t ) x( t ) i y( t ) ,
where
y( t )a( t ) x y and ( t ) tan .
x( t )
a( t ) e
Hilbert Transform : Definition
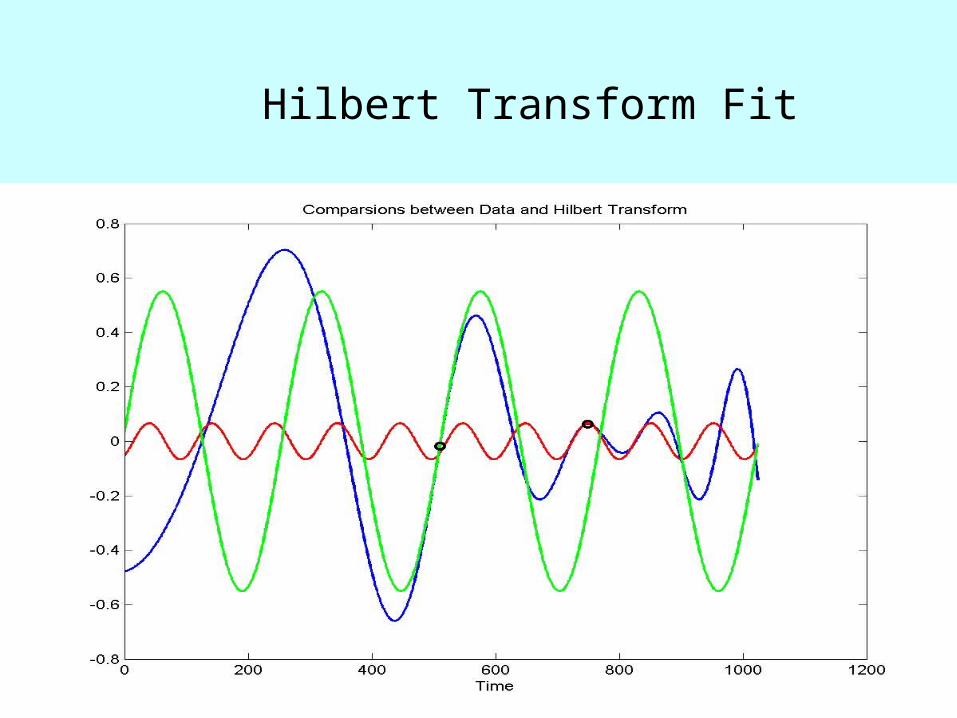
Hilbert Transform Fit

The Traditional View of the Hilbert Transform
for Data Analysis

Traditional Viewa la Hahn (1995) : Data LOD

Traditional Viewa la Hahn (1995) : Hilbert

Traditional Approacha la Hahn (1995) : Phase Angle

Traditional Approacha la Hahn (1995) : Phase Angle Details

Traditional Approacha la Hahn (1995) : Frequency

Why the traditional approach does not work?

Hilbert Transform a cos + b : Data

Hilbert Transform a cos + b : Phase Diagram

Hilbert Transform a cos + b : Phase Angle Details

Hilbert Transform a cos + b : Frequency

The Empirical Mode Decomposition Method and
Hilbert Spectral Analysis
Sifting

Empirical Mode Decomposition: Methodology : Test Data

Empirical Mode Decomposition: Methodology : data and m1

Empirical Mode Decomposition: Methodology : data & h1

Empirical Mode Decomposition: Methodology : h1 & m2

Empirical Mode Decomposition: Methodology : h3 & m4

Empirical Mode Decomposition: Methodology : h4 & m5

Empirical Mode DecompositionSifting : to get one IMF component
1 1
1 2 2
k 1 k k
k 1
x( t ) m h ,
h m h ,
.....
.....
h m h
.h c
.

The Stoppage Criteria
The Cauchy type criterion:
when SD is small than a pre-set value, where
T2
k 1 kt 0
T2
k 1t 0
h ( t ) h ( t )SD
h ( t )
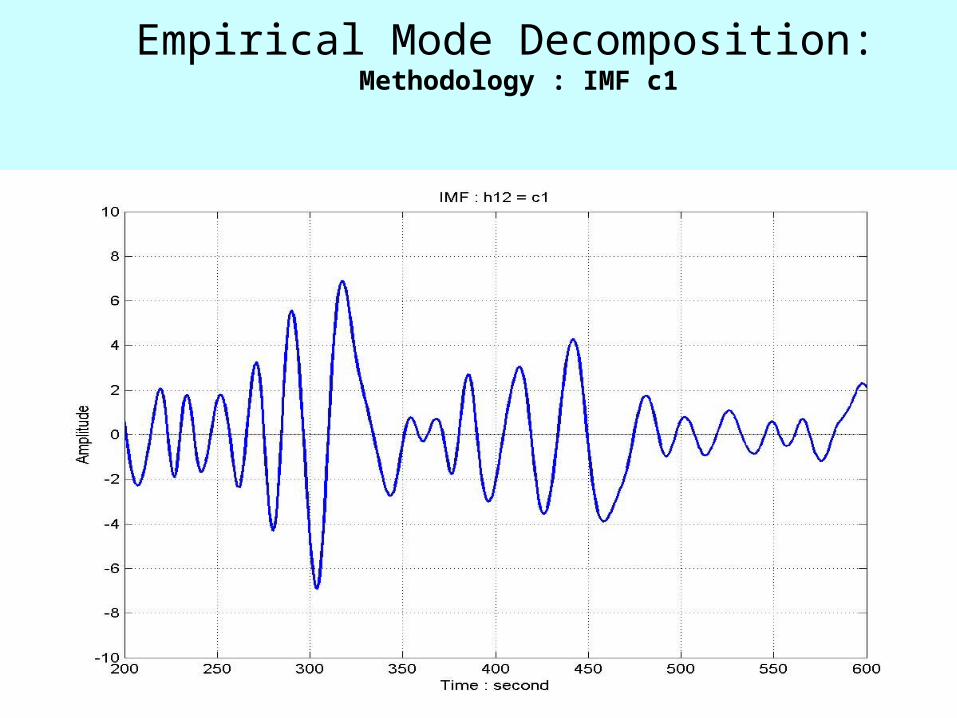
Empirical Mode Decomposition: Methodology : IMF c1

Definition of the Intrinsic Mode Function (IMF)
Any function having the same numbers of
zero cros sin gs and extrema,and also having
symmetric envelopes defined by local max ima
and min ima respectively is defined as an
Intrinsic Mode Function( IMF ).
All IMF enjoys good Hilbert Transfo
i ( t )
rm :
c( t ) a( t )e

Empirical Mode Decomposition: Methodology : data, r1 and m1

Empirical Mode DecompositionSifting : to get all the IMF components
1 1
1 2 2
n 1 n n
n
j nj 1
x( t ) c r ,
r c r ,
x( t ) c r
. . .
r c r .
.

Definition of Instantaneous Frequency
i ( t )
t
The Fourier Transform of the Instrinsic Mode
Funnction, c( t ), gives
W ( ) a( t ) e dt
By Stationary phase approximation we have
d ( t ),
dt
This is defined as the Ins tan taneous Frequency .
Definition of Frequency
Given the period of a wave as T ; the frequency is defined as
1.
T

Instantaneous Frequency
distanceVelocity ; mean velocity
time
dxNewton v
dt
1Frequency ; mean frequency
period
dHH
So that both v and
T defines the p
can appear in differential equations.
hase functiondt

The combination of Hilbert Spectral Analysis and
Empirical Mode Decomposition is designated as
HHT
(HHT vs. FFT)

Jean-Baptiste-Joseph Fourier
1807 “On the Propagation of Heat in Solid Bodies”
1812 Grand Prize of Paris Institute
“Théorie analytique de la chaleur”
‘... the manner in which the author arrives at these equations is not exempt of difficulties and that his analysis to integrate them still leaves something to be desired on the score of generality and even rigor.’
1817 Elected to Académie des Sciences
1822 Appointed as Secretary of Math Section
paper published
Fourier’s work is a great mathematical poem. Lord Kelvin

Comparison between FFT and HHT
j
j
t
i t
jj
i ( )d
jj
1. FFT :
x( t ) a e .
2. HHT :
x( t ) a ( t ) e .

Comparisons: Fourier, Hilbert & Wavelet

Speech Analysis Hello : Data

Four comparsions D

An Example of Sifting

Length Of Day Data

LOD : IMF
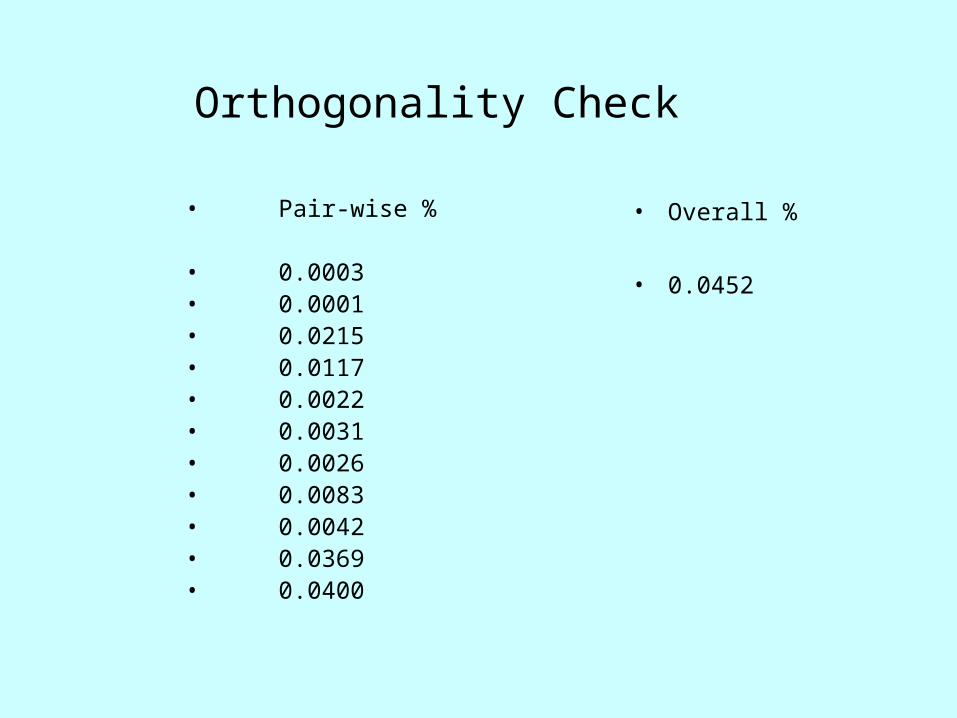
Orthogonality Check
• Pair-wise % • 0.0003• 0.0001• 0.0215• 0.0117• 0.0022• 0.0031• 0.0026• 0.0083• 0.0042• 0.0369• 0.0400
• Overall %
• 0.0452

LOD : Data & c12

LOD : Data & Sum c11-12

LOD : Data & sum c10-12

LOD : Data & c9 - 12

LOD : Data & c8 - 12

LOD : Detailed Data and Sum c8-c12
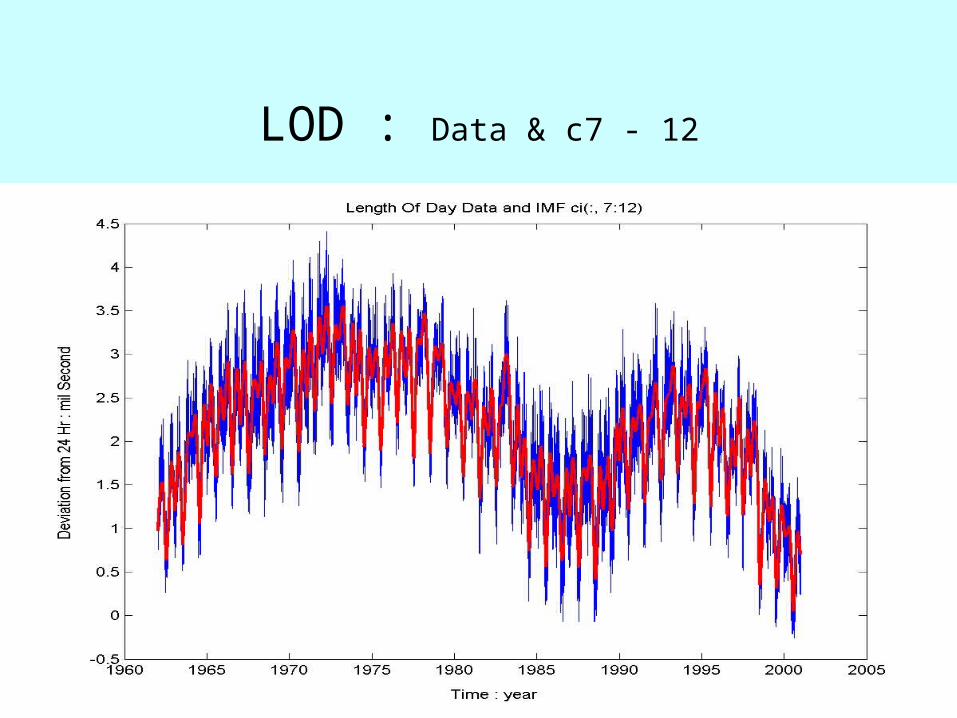
LOD : Data & c7 - 12

LOD : Detail Data and Sum IMF c7-c12

LOD : Difference Data – sum all IMFs

Traditional Viewa la Hahn (1995) : Hilbert

Mean Annual Cycle & Envelope: 9 CEI Cases

Properties of EMD Basis
The Adaptive Basis based on and derived from the data by the empirical method satisfy nearly all the traditional requirements for basis
a posteriori:
Complete
Convergent
Orthogonal
Unique
Hilbert’s View on Nonlinear Data

Duffing Type Wave
Data: x = cos(wt+0.3 sin2wt)

Duffing Type WavePerturbation Expansion
For 1 , we can have
x( t ) cos t sin 2 t
cos t cos sin 2 t sin t sin sin 2 t
cos t sin t sin 2 t ....
1 cos t cos 3 t ....2 2
This is very similar to the solutionof Duffing equation .
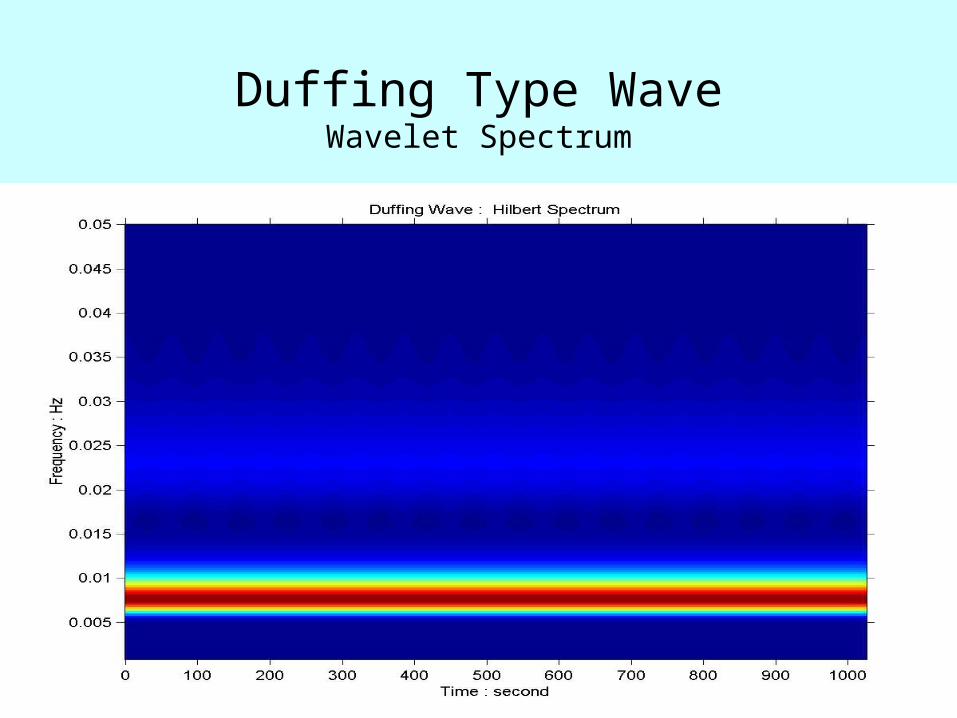
Duffing Type WaveWavelet Spectrum

Duffing Type WaveHilbert Spectrum

Duffing Type WaveMarginal Spectra

Duffing Equation
23
2.
Solved with for t 0 to 200 with
1
0.1
od
0.04 Hz
Initial condition :
[ x( o ) ,
d xx x c
x'( 0 ) ] [1
os t
, 1]
3
t
e2
d
tb

Duffing Equation : Data

Duffing Equation : IMFs

Duffing Equation : Hilbert Spectrum

Duffing Equation : Detailed Hilbert Spectrum

Duffing Equation : Wavelet Spectrum

Duffing Equation : Hilbert & Wavelet Spectra

What This Means
• Instantaneous Frequency offers a total different view for nonlinear data: instantaneous frequency with no need for harmonics and unlimited by uncertainty.
• Adaptive basis is indispensable for nonstationary and nonlinear data analysis
• HHT establishes a new paradigm of data analysis
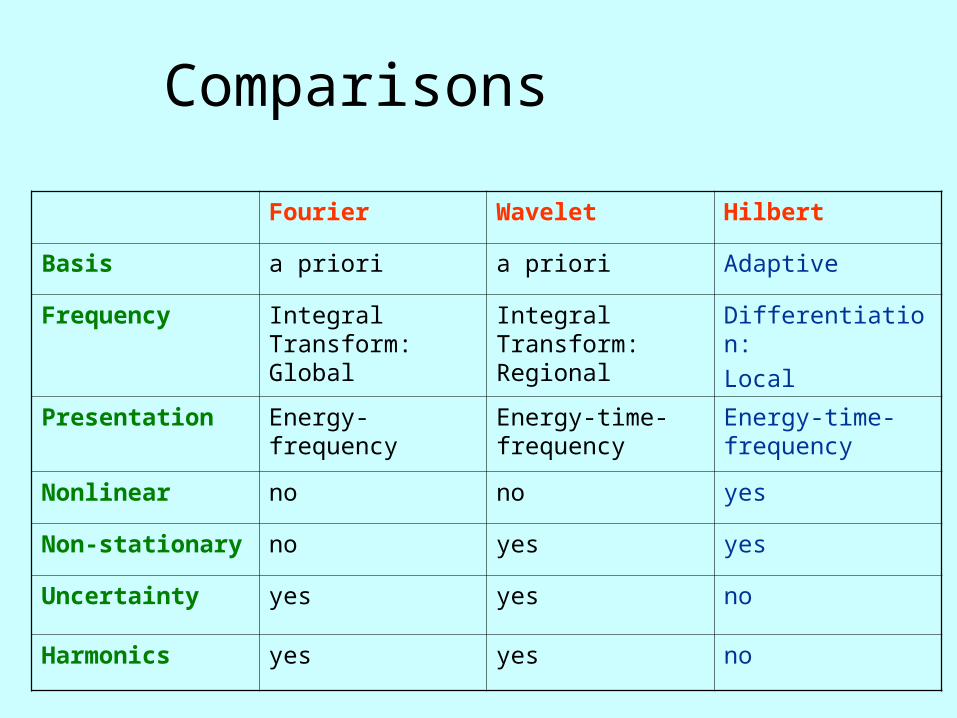
Comparisons
Fourier Wavelet Hilbert
Basis a priori a priori Adaptive
Frequency Integral Transform: Global
Integral Transform: Regional
Differentiation:
Local
Presentation Energy-frequency Energy-time-frequency
Energy-time-frequency
Nonlinear no no yes
Non-stationary no yes yes
Uncertainty yes yes no
Harmonics yes yes no

Conclusion
Adaptive method is the only scientifically meaningful way to analyze data.
It is the only way to find out the underlying physical processes; therefore, it is indispensable in scientific research.
It is physical, direct, and simple.

Current Applications
• Non-destructive Evaluation for Structural Health Monitoring – (DOT, NSWC, and DFRC/NASA, KSC/NASA Shuttle)
• Vibration, speech, and acoustic signal analyses– (FBI, MIT, and DARPA)
• Earthquake Engineering– (DOT)
• Bio-medical applications– (Harvard, UCSD, Johns Hopkins)
• Global Primary Productivity Evolution map from LandSat data – (NASA Goddard, NOAA)
• Cosmological Gravitational Wave– (NASA Goddard)
• Financial market data analysis– (NCU)
• Geophysical and Climate studies – (COLA, NASA, NCU)

Outstanding Mathematical Problems
1.Adaptive data analysis methodology in general
2.Nonlinear system identification methods
3.Prediction problem for nonstationary processes (end effects)
4.Optimization problem (the best IMF selection and uniqueness. Is there a unique solution?)
5.Spline problem (best spline implement of HHT, convergence and 2-D)
6.Approximation problem (Hilbert transform and quadrature)
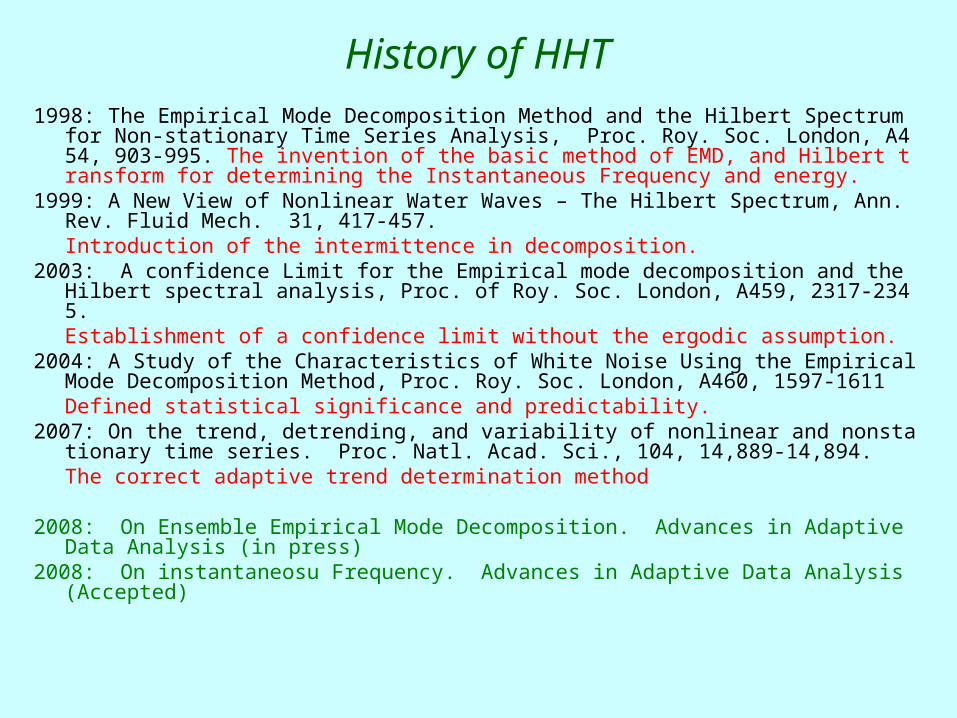
History of HHT1998: The Empirical Mode Decomposition Method and the Hilbert Spectrum for No
n-stationary Time Series Analysis, Proc. Roy. Soc. London, A454, 903-995. The invention of the basic method of EMD, and Hilbert transform for determining the Instantaneous Frequency and energy.
1999: A New View of Nonlinear Water Waves – The Hilbert Spectrum, Ann. Rev. Fluid Mech. 31, 417-457.
Introduction of the intermittence in decomposition. 2003: A confidence Limit for the Empirical mode decomposition and the Hilbert spe
ctral analysis, Proc. of Roy. Soc. London, A459, 2317-2345.Establishment of a confidence limit without the ergodic assumption.
2004: A Study of the Characteristics of White Noise Using the Empirical Mode Decomposition Method, Proc. Roy. Soc. London, A460, 1597-1611Defined statistical significance and predictability.
2007: On the trend, detrending, and variability of nonlinear and nonstationary time series. Proc. Natl. Acad. Sci., 104, 14,889-14,894.The correct adaptive trend determination method
2008: On Ensemble Empirical Mode Decomposition. Advances in Adaptive Data Analysis (in press)
2008: On instantaneosu Frequency. Advances in Adaptive Data Analysis (Accepted)

Advances in Adaptive data Analysis: Theory and Applications
A new journal to be published by the World Scientific
Under the joint Co-Editor-in-Chief
Norden E. Huang, RCADA NCUThomas Yizhao Hou, CALTECH
To be launched in the March 2008

Thanks!


Milankovitch Time scales: Temperature Data from Vostok Ice Core
Data length 3311 points covering 422,766 Years BP

Milutin Milankovitch 1879-1958

How the Sun Affects Climate: Solar and Milankovitch Cycles
The


A Truly Nonlinear World

Data and Even Spaced Spline at Dt=20 Year


Data and CKY11 with Error Bounds

Data and CKY10 with Error Bounds
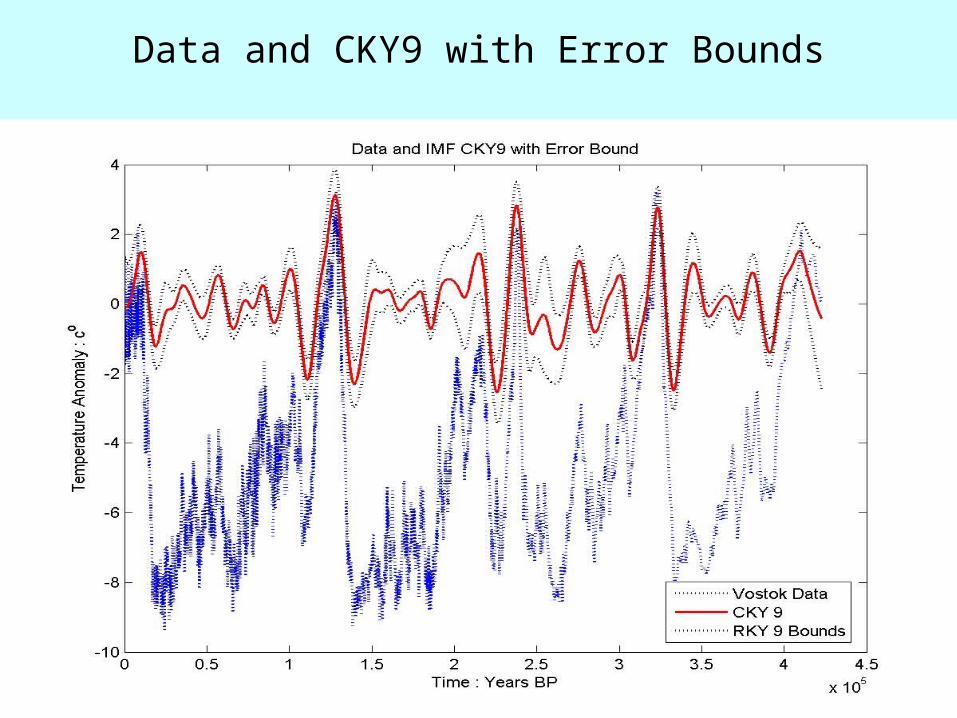
Data and CKY9 with Error Bounds

Data and CKY8 with Error Bounds

Data and Sum CKY 11 to 13 : 100K

Data and Sum CKY 10 to 13 : 40K

Data and Sum CKY 9 to 13 : 25K

Data and Sum CKY 8 to 13 : 10K

Data and Sum CKY 1 : 7 : Less than 10K
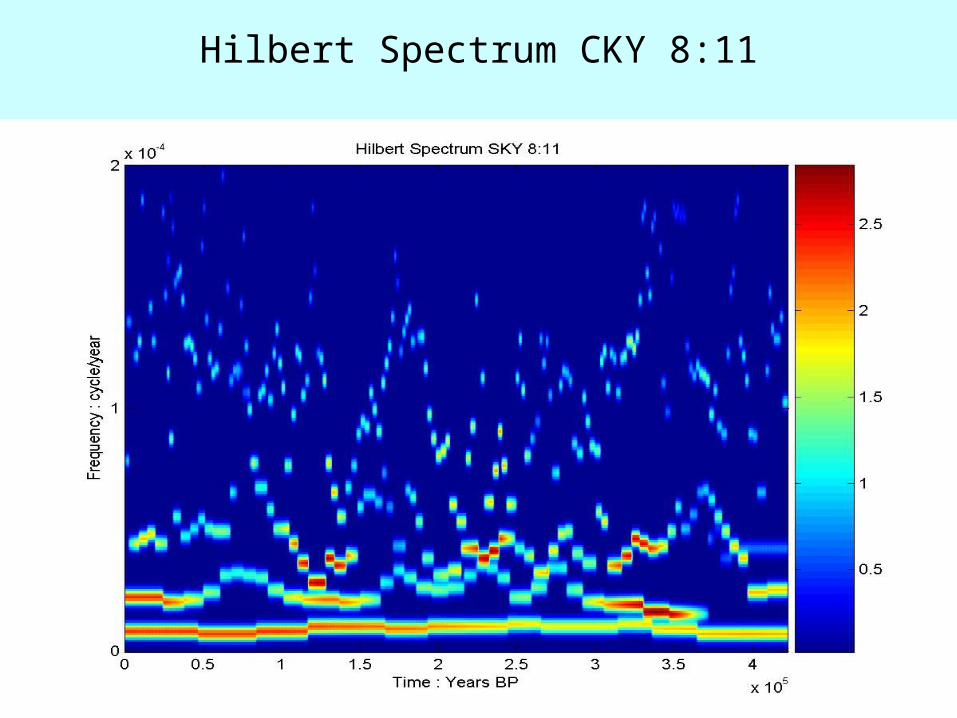
Hilbert Spectrum CKY 8:11

Marginal Hilbert Spectrum CKY 8:11