a pms for facility services supply chain - a … · a pms for facility services supply chain: ......
TRANSCRIPT
1
Abstract number: 011-0392
A PMS for facility services supply chain: A case in the healthcare sector
Alberto Felice De Toni, University of Udine, via delle Scienze 208 – 33100 Udine,
[email protected], +39 0432 558330
Mattia Montagner, University of Udine, via delle Scienze 208 – 33100 Udine,
[email protected], +39 0432 558043
POMS 20th Annual Conference
Orlando, Florida U.S.A.
May 1 to May 4, 2009
Abstract: Supply chain (SC) performance measurement is attracting the attention of practitioners
and academic researchers. Many studies report the importance of measuring and managing SC
performances to improve the understanding and cooperation among partners, to raise SC integration
and finally to pursuit SC excellence. But, whereas literature about SC performance measurement is
rich in theoretical approaches, empirical researches are still poor.
The work aims to increase fieldworks on this topic. This paper results from a three-years case study
within a SC of facility services in the healthcare sector. The proposed performance measurement
system adopts a balanced approach for performance evaluation and uses different levels of
measurement and accountability: strategic, tactical and operational. The model shares measures and
results among customer, prime contractor and subcontracting companies of the considered SC,
supporting partners in highlighting opportunities for services improvement, getting better
collaboration and coordination along SC and defining Service Level Agreements.
Keywords: Performance Measurement System; Supply Chain; Facility Management; Healthcare;
Case Study.
2
1. INTRODUCTION
Business performance measurement is a topic of concern for both researchers and professionals for
three decades at least (Neely et al., 2000). The discipline has evolved and extended throughout this
period, driven by continuous academic research and industrial initiatives. This interest has given
body to a great amount of scientific papers and books, conferences, commercial software, etc.
However, since new emerging business models such as supply chain, extended enterprise and
virtual enterprise are challenging managers and scholars, novel issues must be addressed by
performance measurement researchers (Busi and Bititci, 2006). In a previous work, Neely (2005)
analyses performance measurement literature in the last decade and briefly outlines a research
agenda for the next. He states that, among the developments required by the theory on performance
measurement, it should be investigated “how to measure performance across supply chains and
networks rather than within organisations” (2005: 1273). On the same line, Busi and Bititci (2006)
claim that today’s industrial dynamics require a new perspective on performance measurement, that
is to abandon the idea of narrowly looking at single enterprise performance in favour of a wider
view at many enterprises performance, working collaboratively to satisfy the final consumer.
Looking at literature concerning supply chain management, we come to the same conclusion.
Actually, although there are many contributions to supply chain performance measurement
(Beamon, 1999; Brewer and Speh, 2000; Bullinger et al., 2002; Chan and Qi, 2003a; Gunasekaran
et al., 2004), the topic has not received adequate attention by researchers yet (Cuthberson and
Piotrowicz, 2008). Demands for improving knowledge on this subject are various, but what seems
to be common among authors is the call for measurement systems that assess supply chains as one
whole entity, rather than single-companies performance (Handfield and Nichols, 1999; Holmberg,
2000; Gunasekaran et al., 2001; Chan and Qi, 2003b). These authors stress the importance of an
holistic view of the supply chain and demand for shared models, metrics and measurement methods
among chain members (Holmberg, 2000; Cuthberson and Piotrowicz, 2008). Brewer and Speh
(2001) claim that in supply chain management the emphasis is on how well a group of companies –
3
not only one enterprise – performs in terms of value creation for the final consumer; thus also the
measurement system should adopt an holistic perspective, considering supply chain as a whole. In
other words, Gunasekaran and colleagues (2004) make clear that “efforts are needed to design new
measures and new programs for assessing the performance of the supply chain as a whole entity as
well as the performance of each organization that is a part of the supply chain” (2004: 346).
The purpose of this paper is hence to enrich knowledge about measurement systems for evaluating
the overall performance of supply chains. We argue that sharing the measurement tool among chain
members is a main principle for working cooperatively in the supply chain and, consequently, for
improving the overall performance. Nevertheless, we do not pretend to offer a comprehensive
pattern for exceeding the myopia on single enterprise performance, that is becoming very restrictive
in supply chain context. On the opposite, we believe that generalizations concerning supply chain
overall performance assessment could be hazardous till a wider knowledge on this subject is
developed. Consistently, we prefer to focus the attention of this study on a specific context only, i.e.
facility services supply chains, an emerging area of research where we have noticed the opportunity
for sharing the measurement tool (De Toni, 2007).
The remainder of the paper is organized as follows. The next section deals with the academic
literature on performance measurement. The state of the art of performance measurement in supply
chain management and facility management is proposed. The third section describes the shared
measurement system we have designed for facility services supply chain. Next the tool is
implemented in a case study in the healthcare sector. Thus, section four reports the implementation
process, the performance measures and the critical factors for tool implementation in the considered
case. The paper ends with implications for practice and research. Further studies are also proposed.
2. LITERATURE REVIEW: PERFORMANCE MEASUREMENT SYSTEMS (PMSs)
The subject of performance measurement for business management is very discussed both in
academy and practice since the ‘80s (Neely, 1999). The interest in measurement systems has shown
4
in a good deal of publications, new associations and conferences on performance measurement,
nevertheless the term Performance Measurement System (PMS) is rarely defined (Neely et al.,
1995). Neely (1998) says that a PMS is a tool that allows managers having informed decisions, as it
quantifies the efficiency and effectiveness of past actions through acquisition, collation, sorting,
analysis, interpretation and dissemination of appropriate data. PMS offers to business managers
useful news about company’s competitive position, business unit’s performance progress,
employees motivation and customer needs. A comprehensive picture of the functions of
performance measurement is offered by Schmitz and Platts (2004). In their review, the authors point
out that PMS serves for various purposes: strategy formulation and clarification, management
information, vertical and horizontal communication, decision making and prioritising, co-ordination
and alignment, motivation, and learning.
Three primary elements must be defined in order to build a quality measurement system:
1. a set of performance measures that quantifies the efficiency and effectiveness of actions;
2. a reference framework combining the measures;
3. an infrastructure supporting acquisition, collation, sorting, analysis, interpretation and
dissemination of data.
PMS makes use of a set of performance measures that supports business managers to recognize
where improvements are required. Many authors emphasize that the group of measures should not
be mono-dimensional, different types of measure should be considered instead: financial and non-
financial measures (Kaplan and Norton, 1992), internal and external measures (Keegan et al., 1989),
global measures for senior managers and local measures for low-level managers (Flapper et al.,
1996), lag measures to quantify past actions (“feedback” performance control) and lead measures to
forecast future performance (“feedforward” performance control) (Kaplan and Norton, 1992).
Performance measures shouldn’t form a confused and random group, however. The PMS needs a
reference framework that defines the criteria for selecting and combining the measures. To this
purpose, many frameworks have been proposed and applied; some of these have large application,

5
while others are context specific. Among the most recognized frameworks, we report the
Performance Measurement Matrix (Keegan et al., 1989), the Performance Pyramid (Lynch and
Cross, 1991), the Results and Determinants (Fitzgerald et al., 1991), the EFQM Business
Excellence Model introduced at the beginning of 1992 by the European Foundation for Quality
Management, the Balanced Scorecard (BSC) (Kaplan and Norton, 1992), the Macro Process Model
(Brown, 1996), and recently the Performance Prism (Neely et al., 2002). More specific description
and a review about the measurement frameworks can be found in Neely and colleagues (2000).
Finally, the measurement system is completed by an infrastructure for simplifying and mechanizing
the process of measuring and evaluating the business performance. The infrastructure is composed
by checklists, guidelines and standards for performance measurement, criteria for performance
assessment, etc. Usually, information technologies and software solutions accomplish to these
functions so that a great deal of software vendors have recognized the opportunity to develop novel
products for performance measurement or to integrate the existing ERP applications with business
performance assessments. If anyone would major insight on this matter, she/he might refer to the
software report by Marr and Neely (2003).
The rest of this section deals with investigations in PMS literature. Next we briefly describe the
BSC model, that is the most famous framework in practice and research. The rationale behind the
description of this model is that it will be used as the theoretical basis in our study. Then, we
illustrate the state of the art on performance measurement in both supply chain management and
facility management literatures. We collect knowledge in both in order to design a quality PMS for
facility services supply chains. We analyze next only what concerns performance measures and
frameworks for supply chains and facility services, while we do not care about infrastructures for
performance measurement and evaluation.
2.1. The balanced scorecard
It is beyond doubt that the Balanced Scorecard (BSC) – by Kaplan and Norton (1992) – is very

6
renowned among researchers and professionals of every sector. Since its conception, the BSC
model has aroused so lively interest that many times it has been applied in practice (Kaplan, 2005):
for example, Apple (Kaplan and Norton, 1993), Pepsi (Jensen and Gerr, 1994), Metro Bank (Kaplan
and Norton, 1996), the Swedish Law Enforcement (Carmona and Gronlund, 2003), Nike (Lohman
et al., 2004), the U.S. Army and Chrysler (Kaplan and Norton, 2005). Neely (2005) confirms that
academic researchers show great attention in this model as well. He notices that Kaplan and
Norton’s seminal work on BSC has been the most cited article by authors in performance
measurement between 1998 and 2005.
The BSC starts with the definition of the corporate strategy and its communication to all levels of
the organization. By then performance measurement scholars agree that outlining strategy is an
issue of primary importance for business performance management, but it is also a major point to
connect corporate strategy to the tasks of managers and workers, specifying how the work of single
employees can contribute to the achievement of the company’s strategic objectives (Kaplan and
Norton, 2004). The process of cascading down strategy across the organization is supported by what
authors call “linking measurements to strategy”, that is translating company’s strategy into a
coherent set of performance measures for everyone.
But the originality of the BSC consists in balancing purely financial issues with those elements
needed for the value creation, as the traditional financial performance measures have become
lacking in today’s competitive environment. Thus, the authors prompt that managers should use
different perspectives to assess business performance, answering to the following questions: how do
we look to shareholders (financial perspective)? how do customers see us (customer perspective)?
what must we excel at (internal business perspective)? can we continue to improve and create value
(innovation and learning perspective)? The financial perspective is insufficient to describe business
performance results, however it remains indispensable for the shareholders. Indeed they evaluate
business through financial measures as ROI, turnover, net margin, etc. to verify gains and losses.
The customer perspective analyses the value proposition to customers and consists of measures for
7
market penetration by goods/services, relations with customers, company brand, etc. The internal
business perspective identifies where to excel in order to rise competitiveness and profits;
effectiveness and efficiency of internal processes and tasks are measured here. Finally the
innovation and learning perspective considers those issues that qualify the firm to realize good
results in the other perspectives: employees competences and skills, technologies, corporate culture,
etc. (Kaplan and Norton, 2000).
As we will look next, BSC applications may be discovered in supply chain management literature
and in facility management one. The original framework and its modified versions have been used
by various authors to assess the performance of supply chains and facility services, so that Kaplan
and Norton’s model results a bridge between the two literatures. For this reason, the BSC model
appears to be a clear starting point to design a measurement system for facility services supply
chains.
2.2. PMS for supply chain management
Supply chain (SC) performance measurement is attracting the attention of practitioners and
academic researchers. Various authors report the importance of measuring and managing SC
performance to improve the understanding and cooperation among partners (Brewer and Speh,
2001; Chan et al., 2003), to raise SC coordination (Romano and Danese, 2006) and finally to
pursuit SC excellence (Brewer and Speh, 2000; Chan and Qi, 2003a).
Among the earliest authors in SC performance measurement, Beamon (1998) points out the
opportunity to classify measures in qualitative and quantitative. Typical measures concerning the
first one are customer satisfaction, flexibility, information and material flow integration, effective
risk management and supplier performance; while distinctive indicators for the second are costs and
customer responsiveness. In a subsequent work, the same author (Beamon, 1999) proposes also to
distinguish measures in three dimensions: resource (distribution costs, inventory, ROI, etc.) that
analyses efficiency levels, output (sales, on-time deliveries, customer complaints, etc.) that
8
measures business results and finally flexibility (reductions in the number of lost sales, increased
customer satisfaction, etc.) which evaluates SC readiness to the dynamism of the environment.
Besides, Shepherd and Gunter (2006) and Cuthberson and Piotrowicz (2008) offer interesting
reviews of performance metrics in SCM literature. They produce taxonomies to categorize and
organize the measures.
In addition to these studies on measures classification, literature includes also measurement models
to evaluate SC performance. Some authors (Handfield and Nichols, 1999; Hines et al., 2000)
suggest the BSC model, however Schmitz and Platts (2004) claim that “they deal with this issue in
a rather cursory way without much consideration about possibly necessary changes to the BSC
framework that have to be considered due to the differences between the intra-organisational
management of companies as compared to the management of an inter-firm supply chain” (2004:
235). Also Brewer and Speh (2000, 2001) draw on the BSC model and distribute performance
measures in the well-known perspectives: financial, customer, internal business and innovation and
growth. But, they do not translate the corporate objectives and measures into targets and measures
on lower levels, failing the full adoption of the BSC (Schmitz and Platts, 2004). Bullinger and
colleagues (2002) adopt an hybrid BSC, instead. Their model considers different perspectives for
the value creation process as well as three different levels of supply chain management: functional
level for operating units as purchasing, manufacturing or logistics; process level for cross-functional
processes as consumer product distribution; and supply chain level for inter-enterprise processes
across SC. As a consequence, they propose to assign the responsibility for results to different levels
of the firm.
Also Gunasekaran and colleagues (2001, 2004) recognize that diverse levels of the organization
could contribute to performance objectives through different tasks. These authors propose a
measurement model founded on three levels, on the basis of the ability of people to affect the
results. The levels are hierarchical in nature: strategic for top management, tactical for mid-level
management and operational for low level management and workers. Contrary to Bullinger and
9
colleagues, they give up the idea of balancing measures through perspectives, whereas they prefer
to analyse the macro-processes of the firm: plan, source, make/assemble and deliver/customer.
The Supply Chain Operations Reference (SCOR) model (Supply-Chain Council, 2006)
distinguishes three measurement levels as well. Top Level (level one) considers the macro-
processes, divided in plan, source, make, deliver, and return or customer satisfaction. On the second
level, Configuration Level, macro-processes are dismantled in processes and process-measures are
defined. Finally on the Process Level (level three) activities become the focus. The SCOR seems
very similar to the model by Gunasekaran and colleagues. But, in addition the SCOR model
discriminates measures in five dimensions: reliability, responsiveness, flexibility, costs and assets
management.
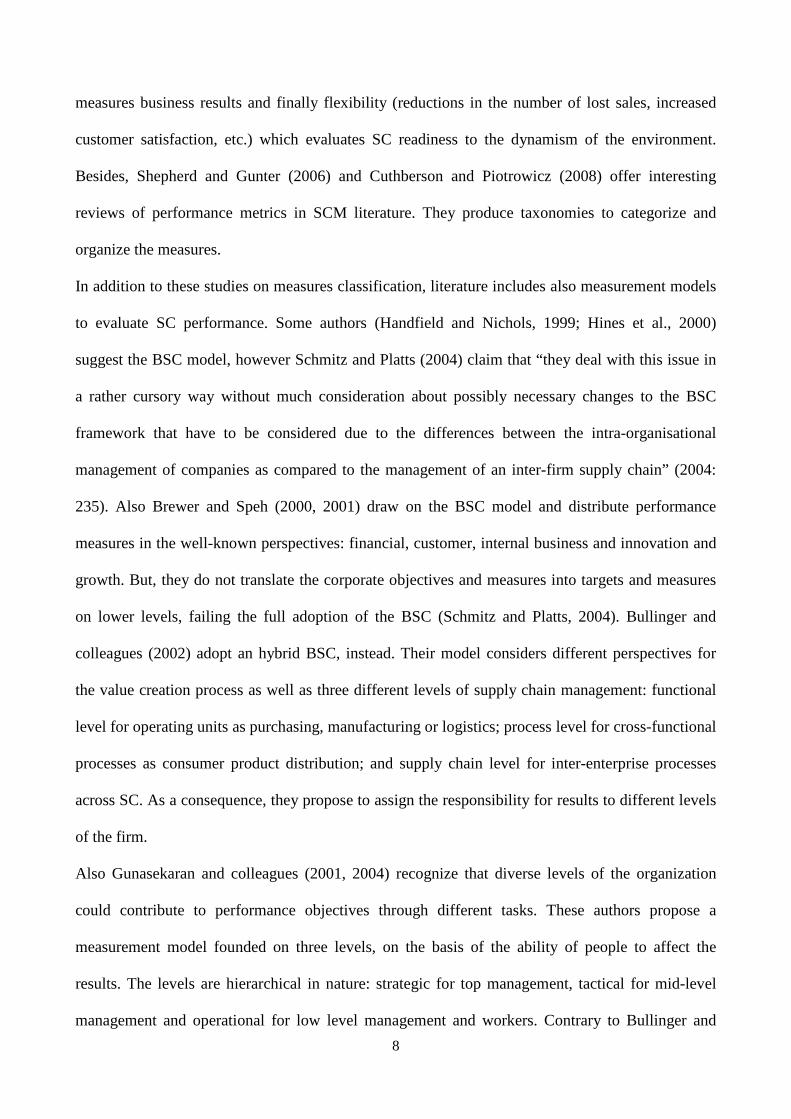
It is manifest that the above mentioned models can be categorized by different architectonic
connotations. De Toni and Tonchia (2001) tell us that three types of architectures characterize
PMSs: vertical architecture, hierarchical models characterized by performances on different levels
of aggregation; horizontal architecture, models which are related to the value chain; balanced
architecture, models considering performance from diverse perspectives. In Table 1 we report the
classification by architecture of measurement models for SCM.
Table 1 – Classification by architecture of measurement models for SCM
MEASUREMENT MODEL FOR SCM
PMS ARCHITECTURE
VERTICALARCHITECTURE
HORIZONTAL ARCHITECTURE
BALANCED ARCHITECTURE
TRADITIONAL BSC(Brewer and Speh, 2000, 2001) ����
HYBRID BSC(Bullinger et al., 2002) ���� ����
LEVELS vs. PROCESSES(Gunasekaran et al., 2001, 2004) ���� ����
SCOR MODEL(Supply-Chain Council, 2006) ���� ����
Despite the just reported studies offer various cues on the subject of SC performance measurement,

10
many authors recognize that further research is needed. Papers on this topic are still poor (Beamon,
1999; Holmberg, 2000; Gunasekaran et al., 2001; Chan et al., 2003; Schmitz and Platts, 2004;
Theeranuphattana and Tang, 2008). Studies are especially conceptual, while there is a need for
empirical researches and case studies supporting the proposed concepts, techniques and models
(Gunasekaran et al., 2004; Schmitz and Platts, 2004; Cuthberson and Piotrowicz, 2008). Other
authors (Beamon, 1999; Chan and Qi, 2003b; Schmitz and Platts, 2004) suggest that PMS design
and measures selection for SCM must also be addressed. Furthermore, we highlight the shortage of
studies on models or measures for SC in service contexts. The majority of papers concerns the
measurement of manufacturing supply chains and the applied measures are unlikely to be used in
services.
Probably, what seems the most fascinating issue for further research is to adopt an holistic approach
to SC performance measurement. Many authors report that supply chain should be viewed as one
whole entity, thus also the PMS should consider the entire SC (Handfield and Nichols, 1999;
Holmberg, 2000; Gunasekaran et al., 2001; Chan and Qi, 2003b). Others add that there is a need for
shared models, metrics and measurement methods across the SC (Holmberg, 2000; Kleijnen and
Smits, 2003; Cuthberson and Piotrowicz, 2008). For example, Hewlett-Packard introduced a new
set of performance measures shared downstream with its reseller in order to establish an effective
collaboration (Callioni and Billington, 2001). Thus, SC firms should have a common PMS; but this
doesn’t mean that the major company dictates the measures along the SC, rather that all participants
should have a role in the development of the measurement system (Gunasekaran et al., 2004). The
needs of every firm must be considered so that everyone takes advantage (Angerhofer and
Angelides, 2006). To this purpose, it might be fair to form a mixed team with members from
different companies for designing the measurement system (Chan and Qi, 2003a). Obviously
sharing objectives is not sufficient, but also responsibility for results have to be shared across the
SC. Performance measures should be assigned to all actors so that everybody knows where to excel
and who must improve performance to reach the SC objectives and overall excellence. This
11
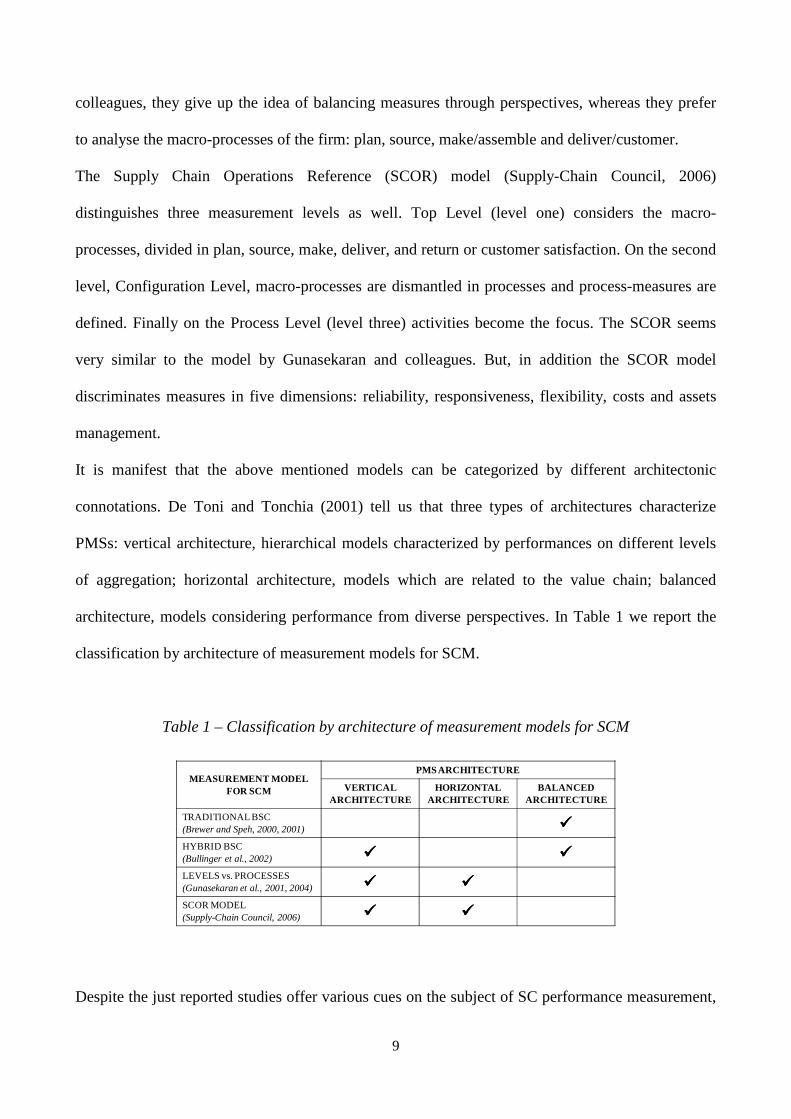
approach is pivotal to stimulate inter-company collaboration and to assess the impact of single
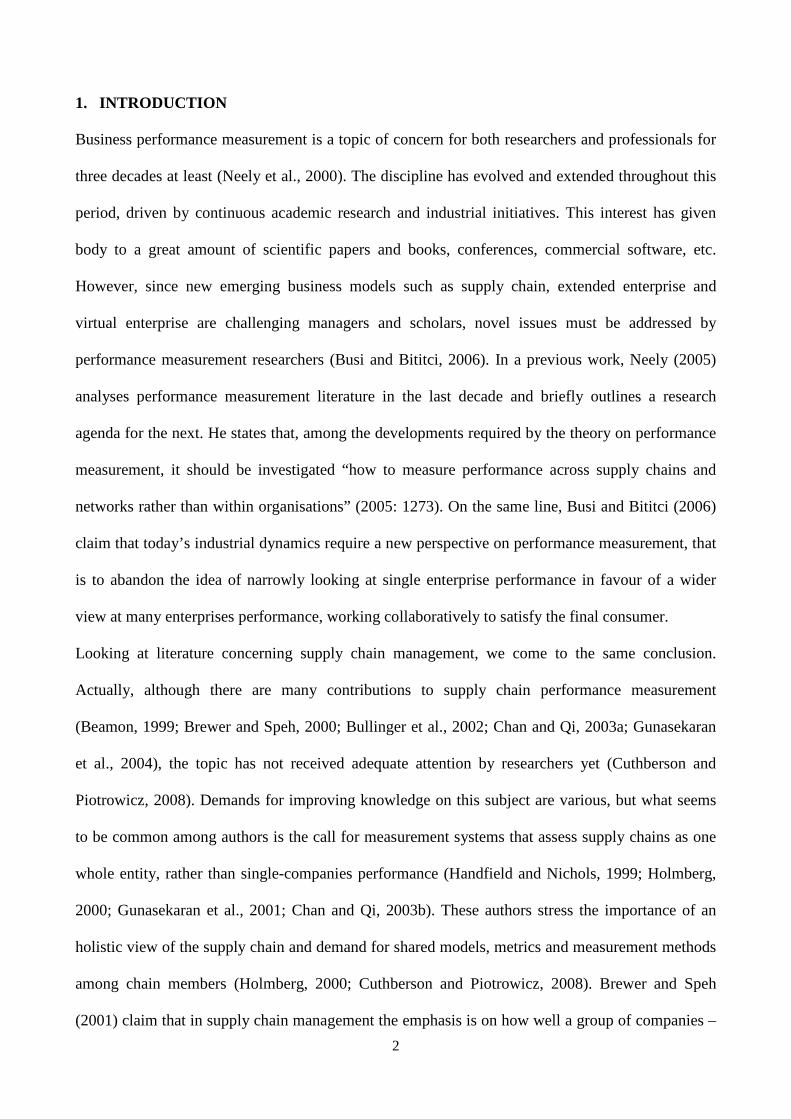
actors on the whole SC performance. Thus, a new way of looking at supply chain performance
measurement is requested. There is an opportunity to design and develop a shared PMS among the
actors of supply chains (Figure 1).
PERFORMANCE MEASUREMENT SYSTEM
SUPPLY CHAIN
FIRM A FIRM B FIRM C
Figure 1 – Sharing PMS across the SC (Holmbert, 2000)
2.3. PMS for facility management
Performance measurement is a major topic in the literature on Facility Management (FM), referring
as the profession that encompasses multiple disciplines to ensure functionality of the built
environment by integrating people, place, process and technology (IFMA, 2008). A lot of studies
regards the measurement of FM performance. The subject is actually the third most cited issue by
FM scientific articles, following FM general and workplace management (Ventovuori et al., 2007).
The rationale for its importance is that “performance measurement is really at the heart of good FM
practice” (Amaratunga et al., 2000: 68). Performance measurement offers great opportunities, since
it allows facility managers to control the service processes, to benchmark performance inside and
outside, to identify the need for change and finally to make informed decisions (Kincaid, 1994).
Other authors give a further explanation of the importance of measuring performance for FM. That
is, facility managers face the challenge to prove to general management that FM contributes to the
business results of firm, rather than FM is only a cost to minimize (Amaratunga and Baldry, 2003).
As regards performance measurement in FM, various authors (Tranfield and Akhlaghi, 1995;
12
Amaratunga et al., 2000; Brackertz and Kanley, 2002; Shaw and Haynes, 2004) agree on the
myopia of traditional evaluations. They claim that facility managers often focused their attention to
financial-only measures in the past. Typical examples of those measures are €/m2 unit costs of
maintenance or cleaning, occupancy cost to m2, total revenue, total expenditure, etc. Those
assessments are very restrictive because they give purely economical insights about FM
performance, whereas they don’t tell us anything about the value of FM for the core business or for
the customer. Thus, FM researchers have begun to propose original measurement approaches in
order to overcome this limit. Some authors (Brackertz and Kenley, 2002) suggest that facility
managers should connect FM performance measures very closely with those indicators that top
management uses to evaluate business results. Another group of researchers (Amaratunga et al.,
2000; Loosemore and Hsin, 2001; Shaw and Haynes, 2004) proposes to adopt holistic approaches
in which many measurement dimensions or perspectives are considered.
These demands for multi-dimensional measures have originated a new stream of publications
concerning performance measurement models for FM. In this literature, the BSC has won great
popularity (De Toni et al., 2007); it has been proposed as a solution to overcome financial-only
measurements through diverse balancing perspectives. For example, the BSC model was applied in
higher education (Coronel and Evans, 1999; Amaratunga and Baldry, 2000) and in the National
Health Service (Amaratunga et al., 2002) to evaluate FM performance. Unfortunately, although
BSC is mentioned in FM several times, we notice that applications of this model are still scarce.
Brackertz and Kenley (2002) propose a modified version of the BSC, the Service Balanced
Scorecard (SBS), that they apply in a local government authority. Compared with the original BSC,
the SBS has two news. The first one regards the balancing perspectives. The authors distinguish
performance measures in: financial perspective, community/customer perspective, services
perspective and building perspective. The financial perspective uses measures of costs and profits of
business. The community/customer perspective comprises metrics of community access to services
and level of community involvement in terms of volunteer contribution. The services perspective

13
measures both the quality of services provided and how services are in line with the customer’s
requirements. Finally, buildings’ physical condition and their utilisation rate are the focus of the
building perspective. But the major novelty introduced by the SBS concerns the stakeholder
approach to PMS design. Indeed, the authors get the measures from the business strategy, but they
also consider the needs and requirements of all stakeholders as:
• the customer management, who makes decisions about facilities and services and who is
accountable to the community;
• the facilities manager, who is concerned with the coordination of services and who is
accountable for the physical and financial condition of facilities;
• the service providers that manage and provide services;
• the community, the end user of the facility.
The involvement of many stakeholders in PMS design allows to have a wider look at FM objectives
and to recognize diverging interests and knowledge as to what constitutes performance in FM
(Brackertz and Kenley, 2002). There is a need for overcoming PMS tailored by single firms, e.g. by
the service provider to measure the efficiency of its processes, by the customer to monitor the
vendors and the service levels received. On the contrary, it is acknowledged that the measurement
tools might offer many opportunities if they are shared among numerous stakeholders. This
approach could stimulate stakeholders towards a fruitful collaboration and the attainment of
mutually advantageous results. So it seems to be a fascinating issue to balance different views and
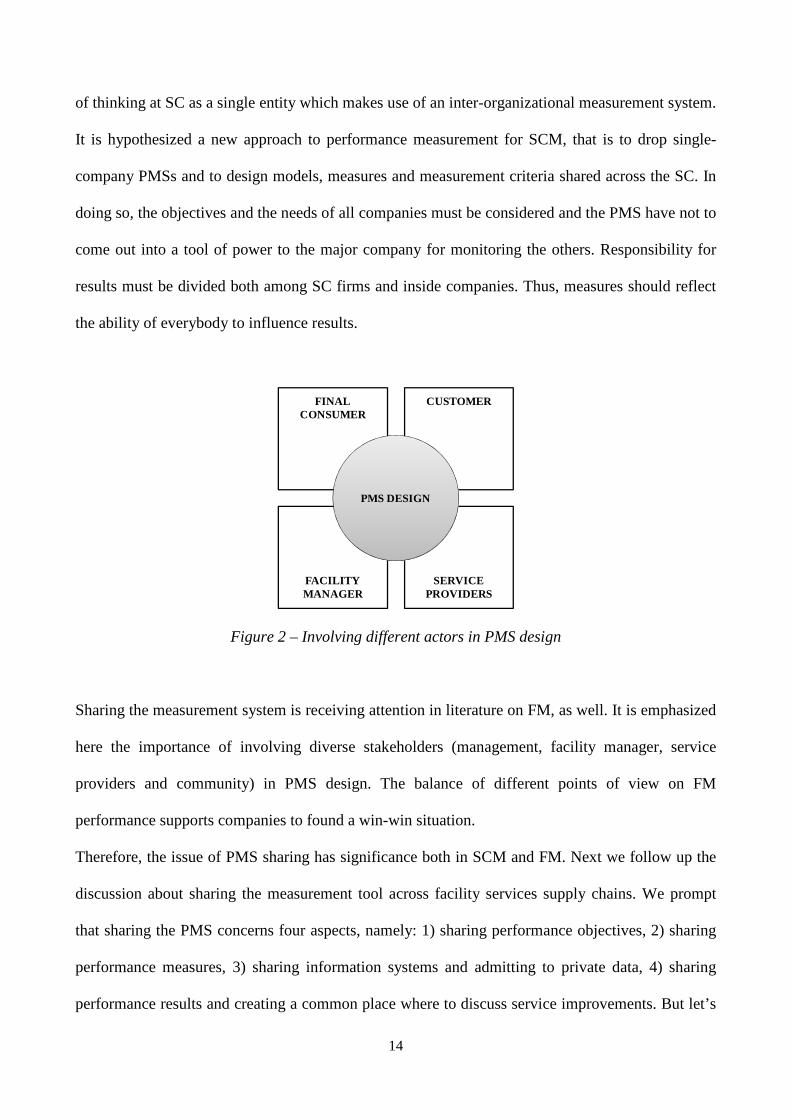
involve many stakeholders to design PMS for FM (Figure 2).
3. A PMS FOR FACILITY SERVICES SUPPLY CHAIN
In order to develop a quality PMS for facility services supply chain, we believe it is be useful to
collect insights into both SCM and FM perspectives of looking at performance measurement. The
study of the two has pointed out some common features. We notice that in both FM and SCM
literatures there is a call for a wider share of PMSs. In SCM, some authors highlight the importance
14
of thinking at SC as a single entity which makes use of an inter-organizational measurement system.
It is hypothesized a new approach to performance measurement for SCM, that is to drop single-
company PMSs and to design models, measures and measurement criteria shared across the SC. In
doing so, the objectives and the needs of all companies must be considered and the PMS have not to
come out into a tool of power to the major company for monitoring the others. Responsibility for
results must be divided both among SC firms and inside companies. Thus, measures should reflect
the ability of everybody to influence results.
FINALCONSUMER
CUSTOMER
SERVICEPROVIDERS
FACILITYMANAGER
PMS DESIGN
Figure 2 – Involving different actors in PMS design
Sharing the measurement system is receiving attention in literature on FM, as well. It is emphasized
here the importance of involving diverse stakeholders (management, facility manager, service
providers and community) in PMS design. The balance of different points of view on FM
performance supports companies to found a win-win situation.
Therefore, the issue of PMS sharing has significance both in SCM and FM. Next we follow up the
discussion about sharing the measurement tool across facility services supply chains. We prompt
that sharing the PMS concerns four aspects, namely: 1) sharing performance objectives, 2) sharing
performance measures, 3) sharing information systems and admitting to private data, 4) sharing
performance results and creating a common place where to discuss service improvements. But let’s

15
describe the framework supporting the shared PMS first. Here also we have recognized a common
point between the two literatures, i.e. the BSC model.
3.1. The framework
The proposed framework for facility services supply chain founds itself on two architectures, the
balanced and the vertical. Indeed, we agree with authors in FM (Amaratunga et al., 2000;
Loosemore and Hsin, 2001; Shaw and Haynes, 2004) that financial-only measures offer a modest
evaluation, whilst it would be more appropriate to adopt a multi-dimensional approach. In this
regard, models with a balanced architecture are the best solution and the BSC is the reference model
certainly. In confirmation of this, we quote the large diffusion of BSC both in practice and research
and the interest it has received in SCM and FM contexts.
But we deem it is also indispensable to turn the whole SC towards the same direction in order to
pursuit excellence. We consider essential to cascade down measures from strategy to different
levels of SC management. Here, we agree with those authors in SCM (Gunasekaran et al., 2001;
Bullinger et al., 2002; Supply-Chain Council, 2006) that distinguish the performance measures in
diverse levels. Thus, models with a vertical or hierarchical architecture have also to be considered.
On the contrary, we renounce the horizontal architecture. The distinction by plan, source, make,
deliver, and return/customer satisfaction processes seems very difficult. The heterogeneity of FM
services (cleaning, maintenance, reception, catering, etc.) causes processes diverse by structure, as a
consequence the established activities might be much different amongst services. Then, it might be
hazardous to develop a common PMS if service processes are not homogeneous. Large criticalities
could arise with this approach as we run the risk to separate processes depending on service
distinction, thus coming to a differentiation of measures by companies and declining the idea of
sharing the PMS.
Then, the proposed framework draws on the BSC model and uses different levels of measurement
and responsibility. In a previous work (De Toni et al., 2007) we have developed a BSC for FM that
16
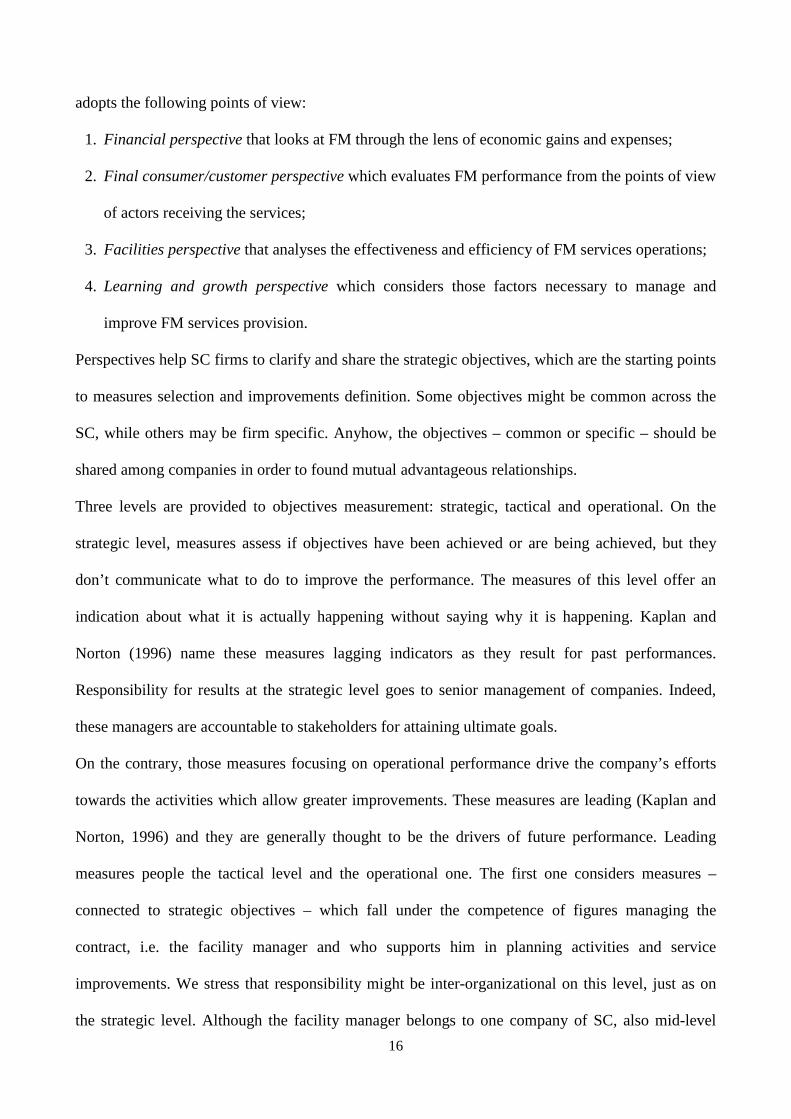
adopts the following points of view:
1. Financial perspective that looks at FM through the lens of economic gains and expenses;
2. Final consumer/customer perspective which evaluates FM performance from the points of view
of actors receiving the services;
3. Facilities perspective that analyses the effectiveness and efficiency of FM services operations;
4. Learning and growth perspective which considers those factors necessary to manage and
improve FM services provision.
Perspectives help SC firms to clarify and share the strategic objectives, which are the starting points
to measures selection and improvements definition. Some objectives might be common across the
SC, while others may be firm specific. Anyhow, the objectives – common or specific – should be
shared among companies in order to found mutual advantageous relationships.
Three levels are provided to objectives measurement: strategic, tactical and operational. On the
strategic level, measures assess if objectives have been achieved or are being achieved, but they
don’t communicate what to do to improve the performance. The measures of this level offer an
indication about what it is actually happening without saying why it is happening. Kaplan and
Norton (1996) name these measures lagging indicators as they result for past performances.
Responsibility for results at the strategic level goes to senior management of companies. Indeed,
these managers are accountable to stakeholders for attaining ultimate goals.
On the contrary, those measures focusing on operational performance drive the company’s efforts
towards the activities which allow greater improvements. These measures are leading (Kaplan and
Norton, 1996) and they are generally thought to be the drivers of future performance. Leading
measures people the tactical level and the operational one. The first one considers measures –
connected to strategic objectives – which fall under the competence of figures managing the
contract, i.e. the facility manager and who supports him in planning activities and service
improvements. We stress that responsibility might be inter-organizational on this level, just as on
the strategic level. Although the facility manager belongs to one company of SC, also mid-level
17
managers of other companies might have the task of planning service provision. These managers
must collaborate each other in order to achieve the objectives, then they share the responsibility for
performance results on this level.
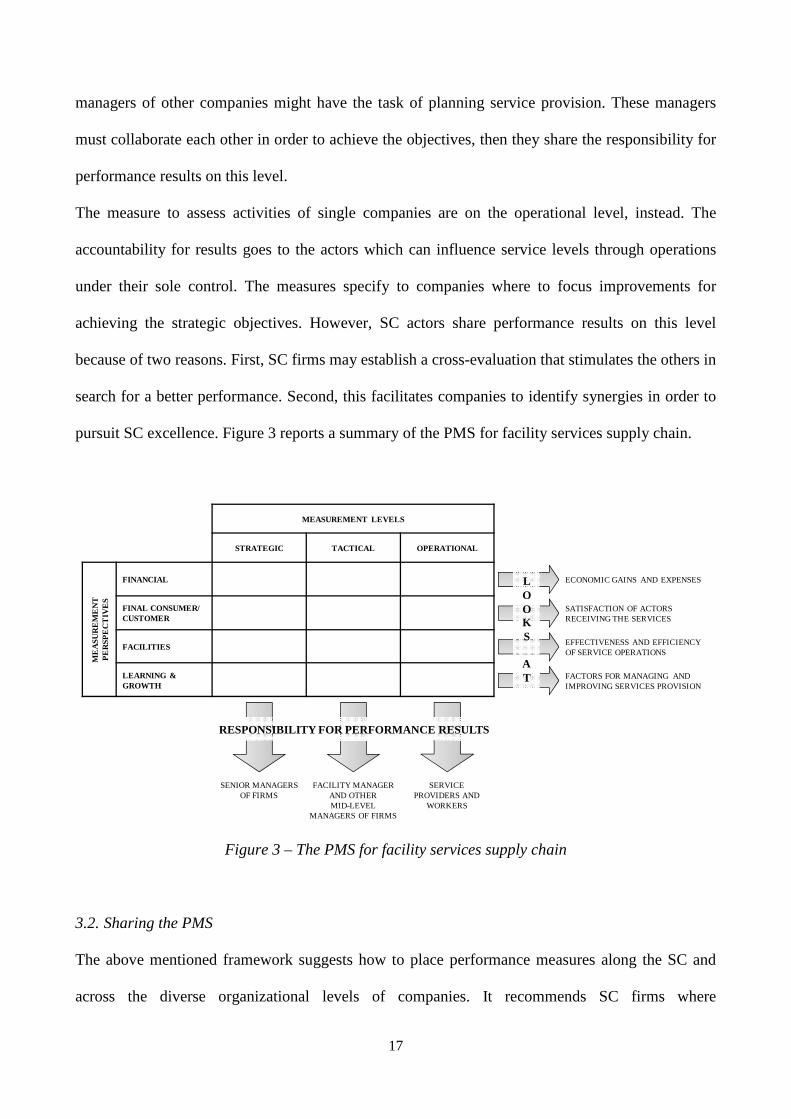
The measure to assess activities of single companies are on the operational level, instead. The
accountability for results goes to the actors which can influence service levels through operations
under their sole control. The measures specify to companies where to focus improvements for
achieving the strategic objectives. However, SC actors share performance results on this level
because of two reasons. First, SC firms may establish a cross-evaluation that stimulates the others in
search for a better performance. Second, this facilitates companies to identify synergies in order to
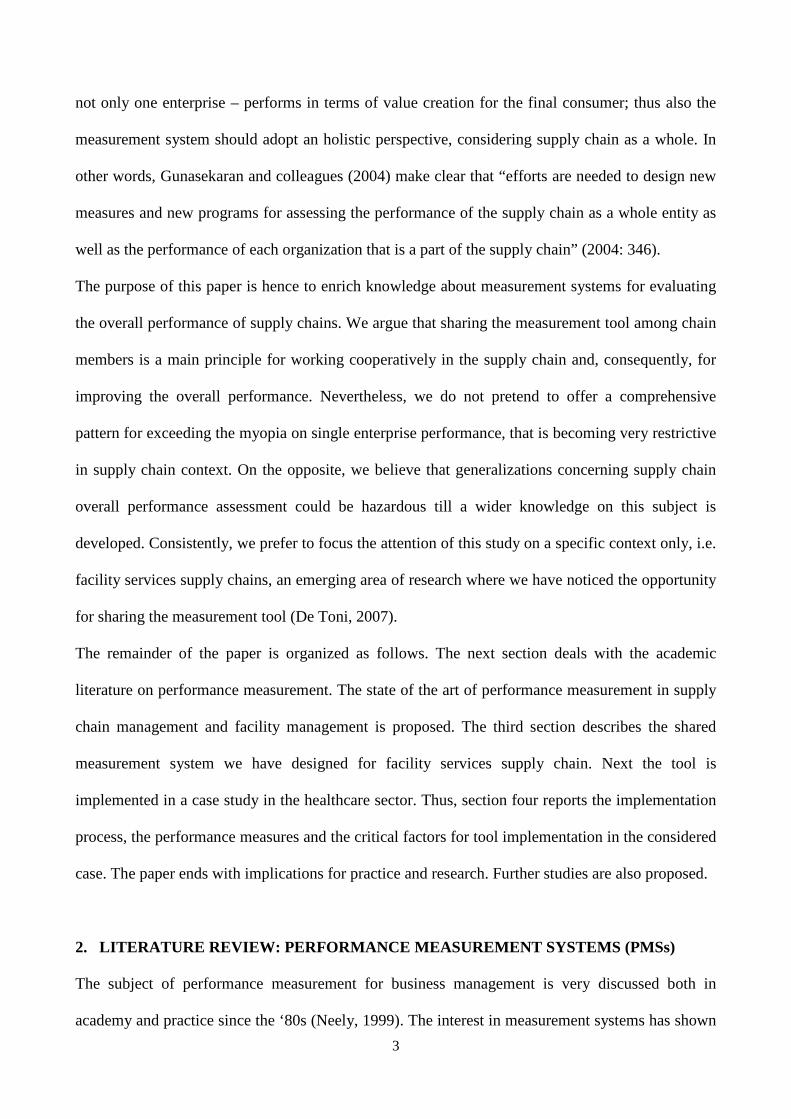
pursuit SC excellence. Figure 3 reports a summary of the PMS for facility services supply chain.
MEASUREMENT LEVELS
STRATEGIC TACTICAL OPERATIONAL
FINANCIAL
FINAL CONSUMER/ CUSTOMER
FACILITIES
LEARNING & GROWTH
ME
ASU
RE
ME
NT
PE
RSP
EC
TIV
ES
SENIOR MANAGERS OF FIRMS
FACILITY MANAGERAND OTHERMID-LEVEL
MANAGERS OF FIRMS
SERVICE PROVIDERS AND
WORKERS
RESPONSIBILITY FOR PERFORMANCE RESULTS
ECONOMIC GAINS AND EXPENSES
EFFECTIVENESS AND EFFICIENCY OF SERVICE OPERATIONS
FACTORS FOR MANAGING AND IMPROVING SERVICES PROVISION
SATISFACTION OF ACTORS RECEIVING THE SERVICES
LOOKS
AT
Figure 3 – The PMS for facility services supply chain
3.2. Sharing the PMS
The above mentioned framework suggests how to place performance measures along the SC and
across the diverse organizational levels of companies. It recommends SC firms where
18
(measurement perspective) and on which level (measurement level) to intervene with improvements
for attaining the ultimate goals. The framework is the basis of the shared PMS, but we stress that the
pure tool sharing emerges during its implementation and utilization. In fact, the PMS sharing
doesn’t stop with the framework adoption, rather we believe that SC companies should also comply
with the following requirements: 1) sharing performance objectives, 2) sharing performance
measures, 3) sharing information systems and admitting to private data, 4) sharing performance
results and creating a common place where to discuss service improvements. The reason behind
these “sharing” stands in the pursuit of overall SC excellence. Reporting the words of Busi and
Bititci (2006), “by sharing performance data with partners, firms can identify bottlenecks and weak
links in the network, and act in accordance to improve the overall performance” (2004: 15).
Sharing performance objectives is a main point. This does not imply only that companies have to
identify common purposes – faster service provision, lower service costs, etc. – but also that every
single firm submits its goals to the counterpart. On the one hand, it is prompted that partners define
and manage common goals and objectives in order to start a fruitful collaboration (Busi and Bititci,
2006). But, on the other, SC partners must also explain their objectives among themselves and
realize how much these are converging and diverging (Brewer and Speh, 2001). For example, in a
dyadic relation the customer may look for a reduction in unit costs while at the same time the
provider may pursuit higher turnover. These two objectives seem to be conflicting, but they both
could be attained if contractors realize economies of scale or scope. Objectives sharing allows SC
companies to start a mutual balancing of advantages and disadvantages and then to make
compromises to create win-win situations (Kleijnen and Smits, 2003).
The involvement of diverse actors in measures selection is also very important to build a shared
PMS. Since SC companies will have to share the measures, it would be right that firms agree upon
them. So, it is better to avoid measures being chosen by one participant unilaterally, whereas SC
companies should get the consensus.
The third requirement for PMS sharing relates to data feeding indicators. SC companies should
19
open their archives to the others and provide information needed to performance evaluation (Busi
and Bititci, 2006). This does not mean admitting the access to all their own data, but favouring the
collection of required information. Sharing data sets some problems, however. How do SC
companies ensure completeness and integrity of data coming from different sources? Who is in
charge of acquiring, selecting and processing data and spreading results? Who assumes the costs of
measurement? Or how do SC firms divide costs? To overcome these problems, it is useful to
employ a common Information System (IS) along the SC. In the running phase, IS collects data
methodically and spreads the results to SC companies automatically. Besides, the costs of IS
implementation could be divided among firms proportionally. However, the introduction of such IS
in SC contexts might prove difficult and costly as companies should replace or revise their
computer systems, computer software and database structures (Holmberg, 2000).
Finally, SC actors share performance results. The outcome of measurement should be placed on the
“tables of the companies” so that everybody could assess its performance and monitor the others.
For example, GlaxoSmithKline (GSK) uses its corporate intranet as platform where to share
performance results with the suppliers. These ones can look at information, verify their contribution
to common objectives and benchmark their performance with the other in every moment. Results
sharing in GSK has allowed partners to understand (Romano and Danese, 2006):
• which performance has been obtained, in comparison with the other members of the network;
• what has caused such a results;
• which supplier should improve;
• how partners have succeed in satisfying the final consumer.
Another step towards the full PMS sharing is to create a common place where to discuss
performance results and service improvements. SC companies meet here with the aim of arguing
about service provided and the related performance levels. This is the place where participants
identify and agree on service improvement opportunities, recognize synergies to put into practice
and change strategic objectives in case of need (new final consumer requirements, new SC

20
companies needs, new technologies to adopt, etc.).
4. A CASE STUDY IN THE HEALTHCARE SECTOR
The above described shared PMS has been adopted in a case study. The considered case is the
contract between Azienda Sanitaria of Trieste (ASS1, customer) and Consorzio Nazionale Servizi
(CNS, provider). ASS1 is an Italian medical service authority which supplies citizens with sanitary
services as rehabilitation services, health education, alcoholism and drug addiction treatment, etc.
To realize these aims, it makes use of about 60 facilities (over 200.000 m3). ASS1 contracted out
facilities management to a single provider in 2003. The contract established both hard facility
services (real estate register, plants and buildings maintenance, energy management) and soft ones
(cleaning and sterilization, catering, laundry, logistics). CNS is responsible for managing and
coordinating the facility services, but it doesn’t supply services directly. In order to provide these,
CNS identified five suppliers with which it has formed a consortia. Thus, a three tier supply chain is
established to satisfy final consumer (Figure 4): the customer, the prime contractor and the
subcontracting companies.
SUBCONTRACTING COMPANIES
PRIME CONTRACTOR
CUSTOMERFINAL
CONSUMER
Provide the services Manage and coordinate the services
Lead service levels definition and monitor service performance
Receive the services
Figure 4 – The facility services supply chain
The group of stakeholders is much heterogeneous. Senior managers of all SC companies are
concerned with the contract. As regards the subcontracting companies and the prime contractor,
senior managers’ ultimate goal is to attain high returns. On the contrary, customer senior
21
management has to balance reduction in expenses and satisfactory service quality to final consumer.
Other major stakeholders are the foremen and workers of subcontracting companies and the facility
manager of the prime contractor. Looking at the customer we find different corporate functions
dealing with facilities (administration, real estate, information system, quality, purchasing, etc.),
moreover nearly one hundred of ASS1 employees are placed in the facilities with the aim to
monitor service provision. Finally, three typologies of final consumers receive the services:
patients, ASS1 attendants and the body of citizens.
The case study proved to be suited for our research. In fact, a previous study (De Toni et al., 2007)
has highlighted the lack of common information about service performance across the considered
SC. This deficiency contributed to rise conflicts among companies that, as a result, caused the
provision of unsatisfactory services to final consumers. Thus, we thought it right to implement the
shared PMS in this case study. Moreover, Schmitz and Platts (2004) report that using a PMS for the
entire SC seems to be reasonable when:
• for each company in the supply chain, this particular chain is sufficient priority;
• there are appropriate levels of trust and co-operation in the supply chain;
• processes are in place to share the profits or costs savings that come from increasing overall
supply chain performance.
Except for the latter point, the first two ones are true in the considered case. Then, we though
appropriate this case study for also these considerations.
4.1. Method
As a principal activity, a team in charge of the tool implementation was formed. The team included
the authors, the administrative manager of the customer and the facility manager of the prime
contractor. The two latter ones are the main managers in the considered SC: they both are the
ultimate responsible for managing the SC and for keeping relations among the companies. The
mixed team proved to be essential to assure the implementation success. Indeed, the administration
22
manager and facility manager stimulated SC actors to join in the tool development and in its
utilization. On the contrary, researchers looked after objectives definition and measures selection
with the aim of stopping unilateral decisions.
Implementation took place in the 2006-2008 period. Five activities were realized by the team: 1) it
established a place where SC companies could meet, 2) it created agreement upon strategic
objectives, 3) it created agreement upon performance measures, 4) it defined the mechanisms for
data collection, 5) it gathered information and presented the measurement results to the SC partners.
The first step was to create a common place where the SC companies could share information about
services, service levels, technical and organizational contract issues and improvement actions. The
team called it Partnership Table (PT) (De Toni and Montagner, 2008) and defined a regulation to
settle its structure, purposes, tasks and power (resolution n. 191/2006 by the ASS1 general
manager). The firms discuss SC problems and share solutions during the PT meetings.
Next, the implementation team identified the strategic objectives. A long process was established to
this aim. An early list of objectives was defined starting from FM literature and three workshops
with major managers of companies (De Toni et al., 2008). Priorities of companies senior managers
and mid-level managers were fixed with a questionnaire subsequently. Then, survey results were
shared among companies and the list of strategic objectives were refined during two PT meetings.
Strategic objectives guided the definition of performance measures. Authors listed a set of measures
gained from literature, while the administration manager and facility manager specified which data
were available and which one were difficult to collect. Measures were shared with the companies
that suggested limits and potential for improvements.
Finally, data were collected. Fortunately the considered SC case was already in possession of a
common information system; it acted as a precious source of data in our research. The team
integrated data coming from the information system with questionnaires and researches in the
archives of companies.

23
4.2. Performance measures
Table 2 reports the strategic objectives and the related performance measures that were developed
in the case study. The objective “qualifying the expenses for facility services” is peculiar to ASS1.
From the financial perspective, the customer does not demand for a lower expenditure – which is
established in the annual budget – but for a better expenditure, instead. That is, ASS1 wants higher
service quality under the same costs.
Table 2 – The performance measures
STRATEGIC OBJECTIVES
PERFORMANCE MEASURES
STRATEGIC LEVEL TACTICAL LEVEL OPERATIONAL LEVEL
FINANCIAL PERSPECTIVE
Qualifying the expenses for facility
services
• Service quality/cost ratio• Buildings availability/cost ratio
(for maintenance only)
• No. of initiatives for costs reduction
• Unit prices
Increasing in sales• Sales growth (%)• Customer’s share supplied
• Amount from new services• Amount from extraordinary
activities
• Quantities supplied
FINAL CONSUMER/CUSTOMER PERSPECTIVE
Increasing final consumer
satisfaction
• Patients satisfied (%)• ASS1 attendants satisfied (%)• Citizens satisfied (%)
• No. of facilities having unsatisfactory results
• No. of service components having unsatisfactory results
Increasing ASS1 satisfaction
• ASS1 managers satisfied (%) • Amount of penalties for non-performance of the contract
• No. of remainders for slow service provision
FACILITIES PERSPECTIVE
Augmenting service quality
• Perceived service quality by ASS1 managers
• No. of initiatives for service improvement
• No. of initiatives for assuringservice effectiveness
• Rate of activities execution (%)• No. of service failures
Augmenting building availability
• Buildings availability • No. of reactive maintenance per m³
• Mean time between maintenance• No. of initiatives for maintenance
improvement
• Mean repair time
LEARNING AND GROWTH PERSPECTIVE
Augmentingproblem solving
capacity
• ASS1 managers satisfied by the problem solving capacity (%)
• Providers managers satisfied by the problem solving capacity (%)
• Problem solving effectiveness• Problem solving quickness• No. of actors invited at the
Partnership Table
• Rate of absenteeism at the Partnership Table (%)
On the other hand, the prime contractor and the subcontracting companies pursue the objectives
“increasing in sales” and “raising ASS1 satisfaction”. These companies search for both economic
gains by the contract and customer loyalty. The remainder of the objectives are common across the

24
SC. All in all, the objectives are placed in the four perspectives; this kind of distribution stresses
that SC companies must consider diverse performance dimensions rather than focus on financial-
only measures.
The objectives are measured through three levels of indicators. On the strategic level, lag measures
quantify how much the objectives are obtained. The responsible for results on this level are the
customer’s, prime contractors’ and subcontracting companies’ senior managers. These use measures
to evaluate the overall performance of SC.
Tactical measures assess the contribution to goal by who manages the contract: the facility manager
of the prime contractor, the administration manager of the customer and the companies mid-level
managers involved in managing the facilities. These people coincide with who sits at the
partnership table to plan activities, discuss problems and define service improvements.
Finally, on the operational level, measures for single companies and service teams are defined.
Results lead companies and foremen where to concentrate improvement efforts. Generally,
responsibility is to single providers, but “rate of absenteeism at the PT” considers also the customer.
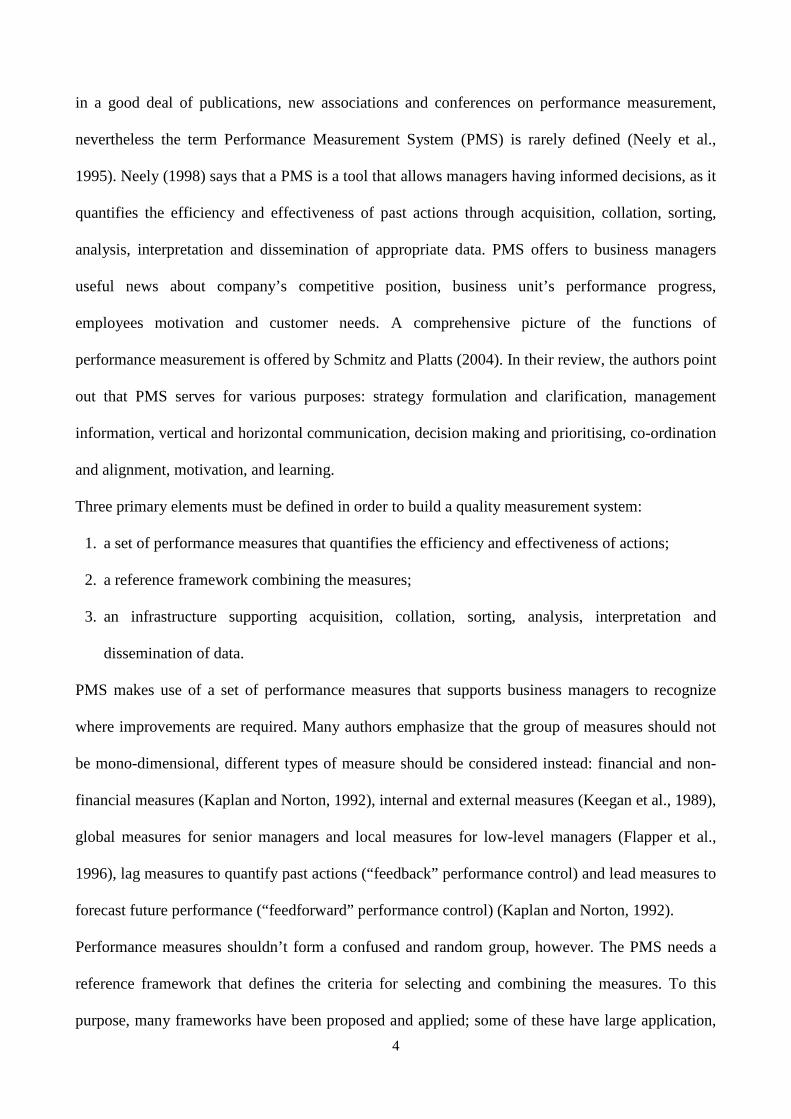
We give an example of performance results in Figure 5. Only the objective “augmenting building
availability” is reported; results responsibilities and data sources are clearly defined.
4.3. Success factors and major difficulties in the tool implementation
Next, we will mention the success factors that favoured the tool adoption and the problems that the
team had to solve. As regards the success factors, the sponsorship of companies’ senior managers
had an essential role. Their strong will to succeed in the development of a common measurement
system led ASS1, CNS and the other companies to push for the tool adoption.
Second, the established team for PMS development assured the implementation success. The
presence of the customer’s administration manager and the prime contractor’s facility manager as
members of the team induced the parties to share plans, objectives and results of the tool
implementation. Moreover, they assured the admission to information that authors could not obtain

25
by themselves. Third, the existing information system had a strong impact on the implementation
success. The continuity and constancy of data collected for the beginning of the contract allowed
longitudinal benchmarking as regards some SC performance.
0,006
0,007
0,008
0,009
0,01
0,011
0,012
2002 2003 2004 2005 2006 20072008
No
. O
F R
EA
CT
IVE
MA
INT
EN
AN
CE
pe
r m
3
YEAR
0,000
2,000
4,000
6,000
8,000
10,000
12,000
2002 2003 2004 2005 2006 20072008
ME
AN
TIM
E B
ET
WEE
N
MA
INT
EN
AN
CE
(d
ay
s)
YEAR
LEVEL MEASURE RESPONSIBLEDATA
SOURCEPERFORMANCE RESULTS
STRATEGICBuildings availability
Customer’s, prime contractor’s and maintenancecompany’s senior managers
Common information system
TACTICAL
No. of reactive maintenance per m³
Facility manager and customer’s and companies’ managers supervisingmaintenance
Common information system
Mean time between maintenance
Facility manager and customer’s and companies’ managers supervisingmaintenance
Common information system
No. of initiatives for maintenances improvement
Facility manager and customer’s and companies’ managers supervisingmaintenance
Minutes of the Partnership Table
2006: 1To develop staff of maintenance company.2007: 1To simplify procedures for works below 500,00€.
OPERATIONAL Mean repair timeForemen of maintenance teams
Common information system
MAINTENANCE TEAMS
Mean repair time (days)
2003 2004 2005 2006 2007
Lift attendants 5,553 2,055 0,359 4,972 0,905
Building attendants 11,660 15,426 9,389 6,500 7,667
Electricians 3,458 3,510 3,731 4,887 3,854
Smiths 4,887 4,023 4,295 5,540 4,981
Joiners 6,660 6,291 4,194 7,949 4,845
Gardener 9,125 16,731 6,364 9,545 7,292
Plumbers 2,917 4,731 4,670 5,278 3,829
Sewerage attendants 1,200 3,556 4,536 3,750 1,200
Phone attendants 3,340 2,751 2,938 2,260 2,886
Curtains attendants 6,724 3,923 7,304 7,750 6,828
Glaziers 3,311 2,406 2,600 3,459 3,345
20,00%
25,00%
30,00%
35,00%
40,00%
45,00%
50,00%
2002 2003 2004 2005 2006 2007 2008
BU
ILD
ING
S
AV
AIL
AB
ILIT
Y (
%)
YEAR
Figure 5 – Performance measures and results for the objective “Raising buildings availability”
On the opposite, the team had to overcome two major difficulties during the implementation. First,
26
it was hard to collect information about service levels because of the customer’s organization
complexity and the great number of facilities. For example, the final consumer satisfaction survey
was much costly as it was necessary to question over 250 people placed throughout Trieste city.
Second, although the information system resulted to be very useful, it could not offer all data
needed to assess SC performance. Then, it was indispensable to search elsewhere for such
information, that is in the archives of companies and through questionnaires. This kind of search
was complicated by information dispersion so that the team had to define mechanisms for collecting
data systematically. Anyway, SC companies are expanding the information system in order to
enrich database and to cut down future measurement efforts.
5. CONCLUSIONS AND IMPLICATIONS
In sum, the shared PMS considers a balanced evaluation of SC performance. Measures are
distributed in different perspectives (financial, customer/final consumer, facilities, learning and
growth) and in diverse organizational levels (senior management, mid-level management, low-level
management and workers). The tool development implicates all SC companies have a role, as they
participate in PMS implementation (sharing strategic objectives and selecting measures) and in its
utilization (providing data continuously and assessing everyone’s contribution to objectives
achievement). Thus, it is possible to coordinate and to align everyone’s activities towards common
or personal objectives. Such an information sharing is pivotal to realize a fruitful collaboration
across SC companies and improve overall performance (Kanter, 1994; De Toni, 2007).
5.1. Contributions for practice
FM professionals suffering a lack of communication along the SC have the chance to adopt tools, as
the mentioned shared PMS. The PMS allows to overcome shortage of information across SC, thus
providing common news to manage and improve services.
We have discovered that the lack of common information about SC performance contributed
27
towards a conflicting relationship between ASS1 and the remaining companies. On the contrary, the
utilization of the shared PMS reduced the gap among actors’ perceptions of service levels and
limited the lack of understanding among them. Indeed, the tool gave SC companies the same
information to assess services performance and to define improvements. It emphasized where to
improve service effectiveness and efficiency and which might be the opportunities for service
development.
But the capacity of such PMS goes further. The shared PMS helps SC companies to build a strong
partnership. During the development of such a system, all the firms share their own objectives. This
is a main point as partners should pursue a mutual profitable exchange to create a relation that holds
out long (Gunasekaran et al., 2004). Companies of the case study used the tool to get better relations
as well.
We also stress that the tool might be the basis for Service Level Agreements (SLA). In the
considered case the parties chose the measures “ASS1 attendants satisfied (%)” and “mean repair
time” as criteria for SLA, then they defined targets to get by the end of the year.
However, professionals aiming at PMS adoption must consider that the implementation process
may be very difficult. We report the problems restricting tool development in the above section.
The customer’s organization complexity and the high dispersion of information made data
collection difficult, thus resulting in greater time and costs. On the opposite, we verify that
companies and people commitment, on the same line as the existing information system,
encouraged PMS implementation. Despite supply chains might be very different among them, we
think these remarks could be considered by practitioners before implementing a shared PMS.
5.2. Contribution for research
This paper offers investigations on performance measurement in facility services SC. We propose a
measurement model that combines major contributions in SCM and FM literatures. The study
founds on the need for shared measurement systems that we discover in both literatures. SC authors
28
prompt to look at SC performance from an holistic perspective, that is to adopt a PMS which
considers the SC as a sole entity (Handfield and Nichols, 1999; Holmberg, 2000; Gunasekaran et
al., 2001; Chan and Qi, 2003b). Then, some authors (Holmberg, 2000; Kleijnen and Smits, 2003;
Cuthberson and Piotrowicz, 2008) call for shared models, metrics and measurement methods across
the SC. On the other hand, Brackertz and Kenley (2002) suggest to share the definition of measures
with many FM stakeholders. The balancing of different points of view concerning FM performance
is a necessary condition to build a win-win situation.
We judge tool sharing as the principle in our study, and we define four kinds of “sharing”: 1)
sharing performance objectives, 2) sharing performance measures, 3) sharing information systems
and admitting to private data, 4) sharing performance results and creating a common place where to
discuss service improvements. These have been performed in the case study.
The main contributions of this work is to propose a solution to the following problems with PMS
for SCM (Holmberg, 2000; Chan and Qi, 2003b; Chan et al., 2003; Shepherd and Gunter, 2006):
• Lack of connection with strategy. The shared PMS assumes that strategic objectives are clearly
defined from the very beginning of tool implementation. Performance measures connect
objectives to the activities of SC companies and people on different levels.
• Lack of a balanced approach, that is biased focus on financial measures. The model adopts a
balanced architecture that allows companies to look at SC performance from different
perspectives. Only one perspective considers financial measures, while the others require
diverse points of view: customer/final consumer, facilities and learning and growth.
• Lack of system thinking. The involvement of many companies in PMS design and utilization
implies the measurement system span the entire SC. Companies share objectives and
responsibilities in order to attain mutual benefits and overall performance.
This work makes other contributions to SCM literature. First, we add a case study as regards
performance measurement for SCM. Indeed, some SC researchers (Gunasekaran et al., 2004;
Cuthberson and Piotrowicz, 2008) verify that there is a lack of fieldworks and case studies on this
29
topic. Second, we increase knowledge about PMS design and development in supply chains.
According to Beamon (1999), on the same line as Schmitz and Platts (2004), literature that deals
with measurement system design and measures selection in SC is still poor. Third, we draw
attention to success factors and problems in model implementation. These issues are rarely debated
in literature (Shepherd and Gunter, 2006).
Our research contributes also to FM literature. Current papers about FM use a normative approach
mainly, whereas there is a need for empirical researches (Ventovuori et al., 2007). Moreover some
authors (Chotipanich, 2004; McLennan, 2004) guess the opportunity to borrow conceptual models,
techniques and tools from other disciplines in order to develop FM theory. The main reason behind
these lacks is probably that FM is an emerging area of research. However, the present study
contributes to the two above mentioned calls: in fact, we borrow concepts from SCM and PMS
literature in FM and, on the other hand, we offer the empirical evidence of the model usability.
5.3. Limitations and further research
Future studies in performance measurement for SCM and FM can base on insights we outline in the
background section of this paper. If someone would study in depth the sharing of PMS in SC
contexts, we suggest three possible research streams.
Firstly, we build the shared PMS on SCM and FM literature. The application of the model to FM
sector is the main limitation of our work, but it is also the principal opportunity for further research.
More studies might test the model for generalization, thus applying it to both manufacturing and
other service industries.
Secondly, there is a need for further research concerning the involvement of final consumer to
design the shared PMS. In our study we avoid to involve the final consumer in order to reduce
system implementation complexity. We prefer to develop an early PMS starting from the needs of
SC companies only. At present, the implementation team of the considered case is studying how to
engage the final consumers (by some consumers’ association or spokesmen) in order to adjust PMS
30
to their needs as well. Companies can get better information about service levels and improvements
required through a major consumer involvement.
Finally, it is intriguing to further develop the tool through measures for assessing final consumers’
contribution to service outcomes. According to Atkinson and colleagues (1997) a quality PMS
should tell the company if it is receiving an adequate support by all the stakeholders (employees,
suppliers, customers). Also Neely and colleagues (2002) state the importance of stakeholders
contribution. In their model, the Performance Prism, they use a new measurement perspective to
assess the performance of suppliers, customers, employees, alliances, investors, and the local
community. Other authors (Lee et al., 2003) recognize that performance of the companies now
depends on the performance of its partners in the value chain, in addition to the performance within
the enterprise. Going further, we say that performance of the companies may depend on the
performance of final consumer at times. Emerging theories on value co-creation by service
customers (Pralahad and Ramaswamy, 2004; Lusch and Vargo, 2006) support this final remark.
Thus, we believe the shared PMS can be further extended by evaluations of consumer contribution
to value creation.
REFERENCES
Amaratunga, D. and Baldry, D. (2000), “Assessment of facilities management performance in higher
education properties”, Facilities, Vol. 18. Nos 7/8, pp. 293-301.
Amaratunga, D. and Baldry, D. (2003), “A conceptual framework to measure facilities management
performance”, Property Management, Vol. 21, No. 2, pp. 171-189.
Amaratunga, D., Baldry, D. and Sarshar, M. (2000), “Assessment of facilities management performance:
what next?”, Facilities, Vol. 18, No. 1/2, pp. 66-75.
Amaratunga, D., Haigh, R., Sarshar, M. and Baldry, D. (2002), “Application of the balanced scorecard
concept to develop a conceptual framework to measure facilities management performance within NHS
facilities”, International Journal of Health Care Quality Assurance, Vol. 15, No. 4, pp. 141-51.
Angerhofer, B.J. and Angelides, M.C. (2006), “A model and a performance measurement system for
31
collaborative supply chains”, Decision Support Systems, Vol. 42, pp. 283-301.
Atkinson, A.A., Waterhouse, J.H. and Wells, R.B. (1997), “A stakeholder approach to strategic performance
measurement”, Sloan Management Review, Spring, pp. 25-37.
Beamon, B.M. (1998), “Supply chain design and analysis: models and methods”, International Journal of
Production Economics, Vol. 55, No. 3, pp. 281-294.
Beamon, B.M. (1999), “Measuring supply chain performance”, International Journal of Operations &
Production Management, Vol. 19, No. 3, pp. 275-292.
Brackertz, N. and Kenley, R. (2002), “A service delivery approach to measuring facility performance in local
government”, Facilities, Vol. 20, No. 3/4, pp. 127-135.
Brewer, P.C. and Speh, T.W. (2000), “Using the balanced scorecard to measure supply chain performance”,
Journal of Business Logistics, Vol.21, No. 1, pp. 75-93.
Brewer, P.C. and Speh, T.W. (2001), “Adapting the balanced scorecard to supply chain management”,
Supply Chain Management Review, pp. 48-56.
Brown, M. (1996), Keeping score: using the right metrics to drive world class performance, Quality
Resources, New York.
Bullinger, H.J., Kuhner, M. and van Hoof, A. (2002), “Analysing supply chain performance using a balanced
measurement method”, International Journal of Production Research, Vol. 40, No. 15, pp. 3533-3543.
Busi, M. and Bititci, U.S. (2006), “Collaborative performance management: present gaps and future
research”, International Journal of Productivity and Performance Management, Vol. 55, No. 1, pp. 7-25.
Callioni, G. and Billington, C. (2001), “Effective collaboration: Hewlett-Packard takes supply chain
management to another level”, OR/MS Today, Vol. 28, No. 5, pp. 34-39.
Carmona, S. and Gronlund, A. (2003), “Measures vs actions: the balanced scorecard in Swedish Law
Enforcement”, International Journal of Operations & Production Management, Vol. 23, No. 12, pp.
1475-1496.
Chan, F.T.S. and Qi, H.J. (2003a), “An innovative performance measurement method for supply chain
management”, Supply Chain Management: An International Journal, Vol. 8, No. 3, pp. 209-233.
Chan, F.T.S. and Qi, H.J. (2003b), “Feasibility of a performance measurement system for supply chain: a
process-based approach and measures”, Integrated Manufacturing Systems, Vol. 14, No. 3, pp. 179-190.

32
Chan, F.T.S., Qi, H.J., Chan, H.K., Lau, H.C.W. and Ip, R.W.L. (2003), “A conceptual model of
performance measurement for supply chains”, Management Decision, Vol. 41, No. 7, pp. 635-642.
Chotipanich, S. (2004), “Positioning facilities management”, Facilities, Vol. 22, Nos. 13/14, pp. 364-372.
Coronel, P. and Evans, A. (1999), “The balanced scorecard in facilities management”, paper presented at
AAPPA Conference, Melbourne.
Cuthbertson, R. and Piotrowicz, W. (2008), “Supply chain best practices – Identification and categorisation
of measures and benefits”, International Journal of Productivity and Performance Management, Vol. 57,
No. 5, pp. 389-404.
De Toni, A.F. (ed.) (2007), Open Facility Management: innovative models and operational tools for
organizing and managing outsourced services (translation from Italian title), IlSole24ORE Spa, Milan.
De Toni, A.F. and Montagner, M. (2008), “The partnership table as an organizational tool for improving
customer-provider relationship: a case study”, 3rd World Conference on Production and Operations
Management, Gakushuin University, Tokyo (JP), August 5th-8th, pp. 2031-2044.
De Toni, A.F. and Tonchia, S. (2001), “Performance measurement systems Models, characteristics and
measures”, International Journal of Operations & Production Management, Vol. 21, No. 1/2, pp. 46-70.
De Toni, A.F., Deluisa, R. and Montagner, M. (2008), “Implementing importance-performance matrix in
facilities management: an Italian case study”, 15th EUROMA Conference: Tradition and innovation in
operations management, University of Groningen, Groningen (NL), June 15th-18th.
De Toni, A.F., Fornasier, A. Montagner, M. and Nonino, F. (2007), “A performance measurement system for
facility management: the case study of a medical service authority”, International Journal of Productivity
and Performance Management, Vol. 56, Nos. 5/6, pp. 417-435.
Fitzgerald, L., Johnston, R., Brignall, S., Silvestro, R. and Voss, C. (1991), Performance measurement in
service businesses, CIMA, London.
Flapper, S.D.P., Fortuin, L. and Stoop, P.P.M. (1996), “Toward consistent performance measurement
systems”, International Journal of Operations & Production Management, Vol. 16, No. 7, pp. 27-37.
Gunasekaran, A., Patel, C. and McGaughey, R.E. (2004), “A framework for supply chain performance
measurement”, International Journal of Production Economics, Vol. 87, pp. 333-347.
Gunasekaran, A., Patel, C. and Tirtiroglu, E. (2001), “Performance measures and metrics in a supply chain
33
environment”, International Journal of Operations & Production Management, Vol. 21, No. 1/2, pp. 71-
87.
Handfield, R.B. and Nichols, E.L. (1999), Introduction to supply chain management, Prentice Hall, Upper
Saddle River, NJ.
Hines, P., Lamming, R., Jones, D., Cousins, P. and Rich, N. (2000), Value stream management – Strategy
and excellence in the supply chain, Financial Times Prentice Hall, Harlow, England.
Holmberg, S. (2000), “A systems perspective on supply chain measurements”, International Journal of
Physical Distribution & Logistics Management, Vol. 30, No. 10, pp. 847-868.
IFMA (2008), “FM definitions”, International Facility Management Association, article available on
http://www.ifma.org/what_is_fm/fm_definitions.cfm
Jensen, B. and Gerr, G. (1994), “Seismic shifts in HR management: a case study in mapping radical change
at Pepsi”, Employment Relations Today, pp. 407-417.
Kanter, R.M. (1994), “Collaborative advantage: the art of alliances”, Harvard Business Review, July-August,
pp. 96-108.
Kaplan, R.S. (2005), “How the balanced scorecard complements the McKinsey 7-S model”, Strategy &
Leadership, Vol. 33, no. 3, pp. 41-46.
Kaplan, R.S. and Norton, D.P. (1992), “The balanced scorecard: measures that drive performance”, Harvard
Business Review, Vol. 70, No. 1, pp. 71-79.
Kaplan, R.S. and Norton, D.P. (1993), “Putting the balanced scorecard to work”, Harvard Business Review,
Vol. 71, No. 5, pp. 134-141.
Kaplan, R.S. and Norton, D.P. (1996), Balanced Scorecard: translating strategy into action, Harvard
Business School Press, Boston.
Kaplan, R.S. and Norton, D.P. (2000), “Having trouble with your strategy? Then map it”, Harvard Business
Review, Vol. 78, No. 5, pp. 167-176.
Kaplan, R.S. and Norton, D.P. (2004), Strategy maps: converting intangibles assets into tangibile outcomes,
Harvard Business School Publishing, Boston.
Kaplan, R.S. and Norton, D.P. (2005), “The office of strategy management”, Harvard Business Review, Vol.
83, No. 10, pp. 72-80.
34
Keegan, D.P., Eiler, R.G. and Jones, C.R. (1989), “Are your performance measures obsolete?”, Management
Accounting, Vol. 70, No. 12, pp. 45-50.
Kincaid, D.G. (1994), “Measuring performance in facility management”, Facilities, Vol. 12, No. 6, pp. 17-
20.
Kleijnen, J.P.C. and Smits, M.T. (2003), “Performance metrics in supply chain management”, The Journal of
the Operational Research Society, Vol. 54, No. 5, pp. 507-514.
Lee, W.B., Cheung, H.C.W., Choy, L. and Choy, K.L. (2003), “Development of a web-based enterprise
collaborative platform for networked enterprises”, Business Process Management Journal, Vol. 9, No. 1,
pp. 46-58.
Lohman, C., Fortuin, L. and Wouters, M. (2004), “Designing a performance measurement system: a case
study”, European Journal of Operational Research, Vol. 156, No. 2, pp. 267-286.
Loosemore, M. and Hsin, Y.Y. (2001), “Customer-focused benchmarking for facilities management”,
Facilities, Vol. 19, No. 13/14, pp. 464-475.
Lusch, R. and Vargo, S. (Eds.) (2006), The service-dominant logic of marketing: dialog, debate, and
directions, M.E. Sharpe, NY.
Lynch, R.L. and Cross, K.F. (1991), Measure up: the essential guide to measuring business performance,
Mandarin, London.
Marr, B and Neely, A. (2003), Automating your scorecard: the balanced scorecard software report,
InfoEdge (Gartner), Stamford, CT.
McLennan, P. (2004), “Service operations as a conceptual framework for facility management”, Facilities,
Vol. 33, Nos. 13/14, pp. 344-348.
Neely, A. (1998), Measuring business performance, The Economist Books, London.
Neely, A., Adams, C. and Kennerley, M. (2002), The Performance Prism: the scorecard for measuring and
managing business success, Financial Times/Prentice Hall, London.
Neely, A.D. (1999), “The performance measurement revolution: why now and what next?”, International
Journal of Operations & Production Management, Vol. 19, No. 2, pp. 205-228.
Neely, A.D. (2005), “The evolution of performance measurement research: developments in the last decade
and a research agenda for the next”, International Journal of Operations & Production Management, Vol.

35
25, No. 12, pp. 1264-1277.
Neely, A.D., Mills, J., Platts, K., Richards, H., Gregory, M., Bourne, M. and Kennerley, M. (2000),
“Performance measurement system design: developing and testing a process-based approach”,
International Journal of Operations & Production Management, Vol. 20, No. 10, pp. 1119-1145.
Neely, A.D., Mills, J.F., Gregory, M.J. and Platts, K.W. (1995), “Performance measurement system design: a
literature review and research agenda”, International Journal of Operations & Production Management,
Vol. 15, No. 4, pp. 80-116.
Pralahad, C. K. and Ramaswamy, V. (2004), The future of competition: co-creating unique value with
customers, Harvard Business School Press, Boston.
Romano, P. and Danese, P. (2006), Supply chain management. The management of delivery and distribution
processes (translation from Italian title), McGraw-Hill.
Schmitz, J. and Platts, K.W. (2004), “Supplier logistics performance measurement: indications from a study
in the automotive industry”, International Journal of Production Economics, Vol. 89, No. 2, pp. 231-43.
Shaw, D. and Haynes, B. (2004), “An evaluation of customer perception of FM service delivery”, Facilities,
Vol. 22, No. 7/8, pp. 170-177.
Shepherd, C. and Gunter, H. (2006), “Measuring supply chain performance: current research and future
directions”, International Journal of Productivity and Performance Management, Vol. 55, No. 3/4, pp.
242-258.
Supply-Chain Council (2006), “Supply-chain operations reference-model version 8.0”, available at:
www.supply-chain.org (accessed 16 August 2006).
Theeranuphattana, A. and Tang, J.C.S. (2008), “A conceptual model of performance measurement for supply
chains: Alternative considerations”, Journal of Manufacturing Technology Management, Vol. 19, No. 1,
pp. 125-148.
Tranfield, D. and Akhlaghi, F. (1995), “Performance measures: relating facilities to business indicators”,
Facilities, Vol. 13, No. 3, pp. 6-14.
Ventovuori, T., Lehtonen, T., Salonen, A. and Nenonen, S. (2007), “A review and classification of academic
research in facilities management”, Facilities, Vol. 25, No. 5/6, pp. 227-237.