a policy framework for investment: trade policy€¦ · trade policy by encouraging technology...
TRANSCRIPT

Supported by
Ministry of Finance
OECD CONFERENCE INVESTMENT FOR DEVELOPMENT: MAKING IT HAPPEN
25-27 October 2005, Rio de Janeiro, Brazil
Hosted by the Government of Brazil
Organised by the OECD Investment Committee
In partnership with the World Bank
Background information in support of the Global Forum on International Investment "Putting the Policy Framework for Investment into Action"
A POLICY FRAMEWORK FOR INVESTMENT: TRADE POLICY
The present material is circulated under the responsibility of the OECD Secretariat. It represents work in progress and does not necessarily represent the views of the OECD or the Organisation's member countries. It will be further revised in light of comments by Global Forum participants, relevant OECD bodies and the Task Force overseeing the development of the Policy Framework for Investment.

2
A POLICY FRAMEWORK FOR INVESTMENT: TRADE POLICY*
A country’s trade policy influences both domestic and foreign investment and is important for any development strategy. Investment has long been recognized as a key ingredient to economic growth and development. This paper explores how trade policy can:
• Encourage investment – both domestic and foreign. When appropriate, foreign direct investment (FDI) is the focus. The positive role of FDI for development has been recently stressed by the Monterrey Consensus. Trade policy is one of the main determinants of foreign firms in their investment decisions.
• Maximise the contribution of investment to development growth, in particular in the context of trade policy by encouraging technology transfers and other linkages that induce growth.
Following this Introduction, Section 1 discusses the changing interrelationship of investment (domestic and particularly FDI) to trade. Section 2 gives an overview of how trade policies can promote an attractive environment for investment (domestic and foreign) and the considerations of when this could lead to economic growth. This section uses a two-by-two framework analysing export and import policies for host and home countries. Section 3 concludes by outlining issues that policy makers may consider in formulating trade policy. Because the PFI is to be “an operational, practical guide for policymakers”, an annex also details a trade policy framework focused on measures and techniques available to trade policy makers which may be used to assess whether national trade policies may reflect ‘good practice’.
1. The Changing Interrelationships of Trade, Domestic Investment and FDI
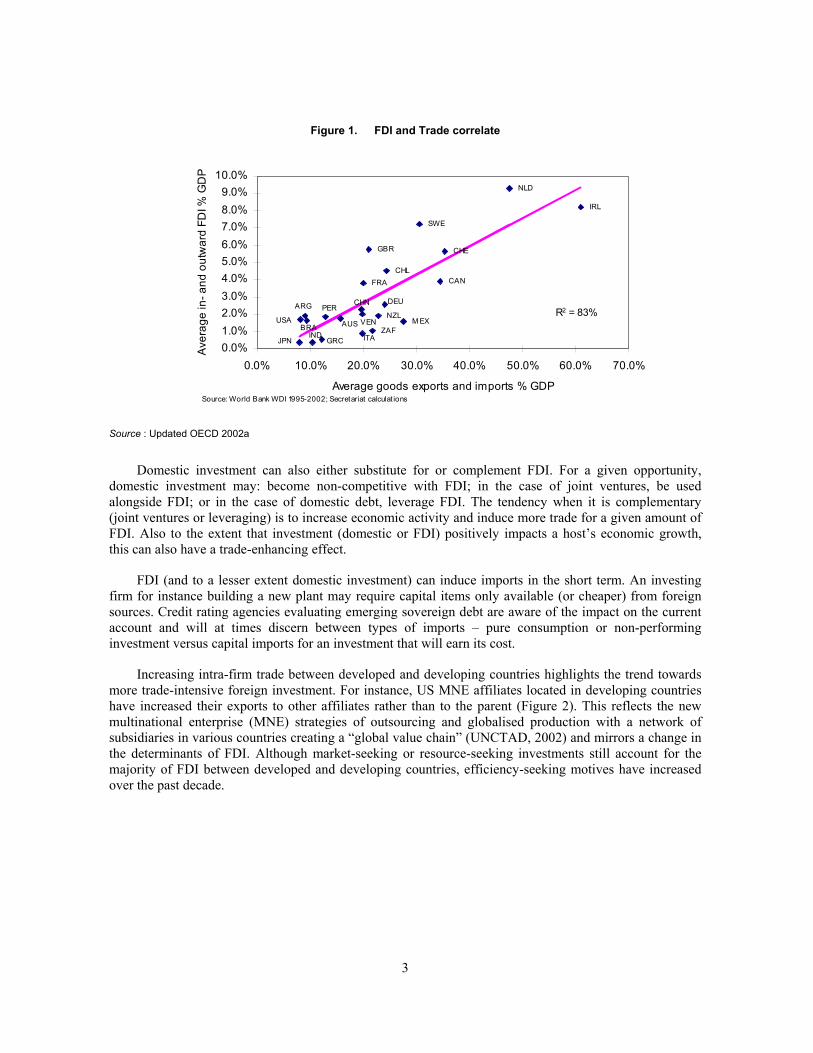
The relationship between international trade, domestic investment and FDI is complex and intrinsically interlinked. To begin, trade can either substitute for or complement FDI. Market-seeking firms1 can serve foreign markets through export sales or through foreign subsidiaries. The latter effectively substitutes FDI for trade. But affiliates of foreign firms in turn create new trade flows with their parent companies or foreign suppliers and can also export to third countries or back to the home country, thus increasing trade. Trade can also draw attention to resources and markets that can highlight investment opportunities. Hence unsurprisingly, greater trade correlates with greater investment flows (Figure 1).
* This paper was prepared by Jonathan Gage and Sebastien Miroudot of the OECD Trade Directorate. It benefited from comments received during discussions in the Working Party of the Trade Committee, the Investment Committee and the Task Force overseeing the development of the Policy Framework for Investment. It has been published as OECD Trade Policy Working Paper No 19.
1 . FDI is often classified into four types according to the investing firm’s motives: market-seeking (to get access to new foreign markets), resource-seeking (to get access to resources not available at home), efficiency-seeking (to take advantage of cost differences/scale economies and rationalize production), and strategic asset seeking (to acquire strategic assets or prevent competitors from obtaining them). Dunning, J. (2002), “Determinants of Foreign Direct Investment: Globalization Induced Changes and the Role of FDI Policies”, paper presented at the ABCDE-Europe Conference, Oslo, June 24, 2002.
3
Figure 1. FDI and Trade correlate
ARG
AUSBRA
CANCHL
CHN
FRA
DEU
GRCIND
IRL
ITAJPN
M EX
NLD
NZLPER
ZAF
SWE
CHEGBR
USA VEN
0.0%1.0%2.0%3.0%4.0%5.0%6.0%7.0%8.0%9.0%
10.0%
0.0% 10.0% 20.0% 30.0% 40.0% 50.0% 60.0% 70.0%
Average goods exports and imports % GDP
Ave
rage
in- a
nd o
utw
ard
FDI %
GD
P
Source: World Bank WDI 1995-2002; Secretariat calculat ions
R2 = 83%
Source : Updated OECD 2002a
Domestic investment can also either substitute for or complement FDI. For a given opportunity, domestic investment may: become non-competitive with FDI; in the case of joint ventures, be used alongside FDI; or in the case of domestic debt, leverage FDI. The tendency when it is complementary (joint ventures or leveraging) is to increase economic activity and induce more trade for a given amount of FDI. Also to the extent that investment (domestic or FDI) positively impacts a host’s economic growth, this can also have a trade-enhancing effect.
FDI (and to a lesser extent domestic investment) can induce imports in the short term. An investing firm for instance building a new plant may require capital items only available (or cheaper) from foreign sources. Credit rating agencies evaluating emerging sovereign debt are aware of the impact on the current account and will at times discern between types of imports – pure consumption or non-performing investment versus capital imports for an investment that will earn its cost.
Increasing intra-firm trade between developed and developing countries highlights the trend towards more trade-intensive foreign investment. For instance, US MNE affiliates located in developing countries have increased their exports to other affiliates rather than to the parent (Figure 2). This reflects the new multinational enterprise (MNE) strategies of outsourcing and globalised production with a network of subsidiaries in various countries creating a “global value chain” (UNCTAD, 2002) and mirrors a change in the determinants of FDI. Although market-seeking or resource-seeking investments still account for the majority of FDI between developed and developing countries, efficiency-seeking motives have increased over the past decade.

4
Figure 2. Rising intra-firm exports of US affiliates in developing countries implies trade-intensive FDI
19831993
1999
0%
10%
20%
30%
40%
50%
60%
70%
Intra
-firm
exp
orts
as
%
of to
tal U
S M
NE
expo
rt s
Developing
Industrial
Source : World Bank, 2003b
The recognition of the importance of introducing new technologies and management skills – through backward linkages – has refined development thinking. In its narrowest definition, backward linkages are the contracts between the foreign affiliates of a MNE and local suppliers of products used directly or indirectly in the manufacture or provision by the foreign affiliate’s product or service. Backward linkages may also include movements of people, demonstration effects and increased competition. MNEs, particularly those adhering to the OECD Guidelines for Multinational Enterprises, encourage local capacity building.2 While domestic investment typically dwarfs FDI, FDI in particular linked with trade, can be a catalyst for innovation, improved productivity and sustained growth. Backward linkages are considered the strongest and most consistent positive spillover (OECD, 2002a). Countries have introduced programmes to facilitate such links (Box 1).
Box 1. Ireland’s National Linkage Programme succeeded at a critical time
Since the mid 1980’s, Enterprise Ireland (EI) has been operating various linkage programmes to integrate foreign enterprises into the Irish economy. It pursues two tasks: first, to support Irish enterprises to build capacity, innovate and create new partnerships; and second, to assist international investors to source key suppliers in Ireland. EI collaborates closely with foreign affiliates, their parent MNEs, and the various government agencies involved with local suppliers.
Between 1985 and 1987, an estimated 250 foreign affiliates were actively involved in the linkage programme. During that period, affiliates operating in Ireland increased their local purchases of raw materials fourfold, from Irish £438 million to I£1,831 million, and more than doubled their purchases of services from I£980 million to over I£2 billion. In the electronics industry alone, the value of inputs sourced locally rose from 12% to 20%. On average, suppliers saw their sales increase by 83%, productivity by 36% and employment by 33%.
EI’s matchmaking worked closely with foreign affiliates to ensure suppliers were capable of achieving the demand and quality requirements. One of EI’s key criteria used for selecting local suppliers was their management team’s attitude and potential to grow. Also noteworthy is that EI’s matchmaking is no longer seen as so critical. The need diminished over time as the composition of affiliates, their motivations for locating in Ireland, and their local knowledge, changed. Ireland’s competitive advantages in the global value chain became generally recognised.
Source : UNCTAD, 2001
2 . Under the Guidelines, MNEs should “encourage through close co-operation with the local community, including business interests” (General policies #3) and encourage transfer and rapid diffusion of technologies and know-how (Science and Technology #1 to #5) (OECD, 2000).

5
The influence of e-Business-to-Business (e-B2B) is also changing the global value chain. MNEs are further specializing and establishing e-B2B marketplaces to source components and services in order to benefit from substantial cost savings and efficiency gains.3 This is an opportunity for host countries. The potential for technology transfer from ‘backward linkages’ with local suppliers in host countries is higher and more worthy to pursue if MNEs start outsourcing more with e-B2B.4
With such expanding use of trade-intensive FDI and changing nature of the global value chain, host and home countries may need to be ever more diligent to renew policies to ensure that best practices are in place to capture value for their constituents.
2. Trade policies affecting imports and exports of host and home countries
To analyze which trade policies could help a country foster investment and growth, policies affecting imports and exports in both the host and home countries are considered. A two-by-two approach has been used: the rows distinguish the export and import policies; and in the columns, whether the policies are being used by the host country (host of the investment project) or the ‘home’ country. Home traditionally means the source of the FDI funds but where applicable, this definition is broadened to also generally include the recipient of the final product or source of capital or intermediary goods. This is assumed so as to explore the impact of FDI- or domestically-financed projects. The host and home countries are not necessarily assumed to be developed or developing countries.5 Generally the issues are the same in developed or developing countries although sometimes emphasised differently.6 Where appropriate, trade policies targeting developing countries are the special focus in this paper because they are the host countries most in need of economic growth and the PFI is an initiative for development.
3 . After some high profile failures in 2002, e-B2B statistics have been increasing. Of firms surveyed spending $100 million or more on goods, 11.7% of intermediary inputs were purchased online in 2003 and surpassed the figure for indirect materials, such as office supplies for the first time. Online sourcing can bring year-on-year cost savings of 5%. (Financial Times/Forester Research, October 2003).
4 . Some technologies may benefit small firms in poor countries more. For example, credit available to small firms in poor countries increases more than average when credit information sharing technology is applied (World Bank, forthcoming). As costs fall for many new technologies, benefits may accrue more to smaller and poorer participants.
5 . While FDI inflows to developing countries come primarily from developed countries, there is a significant share from other developing countries. South-south investment is estimated at about 36% of total FDI inflows to developing countries in 2000 and is growing faster than North-South FDI (World Bank, 2003a).
6 . In Figure 6 of Annex A, trade impediments considered serious or very serious by firms are similar for developed or developing countries but predictably for instance, the “impediments to mobility of business people” is more an issue for firms of developing countries, and “foreign investment restrictions” is more an issue for firms of developed countries.
6
Table 1. Two-by-Two Taxonomy of Trade Policies
Host Country Home Country
Affecting Imports
Tariff and Non-Tariff Barriers Barriers on importing capital and intermediate goods Restrictions on services Regional trade agreementsa Customs administration, technical regulations and trade facilitation
Market access for host products Trade remedies Trade preferences Access to service markets
Affecting Exports
Export restrictions Export promotion strategies Export of services Custom procedures for exports
Export subsidies Export controls
a. Occasionally policies can be mentioned in more than one quadrant. Regional Trade Agreements (RTAs) can for instance be mentioned in all four quadrants. To avoid duplication, RTAs have been placed only in the first quadrant.
2.1. Trade policy in the host country affecting imports
Tariffs and non-tariff barriers (NTBs) on imports might attract, but will typically discourage, investment.
High barriers to imports can induce tariff-jumping FDI – FDI as an alternative to trade. There is evidence that firms tend to substitute FDI sales for exports when tariffs are high. However, empirical studies show that while tariffs were positively correlated with FDI in the past, they are now negatively correlated. This change is in line with the new organization of international production where MNEs choose to locate their activities in different countries to take advantage of cost differences and scale economies. Tariffs and NTBs can negate the competitive advantages offered by a host economy and negatively affect investors’ choice of location.
As suggested by the growth experience in some East Asian countries, strategic trade policies using barriers can also encourage (largely domestic) investment by compensating the firm for its adaptation costs and risk (especially when starting a new activity). The externality faced by pioneering firms is corrected by a temporary market power in the host economy. But nurturing such ‘infant industries’ has problems: (i) host governments must predict their future comparative advantage – a difficult task; (ii) the industry must become internationally competitive otherwise resources are misused. Infant industries have difficulty growing up. Free entry helps rationalize the market and keep only efficient firms producing at world prices. Even the East Asian countries which adopted strategic trade policies and proactive industrial policies have resorted to open-oriented strategies; and, (iii) host governments must have identified a market failure where investors do not see an opportunity – an uncertain practice. Other policy instruments are available to correct this externality faced by pioneering firms without resorting to trade policies which create distortions.
Restrictive trade policies also will weaken the positive effects of investment on the host economy. Barriers to imports, like other barriers to entry, can encourage the exercise of market power by firms (foreign or domestic) in the domestic market, which in turn is generally associated with lower efficiency, higher consumer prices and sometimes the use of “second-generation” technology. Therefore those FDI-induced backward linkages with domestic firms and technological spillovers will be less if there are restrictive trade policies. Moreover, small domestic markets with high barriers to imports hinder realisation of scale economies even further limiting the potential gains from trade and its interaction with investment.

7
Trade openness positively correlates with investment in most empirical studies. Sensitivity analyses of cross-country regressions indicate that trade openness is more likely to be correlated with FDI than any other explanatory variable.7 Trade liberalization encourages investment based on comparative advantage with efficiency gains through greater specialization and dynamic gains through scale economies. Once impediments to trade (and FDI) have been removed, economic factors can become the main determinants of an investor’s choice of location (UNCTAD, 2003). A commitment to free trade ensured by bindings
7 . Chakrabarti, A. (2001), “The Determinants of Foreign Direct Investment: Sensitivity Analyses of Cross-Country Regressions”, Kyklos, vol. 54, 1, pp. 89-114.
Box 2. Chile's Tariffs: Uniform and signalling with scheduled reductions
Many developed and developing countries escalate tariffs – higher tariff rates for processed and higher-value-added products but with low rates for raw inputs, see Figure 4. They also frequently apply tariff peaks to specific products. Such is intended to encourage domestic production in these higher valued products and thereby support greater productivity and wages. Broadly, Chile does not use tariff escalation or peaking. Chile has a uniform applied MFN rate for nearly all products. This tariff rate has been ratcheting down from 11% in 1996 to today’s 6% rate effective since January 2003, in clearly scheduled reductions.
The uniform tariff has several benefits:
• Distortions are created not only by the level of the tariffs but the dispersion. If Chile had a 20% tariff on beef but no tariffs of wines, then resources would tend to be reallocated from wine production – perhaps their comparative advantage – to beef which may be neighbouring Argentina’s comparative advantage. Chileans may not have looked for, and diversified into, other competitive industries like say farmed fish. The reallocation and oversight could be averted if there was a flat 10% tariff. Disparate tariffs penalize efficient activities (often exports), foster inefficiencies and increase costs within the economy thereby reducing the country’s overall competitiveness. Tariffs on imports can in essence be taxes on exports because of the inefficiencies and increased costs. A uniform nominal tariff will usually improve resource allocation and thereby raise economic welfare.a
• The uniform tariff is easier to administer. Customs officials need not worry about the tariff rates of different products.
• The administration is less prone to lobbying or rent-seeking activities of questionable (if not negative) value to the economy. It is easier for the Chilean government to reject pleas for special treatment.
• The process is less prone to potential corruption. Custom officials make fewer judgments of tariff classification which will affect the amount of tariff paid; the incentives for corruption are less.
• Disparate tariffs lead to local consumer prices which are distorted – i.e. that do not reflect the true relative costs of production in a free market. A uniform tariff levels the relative pricing amongst imported goods leaving conceptually only distortions between the domestic and foreign products collectively. Depending upon how much imported products constitute of all consumption, it could be a precursor for eventually adopting a flat-rate broadly-based consumption tax. Such a tax approach is usually deemed more beneficial by economists and may be the subject of other policy areas covered by the PFI.
The importance of a uniform tariff schedule has been recognised by some rating agencies. For instance, the Fraser Institute includes a measure for the standard deviation of the tariff rates, see Box 13.
By pre-announcing their schedule of reductions, the Chileans also were able to lock in a schedule which would allow their domestic industries (and foreign companies) to adapt. Such ‘signalling’ allows the Chilean economy to adjust gradually.
a. Some theoreticians argue to optimize welfare may require tariffs to reflect the demand elasticities of the products but this is more hypothetical than practical.
Source : World Bank (2003b)

8
under regional and multilateral agreements increases the foreign (and domestic) firms’ confidence to invest in the host economy.
Barriers on imports of capital and intermediate goods can be particularly damaging
One important issue regarding market access concerns capital and intermediate goods. Export competitiveness of companies – particularly foreign affiliates – requires state-of-the-art capital and intermediate goods available at world prices. By providing relatively cheaper capital goods, international trade increases the efficiency of capital accumulation. It is acknowledged that high tariffs on inputs may prompt companies to increase local sourcing but at a cost. Domestic firms may not be competitive internationally and foreign firms may be dissuaded from establishing locally. This explains why these import-substitution strategies have generally failed and been abandoned. To soften the impact on tariffs on capital and intermediate goods while maintaining some protection, duty drawbacks or tariff exemptions can be offered to exporters. These mechanisms can promote export-oriented investments but only if the system is administered efficiently without additional costs for exporters.
Particularly advantageous backward and forward linkages between foreign and domestic firms are more probable when barriers to trade in intermediate goods are low and local affiliates of MNEs are fully integrated in a global chain of production which uses cutting-edge technology. This is because advanced technologies are regularly embodied in the intermediate product imports. Hence local firms may see more opportunities to supply such advanced intermediates and frequently the MNE affiliates seeking to diversify their sources, will help domestic firms and their employees acquire knowledge and capability required for their manufacture and use (hence increasing the “absorptive capacity” of the host economy). This in turn will reduce the cost of learning other applications of this new technology and lower the start-up costs for other new investments. These backward and forward linkages can channel technological spillovers throughout the host economy.
Services are important for the rest of the economy
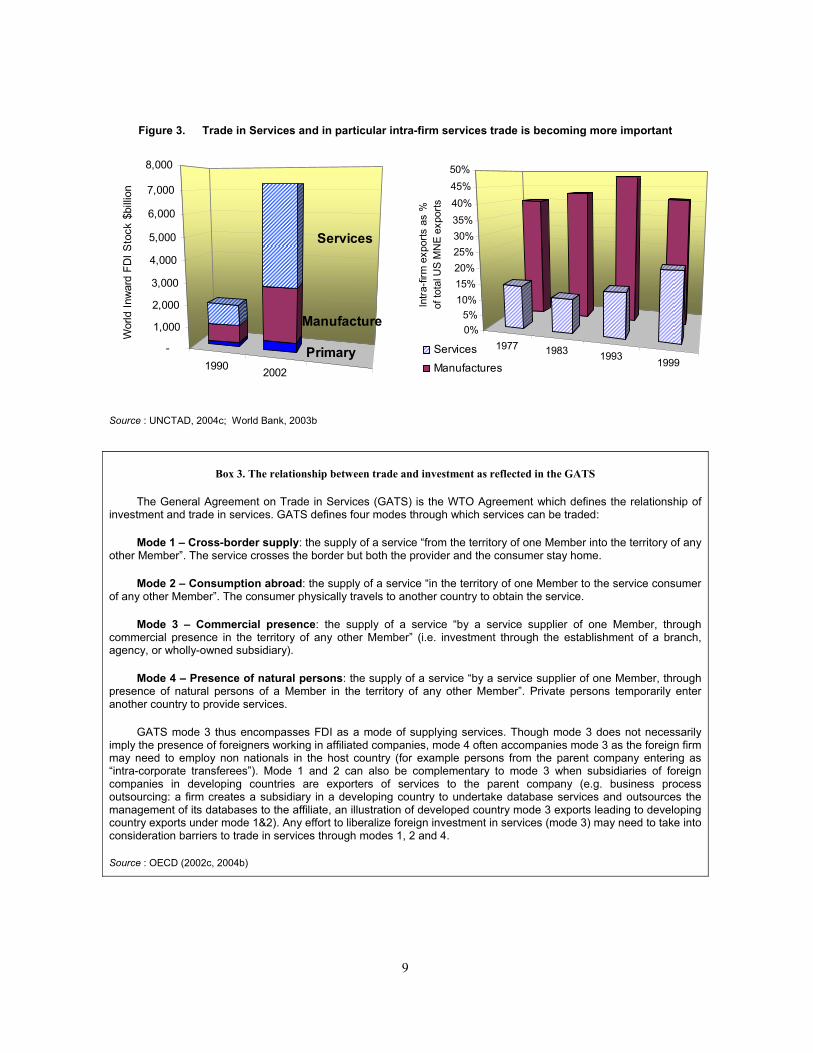
FDI in services now exceeds FDI in manufacturing (Figure 3). Many services are best transferred through FDI (mode 3 in GATS terminology, see Box 3). The rapid growth of FDI in services is also explained by technological progress and the globalization of production which has led to an important increase in intra-firm trade in services (World Bank, 2003b).
9
1977 1983 1993 1999
0%5%
10%15%20%25%30%35%40%45%50%
Intra
-firm
exp
orts
as
%
of to
tal U
S M
NE
expo
rts
Services
Manufactures
Figure 3. Trade in Services and in particular intra-firm services trade is becoming more important
1990 2002
-
1,000
2,000
3,000
4,000
5,000
6,000
7,000
8,000
Wor
ld In
war
d FD
I Sto
ck $
billi
on
Services
Manufacture
Primary
Source : UNCTAD, 2004c; World Bank, 2003b
Box 3. The relationship between trade and investment as reflected in the GATS
The General Agreement on Trade in Services (GATS) is the WTO Agreement which defines the relationship of investment and trade in services. GATS defines four modes through which services can be traded:
Mode 1 – Cross-border supply: the supply of a service “from the territory of one Member into the territory of any other Member”. The service crosses the border but both the provider and the consumer stay home.
Mode 2 – Consumption abroad: the supply of a service “in the territory of one Member to the service consumer of any other Member”. The consumer physically travels to another country to obtain the service.
Mode 3 – Commercial presence: the supply of a service “by a service supplier of one Member, through commercial presence in the territory of any other Member” (i.e. investment through the establishment of a branch, agency, or wholly-owned subsidiary).
Mode 4 – Presence of natural persons: the supply of a service “by a service supplier of one Member, through presence of natural persons of a Member in the territory of any other Member”. Private persons temporarily enter another country to provide services.
GATS mode 3 thus encompasses FDI as a mode of supplying services. Though mode 3 does not necessarily imply the presence of foreigners working in affiliated companies, mode 4 often accompanies mode 3 as the foreign firm may need to employ non nationals in the host country (for example persons from the parent company entering as “intra-corporate transferees”). Mode 1 and 2 can also be complementary to mode 3 when subsidiaries of foreign companies in developing countries are exporters of services to the parent company (e.g. business process outsourcing: a firm creates a subsidiary in a developing country to undertake database services and outsources the management of its databases to the affiliate, an illustration of developed country mode 3 exports leading to developing country exports under mode 1&2). Any effort to liberalize foreign investment in services (mode 3) may need to take into consideration barriers to trade in services through modes 1, 2 and 4.
Source : OECD (2002c, 2004b)
10
On average, developing countries have higher barriers to trade and investment in services than developed countries, especially in telecommunications, banking and financial sectors (OECD, 2004a). Some empirical studies suggest that for developing countries, services trade liberalisation could yield benefits up to four times greater than liberalising trade in goods because its benefits go beyond the services sectors. Liberalising services trade can also help to promote trade in goods and facilitate the diffusion of knowledge in key sectors such as financing techniques (World Bank, 2003b).
Among these key sectors, infrastructure services are of particular interest for developing countries. The low FDI in developing countries is partially explained by the inadequate infrastructure such as transport services, telecommunications, utilities or legal systems. Imports of infrastructure services (which are often FDI themselves) can compensate for the lack of local infrastructure and facilitate FDI.
The GATS schedules provide a useful framework for committing to liberalising trade in services. The positive list approach allows a host country to specify progressive, scheduled ownership and competition liberalisation commitments by sector. Some Latin American countries used this flexibility in their in telecoms commitments (Box 4). As noted before, bindings under regional and multilateral agreements can increase the foreign (and domestic) firms’ confidence to invest in the host economy.
Having noted the positive list approach allows flexibility and degree of comfort to make such international commitments, it is not the only approach. A negative list approach – where the country identifies sectors and measures to explicitly carve out – holds out the prospect of achieving greater clarity about what is "in" or "out". For services exporters, it may provide more transparency and certainty about the rules for doing their business. The negative list also offers scope to clearly and unambiguously carve out sectors such as public education, health, and drinking water. The preparation of the list also requires the government to carefully assess all their regulations for consistency with disciplines of national treatment, MFN, etc. which in itself may be useful.8
8 . For a discussion of the potential benefits, New Zealand outlines the reasons for adopting the negative list approach in their Chile and Singapore Closer Economic Partnership agreements. http://www.mfat.govt.nz/foreign/tnd/ceps/cepchilenzsing/infobulletinjuly04.html. OECD, Regionalism and the Multilateral Trading System, 2003, pages 33-37 also discusses the negative vs positive list approaches.

11
Box 4. Latin telecom GATS commitments ‘signal’ liberalisation
In the 1997 GATS Agreement on Basic Telecommunications, four Latin American nations committed to phased-in broad liberalisation in the telecoms sector doing away with exclusivity for fixed local and long distance services: Peru (by 1999), Argentina (2000), Venezuela (2000), and Bolivia (November 2001).
Table 2. An example: Bolivia commits effective November 2001
Sample Sector Market Access Commitment
Local, domestic long-distance and international voice, data, message or video services for non-public use (services provided to closed groups of users distinct from the service provider): (a)Voice telephony; (b)Packet-switched data transmission services; (c)Circuit-switched data transmission services; (d)Telex services;
(1) Until 27 November 2001, domestic long-distance and international service only using the ENTEL their local monopoly infrastructure. Commercial presence required for local services.
(2) None i.e. not allowed/not meaningful (3) Until 27 November 2001, domestic long-distance and
international service only using the ENTEL infrastructure. Commercial presence required for local services.
(4) Unbound, except as indicated in Section 1 the general limitations on immigration.
Modes: (1) Cross-border supply (2) Consumption abroad (3) Commercial presence (4) Presence of natural persons Source : www.wto.org
Amongst developing country regions, Latin America has the highest mainline penetrations, a measure of telephone availability, and that penetration has been growing at one of the fastest rates. In three of the four countries undertaking phased-in liberalisation, penetration per capita grew an average 9.1% per annum from 1993 to 2001 which contrasts with the lower 6.5% average of for instance Paraguay, Uruguay, Suriname and Guyana which made fewer commitments under the 1997 Agreement.
Signalling allows segments of the economy to adapt. Recent research looking into the sequencing of reforms: privatization, regulation and competition, emphasizes avoiding long periods of non-competition but circumstances might justify some ‘signalling’.
Source : WTO; World Bank (1998, 2002b, 2004d); Secretarial calculations on World Bank WDI database.
Regional trade agreements create larger markets
Regional trade agreements (RTAs) help smaller economies attract domestic and foreign investment by creating larger markets and enhancing dynamic gains from trade. Depending upon the industry, such larger markets combined with economies-of-scale can make investment more profitable. In the context of global value chains (with MNEs producing in different locations), market size is no longer defined by national boundaries. Market size will also depend on the network of trade agreements signed by a country which no longer depends upon geography.9 RTAs can generate both market-seeking and efficiency-seeking domestic and foreign investment (seeking scale economies for investors both inside and outside the RTA).
Tariff-jumping FDI can occur in free trade areas with high external tariffs but this type of investment is not necessarily welfare-enhancing if local costs of production exceed the cost of imports (World Bank, 2000). However, evidence on recent preferential trade agreements suggests that, in addition to their market enlarging effects through trade liberalization, these agreements include provisions on other issues, such as
9 . There is a trend to more cross-regional RTAs. As at October 2003, 40% of the proposed RTAs notified to the WTO were cross-regional (WTO Regionalism workshop, 2003).
12
investment, services, intellectual property or competition policy, which also significantly impact investment and trade. These modern RTAs show little evidence of generating tariff-jumping FDI.
Facilitating trade can concurrently promote investment and trade
Efficiency-seeking investment involves large volumes of imports of intermediate products and intra-firm trade between local affiliates and their parent companies. Average customs clearances for imports into India and Ecuador of 10 to 14 days respectively compare unfavourably with the average of only about 2 days for high-income countries. The costs incurred to satisfy customs procedures and technical regulations are sometimes higher than tariffs (World Bank, 2004b). Estimates of border procedure-related trade transaction costs (TTCs) for international commerce vary widely from 1% to 15% of the traded goods’ value. Poor border procedures particularly which increase waiting times, can reduce the number and value of profitable projects dependent on international trade and hinder FDI and investment in general. Even before considering the dynamic gains of inducing such investment, the income gains from reducing TTCs are substantial and particularly for non-OECD countries. Using the minimum estimate of 1% reduction in TTCs on only the goods trade, gross domestic product may gain up to 0.47% on average in non-OECD countries which is seven times higher than in OECD countries because of the former’s generally less efficient procedures and composition of their trade (OECD 2003d).
Improving the efficiency of customs administrations can favourably impact on investment decisions by domestic and particularly foreign firms. Transaction costs can be reduced by more transparent and predictable procedures, impartial and uniform administrative border requirements, simplified clearance systems, harmonization of administrative requirements, the suppression and streamlining of unduly burdensome procedures, co-ordination, risk management and by introducing electronic customs clearance systems. Customs administrations in some developing countries have recently undertaken important reforms with some success in several instances (OECD, 2003a). Also the WTO is currently exploring trade facilitation rules centred on commitments for border and border-related procedures to expedite the movement, release and clearance of goods as well as the development and implementation of a comprehensive technical assistance program.
Trade facilitation is critical to attract investment (in particular FDI) and beyond just customs procedures and technical regulations. Better infrastructure for sea, land and air transport are associated with higher volumes of trade. Importantly, efficient ports explain bilateral trade patterns better than preferential margins. With regards to telecommunications, the supply response to reducing import tariffs on goods is larger the higher the penetration rate of telecommunications. Just-in-time supply chain management may require good infrastructure combined with procedure and regulation improvements (WTO, 2004). For investment in projects depending upon trade, such trade facilitation can be crucial as evident in Costa Rican’s relationships with Intel (Box 5).

13
Box 5. Costa Rica and Intel – Using trade promotion and facilitation
The US computer industry giant Intel Corp. constructed a $300 million plant that began operation in 1998 in Costa Rica. A small country of only 3.5 million inhabitants with an industry-specific promotion and export orientation was able to lure a major player and build a world-class high technology ‘cluster’.
Many lessons can be learned from this success but as far as trade policy is concerned, noteworthy is that the Costa Rican investment promotion agency (CINDE) used trade and investment promotion along with trade facilitation to persuade Intel. While Costa Rica listened attentively for infrastructure and operational needs and showered Intel with attention and information, many observers felt that it did not offer excessive concessions to Intel and when concessions were offered, they were applied to all other firms as well. These included waiving a 1% tax on assets (extended to all firms in the Export Processing Zones), upgrading road access, increasing the number of foreign air carriers allowed to fly to Costa Rica so that imports and exports could meet just-in-time requirements, tweaking the electricity pricing and power arrangements, and expanding the training in electronics and English. Such was to address “legitimate concerns” of Intel.
Although Intel was not the first electronic foreign investor, it has been the catalyst: Intel’s arrival dramatically reduced the perceived risk for new investors. With Intel, numerous other companies such as ACER, ALCATEL, Baxter Healthcare, Panasonic, Lucent, Conair, Siemens, and Hitachi, have diversified Costa Rica’s economy away from its bananas and coffee dependence. Even though chip prices declined rapidly in 2000 and Intel retooled in 2001, revenues have been coming back. Electronics represent about one-third of Costa Rica’s exports in 2002.
Source : World Bank FIAS 1998 Occasional Paper 11
In building infrastructure, a host country may consider public-private partnerships (PPPs). PPPs have been used successfully for clearly defined projects with (or arranged) attributable and delineated revenue. PPPs can be particularly attractive for public entities under tight fiscal constraints and additionally if the private partner brings expertise to the project. Risks, costs and profits can be shared between the public and private entities. Such FDI can foster competition but with the host’s influence on ownership control. In particular, PPPs can promote trade in services in sectors where public authorities want to remain in charge of the sector opened to private participation. They have been used as an effective tool to promote private investment in sectors of public interest. When competition is opened to foreign companies, PPPs encourage new trade flows through contracts between public and governmental entities and foreign companies.
2.2. Trade policy in host country affecting exports
Anti-export bias can discourage investment
Although using quantitative restrictions is generally prohibited by WTO Agreements, some export restrictions such as licensing or export permits still exist in countries for some products (OECD, 2003d).
0
1
2
3
4
5
6
7
Goo
ds E
xpor
ts U
S$m
illion
s
1992 1993 1994 1995 1996 1997 1998 1999 2000 2001 2002E
ElectronicsClothingCoffeeBananas and fruitOther
Source: Statistics Canada World Trade Analyser; 2002 OECD Estimate
14
These policies create an anti-export bias that discourages investment, especially export-oriented FDI which is potentially the most beneficial for the host economy.10
Box 6. Banning log exports is unlikely to induce FDI
Timber-producing nations have enacted bans on export of logs arguing that this will expand downstream wood processing, improve the scale efficiency of domestic processing, create jobs, retain more value-added nationally and reduce deforestation.
The evidence has not been good for the industrialisation strategy. Cambodia’s forest product output fell 40% in one year after imposing a log export ban in 1995 and has shrunk since. Bans on log exports at various times in Malaysia have increased wood-based manufacturing but some observers note there has been little evidence that most of these industries are ever going to become internationally competitive, meaning that they constitute a welfare loss. One estimate of the impact of eliminating the Costa Rican log ban, suggests it would be pareto improving and could generate $14 million per year in economic gains.
The domestic value added of sawmilling is frequently negative at world prices in economies with log export bans. Sawmilling $100 of logs locally in Indonesia has been estimated to net $85 of lumber after the expenses of milling. Such will not induce FDI. Either the domestic mills are inefficient behind protectionist barriers and/or they may be cutting species or grades ill-suited for their mills. The latter problem disappears if mills can trade for logs.
Such log bans also lowers the value of standing timber due to the market constraint imposed by the log export ban. There is a pool of pension investment capital well suited for the long term capital appreciation dynamics of owning timberlands. Institutional investment in timberland increased from about $1 billion in 1989 to about $14.4 billion in 2002.a This potential source of FDI will generally view log export bans unfavourably.
Empirical evidence also has not been encouraging for the impact of log export bans on forest conservation. For trade liberalisation to increase resource overexploitation and be damaging to welfare may require that the resources are a common pool subject to open access. As integrated forest management schemes are increasingly strengthened in recognition of the problem of the commons, such a scenario is becoming rarer. At best, a log export ban is a second-best policy tool for reducing deforestation and addressing the associated environmental externalities.
a. Timberland investment management organisations based in the USA currently manage over 18 million acres of land valued at over $14.4 billion, including international holdings (http://research.yale.edu)
Sources : FAO database; Kishor et al, “Economic and Environmental Benefits of Eliminating Log Export Bans - The Case of Costa Rica” The World Economy, Apr 2004; Pearce, Ready for a Change – Crisis and Opportunity in the Coastal Forest Industry, Nov 2001; Ferreira, “Trade Policy and Natural Resource Use: The Case for a Quantitative Restriction”, University College Dublin; Sundaram and Rock, “Resource Exports And Resource Processing For Export In Southeast Asia”, UNU, Tokyo.
Export promotion strategies can help attract investment
Export orientation attracts FDI and FDI contributes to export competitiveness. Costa Rica (Box 5) combined trade facilitation and export promotion to what many acknowledge as a beneficial outcome. Because developing countries can have difficulties launching new exports where they have a comparative advantage, export promotion policies are often proactive. Care is needed to ensure concessions (if any) are not excessive. An appropriate export promotion strategy may need to be “trade neutral” or “bias free” and does not necessarily imply government support measures. Trade neutral policies which remove anti-export bias may be sufficient to attract export-oriented investment.
10 . Some theoreticians argue if the host country is a ‘large’ exporting country which can affect the terms of trade for the product exported, then an export tax can be welfare enhancing. This is largely hypothetical because few countries can influence their exports’ long-term world market prices.

15
Some countries have policies to target export-oriented FDI in sectors with potentially high productivity gains and backward/forward linkages with domestic firms. This strategy could be justified on the grounds of trade theory once scale economies and dynamic gains of trade are accounted for. However:
• Trade policy is generally not regarded as a first best instrument to target investors because it can induce costly trade distortions.
• WTO’s Agreement on Trade-Related Investment Measures (TRIMs) prohibits members from using local content or trade balancing requirements to enforce backward linkages.
• WTO members are also subject to the Agreement on Subsidies and Countervailing Measures (SCM) which prohibits linking subsidies to export requirements.
• Several regional trade and bilateral investment agreements prohibit mandatory export or technology transfer requirements.11
• Empirical evidence on the effectiveness of export and technology transfer requirements is mixed. Several studies have concluded local content requirements can be costly and inefficient in terms of resource allocation and growth (UNCTAD, 2004b).
Export processing zones (EPZs) enable a country to liberalize trade in a limited area and to grant specific advantages to exporting firms (such as tax and administrative regulations). EPZs have been created in many developing countries to attract FDI with mixed results for the host economy.12 Besides EPZs there are other forms of selective liberalization to try to attract foreign investors while continuing to protect domestic producers from foreign competition. Some countries have succeeded by following this type of strategy but others have not.
Exports of services can be particularly beneficial for developing countries
Developing countries have important export potential in services (UNCTAD, 2002). Besides tourism, some developing countries have been particularly successful in sectors such as port and shipping services, audiovisual services, construction services and health services (OECD, 2004a). As exemplified by India’s software industry, computer and related services (Box 7) and other highly-skilled activities can also be of export interest to developing countries. These service exports often build on FDI. Many of the firms in developing countries undertaking work outsourced from developed countries are themselves subsidiaries of developed country companies (OECD, 2004a). The subsidiary can then not only provide services to the parent company but also to other markets.
11 . For instance NAFTA 1106(1) states that host countries can not oblige a company of a partner to export a given level or percentage of goods or services or to transfer technology, a production process or other proprietary knowledge (subject to competition issues).
12 . The competition in incentives can cause a ‘prisoner’s dilemma’ for any individual state. Such has been an argument for a multilateral agreement to limit the proliferation and escalation of location incentives. In addition, local labour legislation may not be fully enforced in the EPZs.

16
Export-oriented FDI in services has increased considerably. While developed countries dominate
services trade overall, developing countries have been particularly successful in some sectors such as audiovisual, port and shipping, construction and health services. They would benefit from considering such strategic sectors in their export promotion policies. A strong domestic market and substantial intra-regional trade helps develop export capacity in services (OECD, 2004a).
Customs procedures and informal export barriers may be burdensome
As noted earlier with regards to imports, efficient customs procedures help a country to offer a business-friendly environment for companies. Export procedures and clearance systems which are not too burdensome facilitate export-orientated projects. In one estimate for Moldova, halving the informal export barriers like cumbersome customs practices, costly regulations and bribes would lift 100,000 to 180,000 individuals out of poverty (World Bank, 2004e). Efficient export procedures (Box 8) are crucial to the success of EPZs.
Box 7. Error! Bookmark not defined.International business service outsourcing to India has created value
India’s $1.5 billion outsourcing business illustrates how foreign investment and trade have benefited the country. Along with IT and software, business-process outsourcing is perhaps the most open sector. In 2002, it attracted 15 percent of total foreign direct investment and accounted for 10 percent of all exports. By 2008, it is expected to attract one-third of all foreign direct investment and to generate $60 billion a year in exports, creating nearly a million new jobs in the process.
Being a liberalized sector combined with some investments by a few key MNEs, the outsourcing industry took off. Pioneers such as British Airways, GE and Citigroup were among the first to move IT and other back-office operations to India (entered 1996, 1997 and 1998 respectively). The success of these companies demonstrated that the country was a credible outsourcing destination. The MNEs trained thousands of local workers, many of whom transferred their skills to Indian companies that began in response. For instance, Tata Consultancy Services, recently went public in India valuing the company at $8.8 billion with $1.2 billion in total revenues (growing at 30% per annum since 1997 and of which more than 90% are exports) and 28,000 employees (growing at 17% p.a.). Now Indian outsourcing firms control over half of the intensely competitive global IT and back-office outsourcing market. Many of the leading ones started as joint ventures or subsidiaries of MNEs or were founded by managers who had worked for them.
Liberalised sectors have grown faster and business process outsourcing has taken off
Source : McKinsey Quarterly, 2004; World Bank 2004c; OECD 2004c
1.7%1.8%
3.2%3.4%
4.1%4.4%
4.9%5.2%
5.8%6.1%
7.7%8.1%
9.0%9.9%
10.1%11.0%
11.8%15.1%
21.1%
0.0% 5.0% 10.0% 15.0% 20.0% 25.0%
Storage
Postal
Railways
Entertainment services
Dwellings
Water transport
Real estate
Construction
Legal services
Air transport
Road transport
Distribution
M edical & health
Education
Hotels & restaurants
Life insurance
Banking
Communication
Business services (IT)
Per annum grow th of selected sectors during the 1990's
Signficantly liberalised sector
Moderately liberalised sector
Non liberalised sector
Source: World Bank 2004c
500
1,000
1,500
1995 1997 1999 2001
Indi
an b
usin
ess-
proc
ess
outs
ourc
ing
(ITES
-BPO
) rev
enue
s (U
S$ m
illion
s)
Source: M cKinsey

17
Box 8. Singapore’s trade & documentation logistics is becoming even more integrated
Exporting using traditional shipping documentation is a complex and lengthy process and can involve as many as 25 different parties and 30-40 different trade documents including bookings, shipping instructions, bills of lading, letters of credit, government permits, etc. One UN study reports up to 60-70% of the data used in one form is re-keyed into another form.
Singapore developed in 1989 the world's first nationwide electronic trade documentation system TradeNet to receive permits from Singapore Customs and other government authorities almost instantaneously. Turnaround time for processing typical trade documents was reduced from 2-4 days to as little as 15 minutes. This system increased efficiency and lowered business costs for the trading community as well as provided benefits to the Customs administrators. In June 2004, a new integrated trade and logistics information and technology platform was announced to centralise all information for shipping in, to and from Singapore. Companies will no longer need to access multiple systems to enter the same or similar information. Singapore anticipates saving potentially US$400 million over 20 years. In addition new logistics value-added services like multi-country consolidation may generate five times that savings in new revenue. Companies operating in Singapore’s export platform should benefit.
Source : OECD, 2003a; Harvard Business CAER Paper 72, April 2000; Singapore IDA Media Portal
The Current Logistics Documentation
manual
electronic
Freight Forwarders
ShippingInstructions 2
LC App
Banks/ Insurance
6
Processing
LC
8
Banks/ Insurance
7Bill of Lading Other Trade Docs
AirwayBill
3a
Carriers
Airport
Booking 4a
4a Booking
Government Permits
Government
5
Booking
4b
Booking 4b
Sea Ports
Shipping Lines
Bill ofLading
3b
Shipper/Seller Purchase Order
Invoice
Overseas
Consignee/Buyer
1
The Future

18
2.3. Trade policy in the home country affecting imports
Market access for developing country products can create new opportunities
Export-oriented domestic and foreign investment in developing countries depends upon market access in developed countries or other countries with large markets. If host country firms face high trade barriers to their main markets, there will be less investment – domestic or foreign into the host country. Even developing countries’ traditional advantages of low labour costs and abundance of natural resources can be negated.
High home country barriers can be detrimental to the home’s own MNE’s integration and global production strategies. That can jeopardise their ability to compete internationally. More generally, any slowdown in the multilateral liberalisation process hinders the opportunities of efficiency-seeking investment.
Box 9. The elimination of MFA quotas could dramatically alter “competitive advantages”
Multi-Fibre Arrangement quotas in the textile and clothing industry illustrate how protectionist policies in industrialised countries affect FDI location in developing countries. Countries with under-utilised quotas have benefited from higher FDI flows and dynamic gains from new activities that otherwise might have been located in more competitive countries. Binding quotas on the most competitive exporters have reduced their welfare gains from specialization and economies of scale. Besides being dependent upon picking ‘winners and losers’, these policies introduced trade distortions that lead to an overall loss for the world economy.
There was also a risk that countries have specialised in sectors where they had no true comparative advantage or sectors with potentially less dynamic gains. The scheduled elimination of quantitative restrictions at the end of 2004 could dramatically alter the economics of textile and clothing production. Many expect that the current international fragmentation between the textile and clothing phases of the supply chain will integrate and the attraction of outward processing programmes will fade. The planning for the post 2004 market has already encouraged a reordering of investment and production plans towards the most competitive and integrated suppliers, especially in China.
Source : OECD 2004d ; World Bank 2002
Two market access policy techniques are worthwhile emphasising: (i) tariff peaks are often used by countries to protect domestic producers from new competitors and tend to be concentrated on products such as13 certain types of tobacco, nuts and fruits, grains, prepared meats and leather & footwear – products that developing countries export or could export (World Bank, 2002); and (ii) tariff escalation occurs when tariffs on processed goods are higher than tariffs on related raw materials. Figure 4 demonstrates tariff escalation for representative wood products, cotton textiles and passenger cars. As value is added, tariffs tend to be higher. Such escalation can threaten the diversification and upgrading of exports in developing countries and discourage export-oriented FDI.
13 . Listing is of products whose tariff rate exceed 50% in any 8-digit subheading in any of USA, EU, Japan or Canada. Many other goods exceed 15% – a frequently-used criterion to identify peaks.

19
0.00.9
2.0
7.70.0
2.45.0
7.2 12.6
2.21.5
4.5
0.0 2.0 4.0 6.0 8.0 10.0 12.0 14.0
Average* MFN percentage tarif f
4403 Wood in the rough
4407 Wood sawn
4408 Veneer/plywood <6mm
4412 Plywood, veneer panels
5201 Cotton not carded or combed
5203 Cotton carded or combed
5205 Cotton yarn
5208/9 Woven cotton
6205 M en's shirt
4011 Pneumatic rubber tires
8407 Engines
8703 Passenger cars
*M ean of USA, EU, Japan & Canada for sub-headings under this HSC heading in 2000
Figure 4. Tariff Escalation: higher tariffs for higher valued products in the same value chain
Source: Data from UNCTAD TRAINS; Secretariat calculations.
Barriers applied to imports entering developing countries are on average higher than in developed countries. They include high tariffs, quantitative restrictions, import controls, import bans, etc. These barriers between developing countries can be particularly damaging. More than half of the additional welfare for developing countries created by removing the remaining post-Uruguay Round trade barriers may come from liberalising trade with other developing countries (i.e. South-South trade) rather than developed countries (i.e. North-South trade).14 Barriers between developing countries reduce intra-regional trade which can prevent the creation of larger markets. This will discourage foreign investors but also discourage even the formation of developing country efficiency-seeking MNEs. Possibly more than one-third of FDI into developing countries comes from other developing countries and such South-South FDI may have grown faster than developed country sources and also have remained relatively more resilient in the post-Asian-crisis period (UNCTAD 2004c).
Trade remedies cause investor concerns
Anti-dumping procedures, safeguards and countervailing measures are trade remedies used to protect an industry threatened or injured by foreign competition. In some cases, they may have an economic value.15 They are legal measures accepted in WTO agreements but can be a major concern for exporters. These measures tend to be assessed against higher valued products and designed to offer relief to industries which are facing increased competition. Hence they can have the effect of preventing developing countries from advancing up the value chain.
Anti-dumping procedures, along with safeguards and countervailing measures, are sometimes described as having a “chill effect” on investment as they introduce uncertainty concerning market access
14 . 57% estimated by Anderson, K., “Agriculture, Developing Countries and the WTO Millennium Round”, CEPR/CIES, December 1999
15. Some argue that such measures are ex ante instruments that allow countries to commit to international agreements they would otherwise be unable to sign without such ‘escape’ clauses.

20
for products exported from host countries. Even the threat of such measures can redirect FDI from a possible host to the home country, a case known as ‘quid pro quo’ investment.16 Investors seek predictability.
Trade preferences may benefit developing countries
Trade preferences encourage investment by giving developing countries better market access. Preferences can influence investor’s choice of location by increasing the profitability of investment in selected countries.
Box 10. African exports under AGOA are increasing, and some evidence of FDI too.*
Imports from Sub-Saharan Africa to the USA have risen dramatically. The price of oil is only part of the reason. Since its inauguration in 2000, the African Growth and Opportunity Act (AGOA) provides duty- and quota- free access into the USA to various exports from selected African countries. US imports under AGOA could exceed $20 billion in 2004, a figure that has grown from under $9 billion in 2002.
While the increased trade is reasonably clear, the link to more FDI entering Africa has been more anecdotal. In their 2004 Comprehensive report, the USTR identified seven example textile/ apparel projects that are in various stages of start-up requiring about $500 million in FDI from various international sources. Also tabled was the $350 million Chad-Cameroon oil pipeline. AGOA has also been identified in the past as a contributor to create 38,000 South African jobs (many in the auto industry). Mauritius did well from textiles and tourism before AGOA was launched, but many of its textile companies are investing in other parts of Africa including a cotton thread factory in Mali. Mauritius also plans a factory to spin yarn, to take advantage of AGOA III.
AGOA III, the latest enactment signed July 2004, extends preferential access for imports until 2015 and allows more third country fabric sources for three years. With the longer time frame, investment may make more sense. With the ability to source fabric from more non-USA sources, losing the cost disadvantage of shipping fabric from the USA may make the African textile/ clothing industry more competitive.
* AGOA is not the only such opportunity for Sub-Saharan Africa. Many developed countries offer preferential treatment including the EU under GSP and Economic Partnership Agreements.
Source : The Economist; AGOA web site, USITC May 2004 Comprehensive Report; OECD (2003b, 2004d)
Sometimes trade preferences may not be effective. As noted with the MFA quota elimination (Box 9) if the preferences do not reinforce a comparative advantage then there is a risk that if these preferences are eroded, the investment will be uncompetitive. Investment will be particularly sensitive to this risk if its payback period exceeds the term of the granted preference.
Rules of origin in relation to preferences and RTAs also affect investment decisions of companies. When they prevent a company from importing inputs from the most efficient countries, rules of origin discourage efficiency-seeking FDI (UNCTAD, 2002). Preferences granted to developing countries may be
16 . Blonigen, B. A. and R.C. Feenstra (1996), “Protectionist Threat and Foreign Direct Investment”, NBER Working Papers No. 5475, March. See also Bhagwati et al, “Quid Pro Quo Investment”, American Economic Review, 82(2), May 1992.
0
5
10
15
20
25
30
AGO
A G
oods
Exp
orts
to U
SA (U
S$b
illio
ns)
1996 1998 2000 2002 2004E
AGOA/GSP
MFN
Source: USITC trade database; OCED
21
-
200
400
600
800
1,000
1,200
1986 1991 1996 2001
Hsin
chu
Reve
nue
& In
vest
men
t (NT
$ bi
llion
s)
Revenue Paid-in-Capital
21%
1990Paid-in-capital NT$43b
FDIDomestic
8%
2003Paid-in-capital NT$992b
FDI Domestic
Source: Hsinchu web site; 1US$=34NT$ as at 19 Aug 2004
undermined by the rules of origin as most products exported from these countries will be excluded from the preferential treatment if they incorporate inputs from third country suppliers (OECD, 2004d).
Access to services markets can be critical
Access to services markets also matters to encourage export-oriented FDI in developing countries. To provide services via mode 1 or 2 and take advantage of outsourcing opportunities, developing countries need market access in sectors where they have a strong potential.
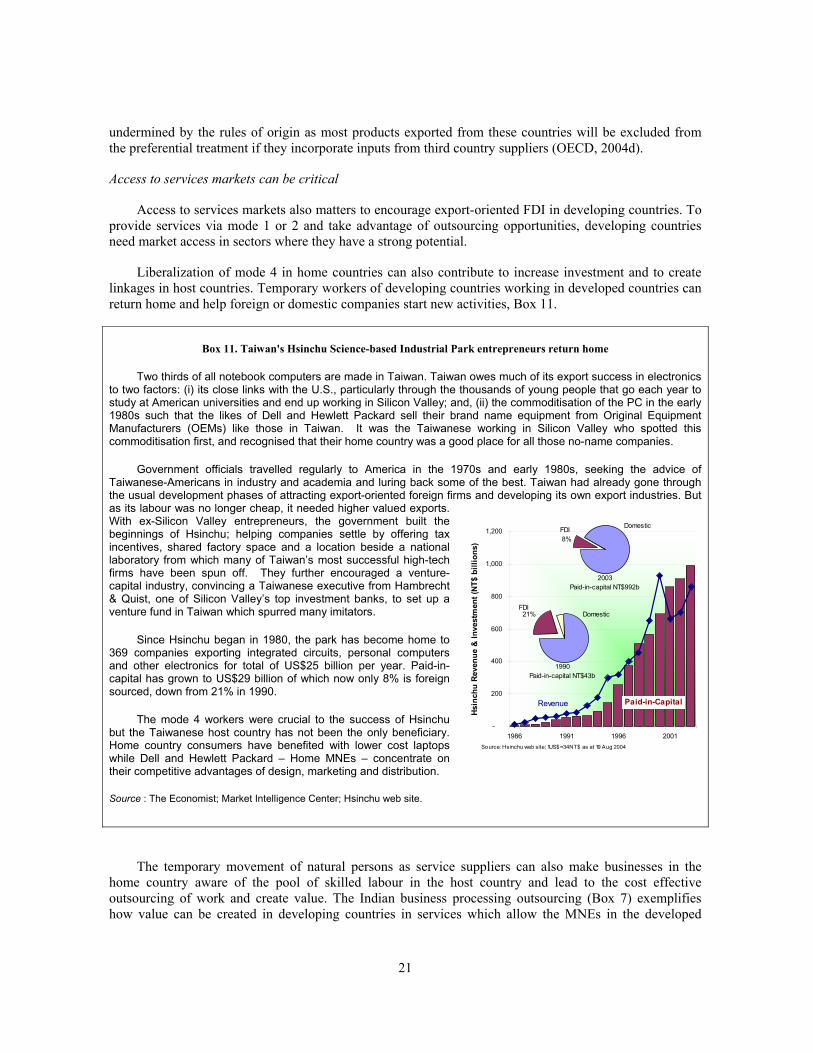
Liberalization of mode 4 in home countries can also contribute to increase investment and to create linkages in host countries. Temporary workers of developing countries working in developed countries can return home and help foreign or domestic companies start new activities, Box 11.
Box 11. Taiwan's Hsinchu Science-based Industrial Park entrepreneurs return home
Two thirds of all notebook computers are made in Taiwan. Taiwan owes much of its export success in electronics to two factors: (i) its close links with the U.S., particularly through the thousands of young people that go each year to study at American universities and end up working in Silicon Valley; and, (ii) the commoditisation of the PC in the early 1980s such that the likes of Dell and Hewlett Packard sell their brand name equipment from Original Equipment Manufacturers (OEMs) like those in Taiwan. It was the Taiwanese working in Silicon Valley who spotted this commoditisation first, and recognised that their home country was a good place for all those no-name companies.
Government officials travelled regularly to America in the 1970s and early 1980s, seeking the advice of Taiwanese-Americans in industry and academia and luring back some of the best. Taiwan had already gone through the usual development phases of attracting export-oriented foreign firms and developing its own export industries. But as its labour was no longer cheap, it needed higher valued exports. With ex-Silicon Valley entrepreneurs, the government built the beginnings of Hsinchu; helping companies settle by offering tax incentives, shared factory space and a location beside a national laboratory from which many of Taiwan’s most successful high-tech firms have been spun off. They further encouraged a venture-capital industry, convincing a Taiwanese executive from Hambrecht & Quist, one of Silicon Valley’s top investment banks, to set up a venture fund in Taiwan which spurred many imitators.
Since Hsinchu began in 1980, the park has become home to 369 companies exporting integrated circuits, personal computers and other electronics for total of US$25 billion per year. Paid-in-capital has grown to US$29 billion of which now only 8% is foreign sourced, down from 21% in 1990.
The mode 4 workers were crucial to the success of Hsinchu but the Taiwanese host country has not been the only beneficiary. Home country consumers have benefited with lower cost laptops while Dell and Hewlett Packard – Home MNEs – concentrate on their competitive advantages of design, marketing and distribution.
Source : The Economist; Market Intelligence Center; Hsinchu web site.
The temporary movement of natural persons as service suppliers can also make businesses in the home country aware of the pool of skilled labour in the host country and lead to the cost effective outsourcing of work and create value. The Indian business processing outsourcing (Box 7) exemplifies how value can be created in developing countries in services which allow the MNEs in the developed

22
countries to become more efficient, globally competitive and assuming their business is competitive, pass the benefit largely to consumers potentially worldwide.
2.4. Trade policies in the home country affecting exports
Home export subsidies may discourage host investment
Export subsidies (as well as domestic supports) in the home country for goods that could otherwise be imported from developing countries discourage export-oriented investment in these countries. Subsidized products sold on third-country markets also harm developing countries producers and reduce incentives for firms to invest in their industries. This may be a rare example where more trade may occur, some may benefit, investment may be redirected, but overall the scenario would be welfare damaging.
Export subsidies on capital goods and intermediate inputs (the latter if there is confidence the subsidies will be ongoing) could lead to investment. Such may improve the return on the investment in the host country. Also, potentially there may be market failures in financing which might be better addressed in the more established credit and securities markets of a home rather than host jurisdiction. If such is the case, then home government export credit, insurance or trade finance may make sense if commercial sources are unavailable. Such a case is becoming rarer if capital markets continue to deepen and broaden in the credit they will finance.
Export controls and restrictions while often required can impede technology transfers to hosts
There are international obligations which require countries to apply export restrictions.17 Some export controls18 are designed to avoid disseminating sensitive technologies that may have repercussions for national and international security. In implementing these controls, balance between security and trade is required to be in line with international obligations. This balance is needed between legitimate security concerns at home and the host countries’ trade interests.
It is also possible that an export control or restriction may induce an investment in a host country that would have otherwise made sense in the home country. This would be the counterpart of “tariff-jumping” FDI in the context of export restrictions rather than import tariffs.19
As capital and trade move more freely, what home governments do with their export policies and how it impacts development in host countries becomes less critical – the host country’s policies tend to be more crucial. Hence it may not be surprising that very little work has been done on the impact of home country trade export policies on investment patterns.
17 . Including for example CITES, Montreal Protocol on the Ozone Layer, Nuclear Non-Proliferation. For an illustrative list of restrictions adhering to such obligations, see Table 3, OECD TD/TC/WP(2003)7/FINAL.
18 Such as the export controls of “dual use” items as recommended by UNSC Resolution 1540 of 28 April 2004.
19 . As an example, in May 1981, the Japanese (home) voluntary export restraint of automobiles into the USA (host) may have induced Honda, Nissan and Toyota to invest in plants in the USA.
23
3. Issues for consideration
Both domestic- and foreign-sourced investment is important for host countries and recent studies stress their complementarity. Generally liberalizing trade policies will encourage FDI and will also encourage domestic investment.
Circumstances change. Trade policy makers may need to adapt and revise government policies as needs and the relative competitive advantages change. Usually it is not the trade policy that defines competitive advantage but rather sets the framework for competitive industries to develop.
Among the main issues with respect to the contribution of trade policy to creating an attractive environment for investment and growth generally, policy makers may consider to what extent their trade policies:
1. restrict the size of potential markets for investors and how domestic reforms and international policy dialogue can create new investment and FDI opportunities by enlarging local/regional markets and giving access to new export markets in third countries;
2. towards imports are discouraging investment by restricting the access of prospective investors (particularly foreign) to intermediate inputs, including services, that are not available locally at the prices and quality required for internationally competitive production;
3. are adding to the costs of customs and administrative procedures that may make them out of line with international norms and unnecessarily discouraging investment;
4. are incoherent or inconsistent that could discourage investors by creating an anti-export bias or introducing distortions between the most efficient modes of supplying goods and services – an import tariff may have a similar effect to an export tax;
5. may curtail developing country exports, reducing the developing country’s ability to purchase imports and ability to source investment including FDI;
6. may curb imports from other countries that may benefit the home country’s consumers including intermediary products used by their own efficiency-seeking MNEs; and
7. deter creation and expansion of their own (home) country’s efficiency-seeking MNEs that may need to become internationally competitive using a foreign host’s competitive advantage but needing at least initial market access in the home jurisdiction.
In many countries, a virtuous circle of trade liberalisation, investment and welfare enhancement has been observed. Liberalizing trade policies can be both an incentive for investment and a catalyst for its positive effects on growth and this is true from the perspective of both the host and home countries. Liberalizing trade is not a panacea but in coherence with other policies, it is integral to both, attract investment and best utilise that investment for growth.
24
BACKGROUND DOCUMENTATION
OECD (2000), The OECD Guidelines for Multinational Enterprises. (Paris: OECD).
OECD (2002a), Foreign Direct Investment for Development. Maximising Benefits, Minimising Costs. (Paris: OECD).
OECD (2002b), “The Relationship between Trade and Foreign Direct Investment: A Survey”, TD/TC/WP(2002)14/FINAL.
OECD (2002c), GATS: The Case for Open Services Markets. (Paris: OECD).
OECD (2003a), “Trade Facilitation Reforms in the Service of Development”, TD/TC/WP(2003)11/FINAL.
OECD (2003b), “Trade Policy, FDI and Development”, TD/TC/WP(2003)27
OECD (2003c), “Analysis of Non-Tariff Measures: The Case of Export Restrictions”, TD/TC/WP(2003)7/FINAL
OECD (2003d), “Quantitative Assessment of the Benefits of Trade Facilitation”, TD/TC/WP(2003)31/FINAL
OECD (2004a), “Services Trade Liberalisation: Identifying Opportunities & Gains”, TD/TC/WP(2003)23/FINAL.
OECD (2004b), “Horizontal Project on Trade and Structural Adjustment: Section I. Challenges in Eight Sectors: The Case of Outsourced Business Process Services”, TD/TC/WP(2004)14.
OECD (2004c), “International Sourcing and Offshoring”, DSTI/ICCP/IE(2004)09.
OECD (2004d), “Structural Adjustment in Textiles and Clothing in the Post-ATC Trading Environment”, TD/TC/WP(2004)23/FINAL
OECD (2004e), “ODA and Investment for Development: What Guidance can be drawn from Investment Climate Scoreboards”, DAFFE/IME/WD(2004)12
UNCTAD (2001), World Investment Report 2001: Promoting Linkages (New York and Geneva: United Nations).
UNCTAD (2002), World Investment Report 2002: Transnational Corporations and Export Competitiveness (New York and Geneva: United Nations).
UNCTAD (2003), World Investment Report 2003: FDI Policies for Development: National and International Perspectives. (New York and Geneva: United Nations).

25
UNCTAD (2004a), “Transnational Corporations: Are incentives a good investment for the host country? An empirical evaluation of the Czech National Incentive Scheme.” UNCTAD/ITE/IIT/2004/3.
UNCTAD (2004b), Foreign Direct Investment and Performance Requirements. (New York and Geneva: United Nations).
UNCTAD (2004c), World Investment Report 2004: The Shift towards Services. (New York and Geneva: United Nations).
World Bank (1998), Privatization and Emerging Equity Markets, Flemings and The World Bank
World Bank (2000), Trade Blocs, Oxford University Press.
World Bank (2002a), Global Economic Prospects and the Developing Countries - 2002, The World Bank.
World Bank (2002b), “An Assessment of Telecommunications Reform in Developing Countries”, Working paper, The World Bank.
World Bank (2003a), Global Development Finance 2003 – Striving for Stability in Development Finance, The World Bank.
World Bank (2003b), Global Economic Prospects and the Developing Countries - 2003, The World Bank.
World Bank (2004a), “Trade Facilitation: Using WTO Disciplines to Promote Development”, Trade Note May 10, 2004, The World Bank.
World Bank (2004b), Doing Business in 2004, The World Bank.
World Bank (2004c), Sustaining India’s Services Revolution, The World Bank.
World Bank (2004d), Reforming Infrastructure, The World Bank.
World Bank (2004e), “Informal Export Barriers and Poverty”, Working paper June 2004, The World Bank
World Trade Organisation (1997), “The Relationship between Trade and Foreign Direct Investment”, Note by the Secretariat, Working Group on the Relationship between Trade and Investment, WT/WGTI/W/7 www.wto.org
World Trade Organisation (2002), “Key Issues Concerning Foreign Direct Investment and the Transfer and Diffusion of Technology to Developing Countries”, Note by the Secretariat, Working Group on the Relationship between Trade and Investment, WT/WGTI/W/136 www.wto.org
World Trade Organisation (2004), World Trade Report 2004, http://www.wto.org/
26
ANNEX A: FRAMEWORK CONSIDERATIONS FOR MEASURING THE EFFECTIVENESS OF TRADE POLICIES AND ‘GOOD PRACTICES’
A.I. Foreword
The Policy Framework for Investment is to be a non-prescriptive, flexible, operational and practical guide for policymakers. The body of this paper identifies and explores specific trade policies and their impact on investment and growth. This annex is a possible framework for a flexible, operational guide to trade policy making.20
Box 12 introduces the underlying participants of a project and reiterates the importance of trade policy. The next section provides a trade policy framework addressing appropriate tools and measures. The final section focuses on the role of governments in trade policy and how some of the examples discussed in the text may illustrate ‘good practices’.
20. By focusing on trade policies, this document does not attempt to address general good policy-making practices like having clearly defined objectives, measures against objectives, and participant buy-in as will be found cited in for instance the World Bank’s Poverty Reduction Strategy Papers (PRSPs).

27
Box 12. The confluence of an entrepreneur with a FDI opportunity will involve trade
OpportunityEntrepreneurTalent
Investment Suppliers
Employees/Subcontractors
Equity:FDIDomestic
Debt:ForeignDomestic
Foreign
Domestic
Government/CitizensOf Host Country
OffersOpportunity
EconomicRent
Receipt ofgoods/ services
ReasonableexpedientpaymentInvestment funds
Reasonable returnfor risk undertaken
Domestic
Product Markets
Foreign
Sale ofGood/ Service
Reasonableexpedientpayment
OpportunityEntrepreneurTalent OpportunityEntrepreneurTalent
Investment Suppliers
Employees/Subcontractors
Equity:FDIDomestic
Debt:ForeignDomestic
Foreign
Domestic
Government/CitizensOf Host Country
OffersOpportunity
EconomicRent
Receipt ofgoods/ services
ReasonableexpedientpaymentInvestment funds
Reasonable returnfor risk undertaken
Domestic
Product Markets
Foreign
Sale ofGood/ Service
Reasonableexpedientpayment
Sale ofGood/ Service
Reasonableexpedientpayment
A project is the confluence of an opportunity (be it a market, resource, efficiency, or M&A opportunity) and entrepreneurial talent. The “knowledge-capital MNE model” recognises that MNEs transfer entrepreneurial talent rather than financial resources. But entrepreneurial talent is not necessarily supplied solely by the foreigner or a domestic participant, it can arise from a joint venture or franchise whereby the talent is supplied by both domestic and foreign participants; as for example the entrepreneurs of Taiwan’s Hsinchu Park (Box 11).
With very few exceptions, a project will require investment capital. The entrepreneur must promote the opportunity to the financiers and choose the most cost effective instruments offered so as to minimize the cost of capital for the project. The entrepreneur must market the merits of the project – minimizing the perceived risk. Not only may the project’s viability and initiation depend upon that ‘selling’ but also the return to the entrepreneur / opportunity.1
The entrepreneur will ‘sell’ the merits of the project using a business plan. All business plans must – and usually it is the first item – describe the product market. For a FDI-financed project today, that product market will be international with rare exceptions.2 Therefore trade is involved and a liberal trade policy is likely to be essential for the project to be viable.
The project will typically require supplies of raw materials, goods and services usually during all phases of the project (building, start-up and operating). For FDI-financed projects, some supplies must be foreign except for the rare occasion.3 Therefore again trade is involved and a liberal trade policy is once again integral for the project.
Notes:
1. Note that the host government’s interests and the entrepreneur’s can be largely considered the same. Negotiation between the two can frequently assume a positive-sum game. This was one of the lessons of Costa Rica (Box 5). There will be negotiation to split the economic rent from the entrepreneur’s reasonable return but that should be secondary to the value that can be achieved through a successful project.
2. The product market will be international recognising the arguments in the text of this paper. Resource-seeking FDI and the ever more present efficiency-seeking FDI both by definition involve international product markets. Only market-seeking FDI may be focused solely on domestic product markets but more frequently now, scale economics require serving a regional trade area, i.e. international product markets.
3. For efficiency-seeking or market-seeking FDI, this international component/product supply is self-evident. For resource-seeking FDI, some foreign-source equipment is likely to give the foreign company the credibility to do the project otherwise investors will question what advantage the foreign company brings to the project. Note that these considerations taken with those in Note 2 above imply that almost every FDI-financed project must have some trade-related aspect.
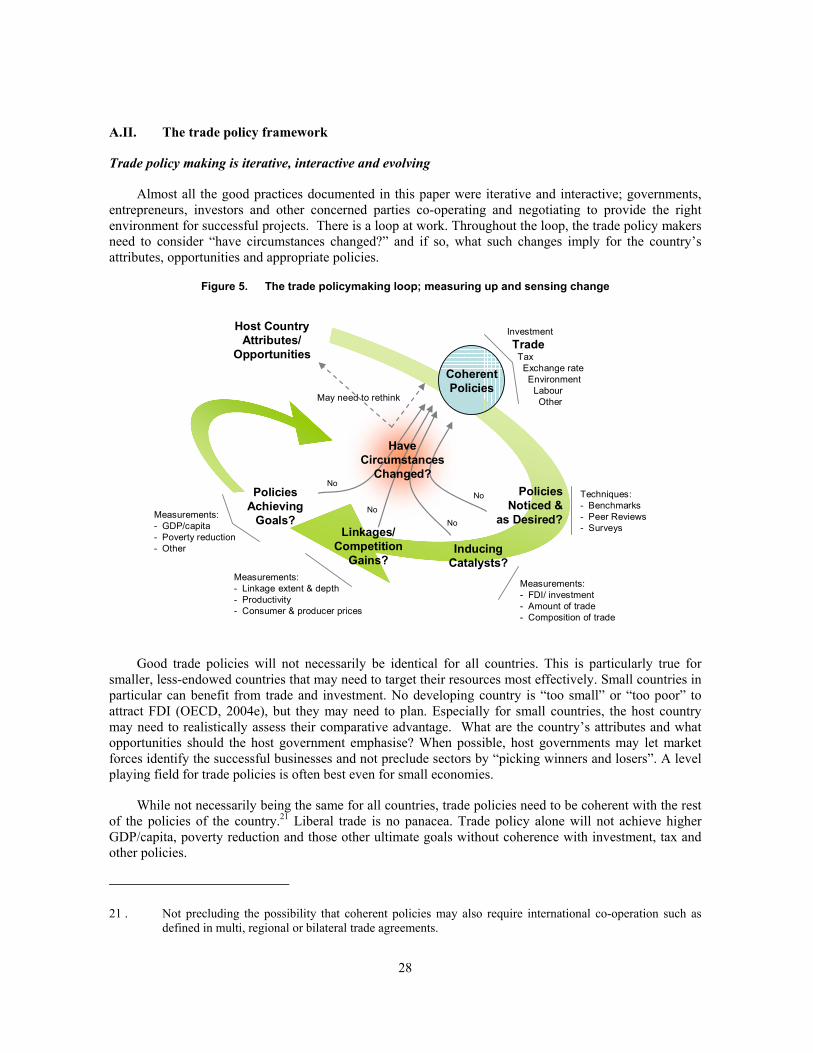
28
A.II. The trade policy framework
Trade policy making is iterative, interactive and evolving
Almost all the good practices documented in this paper were iterative and interactive; governments, entrepreneurs, investors and other concerned parties co-operating and negotiating to provide the right environment for successful projects. There is a loop at work. Throughout the loop, the trade policy makers need to consider “have circumstances changed?” and if so, what such changes imply for the country’s attributes, opportunities and appropriate policies.
Figure 5. The trade policymaking loop; measuring up and sensing change
Measurements:- FDI/ investment- Amount of trade- Composition of trade
InvestmentTrade
TaxExchange rateEnvironment
LabourOther
PoliciesNoticed &
as Desired?
CoherentPolicies
Techniques:- Benchmarks- Peer Reviews- Surveys
Host Country Attributes/
Opportunities
InducingCatalysts?
Linkages/Competition
Gains?Measurements:- Linkage extent & depth- Productivity- Consumer & producer prices
PoliciesAchieving
Goals?Measurements:- GDP/capita- Poverty reduction- Other
May need to rethink
HaveCircumstances
Changed?
No
No
No
No
Good trade policies will not necessarily be identical for all countries. This is particularly true for smaller, less-endowed countries that may need to target their resources most effectively. Small countries in particular can benefit from trade and investment. No developing country is “too small” or “too poor” to attract FDI (OECD, 2004e), but they may need to plan. Especially for small countries, the host country may need to realistically assess their comparative advantage. What are the country’s attributes and what opportunities should the host government emphasise? When possible, host governments may let market forces identify the successful businesses and not preclude sectors by “picking winners and losers”. A level playing field for trade policies is often best even for small economies.
While not necessarily being the same for all countries, trade policies need to be coherent with the rest of the policies of the country.21 Liberal trade is no panacea. Trade policy alone will not achieve higher GDP/capita, poverty reduction and those other ultimate goals without coherence with investment, tax and other policies.
21 . Not precluding the possibility that coherent policies may also require international co-operation such as defined in multi, regional or bilateral trade agreements.

29
Nonetheless there are some interim steps and measurements that can guide trade policy makers in assessing whether the economy is moving toward those ultimate goals. Are the trade policies: (i) getting noticed and will the reactions to those policies attract investment, trade and growth?; (ii) inducing the catalysts, in particular those entrepreneurs and financiers referred to in the prior section to invest in the economy?, and; (iii) contributing to growth in the domestic economy through linkages and a more competitive atmosphere? These are interim considerations, each having their own measurements, but often interlinked. Inducing potential catalysts may depend upon sourcing those domestic suppliers and competitively priced component parts. The following three sections focus on these interim steps.
Are the trade policies getting noticed and appreciated?
To be effective, trade policy reforms need to be seen. Small countries in particular may have to be proactive to get noticed. There are three techniques whereby trade policy makers can get noticed and at the same time make sure that the message is the one they want.
Trade policy reforms will influence benchmarks
Annex B lists twelve benchmark indices that are influenced by trade policy.22 Such ratings are used comparatively across countries as well as over time to reflect improving or deteriorating investment conditions, of which one contributor will be trade policy. An improving and comparatively good relative index would assist a country to attract domestic and foreign investment. They have been used by entrepreneurs in business plans to reassure investors. An improvement and comparison in these measures can also tell trade policy makers if a country’s efforts to improve policy are working.
Frequently the benchmark indices will use proprietary statistical techniques. Also qualitative judgment is sometimes used as in the case of Standard & Poor’s sovereign ratings. Hence it is commonly impossible to be definitive on how trade policies eventually flow into the rating score. This underscores the importance of trade policy makers being proactive and marketing their country’s attributes and policies to the rating agencies themselves.
22 . This listing was created by inspecting the internet descriptions of fifteen indices analysing the environment for doing business identified by the World Bank (2004b), adding one about to be introduced and two investment-related indices. Of those, the twelve that explicitly refer to trade policy are listed in Annex B. The other six indices are also likely to be influenced by trade policy.

30
Box 13. An Illustration: How trade policy affects the Economic Freedom of the World index
As an example of how trade policy impacts such indices, the Fraser Institute’s Economic Freedom of the World index includes five “Freedom to Trade Internationally” measures (one of 5 areas scored):
Converted to a score of 0 to 10 with Measure 0 if 10 if
1) Taxes on International Trade a) Revenue from taxes on internal trade as a percentage of exports
plus imports No taxes Taxes ≥ 15% of total trade
b) Mean tariff rate No tariffs Average ≥ 50% c) Standard deviation (SD) of tariff rates Uniform tariffs SD ≥ 25%
2) Regulatory trade barriers a) Hidden import barriers Uses GCR* b) Costs of importing including tariffs, license fees, bank fees, and
time required for administrative red tape of importing equipment using GCR*
Cost ≤ 10% of equipment cost Cost ≥ 50%
3) Actual trade compared to expected using regression. Actual trade twice predicted
Actual trade half predicted
4) Official versus black-market exchange rates No black market Black market ≥ 50% premium to official
5) International capital market controls a) Access of citizens to foreign capital and foreign access to domestic
capital markets Uses a survey within the GCR*
b) Restrictions on engaging in capital market exchange with foreigners
Uses the IMF report on 13 types of capital controls.
* GCR: Global Competitiveness Report Source : www.freetheworld.com
Some of these benchmarks have been statistically analysed by the OECD and provide mixed but potentially useful predictions of inward FDI. Overall indices themselves may predict poorly but the sub-indices – in particular the indicators of regulatory quality and restrictiveness, government intervention, macroeconomic stability and technological advancement – correlate more closely with FDI inflows (OECD, 2004e). Hence trade policy which in some cases impacts these sub-indices more may be more influential in attracting FDI than implied by trade policy’s effect on the overall index itself.
The benchmarks tend to explain different economic characteristics and differ in the level of generalisation (OECD, 2004e). It is also probable within the set of benchmarks provided in Annex B, that some benchmarks are more sensitive to the type of investment instrument and circumstance. Noteworthy, the rating agencies are particularly influential for large projects involving “investment-grade” debt financing but probably less influential in more risky circumstances. Hence, countries may need to focus on different benchmarks depending upon their particular circumstance and the type of projects they are trying to attract.
For the practical aspects of a trade policymaker, they may wish to track the benchmark scores of particular interest over time and relative to their neighbouring countries in terms of geography and income. They may also consider defining which policy changes could make the most impact for the least effort. These could often be simplifications to regulations (World Bank, 2004b). They may also wish to contact the agency or group responsible for the index to discuss the particulars of their circumstance. This is a two-way communication – the policy maker may understand what drives the rating (and investors) at the same time the agency understands how motivated the country is to modify and improve the trade and investment environment. It can be a virtuous circle.
Most benchmark indices overlook the importance of services trade. Noticeably absent in the Freedom to Trade Internationally is any measure of the restrictiveness for trade in the service sectors, particularly
31
for the banking and telecommunications sectors. As such, trade policy makers (also rating agencies and investors) may seek other indices being developed, including those in the OECD Trade Directorate.23
Peer reviews can guide effective policy making
Peer review is a process whereby the quality and efficiency of a country’s policies, laws, regulations, processes and institutions are examined and assessed vis-à-vis those of their peers, in a non-adversarial context. Effectiveness of peer reviews derives from the influence of the peers during the process: (i) mix of recommendations and dialogue with the peer countries; (ii) public scrutiny, comparisons, and ranking among countries; and (iii) the impact of the above on domestic public opinion, national administrations and policy makers. The ultimate goal of peer reviews is to help or encourage the reviewed country to: improve its policy making; adopt best practices; and comply with established standards and principles.24
The most directly applicable peer review for trade policy is the WTO’s Trade Policy Review Mechanism. Peer reviews carried out by other international organisations which cover elements of trade policy include: OECD EDRC Economic Surveys; APEC Individual Action Plan (IAP); IMF Country Surveillance Mechanism; IMF/ World Bank Financial Sector Assessment Program (FSAP), and; the UNCTAD Investment Policy Reviews.
Surveying businesses can give insights
Several benchmarks above assess policies in part by surveying businesses. Trade policy makers may also survey businesses and other parties themselves. APEC surveyed 461 firms in 21 countries (Figure 6):25
• Trade impediments were consistently considered higher in developing countries (vis-à-vis developed countries) except for foreign investment regulations – 26% of the respondents of developing versus 32% of developed-country firms identified foreign investment regulations as a serious or very serious trade impediment;
• Developing country firms (vis-à-vis developed) were impacted visibly more by customs procedures, the impediments to mobility of business people, quantitative restrictions and restrictive business practices.
• The highest scoring impediment for developed country firms was restrictive administrative regulations.
23. Description of the OECD banking and telecommunications restrictiveness indices can be found at TD/TC/WP(2004)32/REV1
24. For a paper considering the practical options for implementing a peer review mechanism, see OECD, “Practical Modalities of Peer Review in a Multilateral Framework on Competition”, CCNM/GF/COMP/TR(2003)10.
25. A limitation of this survey was that responses from foreign affiliates (if any) were not separated from domestic companies. Also, it was not explicitly asked whether the impediments were caused by the host or home countries although some impediments may be considered self-evident.
Another useful source of European business attitudes to international investment rules (some with trade policy implications) was published in 2000, http://europa.eu.int/comm/trade/issues/sectoral/invesment/index_en.htm

32
Figure 6. Trade impediments considered serious or very serious
Tariffs
Govt p
rocu
remen
t
Restric
tive A
dmin
Regula
tions
Restric
tive B
usine
ss Prac
tices
Quanti
tative
Res
trictio
ns
Custom
s Pro
cedu
res
Impe
dingB
usine
ssPeo
pleMobi.
..
Anti-du
mping M
easu
res
Foreign
Inve
stmen
t Reg
ulatio
ns
Differin
g Pro
duct
Stand
ards
59%
43%
59% 59%
53%
69%
43%
33%26%
45%48%
34%
49%
37%
27%
39%
20% 19%
32%31%
0%
10%
20%
30%
40%
50%
60%
70%
Perc
ent o
f res
pond
ents
DevelopedDeveloping
Source : APEC Business Facilitation Survey; Sept 2000
Are the trade policies inducing the potential catalysts?
Surveying businesses can lead to insights. It hopefully can also lead to those entrepreneurs that can bring together the elements for successful projects. Success in inducing catalysts will increase two key statistics: the inflow of FDI and trade. As explained in Section 1 of the main text, sometimes FDI can lead to current account deficits. Hence the composition of the imports can also be important. If the imports are capital items that will earn a return rather than simply be consumed, then the trade policy maker and the benchmark rating agencies may be less concerned.
Some trade policy reforms have negligible costs; others are suited to cost-benefit analysis
Some trade policy reforms need not be fiscally costly. Applying uniform tariffs (as per Chile, Box 2), can be fiscally neutral. Listening attentively (as per Costa Rica, Box 5) is cheap and yet a host government may find infrastructure opportunities beneficial to both MNEs and themselves. For Costa Rica, some improvements such as the increased frequency of international air carriers benefited more than just Intel. Also some of the infrastructure improvements were jointly-financed by Intel and the Costa Rican government to the benefit of both Intel and the residents of Costa Rica.
But if concessions are given or expenses are incurred for trade facilitation or trade promotion, then care is appropriate. One tool available to the trade policy maker is a traditional cost-benefit analysis. As an example of the potential difficulties, estimates of expanding the Czech investment & trade promotion suggest that the social price may exceed $40,000 per job created (UNCTAD, 2004a).
Are we getting the backward linkages and competition gains?
There are two concepts when measuring the effectiveness of linkages (UNCTAD, 2001). For measuring the extent of linkages, three measures (or variations thereof) have been studied: a simple count

33
of the number of domestic firms that supply a foreign affiliate; the value of local contracts supplied; and, the share of value-added by local suppliers to the total value added by the foreign affiliates. All three measures rise as linkages to foreign affiliates to domestic firms increase. If they do not, then the host government may need to be proactively strengthening these links as was the aim of Ireland’s National Linkage program (Box 1).
Measuring the depth of linkages is more complex. Good linkages should increase supplier productivity, improve quality, intensify the amount of technology used and shift the supplier to higher-value products. To attribute any improvement in these measures to linkages rather than say technology advances is difficult. Surveys of foreign affiliates and their suppliers may give some insight. These may identify a further education or technology strategy that the host government may need such as Costa Rica’s trade promotion and facilitation co-ordination with Intel (Box 5). Listening to the entrepreneurs in India and Taiwan (Box 7 and 11 respectively) identified productivity gains.
Another factor in assessing whether the economy is achieving the competitiveness gains of liberalisation is to measure consumer and producer prices (over time and relative to neighbouring countries). Lower relative prices can indicate improving competitiveness for local industries – since local industries also consume – as well as being beneficial to final consumers in the economy. Increased consumer surplus can be a general benefit of the trade induced by the foreign investment.
A.III. The governments play an essential role
The host government (typically acting on behalf of the citizens) offers the opportunity for which they would receive benefits in the form of taxes (income, resource or other). The entrepreneur needs fair compensation but to the extent that there is excessive profit (economic rent), conceptually a good practice would pass these excessive returns to the host government / citizens. It is easier said than done.
In an ideal world, policies and agreements between the host government, entrepreneurs and others, are well defined and determined preferably before major expenses are incurred by the entrepreneur. Few dispute a host’s right to regulate, but many consider it inappropriate to change the rules or have conflicting rules. This requires a balanced assessment.
Just the perception of policy uncertainty can be detrimental. Uncertainty will increase the return on investment required by investors if not cancel the investment altogether. Policy – including trade policy – uncertainty can be a major concern in developing countries, Figure 7.
Figure 7. Policy uncertainty matters
Concerns identified by firms operating in developing countries
Source : World Bank; WDR 2005 (forthcoming)
Regulation11%
Corruption11%
Infra-structure
8%
Tax23%
Uncertain policies
33%
Courts3%
Skills3%
Crime3%Finance
5%
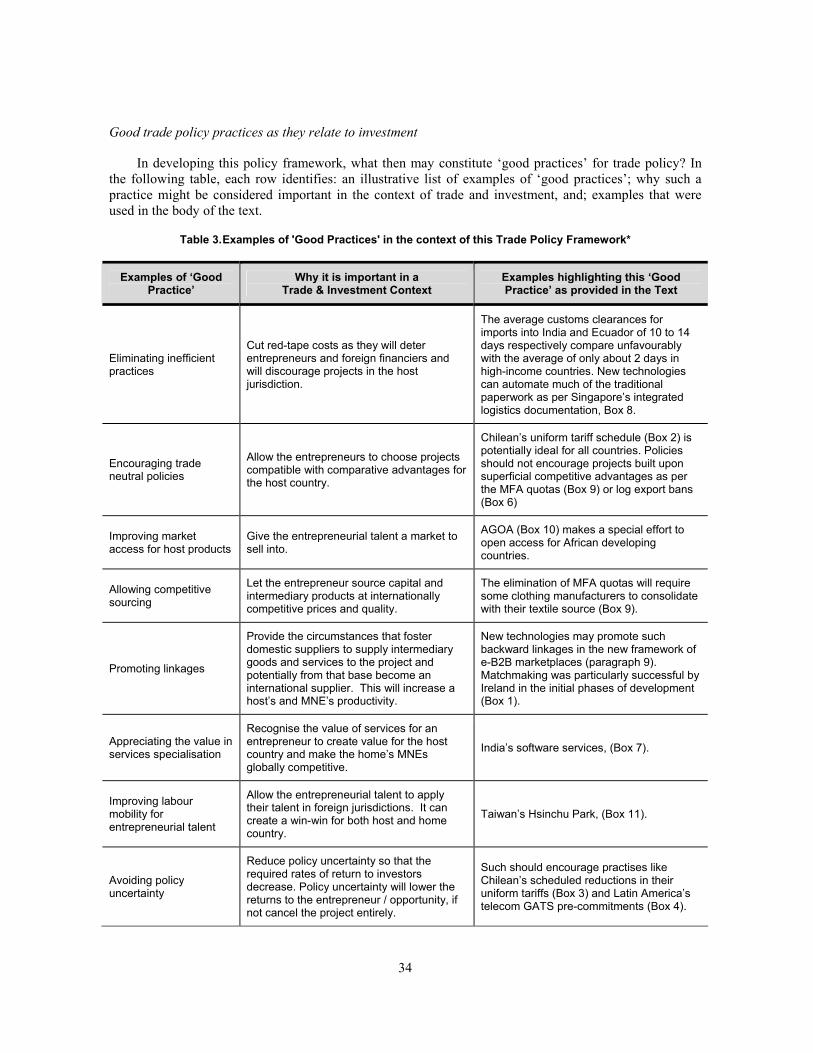
34
Good trade policy practices as they relate to investment
In developing this policy framework, what then may constitute ‘good practices’ for trade policy? In the following table, each row identifies: an illustrative list of examples of ‘good practices’; why such a practice might be considered important in the context of trade and investment, and; examples that were used in the body of the text.
Table 3. Examples of 'Good Practices' in the context of this Trade Policy Framework*
Examples of ‘Good Practice’
Why it is important in a Trade & Investment Context
Examples highlighting this ‘Good Practice’ as provided in the Text
Eliminating inefficient practices
Cut red-tape costs as they will deter entrepreneurs and foreign financiers and will discourage projects in the host jurisdiction.
The average customs clearances for imports into India and Ecuador of 10 to 14 days respectively compare unfavourably with the average of only about 2 days in high-income countries. New technologies can automate much of the traditional paperwork as per Singapore’s integrated logistics documentation, Box 8.
Encouraging trade neutral policies
Allow the entrepreneurs to choose projects compatible with comparative advantages for the host country.
Chilean’s uniform tariff schedule (Box 2) is potentially ideal for all countries. Policies should not encourage projects built upon superficial competitive advantages as per the MFA quotas (Box 9) or log export bans (Box 6)
Improving market access for host products
Give the entrepreneurial talent a market to sell into.
AGOA (Box 10) makes a special effort to open access for African developing countries.
Allowing competitive sourcing
Let the entrepreneur source capital and intermediary products at internationally competitive prices and quality.
The elimination of MFA quotas will require some clothing manufacturers to consolidate with their textile source (Box 9).
Promoting linkages
Provide the circumstances that foster domestic suppliers to supply intermediary goods and services to the project and potentially from that base become an international supplier. This will increase a host’s and MNE’s productivity.
New technologies may promote such backward linkages in the new framework of e-B2B marketplaces (paragraph 9). Matchmaking was particularly successful by Ireland in the initial phases of development (Box 1).
Appreciating the value in services specialisation
Recognise the value of services for an entrepreneur to create value for the host country and make the home’s MNEs globally competitive.
India’s software services, (Box 7).
Improving labour mobility for entrepreneurial talent
Allow the entrepreneurial talent to apply their talent in foreign jurisdictions. It can create a win-win for both host and home country.
Taiwan’s Hsinchu Park, (Box 11).
Avoiding policy uncertainty
Reduce policy uncertainty so that the required rates of return to investors decrease. Policy uncertainty will lower the returns to the entrepreneur / opportunity, if not cancel the project entirely.
Such should encourage practises like Chilean’s scheduled reductions in their uniform tariffs (Box 3) and Latin America’s telecom GATS pre-commitments (Box 4).
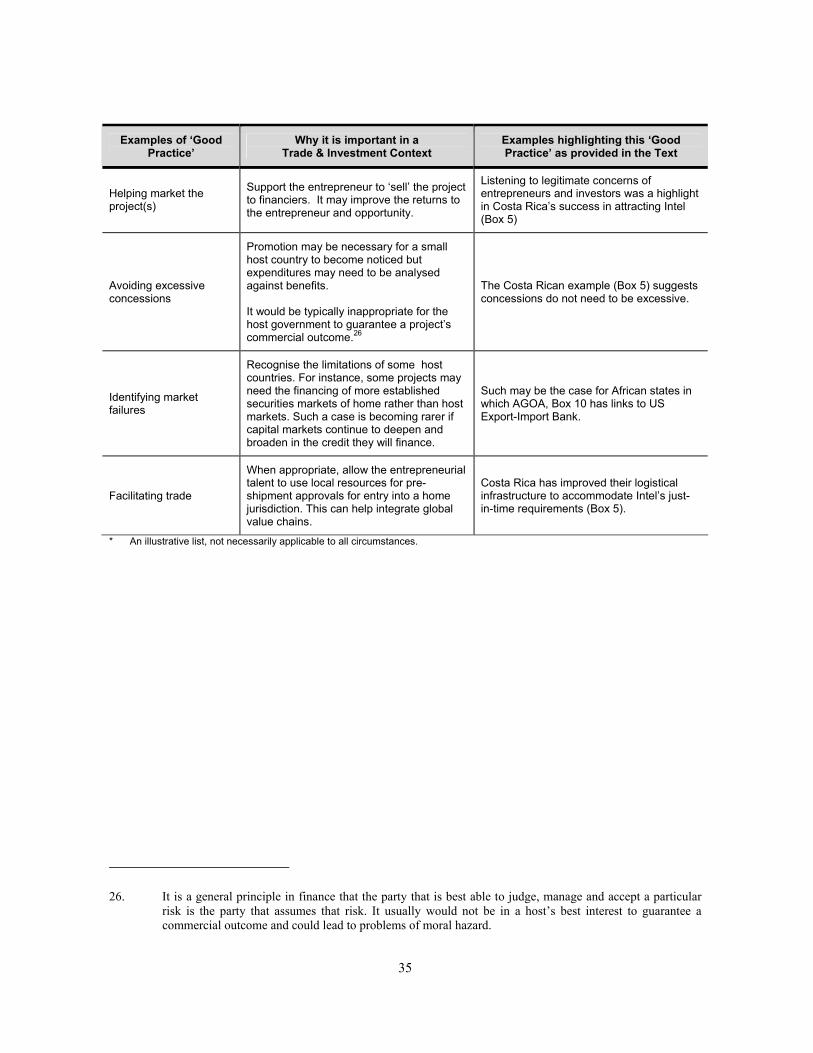
35
Examples of ‘Good Practice’
Why it is important in a Trade & Investment Context
Examples highlighting this ‘Good Practice’ as provided in the Text
Helping market the project(s)
Support the entrepreneur to ‘sell’ the project to financiers. It may improve the returns to the entrepreneur and opportunity.
Listening to legitimate concerns of entrepreneurs and investors was a highlight in Costa Rica’s success in attracting Intel (Box 5)
Avoiding excessive concessions
Promotion may be necessary for a small host country to become noticed but expenditures may need to be analysed against benefits. It would be typically inappropriate for the host government to guarantee a project’s commercial outcome.26
The Costa Rican example (Box 5) suggests concessions do not need to be excessive.
Identifying market failures
Recognise the limitations of some host countries. For instance, some projects may need the financing of more established securities markets of home rather than host markets. Such a case is becoming rarer if capital markets continue to deepen and broaden in the credit they will finance.
Such may be the case for African states in which AGOA, Box 10 has links to US Export-Import Bank.
Facilitating trade
When appropriate, allow the entrepreneurial talent to use local resources for pre-shipment approvals for entry into a home jurisdiction. This can help integrate global value chains.
Costa Rica has improved their logistical infrastructure to accommodate Intel’s just-in-time requirements (Box 5).
* An illustrative list, not necessarily applicable to all circumstances.
26. It is a general principle in finance that the party that is best able to judge, manage and accept a particular risk is the party that assumes that risk. It usually would not be in a host’s best interest to guarantee a commercial outcome and could lead to problems of moral hazard.

36
ANNEX B: BENCHMARK INDICES FOR EVALUATING TRADE POLICY Table 4. Benchmark indices which explicitly mention ‘trade policy’ in their web description
Index Source Measurement for Trade Policy Implication to the Index
World Competitiveness Yearbook
Institute for Management Development; www.imd.ch
Competitiveness of 49 countries using hard data and perception surveys.
Besides various measures of trade (gross, balance, % of GDP), several trade policy measures are found in business survey questions including whether: customs' authorities help facilitate the efficient transit of goods; protectionism affects business conduct; immigration laws prevent businesses from employing foreign labour; cross-border transactions are freely negotiated with foreign partners; and, foreign investors can acquire control in domestic companies.
Global Competitiveness Report
World Economic Forum; www.weforum.org
Competitiveness of 80 countries using hard data and perception surveys.
This index has several aspects of trade policy which contribute to an overall score. One of the more interesting aspects is the ‘technology technology transfer-in-trade’ subindex. The technique varies depending upon whether the country has a core competence or not. Countries with a higher technology-based export sector are deemed to have a greater propensity to absorb technologies from abroad. Regression is used to make this estimate.
Index of Economic Freedom Heritage Foundation & Wall St Journal; www.heritage.org
Assessment by in-house experts drawing on many sources for 161 countries.
The index measures how well countries score on a list of 50 independent variables divided into 10 broad factors of economic freedom. One such factor is “trade policy”.
Economic Freedom of the World
Fraser Institute; www.freetheworld.com
Assessment by in-house experts drawing on many sources for 123 countries.
See Box 13 in Annex A.
Country Risk Service The Economist Intelligence Unit; www.eiu.com
Investment risk ratings for 100 countries
The business rankings model examines ten separate categories of which one is “foreign trade and exchange controls” using a 1 (very bad for business) to 5 (very good). In that category, there are four sub-questions. Two involve capital account items. Two involve clear trade policy issues: (i) Tariff & not tariff protection use average tariff levels ( 1 average tariff > 20%; 5 average tariff < 5% with an adjustment to the score of “at least 1 point if licensing and import inspection is significant”); and (ii) actual trade as a % of GDP versus expected by regression ( 1 actual < 0.6 expected; 5 actual > 1.5 expected).
Business Environment and Enterprise Performance
EBRD & World Bank; www.info.worldbank.org/governance/beeps2002
Government effectiveness, regulatory quality, rule of law, and corruption in 27 transition economies.
The regulation quality index combines three aspects with equal weights. One of them is customs and trade regulations.
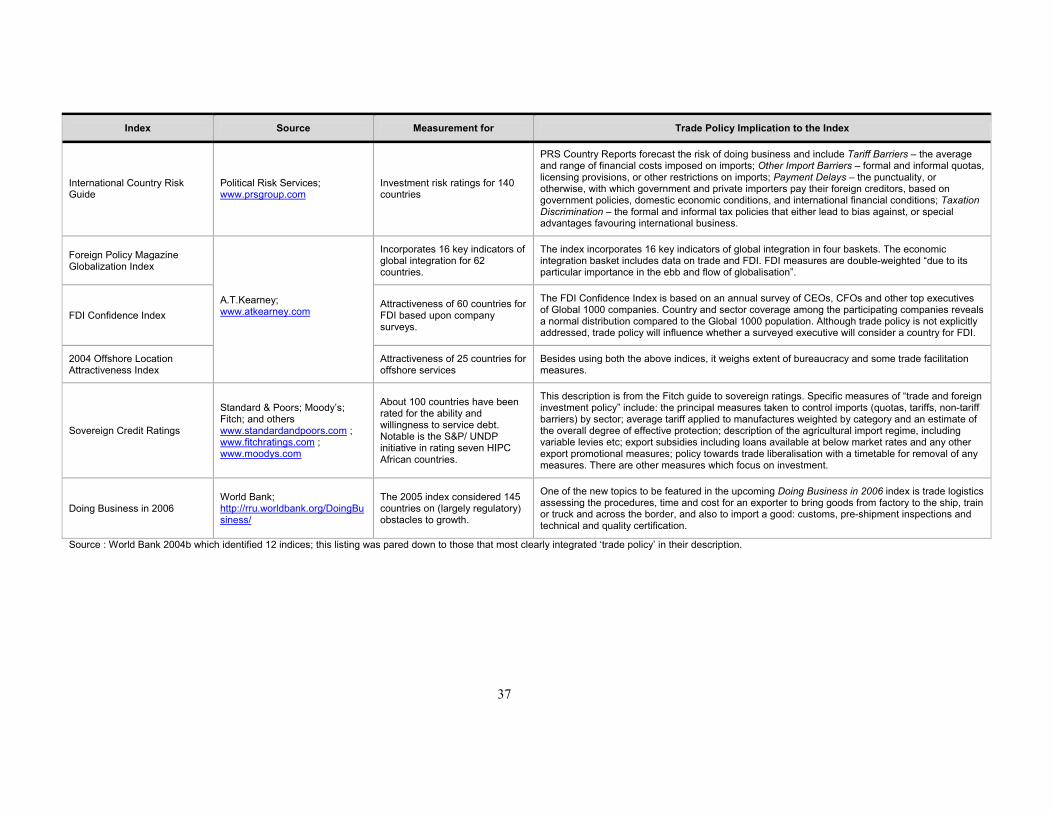
37
Index Source Measurement for Trade Policy Implication to the Index
International Country Risk Guide
Political Risk Services; www.prsgroup.com
Investment risk ratings for 140 countries
PRS Country Reports forecast the risk of doing business and include Tariff Barriers – the average and range of financial costs imposed on imports; Other Import Barriers – formal and informal quotas, licensing provisions, or other restrictions on imports; Payment Delays – the punctuality, or otherwise, with which government and private importers pay their foreign creditors, based on government policies, domestic economic conditions, and international financial conditions; Taxation Discrimination – the formal and informal tax policies that either lead to bias against, or special advantages favouring international business.
Foreign Policy Magazine Globalization Index
Incorporates 16 key indicators of global integration for 62 countries.
The index incorporates 16 key indicators of global integration in four baskets. The economic integration basket includes data on trade and FDI. FDI measures are double-weighted “due to its particular importance in the ebb and flow of globalisation”.
FDI Confidence Index Attractiveness of 60 countries for FDI based upon company surveys.
The FDI Confidence Index is based on an annual survey of CEOs, CFOs and other top executives of Global 1000 companies. Country and sector coverage among the participating companies reveals a normal distribution compared to the Global 1000 population. Although trade policy is not explicitly addressed, trade policy will influence whether a surveyed executive will consider a country for FDI.
2004 Offshore Location Attractiveness Index
A.T.Kearney; www.atkearney.com
Attractiveness of 25 countries for offshore services
Besides using both the above indices, it weighs extent of bureaucracy and some trade facilitation measures.
Sovereign Credit Ratings
Standard & Poors; Moody’s; Fitch; and others www.standardandpoors.com ; www.fitchratings.com ; www.moodys.com
About 100 countries have been rated for the ability and willingness to service debt. Notable is the S&P/ UNDP initiative in rating seven HIPC African countries.
This description is from the Fitch guide to sovereign ratings. Specific measures of “trade and foreign investment policy” include: the principal measures taken to control imports (quotas, tariffs, non-tariff barriers) by sector; average tariff applied to manufactures weighted by category and an estimate of the overall degree of effective protection; description of the agricultural import regime, including variable levies etc; export subsidies including loans available at below market rates and any other export promotional measures; policy towards trade liberalisation with a timetable for removal of any measures. There are other measures which focus on investment.
Doing Business in 2006 World Bank; http://rru.worldbank.org/DoingBusiness/
The 2005 index considered 145 countries on (largely regulatory) obstacles to growth.
One of the new topics to be featured in the upcoming Doing Business in 2006 index is trade logistics assessing the procedures, time and cost for an exporter to bring goods from factory to the ship, train or truck and across the border, and also to import a good: customs, pre-shipment inspections and technical and quality certification.
Source : World Bank 2004b which identified 12 indices; this listing was pared down to those that most clearly integrated ‘trade policy’ in their description.