a practical approach to bus rapid transit (or is it road rapid transit…?) cliff henke nabi usa...
TRANSCRIPT
A Practical Approach to Bus Rapid Transit
(or is it Road Rapid Transit…?)
Cliff Henke
NABI USA Sales and Marketing
2
Vision Statements
BRT must be a logical solution between conventional bus service and rail rapid transit.
BRT should not compete with existing modes in a zero-sum, either/or game.
BRT is not ‘low-ball’ LRT.
3
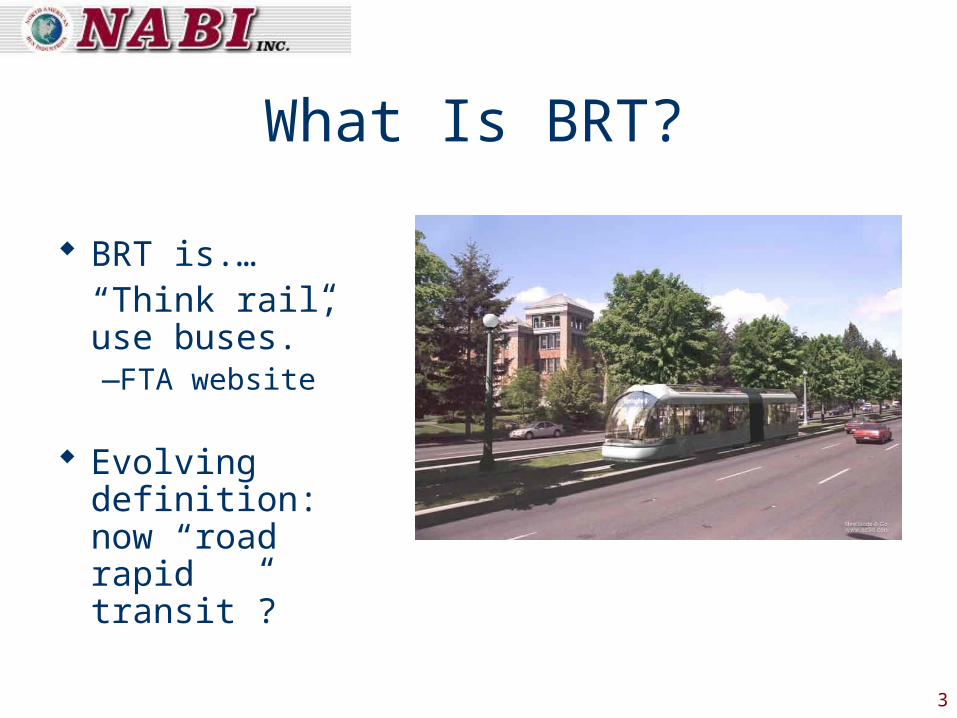
What Is BRT?
BRT is.…“Think rail, use buses.”—FTA website
Evolving definition: now “road rapid transit”?
4
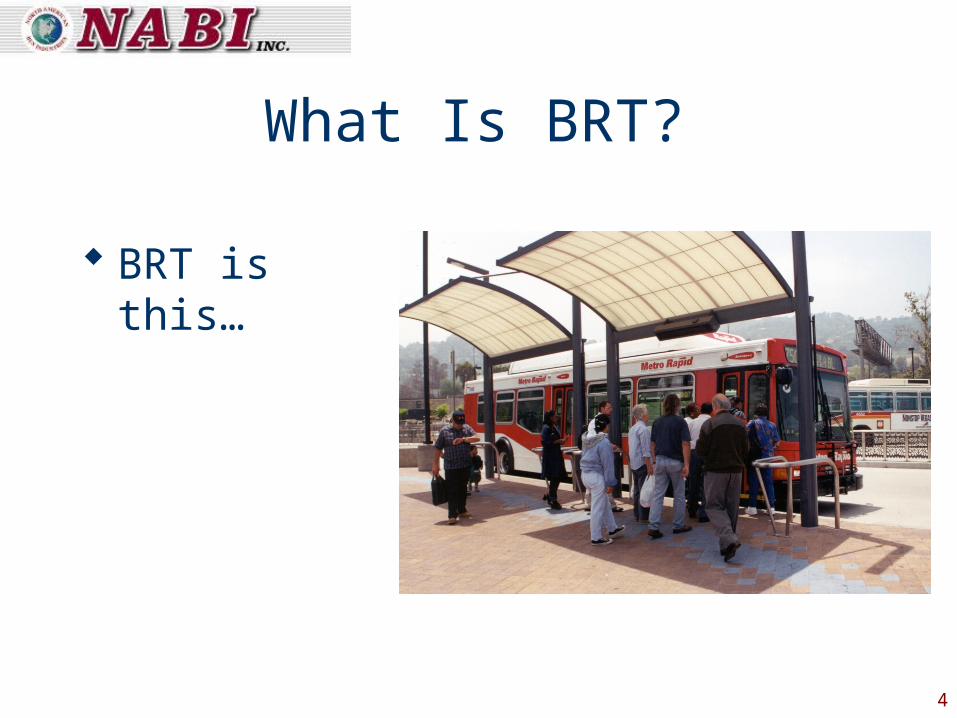
What Is BRT?
BRT is this…
5
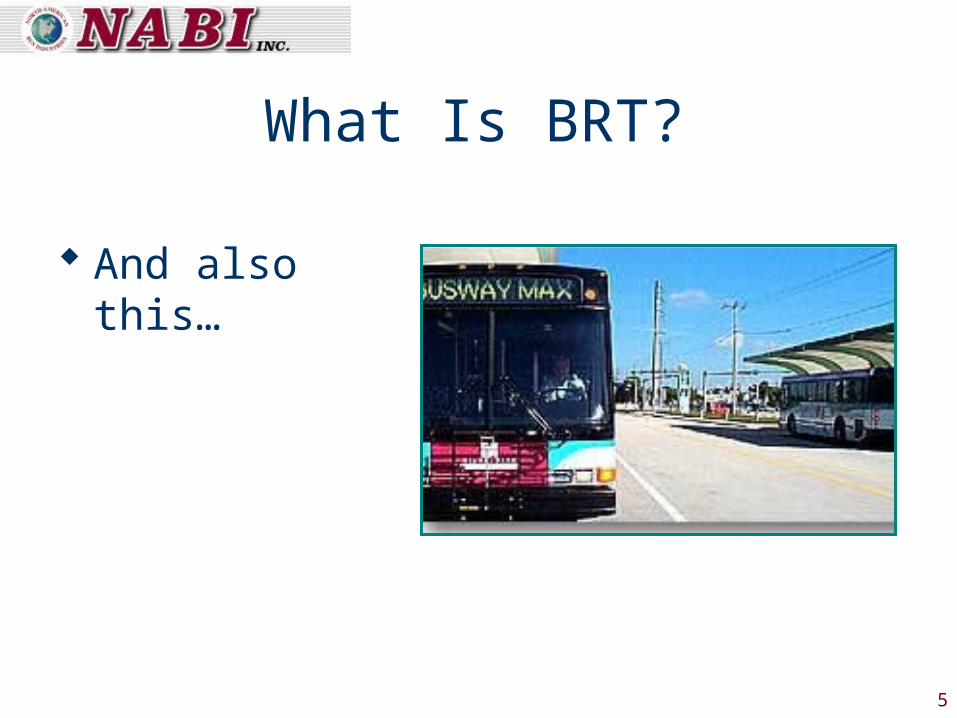
What Is BRT?
And also this…
6
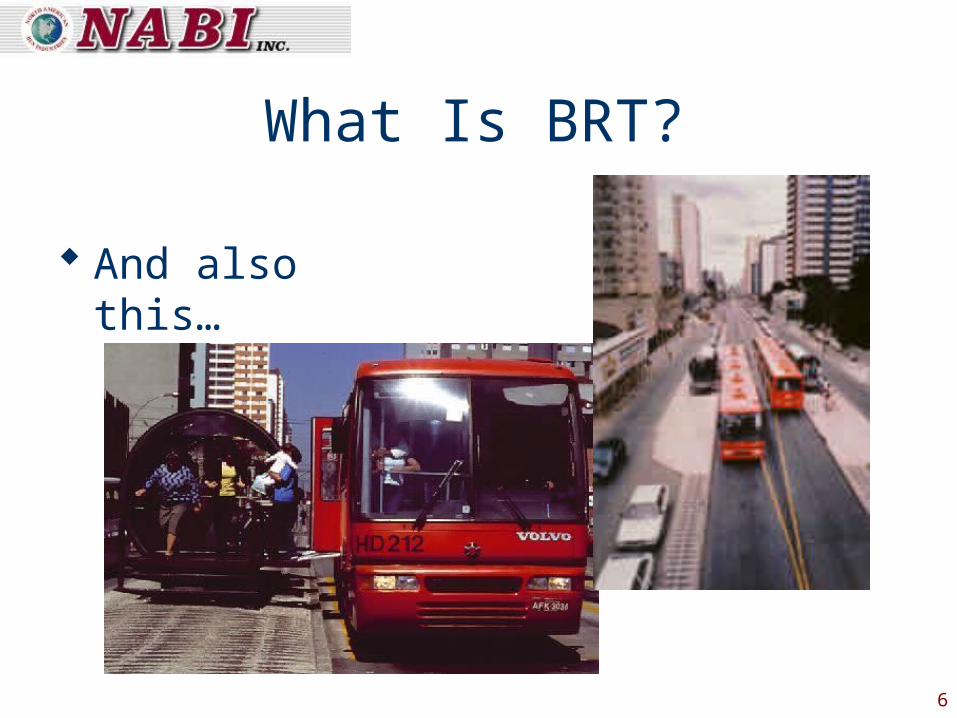
What Is BRT?
And also this…
7
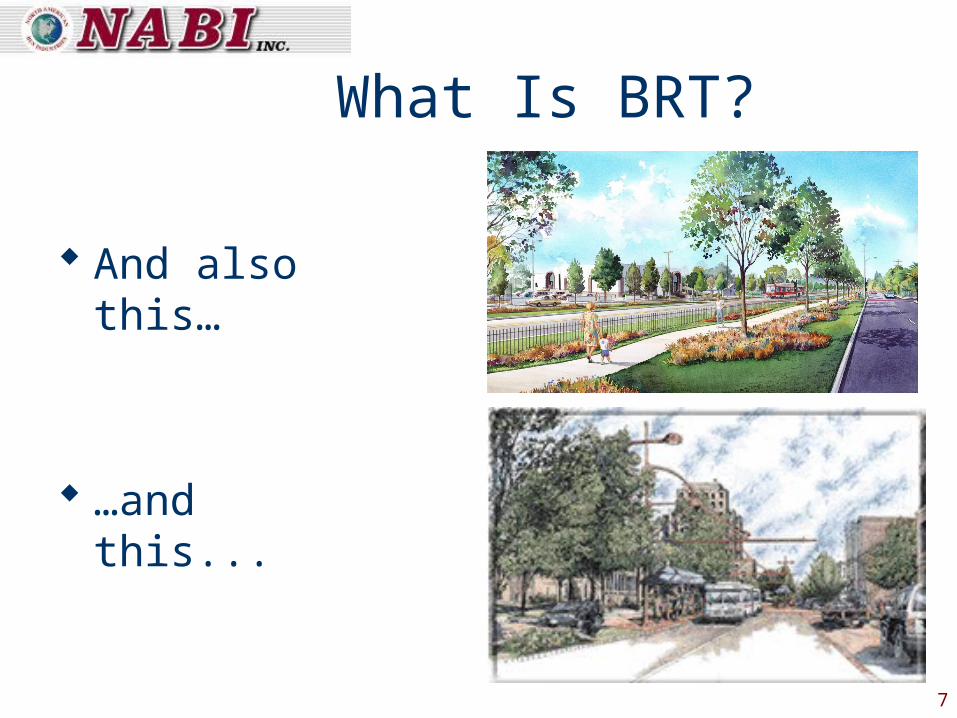
What Is BRT?
And also this…
…and this...
8
What Is BRT?
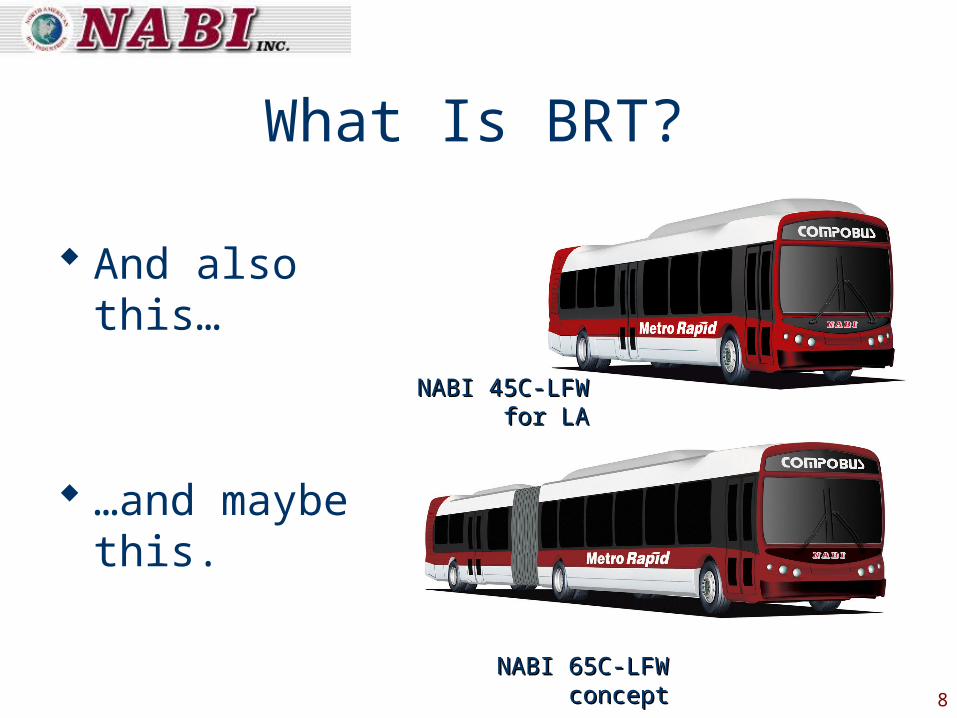
And also this…
…and maybe this.
NABI 45C-LFW NABI 45C-LFW for LAfor LA
NABI 65C-LFW conceptNABI 65C-LFW concept
9
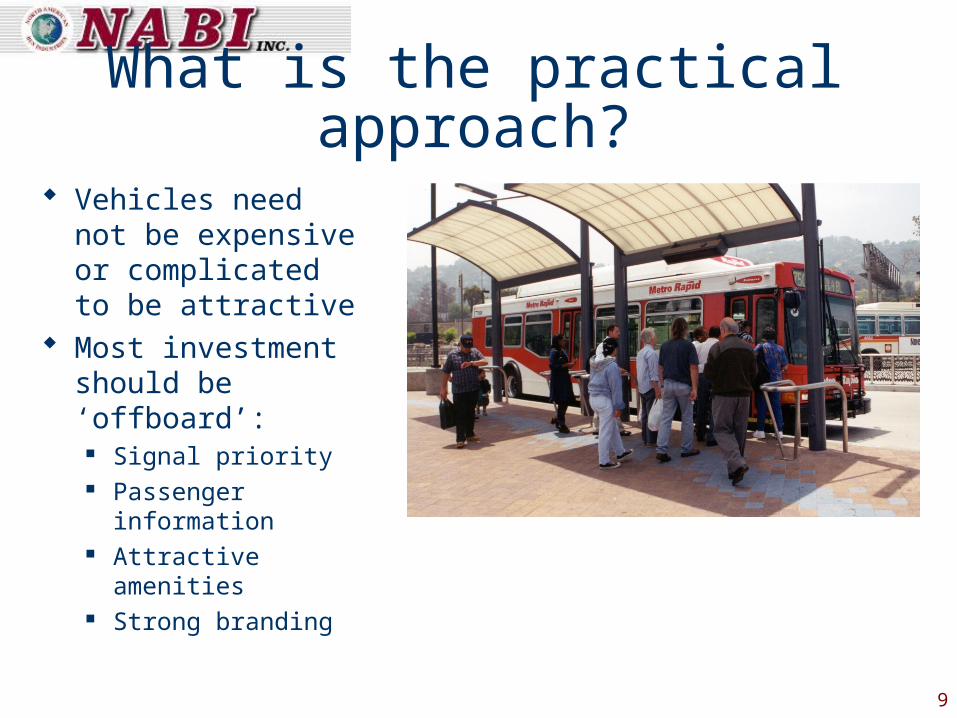
What is the practical approach?
Vehicles need not be expensive or complicated to be attractive
Most investment should be ‘offboard’:
Signal priority Passenger
information Attractive amenities Strong branding
10
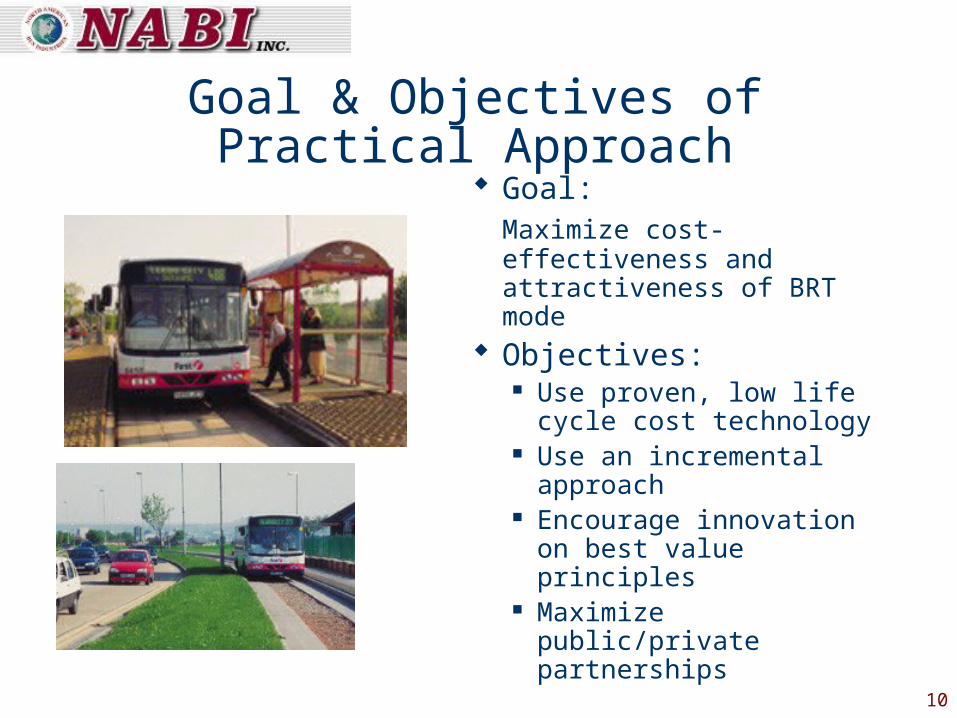
Goal & Objectives of Practical Approach Goal:
Maximize cost-effectiveness and attractiveness of BRT mode
Objectives: Use proven, low life cycle
cost technology Use an incremental
approach Encourage innovation on
best value principles Maximize public/private
partnerships
11
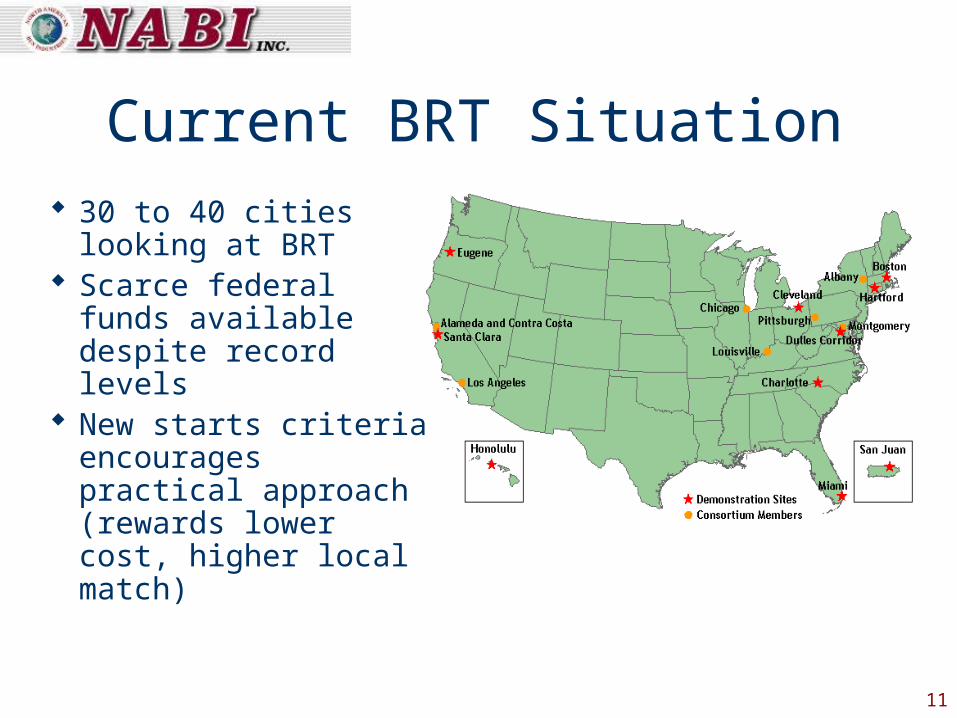
Current BRT Situation
30 to 40 cities looking at BRT
Scarce federal funds available despite record levels
New starts criteria encourages practical approach (rewards lower cost, higher local match)
12
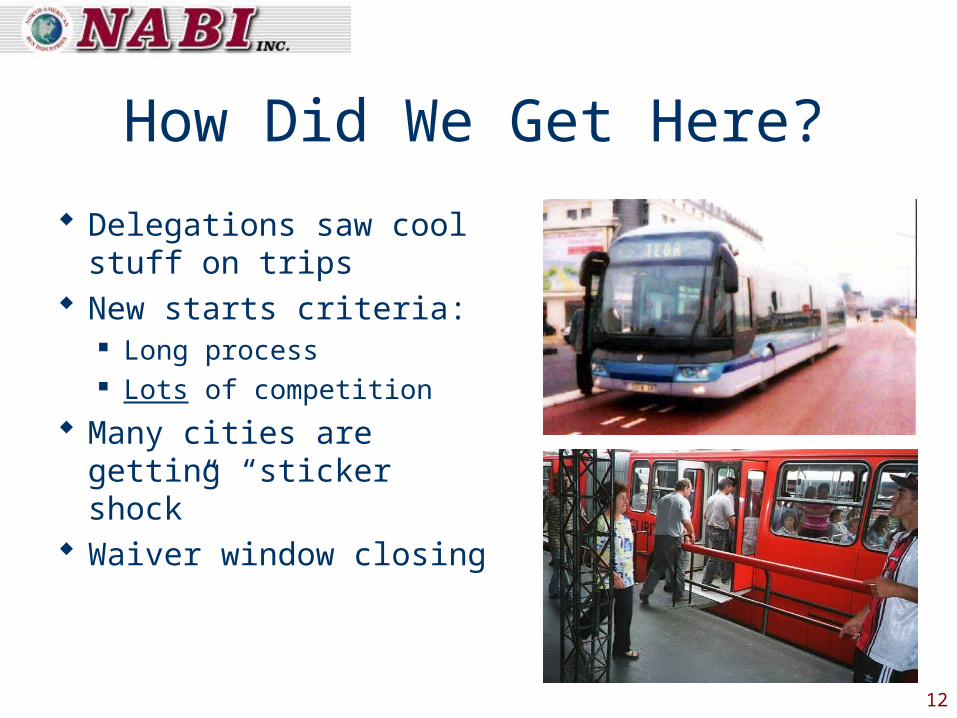
How Did We Get Here?
Delegations saw cool stuff on trips
New starts criteria: Long process Lots of competition
Many cities are getting “sticker shock”
Waiver window closing
13
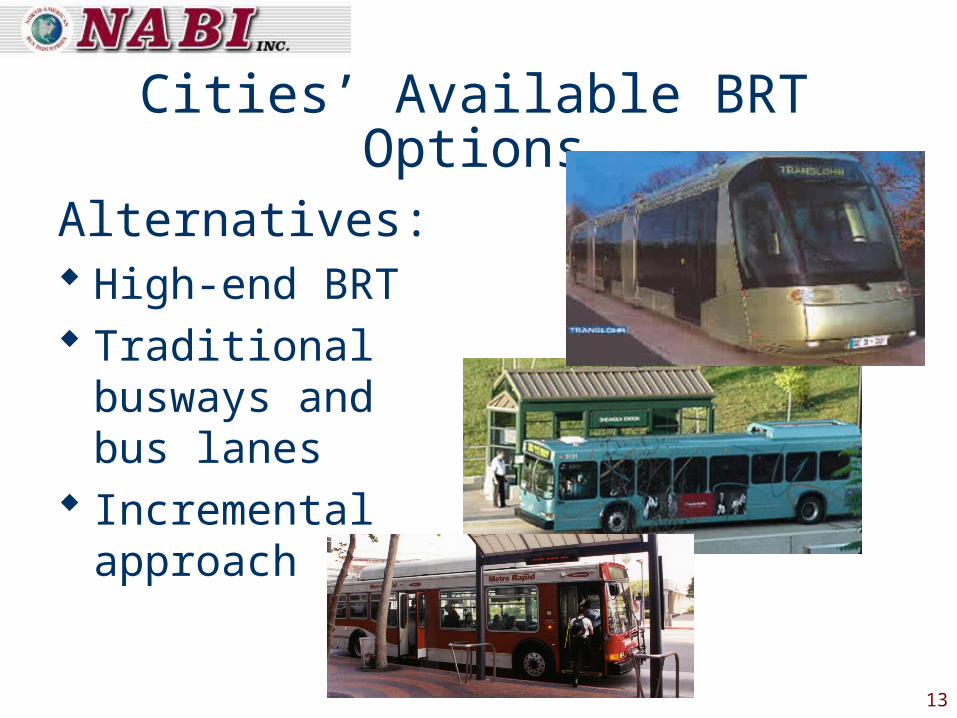
Cities’ Available BRT Options
Alternatives: High-end BRT Traditional busways
and bus lanes Incremental
approach
14
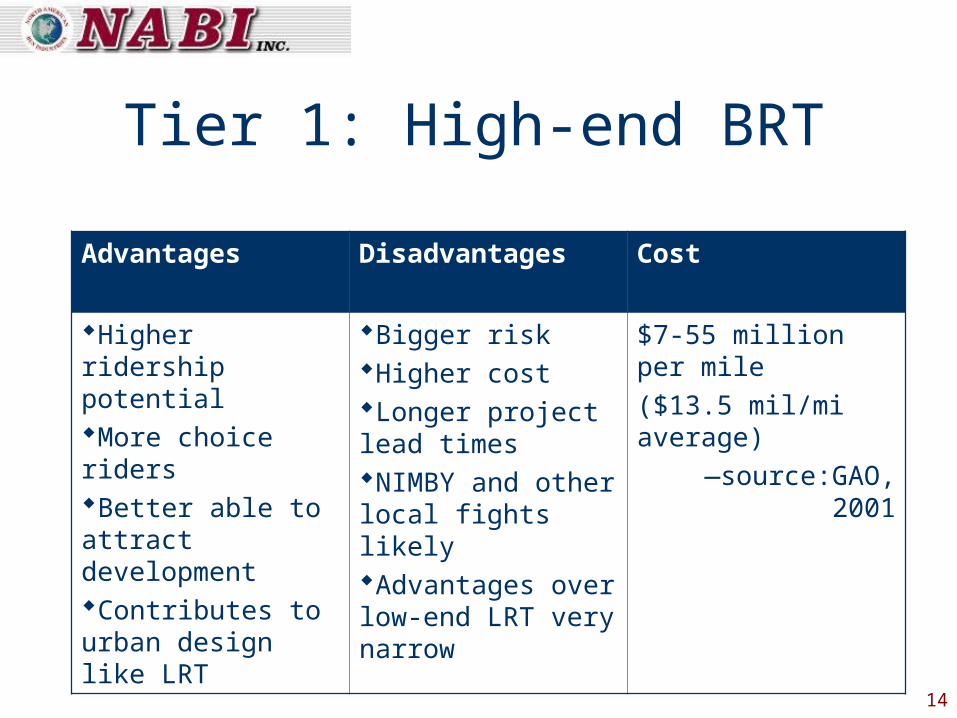
Tier 1: High-end BRT
Advantages Disadvantages Cost
Higher ridership potentialMore choice ridersBetter able to attract developmentContributes to urban design like LRT
Bigger riskHigher costLonger project lead timesNIMBY and other local fights likelyAdvantages over low-end LRT very narrow
$7-55 million per mile
($13.5 mil/mi average)
—source:GAO, 2001
15
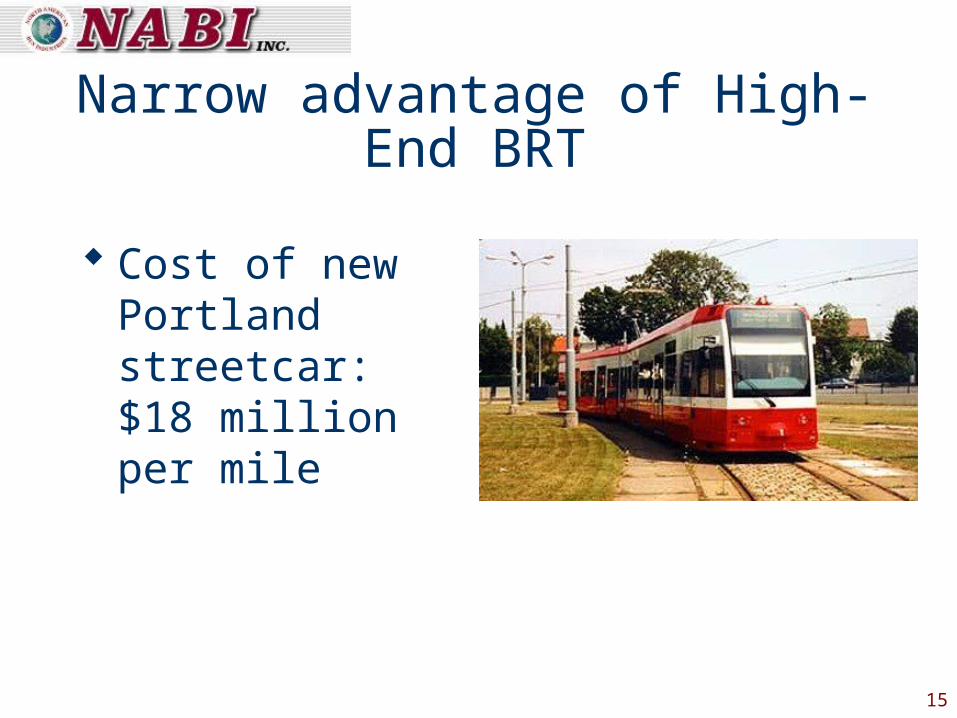
Narrow advantage of High-End BRT
Cost of new Portland streetcar: $18 million per mile
16
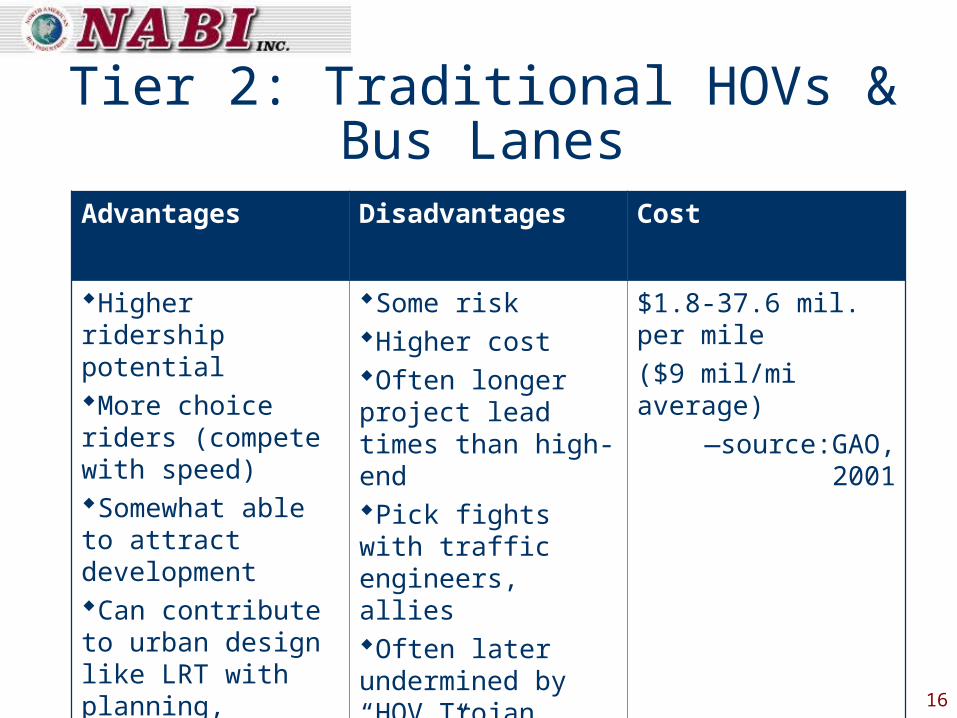
Tier 2: Traditional HOVs & Bus Lanes
Advantages Disadvantages Cost
Higher ridership potentialMore choice riders (compete with speed)Somewhat able to attract developmentCan contribute to urban design like LRT with planning, outreachLower vehicle cost
Some riskHigher costOften longer project lead times than high-endPick fights with traffic engineers, alliesOften later undermined by “HOV Trojan horse”
$1.8-37.6 mil. per mile
($9 mil/mi average)
—source:GAO, 2001
17
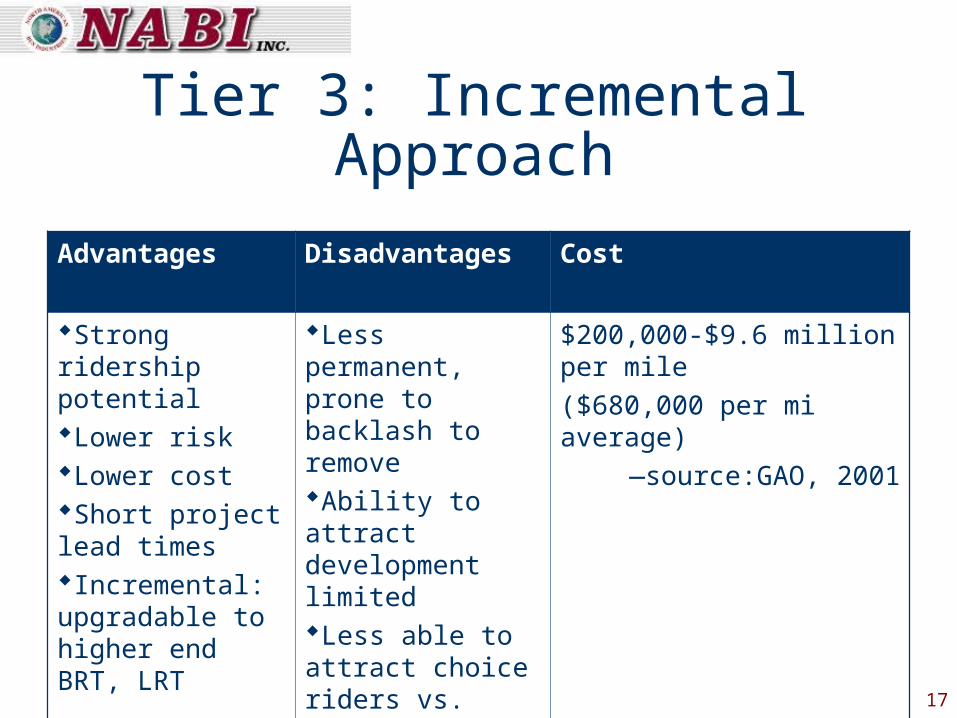
Tier 3: Incremental Approach
Advantages Disadvantages Cost
Strong ridership potentialLower riskLower costShort project lead timesIncremental: upgradable to higher end BRT, LRT
Less permanent, prone to backlash to removeAbility to attract development limitedLess able to attract choice riders vs. conventional bus
$200,000-$9.6 million per mile
($680,000 per mi average)
—source:GAO, 2001
18
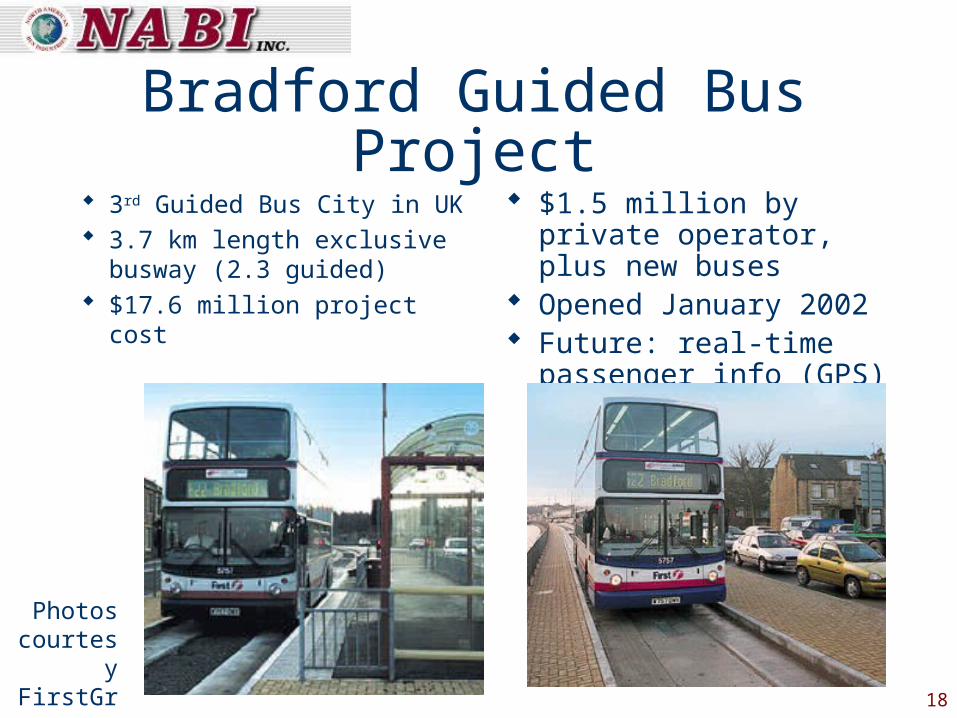
Bradford Guided Bus Project 3rd Guided Bus City in UK 3.7 km length exclusive
busway (2.3 guided) $17.6 million project cost
$1.5 million by private operator, plus new buses
Opened January 2002 Future: real-time passenger
info (GPS)
Photos courtesy
FirstGroup
19
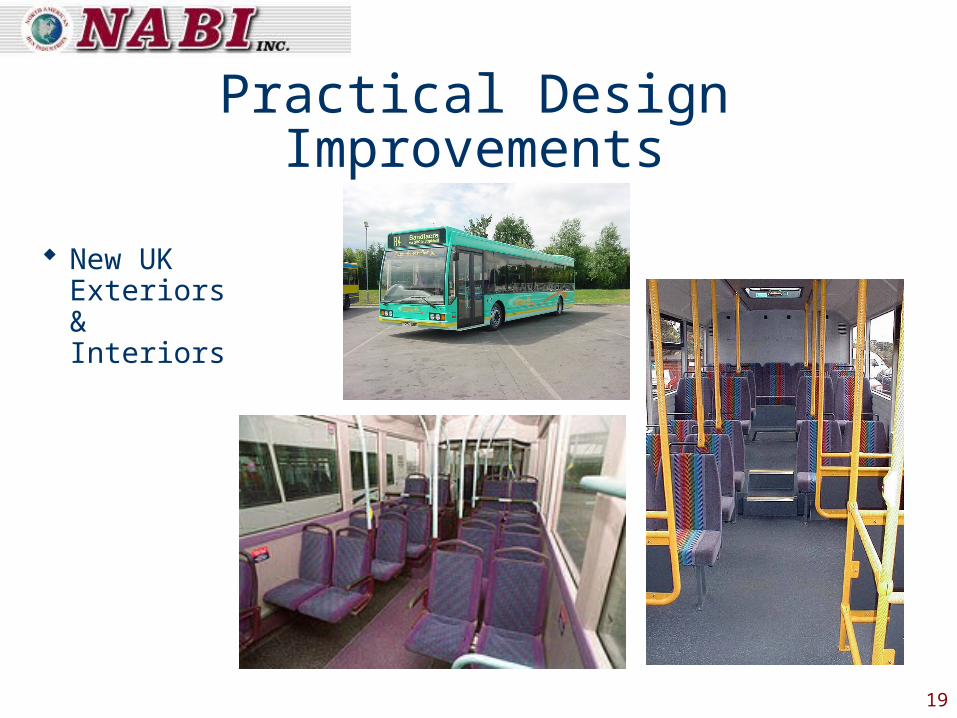
Practical Design Improvements
New UK Exteriors & Interiors
20
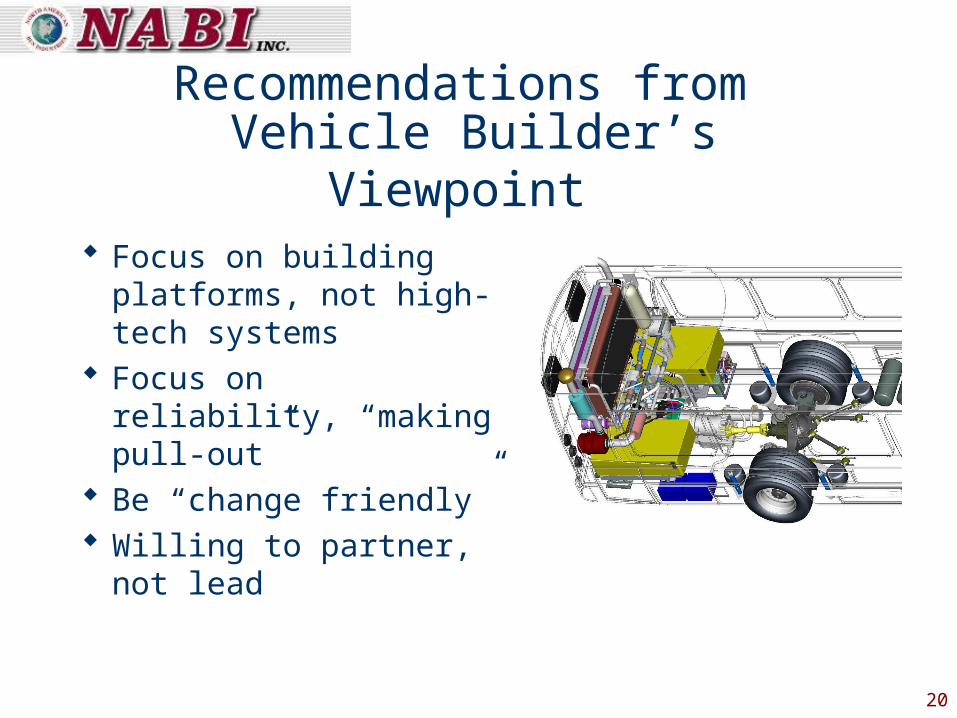
Recommendations from Vehicle Builder’s Viewpoint
Focus on building platforms, not high-tech systems
Focus on reliability, “making pull-out”
Be “change friendly” Willing to partner, not
lead
21
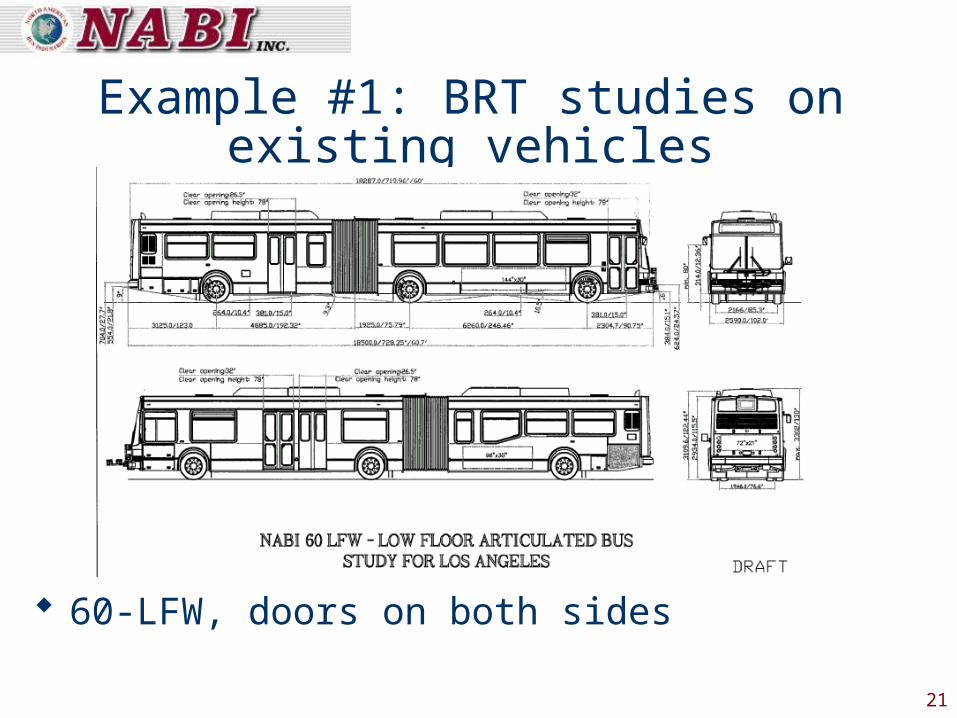
Example #1: BRT studies on existing vehicles
60-LFW, doors on both sides
22
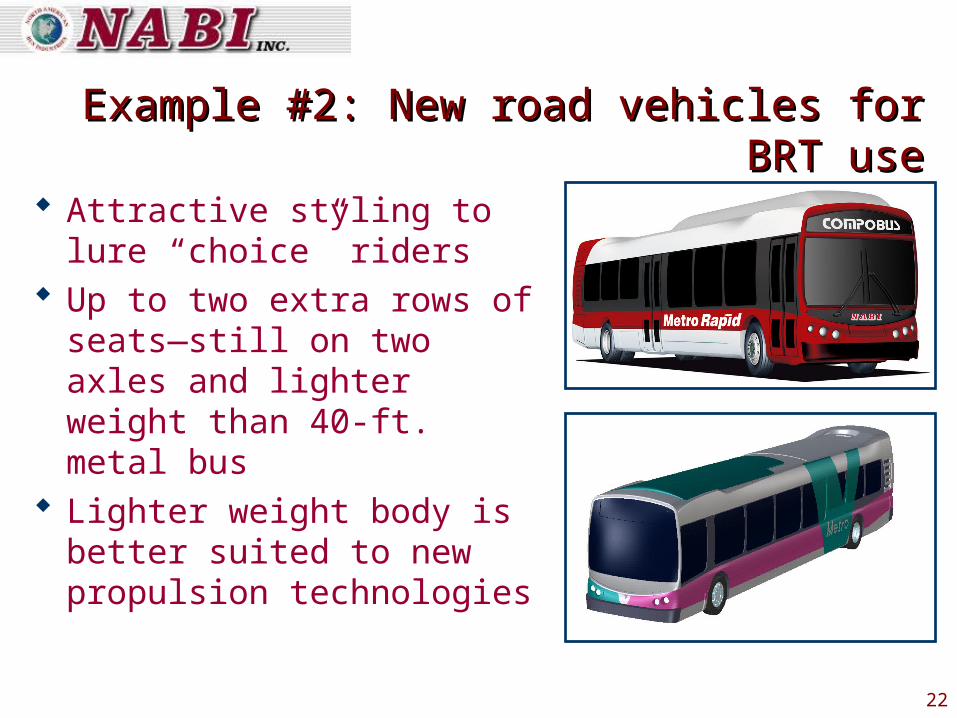
Example #2: New road vehicles for BRT useExample #2: New road vehicles for BRT use
Attractive styling to lure “choice” riders
Up to two extra rows of seats—still on two axles and lighter weight than 40-ft. metal bus
Lighter weight body is better suited to new propulsion technologies
23
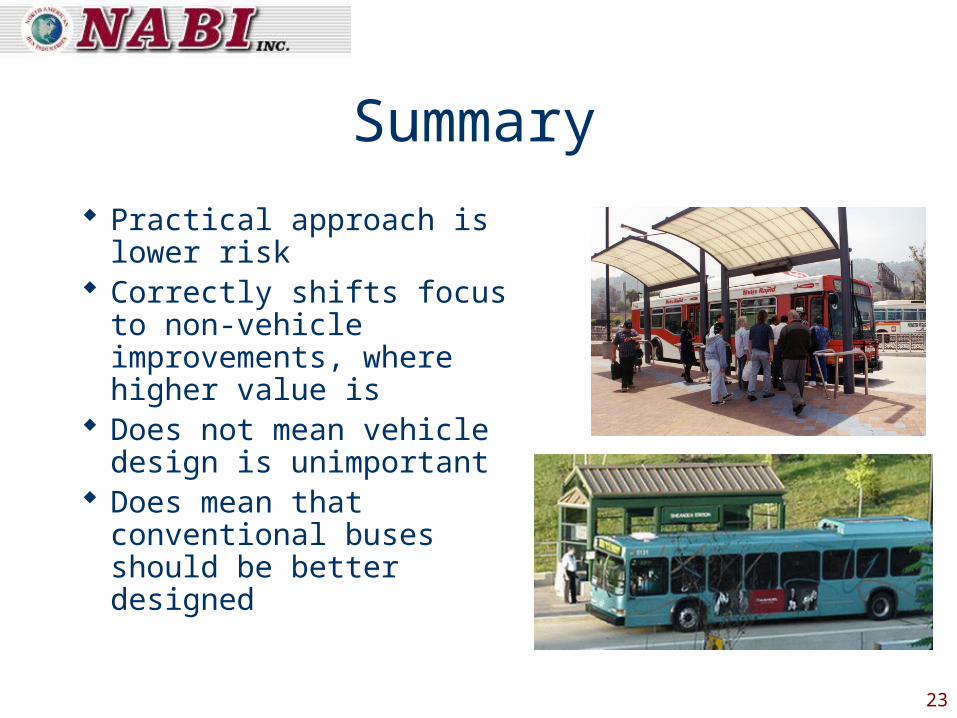
Summary
Practical approach is lower risk
Correctly shifts focus to non-vehicle improvements, where higher value is
Does not mean vehicle design is unimportant
Does mean that conventional buses should be better designed
24
Thank you
For more information
www.metro-magazine.com www.fta.dot.govwww.nabiusa.com www.optare.comNABI USA, Inc: Tel: (818) 610 0970Sales Department Fax: (818) 610 0335