a practical manual on basic techniques inisca.co.in/bio_sci/lab_manual/iep-bs-lm-2013-001.pdf · 12...
TRANSCRIPT

A Practical Manual on Basic Techniques in
BIOTECHNOLOGY &
International E – Publication www.isca.co.in
Dr. S. R
Assistant Professors in Biotechnology
PSG College of Arts & Science
A Practical Manual on Basic Techniques in
BIOTECHNOLOGY & NANOTECHNOLOGY
Publication
Edited by
R. MADHAN SHANKAR
&
Dr. E. M. RAJESH Assistant Professors in Biotechnology
PSG College of Arts & Science
Coimbatore -641 014
A Practical Manual on Basic Techniques in
NANOTECHNOLOGY

A Practical Manual on Basic Techniques in
BIOTECHNOLOGY & NANOTECHNOLOGY
By
Dr. S. R. MADHAN SHANKAR & Dr. E. M. RAJESH Assistant Professors in Biotechnology
PSG College of Arts & Science
Coimbatore -641 014
2013
International E - Publication
www.isca.co.in

International E - Publication 427, Palhar Nagar, RAPTC, VIP-Road, Indore-452005 (MP) INDIA
Phone: +91-731-2616100 Mobile: +91-80570 - 83382, E-mail: [email protected] , Website: www.isca.co.in
© Copyright Reserved
2013
All rights reserved. No part of this publication may be reproduced, stored, in a
retrieval system or transmitted, in any form or by any means, electronic,
mechanical, photocopying, reordering or otherwise, without the prior permission
of the publisher.
ISBN: 978-81-927544-6-8

International E – Publication
www.isca.co.in
International Science Congress Association
iii

International E – Publication
www.isca.co.in
International Science Congress Association
iv
CONTENTS
S. No. Description Page
No.
Molecular Biology
1 General procedures, equipment usage and safety considerations in the lab 2
2 Extraction and purification of genomic DNA from bacteria 8
3 Extraction and purification of total human DNA 11
4 Extraction and purification of plasmid DNA (Brinboim and Doly, 1979) 13
5 Agarose gel electrophoresis 15
6 Quantitation of DNA by spot test assay and uv spectroscopy 19
7 Extraction of proteins 21
8 Separation of proteins on poly acrylamide gel electrophoresis (page) and
determination of molecular weight 23
9 Screening for auxotrophic and prototrophic markers 28
10 Antibiotic sensitivity tests for bacteria(Kirby-Bauer method) 30
11 In vitro mutagenesis of bacteria 32
Plant Biotechnology
12 Plant tissue culture- an introduction 35
13 Micropropagation 40
14 Callus induction and production of secondary metabolites 44
15 Isolation of tannins, alkaloids from tissue culture grown tissue &
characterization by GCMS& FTIR 46
16 Preparation of synthetic seeds 48
Animal Biotechnology
17 Preparation of primary culture 51
18 Passaging & cell viability check by tryphan blue method 53
19 MTT assay 55
20 Micronucleus test 57
Nanotechnology
21 Synthesis and characterization of silver nanoparticle 60
22 Atomic force microscopy and transmission electron microscope 63
About the Authors 67

International E – Publication
www.isca.co.in
International Science Congress Association
1
MOLECULAR BIOLOGY

International E – Publication
www.isca.co.in
International Science Congress Association
2
1. GENERAL PROCEDURES, EQUIPMENT USAGE AND SAFETY
CONSIDERATIONS IN THE LAB
(i) Safety Procedures
a. Chemicals:
A number of chemicals used in any molecular biology laboratory are hazardous. All
manufacturers of hazardous materials are required by law to supply the user with pertinent
information on any hazards associated with their chemicals. This information is supplied in the
form of Material Safety Data Sheets or MSDS. This information contains the chemical name,
CAS#, health hazard data, including first aid treatment, physical data, fire and explosion hazard
data, reactivity data, spill or leak procedures, and any special precautions needed when handling
this chemical. A file containing MSDS information on the hazardous substances should be kept
in the lab. In addition, MSDS information can be accessed on World Wide Web. You are
strongly urged to make use of this information prior to using a new chemical and certainly in the
case of any accidental exposure or spill. The instructor/lab manager must be notified
immediately in the case of an accident involving any potentially hazardous reagents.
The following chemicals are particularly noteworthy:
• Phenol - can cause severe burns
• Acrylamide - potential neurotoxin
• Ethidium bromide - carcinogen
These chemicals are not harmful if used properly: always wear gloves when using potentially
hazardous chemicals and never mouth-pipet them. If you accidentally splash any of these
chemicals on your skin, immediately rinse the area thoroughly with water and inform the
instructor. Discard the waste in appropriate containers.
b. Ultraviolet Light
Exposure to ultraviolet light can cause acute eye irritation. Since the retina cannot detect UV
light, you can have serious eye damage and not realize it until 30 min to 24 hours after exposure.
Therefore, always wear appropriate eye protection when using UV lamps.
c. Electricity
The voltages used for electrophoresis are sufficient to cause electrocution. Cover the buffer
reservoirs during electrophoresis. Always turn off the power supply and unplug the leads before
removing a gel.
d. General Housekeeping
All common areas should be kept free of clutter and all dirty dishes, electrophoresis equipment,
etc should be dealt with appropriately. Since you have only a limited amount of space to call
your own, it is to your advantage to keep your own area clean. Since you will use common
facilities, all solutions and everything stored in an incubator, refrigerator, etc. must be labeled. In
order to limit confusion, each person should use his initials or other unique designation for
labeling plates, etc. Unlabeled material found in the refrigerators, incubators, or freezers may be

International E – Publication
www.isca.co.in
International Science Congress Association
3
destroyed. Always mark the backs of the plates with your initials, the date, and relevant
experimental data, e.g. strain numbers.
(ii) Preparation of Solutions
a. Calculation of Molar, % and "X" Solutions.
1. A molar solution is one in which 1 liter of solution contains the number of grams equal to its
molecular weight. Ex. To make up 100 ml of a 5M NaCl solution = 58.456 (mw of NaCl)
g/mol x 5 moles/liter x 0.1 liter = 29.29 g in 100 ml of solution
2. Percent solutions. Percentage (w/v) = weight (g) in 100 ml of solution; Percentage (v/v) =
volume (ml) in 100 ml of solution. Eg. To make a 0.7% solution of agarose in TBE buffer,
weight 0.7 of agarose and bring up volume to 100 ml with TBE buffer.
3. "X" Solutions. Many enzyme buffers are prepared as concentrated solutions, e.g. 5X or 10X
(five or ten times the concentration of the working solution) and are then diluted such that the
final concentration of the buffer in the reaction is 1X. Eg. To set up a restriction digestion in
25 µ l, one would add 2.5 µ l of a 10X buffer, the other reaction components, and water to a
final volume of 25 µ l.
b. Preparation of Working Solutions from Concentrated Stock Solutions.
Many buffers in molecular biology require the same components but often in varying
concentrations. To avoid having to make every buffer from scratch, it is useful to prepare
several concentrated stock solutions and dilute as needed. Eg. To make 100 ml of TE buffer
(10 mM Tris, 1 mM EDTA), combine 1 ml of a 1 M Tris solution and 0.2 ml of 0.5 M EDTA
and 98.8 ml sterile water. The following is useful for calculating amounts of stock solution
needed: C i x V i = C f x V f , where C i = initial concentration, or conc of stock solution; V i
= initial vol, or amount of stock solution needed C f = final concentration, or conc of desired
solution; V f = final vol, or volume of desired solution .
c. Steps in Solution Preparation:
1. Refer to a laboratory reference manual for any specific instructions on preparation of the
particular solution and the bottle label for any specific precautions in handling the chemical.
Weigh out the desired amount of chemical(s). Use an analytical balance if the amount is less
than 0.1 g. Place chemical(s) into appropriate size beaker with a stir bar. Add less than the
required amount of water. Prepare all solutions with double distilled water when the chemical
is dissolved, transfer to a graduated cylinder and add the required amount of distilled water to
achieve the final volume. An exception is in preparing solutions containing agar or agarose.
Weigh the agar or agarose directly into the final vessel. If the solution needs to be at a
specific pH, check the pH meter with fresh buffer solutions and follow instructions for using
a pH meter. Autoclave, if possible, at 121°C for 20 min. Some solutions cannot be
autoclaved, for example, SDS. These should be filter sterilized through a 0.22 µ m or 0.45 µ
m filter. Media for bacterial cultures must be autoclaved the same day it is prepared,
preferably within an hour or two. Store at room temperature and check for contamination
prior to use by holding the bottle at eye level and gently swirling it Solid media for bacterial
plates can be prepared in advance, autoclaved, and stored in a bottle. When needed, the agar
can be melted in a microwave, any additional components, e.g. antibiotics, can be added and
the plates can then be poured.

International E – Publication
www.isca.co.in
International Science Congress Association
4
2. Concentrated solutions, e.g. 1M Tris-HCl pH=8.0, 5M NaCl, can be used to make working
stocks by adding autoclaved double-distilled water in a sterile vessel to the appropriate
amount of the concentrated solution.
d. Glassware and Plastic Ware.
Glass and plastic ware used for molecular biology must be scrupulously clean. Dirty test
tubes, bacterial contamination and traces of detergent can inhibit reactions or degrade nucleic
acid.
Glassware should be rinsed with distilled water and autoclaved or baked at 150°C for 1 hour.
For experiments with RNA, glassware and solutions are treated with diethyl-pyrocarbonate to
inhibit RNases which can be resistant to autoclaving. Plastic ware such as pipettes and
culture tubes are often supplied sterile. Tubes made of polypropylene are turbid and are
resistant to many chemicals, like phenol and chloroform; polycarbonate or polystyrene tubes
are clear and not resistant to many chemicals. Make sure that the tubes you are using are
resistant to the chemicals used in your experiment. Micro pipette tips and microfuge tubes
should be autoclaved before use.
(iii) Disposal of Buffers and Chemicals
1. Any uncontaminated, solidified agar or agarose should be discarded in the trash, not in the
sink, and the bottles rinsed well.
2. Any media that becomes contaminated should be promptly autoclaved before discarding it.
Petri dishes and other biological waste should be discarded in Biohazard containers which
will be autoclaved prior to disposal.
3. Organic reagents, e.g. phenol, should be used in a fume hood and all organic waste should be
disposed of in a labeled container, not in the trash or the sink.
4. Ethidium bromide is a mutagenic substance that should be treated before disposal and should
be handled only with gloves. Ethidium bromide should be disposed of in a labeled container.
5. Dirty glassware should be rinsed, all traces of agar or other substance that will not come
clean in a dishwasher should be removed, all labels should be removed (if possible), and the
glassware should be placed in the dirty dish bin. Bottle caps, stir bars and spatulas should not
be placed in the bins but should be washed with hot soapy water, rinsed well with hot water,
and rinsed three times with distilled water.
(iv) Equipment
It is to everyone's advantage to keep the equipment in good working condition. As a rule of
thumb, don't use anything unless you have been instructed in the proper use. This is true not only
for equipment in the lab but also departmental equipment. Report any malfunction immediately.
Rinse out all centrifuge rotors after use and in particular if anything spills. Please do not waste
supplies - use only what you need. If the supply is running low, please notify either the
instructor/lab manager before the supply is completely exhausted. Occasionally, it is necessary to
borrow a reagent or a piece of equipment from another lab. Except in an emergency, notify the
instructor.

International E – Publication
www.isca.co.in
International Science Congress Association
5
(v) Working with DNA
a. Storage
The following properties of reagents and conditions are important considerations in processing
and storing DNA and RNA. Heavy metals promote phosphodiester breakage. EDTA is an
excellent heavy metal chelator. Free radicals are formed from chemical breakdown and radiation
and they cause phosphodiester breakage. UV light at 260 nm causes a variety of lesions,
including thymine dimers and cross-link. Biological activity is rapidly lost. 320 nm irradiation
can also cause cross-link, but less efficiently. Ethidium bromide causes photo oxidation of DNA
with visible light and molecular oxygen. Oxidation products can cause phosphodiester breakage.
If no heavy metals are present, ethanol does not damage DNA. Nucleases are found on human
skin; therefore, avoid direct or indirect contact between nucleic acids and fingers. Most DNases
are not very stable; however, many RNases are very stable and can adsorb to glass or plastic and
remain active. 5 E C is one of the best and simplest conditions for storing DNA. -20 deg C: this
temperature causes extensive single and double strand breaks. -70 E C is probable excellent for
long-term storage. For long-term storage of DNA, it is best to store in high salt ( >1M) in the
presence of high EDTA ( >10mM) at pH 8.5. Storage of DNA in buoyant CsCl with ethidium
bromide in the dark at 5 E C is excellent. There is about one phosphodiester break per 200 kb of
DNA per year. Storage of λ DNA in the phage is better than storing the pure DNA. [Ref: Davis,
R.W., D. Botstein and J.R. Roth, A Manual for Genetic Engineering: Advanced Bacterial
Genetics. Cold Spring Harbor Laboratories, Cold Spring Harbor, N.Y. 1980.]
b. Purification
To remove protein from nucleic acid solutions:
1. Treat with proteolytic enzyme, e.g., pronase, papin, proteinase K.
2. Purify on a silica-based column such as a Qiagen PCR Prep Column.
3. CsCl/Ethidium bromide density gradient.
4. Phenol Extract. The simplest method for purifying DNA is to extract with phenol or
phenol:chloroform and then chloroform. The phenol denatures proteins and the final
extraction with chloroform removes traces of phenol.
5. Purify on silica-based column such as Qiagen Brand columns.
c. Quantitation
1. Spectrophotometric. For pure solutions of DNA, the simplest method of quantitation is
reading the absorbance at 260nm where an OD of 1 in a 1cm path length =50µg/ml for
double-stranded DNA, 40 µg/ml for single-stranded DNA and RNA and 20-33µg/ml for
oligonucleotides. An absorbance ratio of 260nm and 280nm gives an estimate of the purity
of the solution. Pure DNA and RNA solutions have OD 260/OD 280 values of 1.8 and 2.0,
respectively. This method is not useful for small quantities of DNA or RNA (<1 µ g/ml).
2. Ethidium bromide fluorescence. The amount of DNA is a solution is proportional to the
fluorescence emitted by ethidium bromide in that solution. Dilutions of an unknown DNA
in the presence of 2 µ g/ml ethidium bromide are compared to dilutions of a known amount
of a standard DNA solutions spotted on an agarose gel or Saran Wrap or electrophoresed in
an agarose gel.

International E – Publication
www.isca.co.in
International Science Congress Association
6
d. Concentration
Precipitation with ethanol. DNA and RNA solutions are concentrated with ethanol as follows:
The volume of DNA is measured and the monovalent cation concentration is adjusted. The final
concentration should be 2-2.5M for ammonium acetate, 0.3M for sodium acetate, 0.2M for
sodium chloride and 0.8M for lithium chloride. The ion used often depends on the volume of
DNA and on the subsequent manipulations; for example, sodium acetate inhibits Klenow,
ammonium ions inhibit T4 polynucleotide kinase, and chloride ions inhibit RNA-dependent
DNA polymerases. The addition of MgCl2 to a final concentration of 10mM assists in the
precipitation of small DNA fragments and oligonucleotides. Following addition of the
monovalent cations, 2-2.5 volumes of ethanol are added, mixed well, and stored on ice or at -
20°C for 20 min to 1 hour. The DNA is recovered by centrifugation in a microfuge for 10 min
(room temperature is okay). The supernatant is carefully decanted making certain that the DNA
pellet, if visible, is not discarded (often the pellet is not visible until it is dry). To remove salts,
the pellet is washed with 0.5-1.0 ml of 70% ethanol, spun again, the supernatant decanted, and
the pellet dried. Ammonium acetate is very soluble in ethanol and is effectively removed by a
70% wash. Sodium acetate and sodium chloride are less effectively removed. For fast drying, the
pellet can spun briefly in a Speedvac, although the method is not recommended for many DNA
preparations as DNA that has been over dried is difficult to resuspend and also tends to denature
small fragments of DNA. Isopropanol is also used to precipitate DNA but it tends to
coprecipitate salts and is harder to evaporate since it is less volatile. However, less isopropanol is
required than ethanol to precipitate DNA and it is sometimes used when volumes must be kept to
a minimum, e.g., in large scale plasmid preps.
e. Restriction Enzymes
Restriction and DNA modifying enzymes are stored at -20°C in a non-frost free freezer, typically
in 50% glycerol. The enzymes are stored in an insulated cooler which will keep the enzymes at -
20°C for some period of time. The tubes should never be allowed to reach room temperature and
gloves should be worn when handling as fingers contain nucleases. Always use a new, sterile
pipet tip every time you use a restriction enzyme. Also, the volume of the enzyme should be less
than 1/10 of the final volume of the reaction mixture.
(vi). Sterile Technique
1. All media, including plates, liquid media and top agar must be autoclaved immediately after
it is prepared. It is best to prepare media in several small bottles, only opening one at a time.
Check the bottle for contamination before you use it by gently swirling it and looking for
cloudy material in the center. Always grow up a small amount of broth alone when growing
cells overnight. A small amount of contamination is not always evident until the media is
incubated at 37°C.
2. Use a flame on inoculating loops and on the lips of media bottles before and after pipetting
from them. Never leave a media or agar bottle open on the bench and don's take an
individually-wrapped pipet out of its protective wrapper until you are ready to use it (i.e.,
don't walk across the room with an unwrapped pipet). Always use a fresh, sterile pipet or
pipet tip when pipetting culture media, and never go back into a media bottle or cell culture
with a used pipet.

International E – Publication
www.isca.co.in
International Science Congress Association
7
3. To prevent wide-scale, untraceable contamination, each person should have his own stock of
liquid culture media, top agar, plates, 100% glycerol, glycerol stocks of cells, etc. and don't
share.
4. Overnight cultures should be grown only from a single colony on a fresh plate or from a
previously-tested glycerol stock that was grown from a single colony. To prepare an
overnight culture from a glycerol stock, take an individually-wrapped 1-ml pipet and a
culture tube of media to the -80°C freezer. Quickly remove the cap from the freezer vial
containing the glycerol stock, scrap a small amount of ice from the surface of the culture,
replace the cap on the freezer vial, and place the pipet into the culture tube. Sufficient
numbers of bacteria are present in the ice in order for the culture to grow to saturation in 16
hours. Never let the glycerol stock thaw.

International E – Publication
www.isca.co.in
International Science Congress Association
8
2. EXTRACTION AND PURIFICATION OF GENOMIC DNA FROM
BACTERIA
The isolation of DNA is one of the more commonly used procedures in many areas of bacterial
physiology, genetics, molecular biology and biochemistry. Purified DNA is required for many
applications such as studying DNA structure and chemistry, examining DNA-protein
interactions, carrying out DNA hybridizations, sequencing or PCR, performing various genetic
studies or gene cloning. The isolation of DNA from bacteria is a relatively simple process. The
organism to be used should be grown in a favorable medium at an optimal temperature, and
should be harvested in late log to early stationary phase for maximum yield. The cells can then
be lysed and the DNA isolated by one of several methods. The method of choice depends in part
on the organism of interest and what the DNA will be used for after purification. Following
lysis, other cellular constituents are selectively removed. Once this is accomplished, DNA can
be precipitated from solution with alcohol and dissolved in an appropriated buffer.
Aim:
To isolate and purify genomic DNA from the given bacterial strain and to check on agarose gel
Principle:
The lysis of the bacteria is initiated by resuspending a bacterial pellet in a buffer containing
lysozyme and EDTA. In addition to inhibiting DNAses, the EDTA disrupts the outer membrane
of the gram-negative envelope by removing the Mg++ from the lipopolysaccharide layer. This
allows the lysozyme access to the peptidoglycan. After partial disruption of the peptidoglycan, a
detergent such as SDS is added to lyse the cells. Most gram-negative cells will lyse after this
treatment and many can even be lysed without lysozyme. Once the cells are lysed, the solution
should be treated gently to prevent breakage of the DNA strands.
Subsequent steps involve the separation of the DNA from other macromolecules in the lysate.
Both phenol (that has been equilibrated with Tris buffer) and chloroform (with isoamyl alcohol
as a defoaming agent) are commonly used to dissociate protein from nucleic acids. These
reagents also remove lipids and some polysaccharides. Proteolytic enzymes such as pronase or
Proteinase K are often added to further remove protein. Proteinase K is a particularly useful
enzyme in that it is not denatured by SDS and in fact works more effectively in the presence of
SDS. The nucleic acids (including RNA) may then be precipitated in ice cold ethanol if the ionic
strength of the solution is high. This is followed by RNase treatment to degrade the RNA. The
solution may then be reprecipitated with ethanol. In this precipitation, the ribonucleotides from
RNase treatment will remain in solution leaving purified DNA in the pellet. The pellet can then
be dissolved in an appropriate buffer.
Alcohol precipitations of DNA and RNA are widely used in molecular biology and are valuable
because they allow the nucleic acids to be concentrated by removing them from solution as an
insoluble pellet. If concentrations of DNA are relatively high (>1ug/ml) DNA can be effectively
precipitated in 10-15 min by shielding the negative charge with monovalent cations (0.3M Na or
2.5 M ammonium ions are commonly used) followed by the addition of 2 volumes of 95%
ethanol. Factors affecting alcohol precipitations are given below.
A major consideration in any DNA isolation procedure is the inhibition or inactivation of
DNases which can hydrolyze DNA. The buffer in which the cells are suspended should have a

International E – Publication
www.isca.co.in
International Science Congress Association
9
high pH (8.0 or greater) which is above the optimum of most DNases. EDTA is also included in
the resuspension buffer to chelate divalent cations (such as Mg++) which are required by
DNases. The SDS also reduces DNase activity by denaturing these enzymes. DNase activity is
further controlled by keeping cells and reagents cold, using proteolytic enzymes such as pronase
or Proteinase K, and a heating step that will thermally denature DNase (but must not be hot
enough to denature the DNA)
The procedure used here is useful for isolating DNA from a large variety of gram negative
bacteria. It yields partially purified DNA of sufficient quality for most techniques, such as
restriction digestion, ligation, and cloning.
Materials Required:
1 M Tris- Cl pH 8.0, 0.5 M EDTA pH 8.0, 5% NaCl, 20mg.ml Proteinase K,
10mg/ml Lysozyme, 20% SDS, 1X RNase, Buffer saturated Phenol, 70% ethanol, absolute
ethanol, Phenol: chloroform(1:1), chloroform : IAA( 24:1), 3M Sodium acetate pH5.2 ( adjust
pH with glacial acetic acid), TE buffer.
TES Buffer: 10 mM Tris –Cl pH8.0, 5mM EDTA pH8.0, 1.5% NaCl.
Strain: E.coli CSH 123 or CSH 125 or JM 109 or DH5α
Media: LB broth (Per Liter: Nacl- 10g, Yeast extract- 5 g, Tryptone- 5g, pH 7.2)
Protocol:
01. Inoculate a single colony of E.coli strain in 10 ml of L broth and allow it to grow at 37°C for
12 to 16 hours at 110 rpm.
02. Harvest the cells at 7000 rpm for 10minutes at 4°C. Decant the media as much as possible
and gently tap the pellet.
03. Resuspend the pellet in 5 ml of ice cold TES buffer and add 50 µl of 10mg/ml lysozyme and
incubate at RT for 5- 10minutes.
04. Add Proteinase K to a final concentration of 40 µg/ml and incubate at 55°C for 10minutes.
05. Add SDS to a final concentration of 1% and incubate in a water bath at 55°C for 45 minutes.
06. Add an equal volume of buffer saturated phenol and vortex well and centrifuge at 12,000 rpm
for 10 minutes.
07. Transfer the aqueous layer to a fresh tube and add 2 volumes of ice cold 70% ethanol and
incubate on ice 5 to 10 minutes and spool the precipitating DNA fibers to a fresh tube.
08. Resuspend in 5 ml of TE buffer completely.
09. Add 100 µg/ml of RNase and incubate at 45°C in a water bath for 15 minutes followed by
the addition of an equal volume of Phenol: chloroform (1:1), vortex well and centrifuge at
12,000rpm for 10 minutes at RT.
10. Collect the top aqueous layer and extract once with chloroform: IAA (24:1).
11. Transfer the top aqueous layer to a sterile tube and add 1/10th
volume of 3M sodium acetate
pH5.2 and 2 volumes of ice cold ethanol to precipitate the DNA. Centrifuge at 10K to pellet
the DNA.
International E – Publication
www.isca.co.in
International Science Congress Association
10
12. Air dry the DNA and redissolve in 200 µl of TE buffer.
13. Check 5 µl on a 0.8% agarose gel.
Result:_______________________________________________________________________
______________________________________________________________________________
______________________________________________________________________________
______________________________________________________________________________
____________
Inference/Discussion:
_________________________________________________________________________________
_________________________________________________________________________________
_________________________________________________________________________________
_________________________________________________________________________________
_________________________________________________________________________________
________________________________________________________________________________

International E – Publication
www.isca.co.in
International Science Congress Association
11
3. EXTRACTION AND PURIFICATION OF TOTAL HUMAN DNA
Many protocols are available for isolating DNA from tissues, cells and body fluids. The basic
methodology involves the digestion of proteins followed by organic solvent extraction and
precipitation of DNA. The degree of purity required will depend upon what the DNA will ultimately
be used for. In most detection methodologies where DNA is the target, multiple samples need to be
analyzed. This therefore requires procedures that are rapid and involve minimal handling of DNA.
Aim:
To extract and purify total human DNA from whole frozen blood
Principle:
This procedure dissolves the cytoplasmic membrane and pellets the nuclei. Therefore cytoplasmic
DNA and RNA are lost. Only nuclear DNA is extracted. The DNA yield is about 40 µg/ml of
starting blood.
Materials Required:
5% EDTA, TEN A buffer( 10mM Tris-Cl pH 8.0, 1mM EDTA pH 8.0,400mM Nacl), 20 X SSC
Solution ( 3M Nacl, 0.3 M Sodium citrate pH 7.0), 1X SSC, 10% SDS, Proteinase K ( 20mg/ml),
Saturated Nacl ( ~ 6M), 100% ethanol, 70% ethanol, TE buffer.
Protocol:
1. Collect 10 ml of venous blood in a sterile polypropylene tube containing 5% EDTA and mix
it thoroughly and keep it at -20°C for overnight.
2. Thaw the frozen blood gently in a 37°C water bath with intermittent shaking
3. T o the thawed blood add 2 volumes (~ 20 ml) of 1X SSC solution , mix gently and
centrifuge at 4000 rpm for 15 minutes.
4. Discard the red supernatant and add 20 ml of 1X SSC solution mix by inversion and
centrifuge at 4000 rpm for 10 minutes.
5. Discard the supernatant leaving just enough solution to cover the pellet.
6. Dissolve the pellet in 18 ml of TEN A buffer and transfer the contents to a sterile 250ml
conical flask.
7. Add 2 ml of 10 % SDS and 25 µl of Proteinase K and incubate at 56°C for 2 hours.
8. After the incubation add 5 ml of saturated NaCl , mix the contents gently and centrifuge at
4000 rpm for 15 minutes.
9. Transfer the supernatant obtained to a sterile 250 ml beaker and precipitate the DNA by
adding 2.5 volumes of ethanol.
10. Spool the DNA fibers using a glass rod and transfer it to a sterile tube and wash with 70%
ethanol twice and air dry the pellet
11. Dissolve the pellet in 1 ml of TE buffer and Check on agarose gel.

International E – Publication
www.isca.co.in
International Science Congress Association
12
Result:__________________________________________________________________________
_________________________________________________________________________________
_________________________________________________________________________________
________________________________________________________________________________
Inference/Discussion:
_________________________________________________________________________________
_________________________________________________________________________________
_________________________________________________________________________________
_________________________________________________________________________________
_________________________________________________________________________________
_________________________________________________________________________________

International E – Publication
www.isca.co.in
International Science Congress Association
13
4. EXTRACTION AND PURIFICATION OF PLASMID DNA
(BRINBOIM & DOLY, 1979)
Bacterial plasmids are double stranded closed circular DNA molecules ranging in size from 1 Kb
to more than 200Kb. They are inherited independently of the bacterial chromosomes.
Nevertheless, they rely on the enzymes and proteins coded by the host for their transcription and
replication. Plasmids contain genes conferring resistance to antibiotics, production of antibiotics,
degradation of complex organic compounds, enterotoxins, restriction enzymes and modification
enzymes. Plasmids are always purified from cultures of bacteria that have been grown on a
selective media. Also for many years it has been a normal practice to add chloramphenicol to the
cultures to achieve complete inhibition of protein synthesis such that the yield of plasmid DNA
would be sufficiently high enough for future cloning purposes.
Aim:
To extract and purify plasmid DNA from the given bacterial strain
Principle:
Bacteria can be recovered by centrifugation and lysed by any one of the methods like treatment
with alkali, organic solvents or heat. The choice of a method depends on the size of the plasmid
in question, the nature of the host and the purification strategy that is going to be employed for
purification. Large plasmids of the range 15 Kb and more which are susceptible to damage
should be released gently. The bacteria are suspended in an isotonic solution of sucrose and then
treated with lysozyme and EDTA to break the cell wall and outer membrane. The resulting
spheroplasts can be lysed by either heat or alkali or by detergents. For small plasmids after
addition of EDTA and lysozyme the same method as above is followed. These
(heat/alkali/detergents) disrupt the base pairing and cause the linear chromosomal DNA of the
host to denature. However the closed strands of the plasmid DNA are unable to separate from
one another because they are intertwined. When conditions are returned to normal, the strands of
the plasmid DNA fall into perfect register and completely native superhelical molecules are
reformed.
Materials Required:
Strain: E.coli DH5α with plasmid pUC18
Media: LBA, L broth
Antibiotic: Ampicillin (50 mg/ml)/ Working Concentration 50 µg/ml.
1 M Tris-Cl pH 8.0, 0.5 M EDTA pH 8.0, 1M glucose, 5 N NaOH, 10% SDS,
3 M Potassium acetate pH 5.2, 5M sodium acetate pH 5.2, Equilibrated Phenol, Phenol:
chloroform (1:1), Chloroform: IAA (1:1), 70% ethanol, absolute ethanol, TE buffer
TEG buffer: glucose 50mM, EDTA 10mM, Tris-Cl 25mM
Lysis Buffer: NaOH 0.2N, 1% SDS

International E – Publication
www.isca.co.in
International Science Congress Association
14
Protocol:
01. Take 1.5ml of the overnight grown culture and harvest the cells at 12,000 rpm for 1 minute at
4ºC and remove the supernatant.
02. Tap the pellet well and resuspend in 100 µl of TEG buffer, vortex thoroughly.
03. Immediately add 200µl of Lysis buffer and mix well by inversion and incubate on ice for 5
min on ice.
04. Add 150 µl of 3 M Potassium acetate, mix by vortexing and incubate on ice for 5 minutes.
05. Centrifuge the contents at 12K for 5 minutes at 4ºC and collect eh supernatant and add equal
volume of Equilibrated Phenol: chloroform (1:1), vortex well and centrifuge at at 12K, 5 min
at 4º C.
06. Collect the top aqueous layer and precipitate with 0.1 volume of 5 M sodium acetate and
double the volume of ice cold 70% ethanol on ice for 2 minutes.
07. Centrifuge the contents at 12K, 5 minutes at 4º C.
08. Wash once with 70% ethanol and absolute ethanol.
09. Air dry the pellet and redissolve in 20 µl of TE.
10. Check 5 µl on 0.8% agarose gel.
Result:__________________________________________________________________________
_________________________________________________________________________________
_________________________________________________________________________________
_______________________________________________________
Inference/Discussion:
______________________________________________________________________________
______________________________________________________________________________
______________________________________________________________________________
______________________________________________________________________________
______________________________________________________________________________

International Science Congress Association
5. AGAROSE GEL ELECTROPHORESIS
The standard method used to separate, identify, and purify DNA fragments are
through agarose gels. The technique is simple, rapid to perform, and capable of resolving
mixtures of DNA fragments that cannot be separated adequately by other sizing procedures.
Furthermore, the location of DNA within the gel can be deter
the gel are stained with the intercalating dye ethidium bromide
detected by direct examination of the gel in ultraviolet light.
Aim:
To separate DNA molecules on agar
Principle:
Commercially available agarose is not completely pure, it is contaminated with other
polysaccharides, salts, and proteins. These differences can affect both, the migration of the DNA
and the ability of the DNA recovered from the gel to
Agarose gels are cast by melting the agarose in the presence of the desired buffer until a clear,
transparent solution is achieved. The melted solution is then poured into a mold and allowed to
harden. Upon hardening, the agarose forms a matrix, the density of which is determined by the
concentration of the agarose. When an electric field is applied across the gel, DNA, which is
negatively charged at neutral pH, migrates toward the anode. The electrophoretic migr
of DNA through agarose gels is dependent upon four main parameters given below.
The molecular size of the DNA.
migrate in an end-on position travel through gel matrices at rates that are inv
to the logarithm of their molecular weights.
The agarose concentration. A DNA fragment of given size migrates at different rates through
gels containing different concentrations of agarose. There is a linear relationship between the
logarithm of the electrophoretic mobility of DNA (µ)
described by the equation:
where µ0 is the free electrophoretic mobility and K
is related to the properties of the gel and the size of the migrating molecules. Thus, by using gels
of different concentrations, it is possible to resolve a wide
International E – Publication
www.isca.co.in
International Science Congress Association
15
AGAROSE GEL ELECTROPHORESIS
The standard method used to separate, identify, and purify DNA fragments are
through agarose gels. The technique is simple, rapid to perform, and capable of resolving
mixtures of DNA fragments that cannot be separated adequately by other sizing procedures.
Furthermore, the location of DNA within the gel can be determined directly: Bands of DNA in
the gel are stained with the intercalating dye ethidium bromide ; as little as 1 ng of DNA can be
detected by direct examination of the gel in ultraviolet light.
Structure of Agarose
To separate DNA molecules on agarose gel
Commercially available agarose is not completely pure, it is contaminated with other
polysaccharides, salts, and proteins. These differences can affect both, the migration of the DNA
and the ability of the DNA recovered from the gel to serve as a substrate to enzymatic reactions.
Agarose gels are cast by melting the agarose in the presence of the desired buffer until a clear,
transparent solution is achieved. The melted solution is then poured into a mold and allowed to
ening, the agarose forms a matrix, the density of which is determined by the
concentration of the agarose. When an electric field is applied across the gel, DNA, which is
negatively charged at neutral pH, migrates toward the anode. The electrophoretic migr
of DNA through agarose gels is dependent upon four main parameters given below.
The molecular size of the DNA. Molecules of linear, duplex DNA, which are believed to
on position travel through gel matrices at rates that are inversely proportional
to the logarithm of their molecular weights.
A DNA fragment of given size migrates at different rates through
gels containing different concentrations of agarose. There is a linear relationship between the
arithm of the electrophoretic mobility of DNA (µ) and gel concentration (
logµ=logµ0-Krτ
is the free electrophoretic mobility and Kr is the retardation coefficient, a constant that
es of the gel and the size of the migrating molecules. Thus, by using gels
of different concentrations, it is possible to resolve a wide-range of DNA fragments.
The standard method used to separate, identify, and purify DNA fragments are electrophoresis
through agarose gels. The technique is simple, rapid to perform, and capable of resolving
mixtures of DNA fragments that cannot be separated adequately by other sizing procedures.
mined directly: Bands of DNA in
; as little as 1 ng of DNA can be
Commercially available agarose is not completely pure, it is contaminated with other
polysaccharides, salts, and proteins. These differences can affect both, the migration of the DNA
serve as a substrate to enzymatic reactions.
Agarose gels are cast by melting the agarose in the presence of the desired buffer until a clear,
transparent solution is achieved. The melted solution is then poured into a mold and allowed to
ening, the agarose forms a matrix, the density of which is determined by the
concentration of the agarose. When an electric field is applied across the gel, DNA, which is
negatively charged at neutral pH, migrates toward the anode. The electrophoretic migration rate
of DNA through agarose gels is dependent upon four main parameters given below.
Molecules of linear, duplex DNA, which are believed to
ersely proportional
A DNA fragment of given size migrates at different rates through
gels containing different concentrations of agarose. There is a linear relationship between the
and gel concentration (τ), which is
is the retardation coefficient, a constant that
es of the gel and the size of the migrating molecules. Thus, by using gels
range of DNA fragments.

International Science Congress Association
The conformation of the DNA.
molecular weight migrate through agarose gels at different rates. The relative mobilities of the
three forms are dependent primarily on the agarose concentration in the gel but are also
influenced by the strength of the applied current, the ionic strength of th
of superhelical twists in the DNA.
The applied current. At low voltages, the rate of migration of linear DNA fragments is
proportional to the voltage applied. However, as the electric field strength is raised, the mobility
of high-molecular-weight fragments of DNA is increased differentially. Thus, the effective range
of separation of agarose gels decreases as the voltage is increased. Gels should be run at no more
than 5 V/cm.
Base composition and temperature.
contrast to polyacrylamide gels is not significantly affected either by the base composition of the
DNA or the temperature at which the gel is run.
The agarose concentration is varied for different fragment ranges. For analyzing the complete 2ar
codon (1239 bp), a 1% agarose gel
in a microwave oven. After cooling to bearable warmth, ethidium br
concentration of 0.5 µg/ml. The agarose solution is poured into a taped gel former mold to make
the gel. A well-forming comb (12 slots for mini
is cooled to harden until it becomes
placed horizontally into the electrophoresis tank, which is filled with 1
ethidium bromide).
The gel loading buffer is applied to the samples and they are carefully added to indi
wellsThe electrophoresis is run by 70
overnight. The size of fragments can be determined by calibrating the gel, using known standards
(e.g., λDNA EcoRI / HindIII digest, Boehringer Mannheim, or 100b
the distance the unknown fragment has migrated.
The most convenient method of visualizing DNA in agarose gels is by use of the fluorescent dye
ethidium bromide (2,7-Diamino
contains a planar group that intercalates between stacked bases of DNA. The fixed position of
this group and its close proximity to the bases causes dye bound to DNA to display an increased
fluorescent yield compared to dye in free solution. UV
nm and transmitted to the dye, or irradiation absorbed at 300 nm and 360 nm by the bound dye
itself, is emitted at 590 nm in the red
International E – Publication
www.isca.co.in
International Science Congress Association
16
The conformation of the DNA. Closed circular, nicked circular and linear DNA of the same
ular weight migrate through agarose gels at different rates. The relative mobilities of the
three forms are dependent primarily on the agarose concentration in the gel but are also
influenced by the strength of the applied current, the ionic strength of the buffer, and the density
of superhelical twists in the DNA.
At low voltages, the rate of migration of linear DNA fragments is
proportional to the voltage applied. However, as the electric field strength is raised, the mobility
weight fragments of DNA is increased differentially. Thus, the effective range
of separation of agarose gels decreases as the voltage is increased. Gels should be run at no more
Base composition and temperature. The electrophoretic behavior of DNA in agarose gels (by
is not significantly affected either by the base composition of the
or the temperature at which the gel is run.
The agarose concentration is varied for different fragment ranges. For analyzing the complete 2ar
codon (1239 bp), a 1% agarose gel is made by dissolving agarose in 1 XTAE buffer by heating
in a microwave oven. After cooling to bearable warmth, ethidium bromide is added to a final
g/ml. The agarose solution is poured into a taped gel former mold to make
forming comb (12 slots for mini gels) is placed near one edge of the gel. The gel
is cooled to harden until it becomes milky and opaque (approximately one hour). The gel mold is
placed horizontally into the electrophoresis tank, which is filled with 1 XTAE (0.5
The gel loading buffer is applied to the samples and they are carefully added to indi
wellsThe electrophoresis is run by 70-100 V/20-80 mA for about an hour or at 20 to 30 V
overnight. The size of fragments can be determined by calibrating the gel, using known standards
III digest, Boehringer Mannheim, or 100bp ladder,), and comparing
the distance the unknown fragment has migrated.
The most convenient method of visualizing DNA in agarose gels is by use of the fluorescent dye
Diamino-10-ethyl-9-phenyl-phenanthridinium bromide). This sub
contains a planar group that intercalates between stacked bases of DNA. The fixed position of
this group and its close proximity to the bases causes dye bound to DNA to display an increased
fluorescent yield compared to dye in free solution. UV-irradiation absorbed by the DNA at 260
nm and transmitted to the dye, or irradiation absorbed at 300 nm and 360 nm by the bound dye
itself, is emitted at 590 nm in the red-orange region of the visible spectrum.
Structure of Ethidium Bromide
Closed circular, nicked circular and linear DNA of the same
ular weight migrate through agarose gels at different rates. The relative mobilities of the
three forms are dependent primarily on the agarose concentration in the gel but are also
e buffer, and the density
At low voltages, the rate of migration of linear DNA fragments is
proportional to the voltage applied. However, as the electric field strength is raised, the mobility
weight fragments of DNA is increased differentially. Thus, the effective range
of separation of agarose gels decreases as the voltage is increased. Gels should be run at no more
ic behavior of DNA in agarose gels (by
is not significantly affected either by the base composition of the
The agarose concentration is varied for different fragment ranges. For analyzing the complete 2ar
TAE buffer by heating
is added to a final
g/ml. The agarose solution is poured into a taped gel former mold to make
gels) is placed near one edge of the gel. The gel
milky and opaque (approximately one hour). The gel mold is
TAE (0.5 µg/ml
The gel loading buffer is applied to the samples and they are carefully added to individual
80 mA for about an hour or at 20 to 30 V
overnight. The size of fragments can be determined by calibrating the gel, using known standards
p ladder,), and comparing
The most convenient method of visualizing DNA in agarose gels is by use of the fluorescent dye
phenanthridinium bromide). This substance
contains a planar group that intercalates between stacked bases of DNA. The fixed position of
this group and its close proximity to the bases causes dye bound to DNA to display an increased
diation absorbed by the DNA at 260
nm and transmitted to the dye, or irradiation absorbed at 300 nm and 360 nm by the bound dye

International E – Publication
www.isca.co.in
International Science Congress Association
17
Materials Required:
Gel casting tray, gel platform, comb, power packs, gel tank, 1X TAE, Ethidium Bromide (50
mg/ml stock), 4X loading dye( 0.25% Bromophenol Blue in 40% sucrose), sterile water, agarose,
DNA sample.
Protocol:
1. Determine the amount of Agarose (grams) required to make the desired Agarose gel
concentration and volume. Example: For a 1% Agarose gel, add 1 gram of Agarose to 100 ml
of 1x electrophoresis buffer.
Table-1 Gel Concentration Required for DNA Separation
Gel Concentration (%) DNA Size (Kb)
0.50 1-30
0.75 0.8-12
1.00 0.5-10
1.25 0.4-7
1.50 0.2-3
2-5* 0.01-0.5
* Sieving agarose such as AmpliSize®
agarose
2. Add the Agarose to a suitable container .Add the appropriate amount of 1x electrophoresis
buffer and swirl to suspend the Agarose powder in the buffer.
3. Place the gel solution into the microwave oven and boil and swirl the solution until all of the
small translucent Agarose particles are dissolved. Stopping the microwave oven and swirling
the flask every 30 seconds helps dissolve the Agarose faster.
4. Cool the molten Agarose to 60 °C before pouring an Agarose gel slab.
5. Level the gel caster on an even surface, seal the two ends of the platform with sealing tapes
and pour the molten agarose without air bubbles getting trapped in the solution.
6. Let it stand until it hardens to a gel.
7. Gently remove the sealing tapes and the comb and place the gel in the tank containing 1X
TAE buffer and pre run the gel for 2 to 5 minutes.
8. Load the DNA samples along with the loading dye.
9. Use Marker DNA on the first lane.
10. Apply a constant electric current of 50 V/cm2 and track the mobility of the sample dye.
11. Stain the agarose gel for 2 to 5 minutes in 50 µg/ml ethidium bromide solution and destain
briefly in sterile water.
12. Place the gel on an UV trans illuminator and observe the bands and document .

International E – Publication
www.isca.co.in
International Science Congress Association
18
Result:_______________________________________________________________________
______________________________________________________________________________
______________________________________________________________________________
________________________________________________________________
Inference/Discussion:
______________________________________________________________________________
______________________________________________________________________________
______________________________________________________________________________
______________________________________________________________________________
______________________________________________________________________________
______________________________________________________________________________

International E – Publication
www.isca.co.in
International Science Congress Association
19
6. QUANTITATION OF DNA BY SPOT TEST ASSAY AND UV SPECTROSCOPY
Aim:
To quantify the given DNA sample by Spot test assay and UV spectroscopy and compare teh
results.
Principle:
1. Spot test assay: A fairly accurate, rapid assay of DNA concentration can be obtained by UV
visualization of samples spotted onto ethidium bromide-containing agarose plates.
2. UV Spectroscopy: If sample is pure (i.e. without significant amounts of contaminantes
suchas a proteins, phenol, agarose, or other nucleic acids), can use spec to measure amount of
UV irradiation absorbed by the bases.
For quantitating DNA or RNA, readings should be taken at wavelengths of 260 nm and 280 nm.
The reading at 260 nm allows calculation of the concentration of nucleic acid in the sample.
1 O.D. at 260 nm for double-stranded DNA = 50 ng/µl of dsDNA
1 O.D. at 260 nm for single-stranded DNA = 20-33 ng/µl of ssDNA
1 O.D. at 260 nm for RNA molecules = 40 ng/µl of RNA
The reading at 280 nm gives the amount of protein in the sample.
Pure preparations of DNA and RNA have OD260
/OD280
values of 1.8 to 2.0, respectively. If there
is contamination with protein or phenol, this ratio will be significantly less than the values given
above, and accurate quantitation of the amount of nucleic acid will not be possible.
So typically, dilute sample 1 ul in 100 µl so the dilution factor is 100. Put whole 100 µl in
spectrophotometer cuvette. The DNA concentration read will then be:
OD260
* 50 ng/µl * dilution factor
For example, if have OD260
= 1.6. Then the concentration is:
1.6 * 50 ng/µl * 100 = 8000 ng/µl or 8 µg/µl.
Materials Required:
DNA sample to be quantified, Lambda DNA, Marker DNA, ethidium bromide, agarose, petri
plates, quartz cuvettes, UV Spectrophotometer, UV trans illuminator, 50 X TAE buffer, TE
buffer
Protocol:
1. Spot Test Assay:
1) Prepare 0.8% (w/v) agarose/ethidium bromide plates by melting 0.8g agarose in 100ml 1 x
TAE buffer (50 x TAE: 2M Tris-acetate, 50mM EDTA), allowing agarose to cool to
approximately 50°C and adding 10µl of a 10mg/ml ethidium bromide stock solution (final
concentration was 1µg/ml). Plates can be stored for up to 1 month at 4°C in the dark.

International E – Publication
www.isca.co.in
International Science Congress Association
20
2) Prepare standard DNA solutions of known concentrations to cover the concentration range of
10ng/µl to 200ng/µl in distilled water or TE buffer.
3) Spot standards (1ul) carefully onto the surface of a plate in duplicate followed immediately
afterwards by the DNA sample of unknown concentration (1µl).
4) Allow spots to absorb for 10 to 15 minutes.
5) Visualize DNA by illumination using a shortwave UV light box.
The concentration of DNA in the unknown sample can be approximated by comparison with the
standards.
1. UV Spectroscopy:
1. Turn on machine and wait for it to warm up
2. Wash quartz cuvettes thoroughly before use and if 2 are used then make sure they are a
‘matching’ pair.
3. Set wavelength to 260 and auto zero with water.
4. Put 5µ l of DNA concentration into a clean quartz cuvette, add 1ml of water and mix by
covering with parafilm and inverting.
5. Insert cuvette into machine and note reading
6. Follow steps 3 again but this time set wavelength to 280, note reading.
7. Repeat procedure 3 times with new samples of DNA noting readings at both A260 and A280.
8. Take an average of the A260 readings and multiply the figure by 10 to give the concentration
of DNA per ml.
9. Take average of A280 readings and divide A260 average by the A280 average this should
give a figure between 1.8-2.0 if it is out of the range then the DNA is not pure and sample
should be purified using phenol/chloroform.
Result:_______________________________________________________________________
______________________________________________________________________________
______________________________________________________________________________
________________________________________________________________
Inference/Discussion:___________________________________________________________
______________________________________________________________________________
______________________________________________________________________________
______________________________________________________________________________
______________________________________________________________________________

International E – Publication
www.isca.co.in
International Science Congress Association
21
7. EXTRACTION OF PROTEINS
Extraction of proteins is perhaps the most crucial steps in proteomic analysis. This aims to
prepare the protein in its biologically active conformation.
Aim:
To extract and quantify total protein from E.coli .
Principle:
Although there are exceptions, many nuclear and cytoplasmic proteins can be solubilized by lysis
buffers that contain the non ionic detergent Nonident P 40 and either no salt at all or relatively
high concentrations of salt. However the efficiency of extraction is often greatly influenced by
the pH of the buffer and the presence or absence of chelating agents like EGTA or EDTA.
Extraction of membrane bound proteins and hydrophobic proteins are less affected by the ionic
strength of the lysis buffer but often requires a mixture of ionic and non ionic detergents. Many
methods of solubilization, particularly the mechanical methods like sonication release intra
cellular proteases that can digest the proteins. Hence it is essential to incorporate some degraded
proteins in the extraction buffer which are more prone to be attacked by the proteases. It is also
important to keep the extracts in colder conditions. In addition some protease inhibitors may also
be incorporated in to the extraction buffer. Here in we are attempting to prepare total lysates
from small scale cultures of E.coli.
Materials Required:
Overnight grown E.coli culture, 1M Tris Cl pH 7.4, 2X SDS gel loading buffer (100mM Tris-Cl
pH6.8, 200 mM DTT, 4%SDS, 0.2% Bromophenol Blue, 20% glycerol)
Protocol:
1. Inoculate a single colony of E.coli in 10 ml LB and aerate overnight at 100 rpm at 37°C for
about 8- 12 hours.
2. Transfer 1m l of the overnight grown culture to a micro centrifuge tube and harvest at 12000
rpm at 4°C.
3. Remove the supernatant by aspiration leaving the bacterial pellet as dry as possible.
4. Resuspend the pellet by vortexing in 25µl of sterile water. As soon as the pellet disperses add
25µl of 2X SDS gel loading buffer and vortex for 20 – 30 seconds.
5. Place the tube in a boiling water bath for 5 minutes.
6. Shear the chromosomal DNA by sonication, using a sonictor for 30 seconds to 2 minutes in a
full pulse.
7. Centrifuge the sample at 12,000rpm at room temperature.
8. Dissolve the pellet in 25µl f 2X SDS loading buffer and store at 4°C.

International E – Publication
www.isca.co.in
International Science Congress Association
22
Result:________________________________________________________________________
______________________________________________________________________________
______________________________________________________________________________
_______________________________________________________________
Inference/Discussion:
______________________________________________________________________________
______________________________________________________________________________
______________________________________________________________________________
______________________________________________________________________________
______________________________________________________________________________

International E – Publication
www.isca.co.in
International Science Congress Association
23
8. SEPARATION OF PROTEINS ON POLY ACRYLAMIDE GEL
ELECTROPHORESIS (PAGE) AND DETERMINATION OF MOLECULAR WEIGHT
Almost all analytical electrophoresis of proteins is carried out in polyacrylamide gels
under conditions that ensure dissociation of proteins into their individual poly peptide subunits.
SDS polyacrylamide gel electrophoresis (SDS-PAGE) involves the separation of proteins based
on their size. By heating the sample under denaturing and reducing conditions, proteins become
unfolded and coated with SDS detergent molecules, acquiring a high net negative charge that is
proportional to the length of the polypeptide chain.
Aim:
To separate proteins on a denaturing Polyacrylamide gel and visualize the separated proteins by
Coomassie Brilliant Blue stain.
Principle:
SDS PAGE uses an anionic detergent (SDS) to denature proteins. the protein molecules become
linearized. One SDS molecule binds to 2 amino acids. Due to this, the charge to mass ratio of all
the denatured proteins in the mixture becomes constant. These protein molecules move in the gel
(towards the anode) on the basis of their molecular weights only & are separated.
The charge to mass ratio varies for each protein (in its native or partially denatured form).
Estimation of molecular weight would then be complex. Hence, SDS denaturation is used.
The gel matrix is formed of polyacrylamide. The polyacrylamide chains are crosslinked by N,N-
methylene bisacrylamide comonomers. Polymerisation is initiated by ammonium persulfate
(radical source) and catalysed by TEMED (a free radical donor and acceptor).
The resolution & focus of the protein bands is increased by using discontinuous gels (Laemmli
gels)- the stacking gel (pH 6.8, %T=3 to 5 %) & the resolving gel (pH 8.8, %T= 5 to 20 %). %T
represents acrylamide percentage. These gels are usually run at constant current. At pH=6.8,
most of the glycine in the population exist as zwitterions with no negative charge (pKa 1 =2.45;
pKa 2 =9.6; pI=6.025). Only 0.0015% of the glycine is anionic at this pH (refer glycine titration
curve & Henderson-Hasselbach equation). As such, bulk of the current is carried by the
denatured, negatively charged, SDS-coated protein molecules. At this stage, the glycine ions lag
behind the proteins. The order is as follows- chloride ions, denatured proteins, glycine ions.
Upon entering the resolving gel (pH=8.8), the glycine zwitterions deprotonate to the anionic
form. The proportion of these ions increase from 0.0015% to 15.8%. The carrying of the current
is now shared by the ions such that protein molecules have a greater freedom to separate on the
basis of molecular weights. Due to their small size, the glycine anions also tend to overtake the
protein band, thus providing a sandwiching effect & greater resolution in the gel.

International E – Publication
www.isca.co.in
International Science Congress Association
24
Materials Required:
Protein sample, Molecular weight marker, gel apparatus, gel casting trays, staining trays, power
packs,
Solutions:
A) 30 % Acrylamide monomer solution:
Acrylamide: 29g
N,N’- Methylene Bis Acrylamide: 1g
Distilled water to make: 100 ml
B) 10 % stock solution of SDS
C) TEMED
D) Ammonium Persulphate 10% solution ( Make Fresh)
E) Tris Buffer pH 6.8 ( 1.5M)
F) Tris Buffer pH 8.8 (1.5M)
G) Tris Glycine electrophoresis Buffer
25 mM Tris base
250 mM Glycine
0.1% SDS
pH 8.3
(Prepare a 5X stock by dissolving 15.1 g Tris base and 94 g glycine in 900 ml distilled water and
then add 50 ml of 10% (w/v) SDS and adjust the volume to 1000 ml)
H) 1X gel loading buffer
50 mM Tris .Cl (pH 6.8)
100 mM DTT
2% SDS
0.1% bromophenol Blue
10% glycerol
(Don’t add DTT and store. DTT must be added just before use from a 1M stock)
I) Coomassie Brilliant Blue staining solution
Dissolve 0.25 g CBBR 250 in 90 m l of Methanol: water ( 1:1v/v) and 10 ml of glacial
acetic acid. Filter the solution through Whattman No1 filter paper and store.
J) Destaining solution: Methanol: glacial acetic acid (30%: 10%).
International E – Publication
www.isca.co.in
International Science Congress Association
25
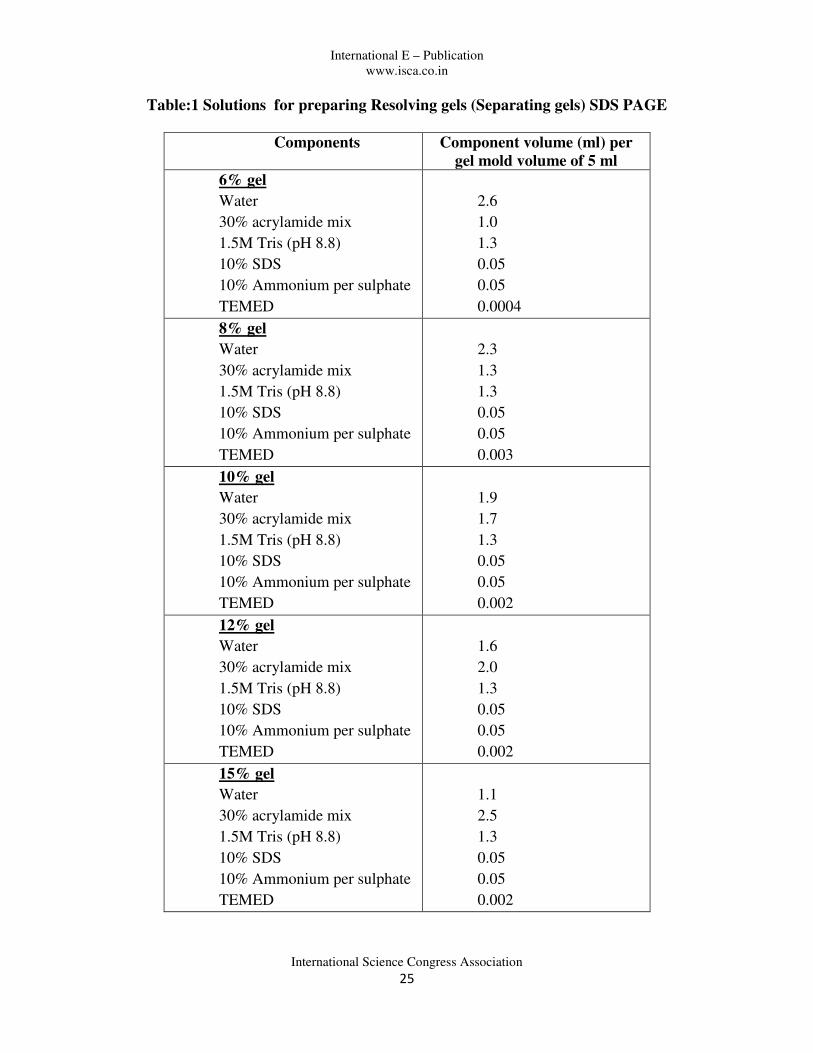
Table:1 Solutions for preparing Resolving gels (Separating gels) SDS PAGE
Components Component volume (ml) per
gel mold volume of 5 ml
6% gel
Water
30% acrylamide mix
1.5M Tris (pH 8.8)
10% SDS
10% Ammonium per sulphate
TEMED
2.6
1.0
1.3
0.05
0.05
0.0004
8% gel
Water
30% acrylamide mix
1.5M Tris (pH 8.8)
10% SDS
10% Ammonium per sulphate
TEMED
2.3
1.3
1.3
0.05
0.05
0.003
10% gel
Water
30% acrylamide mix
1.5M Tris (pH 8.8)
10% SDS
10% Ammonium per sulphate
TEMED
1.9
1.7
1.3
0.05
0.05
0.002
12% gel
Water
30% acrylamide mix
1.5M Tris (pH 8.8)
10% SDS
10% Ammonium per sulphate
TEMED
1.6
2.0
1.3
0.05
0.05
0.002
15% gel
Water
30% acrylamide mix
1.5M Tris (pH 8.8)
10% SDS
10% Ammonium per sulphate
TEMED
1.1
2.5
1.3
0.05
0.05
0.002
International E – Publication
www.isca.co.in
International Science Congress Association
26
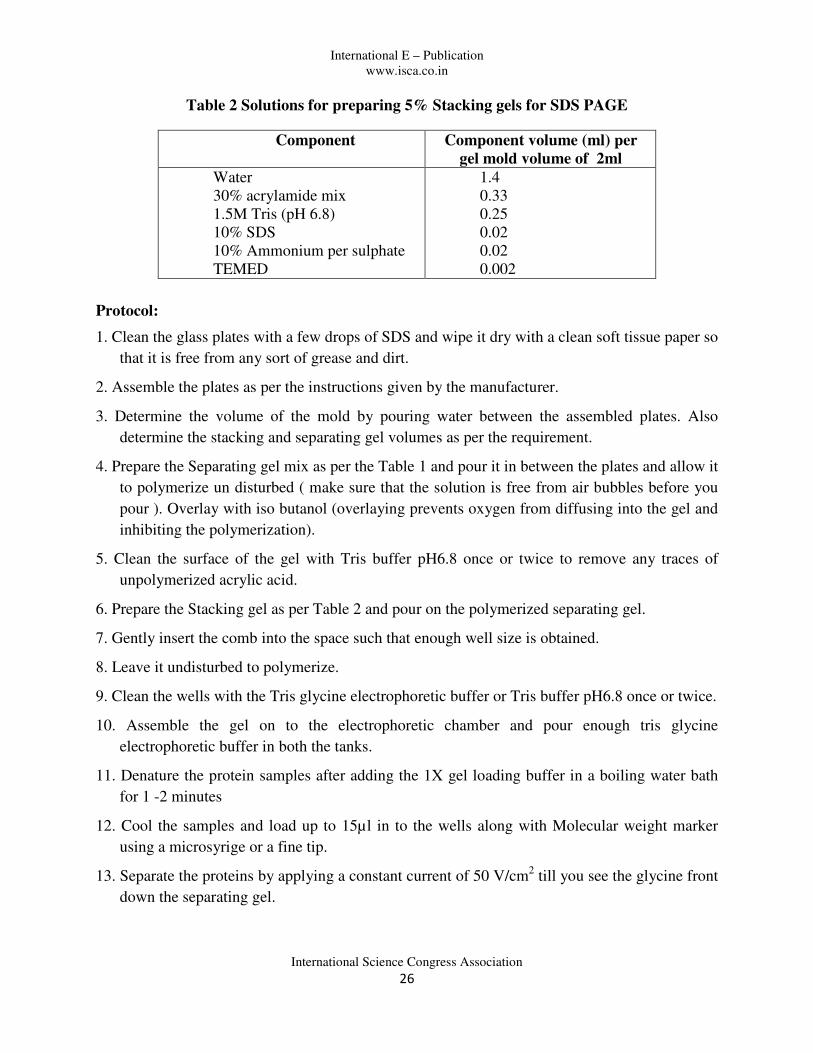
Table 2 Solutions for preparing 5% Stacking gels for SDS PAGE
Component Component volume (ml) per
gel mold volume of 2ml
Water
30% acrylamide mix
1.5M Tris (pH 6.8)
10% SDS
10% Ammonium per sulphate
TEMED
1.4
0.33
0.25
0.02
0.02
0.002
Protocol:
1. Clean the glass plates with a few drops of SDS and wipe it dry with a clean soft tissue paper so
that it is free from any sort of grease and dirt.
2. Assemble the plates as per the instructions given by the manufacturer.
3. Determine the volume of the mold by pouring water between the assembled plates. Also
determine the stacking and separating gel volumes as per the requirement.
4. Prepare the Separating gel mix as per the Table 1 and pour it in between the plates and allow it
to polymerize un disturbed ( make sure that the solution is free from air bubbles before you
pour ). Overlay with iso butanol (overlaying prevents oxygen from diffusing into the gel and
inhibiting the polymerization).
5. Clean the surface of the gel with Tris buffer pH6.8 once or twice to remove any traces of
unpolymerized acrylic acid.
6. Prepare the Stacking gel as per Table 2 and pour on the polymerized separating gel.
7. Gently insert the comb into the space such that enough well size is obtained.
8. Leave it undisturbed to polymerize.
9. Clean the wells with the Tris glycine electrophoretic buffer or Tris buffer pH6.8 once or twice.
10. Assemble the gel on to the electrophoretic chamber and pour enough tris glycine
electrophoretic buffer in both the tanks.
11. Denature the protein samples after adding the 1X gel loading buffer in a boiling water bath
for 1 -2 minutes
12. Cool the samples and load up to 15µl in to the wells along with Molecular weight marker
using a microsyrige or a fine tip.
13. Separate the proteins by applying a constant current of 50 V/cm2 till you see the glycine front
down the separating gel.

International E – Publication
www.isca.co.in
International Science Congress Association
27
Staining the gel with CBBR 250:
14. After the proteins have separated gently remove the spacers and the gel. Remove the stacking
gel gently from the separating gel using a fine scalpel blade.
15. Immerse the gel in 5 gel volumes of Staining solution and rock it gently for 3-4 hours at
room temperature.
16. Remove the stain and destain the gel several times in destining solution.
17. Store the gels in water and document the gel by photography for further record.
Result:__________________________________________________________________________
_________________________________________________________________________________
_________________________________________________________________________________
_______________________________________________________
Inference/Discussion:
______________________________________________________________________________
______________________________________________________________________________
______________________________________________________________________________
______________________________________________________________________________
______________________________________________________________________________
________________________________________________________________________

International E – Publication
www.isca.co.in
International Science Congress Association
28
9. SCREENING FOR AUXOTROPHIC AND PROTOTROPHIC MARKERS
Aim:
To isolate single colony and to check for genetic markers His, Arg, Met and lactose
Principle:
Auxotrophic markers present in the bacteria prevents its growth on Minimal media.
Hence these must be supplemented in the media. These auxotrophic markers can be identified by
plating the bacterial strain on minimal media along with all amino acids and glucose as the
carbon source except the amino acid/sugar/nucleotide that is being screened for. For example if
we are screening for Met, the minimal media would contain all amino acids except Methionine
and glucose as the carbon source. Bacteria would not require the addition of the ingredients
separately if they are prototrophic. Screening for markers is essential step in attributing the
genetic trait to the strains and also helps the experimenter to use the right host strain for
recombinant work.
Materials Required:
Strain: E.coli JM 109 (rec A1 supE44 end A1 hsdR17 gyrA96 relA1 thi∆ (lac-proAB) F’ (tra
D36 proAB+ lacI
q lacZ∆ M15)
Media: LB agar, L broth, Minimal Media agar: Per liter (K2HPo4- 10.5 g, KH2Po4- 4.5g,
(NH4)2 So4-1g, Sodium Citrate.dihydrate-0.5 g, pH 7.0), 20% stock solutions of glucose and
lactose, 20% stock solutions of all required amino acids.
Other requirements: L rod, Lazy Susan Turn table, Petri plates, Sterile eppendorfs, microtips,
micropipette etc….
Protocol:
1. Inoculate an overnight culture of E.coli JM 109 in 10 ml L broth.
2. Prepare the Minimal agar plates as follows:
MMA+ Amino acids+ glucose (Control)
MMA+ All amino acids except His+glucose
MMA+ All amino acids except Arg+ glucose
MMA+ All amino acids +lactose and not glucose
3. Maintain a control LB agar plate (Control)
4. Streak a loop full of the overnight grown culture on to the above plates and incubate at 37 ° C
for 12-24 hours for the Minimal media plates and 12 hours for LB agar plates.
5. Compare the Minimal plates with the control plates and comment on the genetic makeup of
the strain.

International E – Publication
www.isca.co.in
International Science Congress Association
29
Result:__________________________________________________________________________
_________________________________________________________________________________
_________________________________________________________________________________
_______________________________________________________
Inference/Discussion:
______________________________________________________________________________
______________________________________________________________________________
______________________________________________________________________________
______________________________________________________________________________
______________________________________________________________________________
________________________________________________________________________
International E – Publication
www.isca.co.in
International Science Congress Association
30
10. ANTIBIOTIC SENSITIVITY TESTS FOR BACTERIA(KIRBY-BAUER
METHOD)
Antibiotics are chemicals that are produced by living organisms which, even in minute amounts,
inhibit the growth of or kill another organism. While thousands of them have been discovered
since Sir Alexander Fleming observed the inhibitory activity of Penicillium on Staphylococcus in
1929, most are not useful medically because of undesirable toxicity or side effects. A simple
method using paper discs saturated with the chemicals to be tested can be used to determine the
resistance or sensitivity of an organism to different antibiotics. Following inoculation of an agar
medium, discs are placed onto the surface of the medium so that the antibiotic will diffuse into
the medium. Inhibition of the organism is evident following incubation as a clear region around
the disc, called a "zone of inhibition", in which no growth has occurred.
Aim:
To perform the Kirby Bauer testing or the disc diffusion antibiotic sensitivity testing to assess the
resistance and susceptibility status of the given bacteria to the given antibiotics
Principle:
A known quantity of bacteria is grown on agar plates in the presence of thin wafers containing
relevant antibiotics. If the bacteria are susceptible to a particular antibiotic, an area of clearing
surrounds the wafer where bacteria are not capable of growing (called a zone of inhibition).
The size of the zone and the rate of antibiotic diffusion are used to estimate the bacteria's
sensitivity to that particular antibiotic. In general, larger zones correlate with smaller minimum
inhibitory concentration (MIC) of antibiotic for those bacteria. This information can be used to
choose appropriate antibiotics to combat a particular infection. Medical laboratory personnel
select the antibiotic discs tested based upon the site and type of infection. Following incubation
and measurement of the zone sizes, a chart is consulted which indicates whether the diameter of
the zone of inhibition for an antibiotic indicates that it would be effective for use in treating the
patient's infection.
Materials Required:
Fresh cultures of E.coli, Salmonella Sp, Staphylococcus, and Bacillus, Sterile swabs, Antibiotic
discs, Disc dispenser, incubator and disinfectant bath
Media: Trypticase Soy Agar( TSA)- Per Liter (Tryptone-17g, Soytone- 3g,Dextrose-
2.5g,Sodium Chloride-5 g, K2HPo4-2.5g, pH7.3, Agar 2%) or Nutrient Agar (NA): (Per Liter:
Peptone-15g, yeast extract-3g, Sodium chloride -6 g, glucose -1g, pH7.2, Agar 2%)

International E – Publication
www.isca.co.in
International Science Congress Association
31
Protocol:
1. Dip one swab into the broth of E.coli.
2. Swab the entire surface of one plate labeled E.coli. Go over the plate at least twice in each
direction. Discard the swab in the beaker of disinfectant provided.
3. Repeat this procedure for the cultures.
4. Add the antibiotic discs to each plate using the dispenser. Remove the cover of the petri dish
and set the dispenser over the plate.
5. Gently tap each antibiotic disc onto the surface of the agar with a sterile stick or toothpick to
assure good contact. Discard toothpicks in the disinfectant.
6. Incubate plates at 37°C for 8-12 hours.
7. Examine each plate for the presence of zones of inhibition.
8. Measure the diameter of each zone in millimeters using the rulers provided.
9. Compare the diameter of each zone to the chart to determine if the organism is sensitive or
resistant to the antibiotic.
10. Tabulate your results as follows:
Result:_______________________________________________________________________
______________________________________________________________________________
______________________________________________________________________________
________________________________________________________________
Inference/Discussion:
______________________________________________________________________________
______________________________________________________________________________
______________________________________________________________________________
______________________________________________________________________________
_________________________________________________________________________
Antibiotic Abbreviation
on the disc
Zone
diameter
Resistant
diameter
Intermediate
diameter
Sensitive
diameter
Sensitive/
Resistant

International E – Publication
www.isca.co.in
International Science Congress Association
32
11. IN VITRO MUTAGENESIS OF BACTERIA
Aim:
To induce mutations in the given bacterial strain by exposing it to UV rays and screen for
mutants.
Principle:
UV irradiation causes numerous photo products such in DNA. Two types of photo
dimmers occurring at adjacent pyramidines have been correlated with mutagenesis. Both frame
shifts and base substitutions are induced by UV, which also stimulates recombination and certain
types of genetic rearrangements. Among base substitutions, transitions predominate, although
their prevalence of four to five times over transversions is far less than for alkylating agents. In
some systems, G:C� A:T transitions are favoured, whereas in other systems both transitions
appear to occur with similar frequencies. UV mutagenesis requires the SOS system in bacteria.
Since some of the lesions that trigger induction of the SOS system, as well as some premutagenic
lesins, are photoreversions, precautions should be taken to carry out the mutagenesis in the
absence of strong visible light.
Materials Required:
UV lamp, E.coli Strain CSH 100( F’ lac pro A+B+ ) ara∆ (gpt-lac) 5), LBA, Rifampicin (50
mg/ml in methanol), Centrifuge, sterile test tubes, petri plates, 0.1 M MgSO4
Protocol:
1. Inoculate a fresh overnight culture of E.coli CSH100 in 10 ml LB.
2. Subculture the overnight culture by diluting 1:20 in LB and incubate at 37°C for 3-4 hours.
3. When the cells have reached a density of 108/ml, spin them down and resuspend the cells in an
equal volume of 0.1 M MgSO4. Pool the cells to one container and place on ice for 5 – 10
minutes.
4. For each time point (0 sec to 90 Sec), pipette 5 ml of the cells into a sterile petri dish, swirl the
dish to evenly spread the cells. Place the dish on a flat surface under UV lamp.l
5. Pipette the exposed cells into a sterile test tube and titer samples for viable cells by plating
dilutions on LB plates. For the control (no exposure to UV) plate 10-5 and 10-6 dilutions and
for all other time points plate 10-3, 10-4, 10-5 dilutions on LB and incubate at 37 ° C
overnight.
6. Inoculate LB medium with samples of mutagenized cells, diluting approximately 1:20 and
aerate over night at 37 °C.
7. Place the overnight cultures both viable and to test for different mutants. To look for Rifr
mutants, plate neat, 10-1
and 10-2
dilutions of the mutagenized overnight grown cells on
LBA+ 15 µg/ml rifampicin. Incubate the plates overnight at 37 ° C.

International E – Publication
www.isca.co.in
International Science Congress Association
33
8. Score for the number of Rifampicin resistant mutants and calculate the % survival rate and
frequency of the mutants.
Table -1: Survival after UV treatment
Time ( UV) Sec No of colonies on LBA Titre Cfu/ml Survival (%)
Table 2: Frequency and total number of Rif r mutants after UV irradiation
Time ( UV) Sec Survival (%) Rif r frequency Total Rif
r mutants/ml
mutagenized cells
Result:_______________________________________________________________________
______________________________________________________________________________
______________________________________________________________________________
________________________________________________________________
Inference/Discussion:
______________________________________________________________________________
______________________________________________________________________________
______________________________________________________________________________
______________________________________________________________________________
_________________________________________________________________________

International E – Publication
www.isca.co.in
International Science Congress Association
34
PLANT BIOTECHNOLOGYPLANT BIOTECHNOLOGYPLANT BIOTECHNOLOGYPLANT BIOTECHNOLOGY

International E – Publication
www.isca.co.in
International Science Congress Association
35
12. PLANT TISSUE CULTURE- AN INTRODUCTION
Plant tissue culture is the science or art of growing plant cells, tissues or organs isolated from the
mother plant, on artificial media. The culture initiation and plant regeneration are still
accomplished ampirically by varying conditions until the desired response is obtained. Scheiden
and Schwann’s suggestion that the totipotency of cells was the foundation of the plant cell and
the tissue culture. However it was Haberlandt who look the first real steps in in vitro cultures.
Since then many investigate have studied plant regeneration under in vitro conditions and have
obtained further understanding of cell totipotency.
Tissue culture is a collective term commonly used to describe all kinds of in vitro plant cultures.
The tissue cultures can be cultures of an organized tissue, viz., callus cultures, suspension or cell
cultures, protoplat cultures, pollen cultures etc., or cultures of organized structure like meristem
cultures, shoot and root cultures, embryo cultures, inflorescence cultures, ovule cultures, etc..
Plant tissue culture has direct commercial applications as well as value in basic research into cell
biology, genetics and biochemistry.
Prepartion of glassware:
Cleaning:
It is important to use clean glassware for the growth of tissue in vitro. In our laboratory these
include:
1. Boil all glassware in washing soda solution (10%) for 1 hour.
2. Rinse thoroughly with tap water and leave in HCl (1N) for 2 hours.
3. Remove traces of acid by thorough washing with tap water.
4. Rinse glassware with double-distilled water.
5. Allow glassware to dry overnight at room temperature.
Sterilization:
The objective of sterilization is to make media, glassware and instruments free from
microorganisms. It is accomplished by wet heat, dry heat or filteration.
1) Wet-heat sterilization:
1. Plug glassware such as conical flasks, test tubes, etc. with non-absorbent cotton.
2. Wrap petriplates dishes with wrapping paper or aluminium foil.
3. Place forceps and scalpels in test tubes. Plug the tubes with non-absorbent cotton and cover
with brown paper.
4. Plug the mouth end of graduated pipettes (1, 2, 5 and 10ml) with cotton. wrap them
individually in wrapping paper or aluminium foil.
5. Autoclave glassware and instruments at 1210C for 1 hour.

International E – Publication
www.isca.co.in
International Science Congress Association
36
2) Dry-heat sterilization:
Steps 1-4 are similar as wet-heat sterilization. But the final step involves placing the instruments
in an oven at 1400-160
0C for 2 hours.
3) Filter sterilization:
Aminoacids, vitamins, phytohormones,etc.. may get destroyed during autoclaving. So such as
chemicals are therefore sterilized by filtration through a Seitz or Millipore filtration assembly
using filter membranes of 0.45 or 0.22µm porosity.
1. Plug 500 or 1000ml receiver flask with cotton.
2. Assemble Millipore filtration unit with bacteriological membrane filter (0.45 or 0.22 µm).
3. Wrap filtration until with wrapping paper
4. Autoclave receiver flask and filtration unit at 121°C for 1 hour (do not sterilize in dry heat as
membrane filters get damaged)
5. Fix filtration unit to the receiver flask in a sterile cabinet.
6. Pour solution to be sterilized into the filtration.
7. Apply slight air pressure to commence filtration (don not exceed air pressure by 7.03
Kg/cm2).
8. Transfer under aseptic conditions to sterile flasks.
9. Using a sterile pipette and filter sterilized solution to the autoclaved medium, shake well and
dispense into sterile cultures tubes or flasks under aseptic conditions.
Preparation of media:
The appropriate composition of the medium largely determines the success of the cultures. Plant
materials do vary in their nutritional requirements and therefore it is often necessary to modify
the medium to suit a particular tissue. Initially tissues and organs from a wide variety of plant
species were cultures on the nutrient salt solutions formulated by Gautheret and White. However,
these were found inadequate for sustaining growth of many plant tissues. This led to the
formation of several basal nutrient media (Hildebrandt et al., 1946; Burkholder & Nickel,1949;
Heller,1953; Murashige and Skoog,1962; Gamborg et al., 1968). In general, the medium
contains i) inorganic salts, ii)vitamins, iii)growth regulators, iv)carbon source and v) organic
supplements.
Inorganic salts:
These are divided into two groups: major and minor salts.
Major salts: The salts of potassium, nitrogen, calcium, magnesium, phosphorous and sulphur
constitute the major salts. Nitrogen is generally used as nitrate or ammonium salts, sulphur as
sulphates and phosphorus as phosphates.

International E – Publication
www.isca.co.in
International Science Congress Association
37
Minor salts: The salts of iron, zinc, manganese, boron, copper, cobalt, molybdenum, iodine,
etc.. make up the minor salts. These salts are essential for the growth of tissues and are required
in trace quantities.
Vitamins:
The B-vitamins play an important role in growth of tissues. Thiamine, nicotinic acid and
pyridoxine are generally incorporated in all media, although pantothenic acid, folic acid, biotin,
riboflavin, etc..have also been used.
Growth regulators:
Growth as well as differentiation of tissues in vitro is controlled by various growth regulators,
auxins, cytokinins, gibberellins, ethylene, abscisic acid, etc..
Auxins:
Indole acetic acid, indole butyric acid, naphthalene acetic acid, 2,4-dichlorophenoxy acetic acid
are the frequently used auxins. These are generally used at 0.1 to 10mg/l concentration in plant
tissue culture media. Naphthalene acetic acid and 2,4-dichlorophenoxy acetic acid are
thermostable and do not lose their activity on autoclaving. Whereas, Indole acetic acid is
thermolabile and loses most of their activity on autoclaving. Hence, it is sterilized by filtration.
Cytokinins:
Cytokinins have a profound effect on cell division and cell differentiation. Kinetin, zeatin and 6-
benzylamino purine, the commonly used cytokinins, are used in 0.1-10mg/l concentration.
Others:
Gibberellic acid, ethylene releasing compounds and abscisic acid are also incorporated in the
media.
Carbon sources:
Plant tissues in culture can utilize a variety of carbohydrates-sucrose, glucose, fructose, starch
and maltose. Sucrose, at 2-5% concentrations in the nutrient media, however, remains the most
widely used carbohydrate source.
Organic supplements:
Complex substance such as yeast –extract, malt-extract and casein hydrolysates are also added
(0.1- 1% w/v).
Among various plant extracts, liquid endosperm of immature (coconut water) is widely used (5-
20%v/v)
General methodology for media preparation:
Stock solutions of major salts, minor salts and vitamins are prepared to be used in the
preparation of media are stored in a refrigerator. For preparing 1 litre of the medium:

International E – Publication
www.isca.co.in
International Science Congress Association
38
1. Transfer appropriate amounts of stock solution of salts to 1 litre flasks.
2. Add vitamins, auxins, cytokinins and inorganic supplements.
3. Add a carbohydrate source such as sucrose (2-5%)
4. Adjust the pH to 5.6-5.8 using a pH meter.
5. Make up the volume to 1 litre with double distilled water.
6. Add powdered agar 8g/l for making the medium semisolid.
7. Cover the flask with paper of aluminium foil and keep in a steamer or water-bath at 1000C
for dissolving the agar.
8. Shake the flask well for the uniform distribution of agar.
9. Dispense the medium into culture tubes or flasks as the case may be.
10. Autoclave tubes or flasks containing medium at 1210C for 20 minutes.
11. Again steam the medium for 20 minutes on the following day (i.e the day after it is
prepared).
Surface sterilization of plant material:
Before inoculating the medium with the explants, it is necessary to surface sterilize it. There are
many sterilizing agents such as calcium hypochorite, chlorine water, bleaching powder, mercuric
chloride, hydrogen peroxide and ethylene oxide. The concentration of the sterilizing agent and
the duration of treatment varies with the plant material. These should be no damage to the
explants in the process of surface sterilization. The plant material should then be thoroughly
washed with sterile distilled water before transferring it to the nutrient medium.
a) Sterilization of seeds:
1. About 15-20 healthy seeds were selected and wash them thoroughly with water.
2. Now added 2-3 drops of liquid detergent 100ml of water and shake well for 5 minutes.
3. Pour off the detergent solution and wash thoroughly to remove any traces of the detergent.
4. Rinse seeds in 50ml of 70% ethanol for 1 minutes.
5. Wash thoroughly 3-4 times with single distilled water.
6. Transfer seeds in a sterile 250ml flask and add mercuric chloride solution (0.1%).
7. Treat for 20 minutes, shake the flask occasionally. All the operations thereafter should be
carried out under sterile conditions.
8. Transfer the flask to a sterile cabinet, decant the mercuric chloride solution and wash the
seeds thoroughly with sterile water to remove any traces of mercuric chloride.

International E – Publication
www.isca.co.in
International Science Congress Association
39
b) Sterilization of leaves:
1. Collect the apical portion about 20cm long from 6-8 month old plants.
2. Remove the outer green sheathing leaves with a scalpel till the inner thin and white leaves are
exposed.
3. Dip 2-3 cm long segments of this portion in 70%alcohol for 1 minute. Then follow the steps
1-8 as in sterilization of seeds.
4. Using sterile forceps, place segments in a sterile petridish and remove 1-2 outer leaves with
scalpel.
5. Cut the inner leaves into 5mm segments.
6. Transfer 1-2 leaf segments to each tube containing 20ml of semisolid medium.

International E – Publication
www.isca.co.in
International Science Congress Association
40
13. MICROPROPAGATION
Tissue culture is particularly useful for multiplication of plants which are slow growing
(turmeric, ginger, cardamom); cross- pollinated (coconut, teak, eucaluptus, cashew, mango and
those which show wide variation in the progeny); male-sterile lines (cotton, sorghum, pearl-
millet); newly produced varieties (normally vegetatively propagated); and for multiplication of
virus free plants by meristem cultures (sugarcane, potatoes, tapioca, etc..).
Tissue culture is now being commonly used for clonal propagation of a large number of
horticultural plants. Crop plants and also for forest trees (Murashige;1974; Conger,1981). The
success of clonal multiplication in higher plants depends generally on 3 main stages:
STAGE 1: ESTABLISHMENT OF AN ASEPTIC CULTURE
The explants taken from the plant has first to be made free of microorganisms which would
outgrow the plant tissue when placed on a nutrient medium. This would result in the death of the
explants. These surface contaminants, e.g. bacteria, fungi and yeast are removed by surface
sterilization prior to culture, but without killing the plant tissue.
STAGE 2: MULTIPLICATION
The surface sterilized material when inoculated on sterile nutrient media and incubated at
25±2ºC with a definite photoperiod and light intensity grows to form large nuber of shoots.
STAGE 3: ROOTING AND HARDENING OF PLANTS
The shoots obtained are carefully excised and transferred to a rooting medium, preferably a
liquid medium,containing an auxin and supported on a filterpaper platform in order to obtain
rooting in these shoots.
These plants which have rooted and have developed secondary roots with root hairs can be
transferred to pots containing soil:vermiculite mixture (1:1). This mixture is preautoclaved for 1
hour at 15 psi and steamed for 3 days successively and cooled. The potted plants can be
transferred to the field where the first new leaf emerges.
MULTIPLICATION BY SUBCULTURE AT STAGE 2
However, excised shoot tips can be inoculated on the same medium used in stage 2 instead of the
rooting media. By regular repetition of this subculture procedure, high rates of multiplication can
be achieved.
Vegetative multiplication of plants depends on various factors as nutrient medium, agar
concentration, photoperiod and light intensity, hydrogen ion concentration, size and source of the
explants (Conger,1983).

International E – Publication
www.isca.co.in
International Science Congress Association
41
Explants source:
Requirements:
a) Equipments
Conical flasks (100ml capacity)
Test tubes (25mm*150mm)
Petridishes (80mm diameter)
Pair of forceps and scalpel (15 cm long)
Environmental growth cabinets adjusted to 25º±2ºC with 18hr photoperiod and 1500lux
intensity and 15º±2º and 600 lux light intensity.
Shaker with 120rpm and 1000 lux light intensity.
b) Culture media, washing solutions, sterilizing agents
Glass distilled water
Sterile glass distilled water
0.5%HgCl solution
Detergent
Medium
c) Source tissue
Procedure
a. Sterilization of glassware
b. Preparation and sterilization of media
c. Explants collection:
1. Select a twig (60-90 cm long, 10-15mm wide) from mature elite trees and cut, making
sure that the twig contains many young axillary buds. The length is important in selecting
twig that do not wither before being brought to the laboratory.
2. Bring the twigs containing axillary bud to the laboratory, remove the leaves and cut them
into small pieces of about 5-8 cm.
3. Transfer the buds to a sterile 250ml conical flask and surface sterilize the explants.
d. Culture of buds:
1. Keep sterile petridishes, scalpel, forceps and medium inside a sterile cabinet along with
the flask containing surface-sterilized explants.

International E – Publication
www.isca.co.in
International Science Congress Association
42
2. Transfer these explants into sterile petri dishes with the help of a pair of sterile forceps
and cut these explants into small pieces of 10-15 mm each containing atleast one axillary
bud.
3. Inoculate 2 pieces to each tube containing medium.
4. Incubate the tubes in an environment growth cabinet at 15º±2º and 500 lux light intensity
for 72 hours.
5. Transfer the cultures after 72hr to another incubator maintained at 25º±2ºC with 16hr
photoperiod and 1500lux intensity.
6. After 25 days, the young buds start sprouting.
7. When the sprouts are 10-15mm long, transfer them to liquid medium in 100 ml
Erlenmeyer flasks.
8. Incubate the flasks on a rotatory shaker at 120 rpm and 500 lux light intensity.
9. Observe the formation of multiple shoots after 10-15 days.
e. Multiplication by subculture:
1. Transfer the multiple shoots from the flask to a sterile petridish aseptically.
2. Incubate the cultures in an environmental growth cabinet at 25º±2ºC and at 1000 lux light
intensity (12 hr photo periods) and observe the cultures regularly.
3. Observe the explants produces multiple shoots within 15 days.
4. Separate these shoots again aseptically and transfer the tubes containing medium for
shoot formation.
f. Transfer of plants to pots:
1. Remove the rooted plantlet from the tube and wash the roots gently with tap water to
remove any traces of medium.
2. Transfer the plantlets to soil: vermiculite (1:1) sterile mixture in a pot.
3. Irrigate with about 20 ml of tap water.
4. Keep the pots in a growth cabinet at 25º±2ºC and at 1000 lux light intensity and water
them.
5. Transfer the plants to the field after 8 days of hardening in which 70-80% plants survive.

International E – Publication
www.isca.co.in
International Science Congress Association
43
Result:
S.No. Number of bottles
inoculated
Number of explants
inoculated per bottle
Number of explants
developed per bottle
1.
Inference/Discussion:
______________________________________________________________________________
______________________________________________________________________________
______________________________________________________________________________
______________________________________________________________________________
_________________________________________________________________________

International E – Publication
www.isca.co.in
International Science Congress Association
44
14. CALLUS INDUCTION AND PRODUCTION OF SECONDARY METABOLITES
Plant tissues in cultures can be in the form of callus cultures, suspension cultures or organ
cultures.
Callus is basically a more or less non-organized tumor tissue which usually arises on wounds of
differentiated tissues and organs. Thus, in principle, it is a non-organized and little differentiated
tissue. The cells in callus are of a parenchymatous tissue.
Callus formation takes place under the influence of exogenously supplied growth regulators
present in nutrient medium. The type of growth regulator requirement and its concentration in
the medium depends strongly on the genotype and endogenous hormone extent of an explants.
Callus tissue induced from different plant species may be different in structure and growth habit:
white or coloured, soft (watery) or hard, friable (easy to separate into cells) or compact. The
callus growth within a plant species may also depend on factors such as the original position of
the explants within the plant, and the growth conditions.
After callus induction, the callus is grown further on a new medium which is referred to as sub
culturing. When sub cultured regularly on agar medium, callus cultures will exhibit an S-shaped
or sigmoid pattern of growth during each passage. There are five phases of callus growth:
1. Lag phase, where cells prepare to divide
2. Exponential phase, where the rate of cell division is highest.
3. Linear phase, where cell division slows but the rate of cell expansion increases.
4. Deceleration phase, where the rates of cell division and elongation decreases.
5. Stationary phase, where the number and size of cells remain constant
6. Callus growth can be monitored by fresh weight measurements, which are convenient for
observing the growth of cultures over time in a non-destructive manner.
Aim:
To induce callus from the leaves of _____plant.
Requirements:
1. Equipments
Conical flasks (100ml capacity)
Test tubes (25mm*150mm)
Petridishes (80mm diameter)
Pair of forceps and scalpel (15 cm long)
Environmental growth cabinets adjusted to 25º±2ºC with 18hr photoperiod and 1500lux
intensity and 15º±2º and 600 lux light intensity.
Shaker with 120rpm and 1000 lux light intensity.

International E – Publication
www.isca.co.in
International Science Congress Association
45
2. Culture media, washing solutions, sterilizing agents
Glass distilled water
Sterile glass distilled water
0.5%HgCl solution
Detergent
Medium
3. Source tissue
Procedure:
1. Transfer 1-2 leaf segments to each tube containing 20 ml of semisolid medium.
2. Incubate tubes at 25ºC in dark. Callus initiation starts after one week. Enough callus will be
observed within one month.
3. Place 5mm*5mm pieces of callus on the surface of fresh medium.
4. Incubate cultures at 25ºC in dark.
5. Repeat step 4 every month for maintaining the callus tissue.
Result:_______________________________________________________________________
______________________________________________________________________________
______________________________________________________________________________
________________________________________________________________
Inference/Discussion:
______________________________________________________________________________
______________________________________________________________________________
______________________________________________________________________________
______________________________________________________________________________
_________________________________________________________________________

International E – Publication
www.isca.co.in
International Science Congress Association
46
15. ISOLATION OF TANNINS, ALKALOIDS FROM TISSUE CULTURE GROWN
TISSUE & CHARACTERIZATION BY GCMS & FTIR
Introduction:
Plants produce a vast and diverse assortment of organic compounds, the great majority of which
do not appear to particulate directly in growth and development. These substances, traditionally
referred to as secondary metabolites, often are differentially distributed among limited taxonomic
groups within the plant kingdom. Their functions, many of which remain unknown, are being
elucidated with increasing frequency. The primary metabolites in contrast, such as phytosterols,
acyl lipids, nucleoyides, amino acids, and organic acids, are found in all plants and perform
metabolic roles that are evident. Based on their biosynthetic origins, plant secondary metabolites
can be divided into three major groups: the terpenoids, the alkaloids, and the phenylpropanoids
and allied phenolic compounds.
Alkaloids have a 3000 year history of human use. For much of human history, plant extract has
been used as ingredient in potions and poisons. In the eastern Mediterranean, use of latex of the
opium poppy ( Papavae soniferum) can be traced back at least to 1400- 1200BC . The
Sarpagandha root (Rauwolfia serpentina) has been used in India since approximately 1000BC.
Tannins are naturally occur in plant polyphenols and widely distributed in plant Kingdom. Their
main characteristic is that they bind and precipitate protein. They can have a large influence on
the nutritive value of many foods eaten by humans and feed stuff eaten by animals.
Aim:
To isolate tannins and alkaloids from tissue culture grown tissues and characterization by GCMS
and FTIR.
Principle:
Most alkaloids are precipitated from neutral or slightly acidic solution by Mayer’s reagent to
give a cream coloured precipitate. This is due to halogenations followed by complex reaction
mechanism. Gas chromatography (GC) can separate volatile and semi volatile compounds with
great resolution, but it cannot identify them. Therefore, it was not surprising that the combination
of the two techniques was suggested shortly after development of GC. GC works on principle
that a mixture will separate into individual substances when heated. The separated substances
flow into the MS, which identifies compounds by the mass of the analyst maolecule.
Materials required:
Callus, water bath, Mayers reagent, HCl, ethanol, bezene, chloroform, water, etc..
Procedure:
Isolation of alkaloids:
1. Weigh 50mg of plant material and add ethanol

International E – Publication
www.isca.co.in
International Science Congress Association
47
2. Mix well and incubate for 48 hours.
3. Allow the above mixture to evaporate by using water bath at 60ºC for about 15
minutes.
4. Dispense the above extract in dilute HCl and mix thoroughly
5. Filter the extract and add few drops of Mayer’s reagent.
6. Observe the change in color creamy precipitate.
a) Isolation of tannins:
1. Weigh 50mg of plant material and add ethanol
2. Mix well and incubate for 48 hours.
3. Allow the above mixture to evaporate by using water bath at 60ºC for about 20
minutes.
4. Dispense the above extract in dilute HCl and mix thoroughly
5. Filter the extract and add few drops of ferric chloride.
6. Observe the change in color green colour.
7.
b) Characterization by FTIR and GCMS
Analyse the extract in GCMS and FTIR and observe the results.
Result:_______________________________________________________________________
______________________________________________________________________________
______________________________________________________________________________
________________________________________________________________
Inference/Discussion:
______________________________________________________________________________
______________________________________________________________________________
______________________________________________________________________________
______________________________________________________________________________
_________________________________________________________________________

International E – Publication
www.isca.co.in
International Science Congress Association
48
16. PREPARATION OF SYNTHETIC SEEDS
Introduction:
The concept of artificial seeds was first introduced in 1970 as a noble analogue to plant seeds.
The production of artificial seeds is especially useful for plants which do not produce viable
seeds. It represents a method to propagate these plants. Artificial seeds are small sized and this
provides further advantage to storage, handling, shipping and planting.
Artificial seeds are the living seed like structures derived from somatic embryoids in vitro culture
which is produced by encapsulating a plant propagule in a matrix and will allow it to grow into a
plant. The preserved embryoids are also called synthetic seeds. The three major parts of a seeds
are endosperm, embryo, testa. In the production of artificial seeds, an artificial endosperm can be
created within the encapsulating matrix.
Aim:
To prepare synthetic seeds from _____ and test their viability.
Principle:
The major principle involved in the alginate encapsulation process is that the sodium alginate
droplets containing the somatic embryo when dropped into the CaCl2. 2H2O solution. The
hardness or rigidity of the capsule mainly depends upon the number of sodium ions exchanged
with calcium ions. Hence, the concentration of the two gelling i.e., sodium alginate and
CaCl2.2H2O and complexing should be standardized for the formation of capsule.
Materials required:
Plant material, 2-4% sodium alginate solution in MS basal media, Calcium or sodium nitrate,
sterile distilled water, pipette.
Procedure:
Dropping method:
1. Mix the seeds with 2%-4% sodium alginate prepared in MS-basal medium.
2. With the help of pipette (with desirable pore diameter) drop the embryos in the bath of
calcium salt e.g., Ca(No3)2 or CaCl2.2H2O solution (75-100mM) for 30 minutes. This results
in very quick complex formation at the surface due to exchange of ions (i.e) Na+ and Ca+.
Consequently, enclose individual seeds into clear and hardened beads of about 4mm
diameter.
3. Rinse the artificial seeds with sterile water and then sieve the beads through a nylon mesh.
4. Store beads at 4ºC or use as synthetic seeds for immediate sowing.

International E – Publication
www.isca.co.in
International Science Congress Association
49
Result:
S.No No. of seeds inoculated No. of seeds germinated % viability
1
Inference/Discussion:
______________________________________________________________________________
______________________________________________________________________________
______________________________________________________________________________
______________________________________________________________________________
_________________________________________________________________________

International E – Publication
www.isca.co.in
International Science Congress Association
50
ANIMAL BIOTECHNOLOGYANIMAL BIOTECHNOLOGYANIMAL BIOTECHNOLOGYANIMAL BIOTECHNOLOGY

International E – Publication
www.isca.co.in
International Science Congress Association
51
17. PREPARATION OF PRIMARY CULTURE
Introduction to animal cell culture:
Animal cell cultures were successfully undertaken by Ross Harrison in 1907. Several
developments occurred which made cell cultures a widely available tool. First there was the
development of antibiotics that made it easier to avoid contamination problems. Second, was the
development of techniques such as the use of Trypsin to remove cells from culture vessels.
Third, development of standardized chemically defined culture media that made cells grows
easier.
When the cells are surgically removed from an organism and placed into a suitable
culture environment, they will attach, divide and grow. This is called primary cultures. When the
cells in primary culture vessel have grown, and filled up all the available culture, substrate they
must be sub cultured to give them space for continuous growth. This is usually done by enzyme
treatment or by gently scrapping the cells off the bottom of the culture vessels.
Establishment of chick embryo fibroblast primary cultures:
Embryo is very good source for processing primary culture. A primary culture is a heterogeneous
culture having definite life span and limited population doublings.
Aim:
To initiate the primary culture of fibroblast from 9th
day old chick embryo.
Principle:
Embryo from an embryonated egg is a potent source of fibroblastic cells. The embryo is
carefully isolated mechanically and enzymatically disaggregated. Trypsin is the most commonly
used proteolytic enzyme to disaggregate the tissue. The action of trypsin is neutralized by the
addition of media, containing serum which has anti-trypsin. The cells are then pelleted and
seeded to the flask at 1x10⁻⁶
cells /ml per flask and incubated at 37°C, 5% CO2 for the formation
of confluent monolayer. This gives the primary culture. The primary culture of fibroblastic cell
has typical spindle shape morphology. When viewed under a inverted microscope.
Materials required:
Embryonated chick eggs (9days old), 70% ethanol, sterile scissors, bent scissors, forceps, sterile
petriplates, pipettes, sterile 1*PBS, culture flask, funnel with muslin cloth, centrifuge inverted
microscope, canted neck flask.
Media: RPMI 1640, Penicillin-Streptomycin, trypsin
Procedure:
1. Examine 9th
day embryonated egg under a bright light source for its viability (the live embryo
can be seen as a shadow).
2. Place the egg in a beaker with the blunt end up and swab with 70% ethanol.

International E – Publication
www.isca.co.in
International Science Congress Association
52
3. Puncture the top of the egg gently with a pair of sterile forceps and remove the shell thus
exposing the underlining, chorioallantoic membrane (care should be taken that the shell
should not fall into the egg).
4. Cut chorioallantoic membrane with a pair of sterile scissors such that the embryo gets
exposed.
5. Remove the embryo gently by the neck using a sterile forceps and transfer to a petridish
containing 1X PBS and wash twice or thrice to remove the yolk or blood.
6. Using forceps, remove the head, lymph and viscera. Transfer the remaining tissues to another
petridish. With 1X PBS, mix the embryo thoroughly using a pair of scissors and allow pieces
to settle.
7. Add 8ml of 1:125 trysin versene phosphate (TVP) to the minced tissue and incubate at 37ºC
for 15 minutes.
8. Neutralize the trypsin by adding an equal volume of RPMI1640 medium with serum.
9. Filter the cells through a sterile muslin cloth (Prewetted with 1X PBS) to remove the debris
and centrifuge the cell suspension at 1000rpm for 20 minutes.
10. Resuspend the pellet in fresh RPMI 1640 medium with serum and take 0.1ml to a
haemocytometer and count for viability with Trypan Blue dye.
11. Then take the cells in 25cm2 canted neck flask with 1X10
6 cells/ml flask and incubate at
37ºC with 5% CO2 in a CO2 incubator.
12. Observe the following day under an inverted microscope.
Result:_______________________________________________________________________
______________________________________________________________________________
______________________________________________________________________________
________________________________________________________________
Inference/Discussion:
______________________________________________________________________________
______________________________________________________________________________
______________________________________________________________________________
______________________________________________________________________________
_________________________________________________________________________

International E – Publication
www.isca.co.in
International Science Congress Association
53
18. PASSAGING & CELL VIABILITY CHECK BY TRYPHAN BLUE METHOD
Aim:
To passage the primary culture of chick embryo fibroblast and to check cell viability by using
trypan blue method.
Principle:
First, subculture represents an important transition for a culture. The need to subculture implies
that the primary culture has increased to occupy all of the available substrates. Hence cell
proliferation has become an important features. Although the primary culture may have a
variable growth fraction depending on the types of cells present in the culture after the first
subculture, the growth fraction is usually high(80% or more) from a very heterogenous primary
culture containing many of the cell types present in the original tissue, a more homogenous cell
lines emerges.
Materials required:
1XPBS, Trypsin, RPMI 1640, culture vessel with primary culture.
Protocol:
1. Remove the spent cell culture medium and discard from the culture vessel.
2. Wash the cells using 1XPBS by adding it on the sides of the vessel opposite to the attached
cell layer to avoid disturbing the cell layer. Rock the vessel back and forth several times.
3. Remove the wash solution and discard from culture vessel.
4. Add the pre-warmed dissociation reagent (Trypsin) to the side of the flask. Gently rock the
container to get the complete coverage of the cell layer.
5. Incubate the culture vessel at room temperature for approximately 2 minutes.
6. Observe the cells under microscope for detachment.
7. Add equal volume of prewarmed growth medium with serum. Dispense the medium by
pipette over the cell layer surface several times.
8. Transfer the cells to 15ml of conical tubes and spin at 1000rpm for 5-10minutes.
9. Resuspend the cell pellet in a minimal volume of prewarmed complete growth medium and
remove a sample for counting.
10. Determine the total number of cells and % viability using the haemocytometer.
11. Dilute the cell suspension to the seeding density and pipette out the approximate volume into
a new culture and incubate.
Tryphan Blue Count for Viability:
Quantitation in cell culture in required for the characteristics of the growth properties of different
cell lines for experimental analysis and to establish reproducible culture conditions for the
consistency of primary culture and maintenance of cell lines.

International E – Publication
www.isca.co.in
International Science Congress Association
54
Materials required:
Haemocytometer chamber, microscope, coverslip, Tryphan blue dye, alcohol for cleaning,
buffered isotonic salt solution of pH 7.2-7.3 (i.e PBS) for preparation of 0.4% of tryphan blue.
Protocol:
1. Clean the chamber with alcohol and place coverslip on it.
2. Add 10µl of the harvested cells to the haemocytometer and it should not be overfilled.
3. Place the chamber in inverted microcope under 10X objective and under phase contrast to
distinguish the cells.
4. Count the cells in large central gridded square (1mm square). Determine the cell density
using haemocytometer.
5. Prepare 0.4% of Tryphan blue in PBS and add 0.1ml of it to 1ml of the cells.
6. Load on haemocytometer and examine immediately under the microscope at low
magnification.
7. Count the number of blue stained cells and number of total cells and calculate the cell
viability. It should be at least 95% for healthy log phased culture.
Result:
% Viability = Number of live cells – Number of dead cells
____________________________________
Total number of cells
Result:_______________________________________________________________________
______________________________________________________________________________
______________________________________________________________________________
________________________________________________________________
Inference/Discussion:
______________________________________________________________________________
______________________________________________________________________________
______________________________________________________________________________
______________________________________________________________________________
_________________________________________________________________________

International E – Publication
www.isca.co.in
International Science Congress Association
55
19. MTT ASSAY
Introduction:
Measurement of cell viability and proliferation forms the basis for numerous in vitro assays of a
cell population’s response to extend factors. The reduction of tetrazolium salts is now widely
accepted as a reliable way to examine cell proliferation. The yellow tetrazolium MTT (3-(4,5
dimethylthiazolyl-2)-2,5-diphenyltetrazolium bromide) is reduced by metabolically active cells,
in part by the action of dehydrogenase enzymes, to generate reducing equivalents such as NADH
and NADPH. The resulting intracellular purple formazan can be solubilized and quantified by
spectrophotometric method.
Aim:
To check cell viability and cell proliferation by MTT assay.
Principle:
Cells in the exponential phase of growth are exposed to a cytotoxic drug. The duration of
exposure is usually determined as the time required for maximal damage to occur, but is also
influenced by the stability of the drug. After removal of the drug, the cells are allowed to
proliferate for two to three population doubling times (PDTs) in order to distinguish between
cells that remain viable and are capable of proliferation and those that remain viable but cannot
proliferate. The number of surviving cells is then determined indirectly by MTT dye reduction.
The spectrophotometrically once the MTT-formazan has been dissolved in a suitable solvent.
Materials required:
Growth medium, Trypsin, MTT, microtitre plate (flat-bottomed), microtitre plate reader with
650-570nm filters, inverted microscope, sterile tubes, multichannel pipette, serological pipette,
37ºC incubator, sterile pipette tips, Laminar air flow chamber.
Protocol:
1. Add 3ml of Ficol hypaque to the centrifuge tube.
2. Carefully layer the diluted blood sample (4ml) on Ficol hypaque. When layering, do not mix
Ficol hypaque and diluted blood.
3. Centrifuge at 400Xg for 30-40 minutes at 18-20ºC.
4. Draw off the upper layer using a clean Pasteur pipette, leaving the lymphocyte layer
undisturbed at interphase. Care should be taken not to disturb lymphocyte layer. The upper
layer of plasma, which is essentially free of cells, may be saved for later use.
5. Carefully remove the lymphocyte, and suspend in balanced salt solution.
6. Prepare the cells for MTT assay.
7. Add the suspended cells for about 50µl onto the wells from 1-6 of the microtitre plate among
which 1st well is the control.
8. Add 5 fold dilution of cytotoxic drug serially from the well 2-6
9. Make up the volume to 200µl with sterile RPMI1640 medium and allow the cells to grow.

International E – Publication
www.isca.co.in
International Science Congress Association
56
10. Incubate the cells for 24 hours.
11. After incubation, discard the medium and add 50µl of MTT to all the wells and allow to
incubate for 4 hours.
12. At the end of 4 hours, remove the medium and MTT from the wells and dissolve the
remaining MTT formazan crystals by adding 200µl of DMSO to all the wells.
13. Record the absorbance at 570nm immediately using an ELISA plate reader.
14. Plot a graph of absorbance (Y axis) against drug concentration (X axis).
15. Determine the IC50 concentration as the drug concentration, that is required to reduce the
absorbance to half that of the control.
Result:_______________________________________________________________________
______________________________________________________________________________
______________________________________________________________________________
________________________________________________________________
Inference/Discussion:
______________________________________________________________________________
______________________________________________________________________________
______________________________________________________________________________
______________________________________________________________________________
_________________________________________________________________________

International E – Publication
www.isca.co.in
International Science Congress Association
57
20. MICRONUCLEUS TEST
Introduction:
The micronucleus (MN) test is a part of the battery of tests that many new products must go
through prior to bringing them to market.
The in vitro micronucleus assay is a mutagenic test system for the detection of chemicals which
induce the formation of small membrane bound DNA fragmentation (i.e) micronuclei in the
cytoplasm of interphase cells. These micronuclei may originate from acentric fragments
(chromosome fragments lacking a centromere) or whole chromosomes which are unable to
migrate with the rest of the chromosomes during the anaphase of cell division.
Aim:
To perform micronucleus test with buccal cells.
Principle:
Cell cultures (V79TM) are exposed to the teat substance both with and without metabolic
activation. After exposure to a test substance, and addition of cytochalasin B for blocking
cytokinesis cell cultures are grown for a period sufficient to allow chromosome damage to lead
to the formation of micronuclei in bi- or multinucleated interphase cells. Harvested and stained
interphase cells are then analysed microscopically for the presence of micronuclei. Micronuclei
are scored in those cells that complete nuclear division following exposure to test them.
The purpose of the micronucleus assay is to detect those agents which modify chromosome
structure and segregation in such a way as to lead to induction of micronuclei in interphase cells.
The following criteria for MN analysis were used in oral epithelial cells. A micronucleus
a) Must be less than one third the diameter of the main nucleus.
b) Must be on the same focal plane.
c) Must have the same color, texture and refraction as the main nucleus.
d) Must have a smooth oval or round shape; and
e) Must be clearly separated from the main nucleus.
Material required:
Buccal cells, soft tooth brush, eppendorf tubes, PBS at pH 7.0, cold methanol:acetic acid (3:1),
2% Giemsa stain, light microscope.
Protocol:
1. Collect buccal smear from the participant (who need to wash his mouth with water before).
2. Place it on slide.
3. Spread the sample with a drop of water and allow to dry.
4. Dip the slide in a mixture of Glacial acetic acid: methanol (3:1) for about 1 minute.
5. Dry the slides and stain with Giemsa stain for about 2-3 minutes.

International E – Publication
www.isca.co.in
International Science Congress Association
58
6. Wash the slide with tap water and air dry it.
7. View the slide under microscope and count the number of micronucleus present in the
sample.
Result:_______________________________________________________________________
______________________________________________________________________________
______________________________________________________________________________
________________________________________________________________
Inference/Discussion:
______________________________________________________________________________
______________________________________________________________________________
______________________________________________________________________________
______________________________________________________________________________
_________________________________________________________________________

International E – Publication
www.isca.co.in
International Science Congress Association
59
NANOTECHNOLOGYNANOTECHNOLOGYNANOTECHNOLOGYNANOTECHNOLOGY

International E – Publication
www.isca.co.in
International Science Congress Association
60
21. SYNTHESIS AND CHARACTERIZATION OF SILVER
NANOPARTICLE
Introduction:
One key aspect of nanotechnology concerns the development of the rapid and reliable
experiment protocols for the synthesis of nanomaterials over a range of chemical compositions,
sizes, high monodispersity and large scale production. A variety of techniques have been
developed to synthesis metal nanoparticles including chemical reduction using number of
chemical reductants such as NaBH4, N2H4, NH2OH, ethanol, ethylene glycol and N,N-dimethyl
formamide (DMF), aerosol technique, electrochemical or sonochemical deposition,
photochemical reduction and laser irradiation technique.
Many method, a chemical reduction method (Chu et al., 2005), a polyol method (Lin & Yang,
2005) and radiolytic process (Shim et al., 2004) have been developed for the synthesis of silver
nanoparticles. Among the methods, chemical reduction was widely studied, due to its advantages
of yielding nanoparticles without aggregation, high yield and low preparation cost (Kim et al.,
2004).
Aim:
To synthesis silver nanoparticle by chemical reduction method and biological method and to
characterize synthesized silver nanoparticle by UV-Spectrophotometry, FTIR and SEM.
Principle:
The chemical reduction method involves the reduction of AgNO3 in aqueous solution by
a reducing agent in the presence of a suitable stabilizer, which is necessary in protecting the
growth of the silver particles through aggregation. In the formation of silver nanoparticles by the
chemical reduction method, the particle size and aggregation state of the silver nanoparticles are
affected by various parameters such as initial AgNO3 concentration, reducing agent, AgNO3
molar ratios and stabilizer concentration (Song et al., 2009). The silver nanoparticles were
prepared by using chemical method (Fang et al., 2005). All solutions of reacting materials were
prepared in double distilled water. In typical experiment, 50ml of 1*10-3
M AgNO3 was boiled
and to this solution 5ml of 1% trisodium citrate was added drop by drop and mixed vigorously
until colour change is evident (pale brown). Then it was removed from boiling and stirred until
cooled to room temperature
Mechanism of reaction could be expressed as follows:
4Ag + C6H5O7 Na3+ 2H2O 4AgO + C6H5O7H3 + 3Na+ + H
+ + O2
The aqueous solution air dried up to 3 days and the dry powdered particles that were taken for
further analysis.

International E – Publication
www.isca.co.in
International Science Congress Association
61
Materials Required:
1mM silver nitrate (50ml)
15 Trisodium citrate (5ml)
Ethanol
Double distilled water
Stirrer
Orbital shaker
UV-Spectroscopy, FTIR, SEM for characterization
Protocol:
a) Chemical Reduction Method:
1. Boil 50ml of silver nitrate in boiling water bath.
2. To the solution, add 5 ml of tri sodium citrate drop by drop.
3. Stir vigorously and boil thoroughly until the change of color is evident.
4. Observe the pale brown color solution after boiling.
5. Cool down the solution to room temperature.
6. Centrifuge the solution at 8000rpm for 10 minutes.
7. Wash the pellet thrice with ethanol.
8. Characterize the nanoparticles by UV-Vis, FTIR and SEM.
b) Biological method :
1. Weigh 10g of biological material and add 100ml of water
2. Boil the solution for 15 minutes at 800C and filter it. Collect the filtrate in a beaker.
3. Add 90ml of 1mM silver nitrate to 10 ml of the filtrate.
4. Boil the solution for 20 minutes.
5. Observe color change from reddish brown.
6. Cool down the solution to room temperature.
7. Centrifuge the solution at 8000rpm for 10 minutes.
8. Wash the pellet thrice with ethanol.
9. Characterize the nanoparticles by UV-Vis, FTIR and SEM.

International E – Publication
www.isca.co.in
International Science Congress Association
62
c) Characterization of silver nanoparticle:
UV-Visible absorption spectroscopy:
1. With the resolution of 1nm, formation of metal nanoparticles was verified by recording the
UV-Visible absorption spectrum provided surface plasmon resonance exists for the metal.
2. The synthesized silver nanoparticle reveals a strong band surface palsmon peak located at
390-420nm.
Fourier Transform Infra Red Spectroscopy:
1. Prepare KBr pellets by excessive grinding with the sample.
2. Insert the pellet into IR sample holder and attach the scotch tape.
3. Run IR spectrum and observe the presence of silver nanoparticle.
Scanning Electron Microscope:
Completely dry the sample and analyze in SEM for observing its size & morphology
Result:_______________________________________________________________________
______________________________________________________________________________
______________________________________________________________________________
________________________________________________________________
Inference/Discussion:
______________________________________________________________________________
______________________________________________________________________________
______________________________________________________________________________
______________________________________________________________________________
_________________________________________________________________________

International E – Publication
www.isca.co.in
International Science Congress Association
63
22. ATOMIC FORCE MICROSCOPY AND TRANSMISSION
ELECTRON MICROSCOPE
Atomic Force Microscope
The Atomic Force Microscope was developed to overcome a basic drawback with STM - that it
can only image conducting or semiconducting surfaces. The AFM, however, has the advantage
of imaging almost any type of surface, including polymers, ceramics, composites, glass, and
biological samples.
Binnig, Quate, and Gerber invented the Atomic Force Microscope in 1985. Their original AFM
consisted of a diamond shard attached to a strip of gold foil. The diamond tip contacted the
surface directly, with the interatomic van der Waals forces providing the interaction mechanism.
Detection of the cantilever’s vertical movement was done with a second tip - an STM placed
above the cantilever.
AFM probe deflection
Today, most AFMs use a laser beam deflection system, introduced by Meyer and Amer, where a
laser is reflected from the back of the reflective AFM lever and onto a position-sensitive
detector. AFM tips and cantilevers are microfabricated from Si or Si3N4. Typical tip radius is
from a few to 10s of nm.
Measuring forces
Because the atomic force microscope relies on the forces between the tip and sample, knowing
these forces is important for proper imaging. The force is not measured directly, but calculated
by measuring the deflection of the lever, and knowing the stiffness of the cantilever. Hook’s law
gives F = -kz, where F is the force, k is the stiffness of the lever, and z is the distance the lever is
bent.

International E – Publication
www.isca.co.in
International Science Congress Association
64
AFM Modes of operation
Because of AFM’s versatility, it has been applied to a large number of research topics. The
Atomic Force Microscope has also gone through many modifications for specific application
requirements.
Contact Mode
The first and foremost mode of operation, contact mode is widely used. As the tip is raster-
scanned across the surface, it is deflected as it moves over the surface corrugation. In constant
force mode, the tip is constantly adjusted to maintain a constant deflection, and therefore
constant height above the surface. It is this adjustment that is displayed as data. However, the
ability to track the surface in this manner is limited by the feedback circuit. Sometimes the tip is
allowed to scan without this adjustment, and one measures only the deflection. This is useful for
small, high-speed atomic resolution scans, and is known as variable-deflection mode.
Because the tip is in hard contact with the surface, the stiffness of the lever needs to be less that
the effective spring constant holding atoms together, which is on the order of 1 - 10 nN/nm. Most
contact mode levers have a spring constant of < 1N/m.
Lateral Force Microscopy
LFM measures frictional forces on a surface. By measuring the “twist” of the cantilever, rather
than merely its deflection, one can qualitatively determine areas of higher and lower friction.
Noncontact mode
Noncontact mode belongs to a family of AC modes, which refers to the use of an oscillating
cantilever. A stiff cantilever is oscillated in the attractive regime, meaning that the tip is quite
close to the sample, but not touching it (hence, “noncontact”). The forces between the tip and
sample are quite low, on the order of pN (10 -12
N). The detection scheme is based on measuring
changes to the resonant frequency or amplitude of the cantilever.
Dynamic Force / Intermittant-contact / “tapping mode” AFM
Commonly referred to as “tapping mode” it is also referred to as intermittent-contact or the more
general term Dynamic Force Mode (DFM). A stiff cantilever is oscillated closer to the sample
than in noncontact mode. Part of the oscillation extends into the repulsive regime, so the tip
intermittently touches or “taps” the surface. Very stiff cantilevers are typically used, as tips can
get “stuck” in the water contamination layer. The advantage of tapping the surface is improved
lateral resolution on soft samples. Lateral forces such as drag, common in contact mode, are
virtually eliminated. For poorly adsorbed specimens on a substrate surface the advantage is
clearly seen.
Force Modulation
Force modulation refers to a method used to probe properties of materials through sample/tip
interactions. The tip (or sample) is oscillated at a high frequency and pushed into the repulsive

International E – Publication
www.isca.co.in
International Science Congress Association
65
regime. The slope of the force-distance curve is measured which is correlated to the sample's
elasticity. The data can be acquired along with topography, which allows comparison of both
height and material properties.
Phase Imaging
In Phase mode imaging, the phase shift of the oscillating cantilever relative to the driving signal
is measured. This phase shift can be correlated with specific material properties that effect the
tip/sample interaction. The phase shift can be used to differentiate areas on a sample with such
differing properties as friction, adhesion, and viscoelasticity. The technique is used
simultaneously with DFM mode, so topography can be measured as well.
High Resolution TEM (HRTEM)
After understanding that an accelerated electron beam can have a very high resolving
power, we then move on to see how one can use this electron beam in imaging technology. There
are 3 types of electron microscopes, namely the transmission electron microscope (TEM),
scanning electron microscope (SEM), and scanning tunneling microscope (STM). A TEM
contains four parts: electron source, electromagnetic lens system, sample holder, and imaging
system
Electron Source
The electron source consists of a cathode and an anode.
The cathode is a tungsten filament which emits electrons when being heated. A negative cap
confines the electrons into a loosely focused beam (Fig. 5). The beam is then accelerated towards
the specimen by the positive anode. Electrons at the rim of the beam will fall onto the anode
while the others at the center will pass through the small hole of the anode. The electron source
works like a cathode ray tube.
Electromagnetic lens system
After leaving the electron source, the electron beam is tightly focused using electromagnetic lens
and metal apertures. The system only allows electrons within a small energy range to pass
through, so the electrons in the electron beam will have a well-defined energy.
1. Magnetic Lens: Circular electro-magnets capable of generating a precise circular magnetic
field. The field acts like an optical lens to focus the electrons.
2. Aperture: A thin disk with a small (2-100 micrometers) circular through-hole. It is used to
restrict the electron beam and filter out unwanted electrons before hitting the specimen.
Sample holder
The sample holder is a platform equipped with a
mechanical arm for holding the specimen and controlling its position

International E – Publication
www.isca.co.in
International Science Congress Association
66
Imaging system
The imaging system consists of another electromagnetic lens system and a screen. The
electromagnetic lens system contains two lens systems, one for refocusing the electrons after
they pass through the specimen, and the other for enlarging the image and projecting it onto the
screen. The screen has a phosphorescent plate which glows when being hit by electrons. Image
forms in a way similar to photography.
Working principle
TEM works like a slide projector. A projector shines a beam of light which transmits through the
slide. The patterns painted on the slide only allow certain parts of the light beam to pass through.
Thus the transmitted beam replicates the patterns on the slide, forming an enlarged image of the
slide when falling on the screen.
TEMs work the same way except that they shine a beam of electrons (like the light in a slide
projector) through the specimen (like the slide). However, in TEM, the transmission of electron
beam is highly dependent on the properties of material being examined. Such properties include
density, composition, etc. For example, porous material will allow more electrons to pass
through while dense material will allow less. As a result, a specimen with a non-uniform density
can be examined by this technique. Whatever part is transmitted is projected onto a phosphor
screen for the user to see.

International E – Publication
www.isca.co.in
International Science Congress Association
67
ABOUT THE AUTHORS
Dr S R Madhan Shankar had his M Sc in Biotechnology from Dr GRD
College of Science in 2001, M.Phil-Biotechnology from Bharathidasan
University in 2004 and was awarded with PhD in Systematic Botany by
the Bharathiar University in 2010. He did his PhD at the Institute of Forest
Genetics and Tree Breeding, Coimbatore. Presently he is working as
Assistant Professor in Biotechnology at PSG College of Arts & Science,
Coimbatore since November 2005. He has over 12 years of teaching experience spanning
teaching UG & PG students of Biotechnology and handle projects for the individual students
in the field of Plant Molecular Markers and Nanobiotechnology. He has guided around 50
students to obtain their Masters degree. He is currently guiding two PhD students. He is a
life member of the Indian Society of Human Genetics, Indian Immunological Society, and
Society for Applied Biotechnology and was selected to be the Senior Member of the Asia-
Pacific Chemical, Biological& Environmental Engineering Society (APCBEES), Hongkong in
the year 2012. He is an expert member of Board of studies in various colleges. He was
awarded with Fellow Award 2010 for his outstanding contribution in the field of Forest
Biotechnology by the Society of Applied Biotechnology. He has published 8 papers in
Journals, 3 in magazines and 5 in proceedings. He has presented 12 papers in various national
and international seminars/conferences. He has worked as resource person in 15
workshops/training programmes. He has organized 3 exhibitions for Popularization of
Science sponsored by the Tamil Nadu State Council for Science & Technology, Chennai. He
has attended several conferences, trainings and workshops and is also an online tutor. He is
University First Rank and Gold Medalist in BSc Biotechnology and the recipient of Subbiah-
Dharmanithi Gold Medal and Govt. of India PG Scholarship.

International E – Publication
www.isca.co.in
International Science Congress Association
68
Dr. E. M. Rajesh, graduated from PEE GEE College of Arts & Science
(Microbiology) 2001, did his Post Graduate (Microbiology) from
Sengunthar Arts &Science College, Tiruchengode, INDIA. M. Phil and Ph.
D both from the PG & Research Department of Microbiology, PSG
College of Arts & Science, affiliated to Bharathiar University, Coimbatore,
INDIA. He also has a Masters in Business Administration (Hospital
Management). He has 5 years of industrial and research experience, presently he is working
as Assistant Professor in Biotechnology at PSG College of Arts & Science, Coimbatore since
February 2011. He has over 4 years of teaching experience spanning teaching UG & PG
students of Biotechnology and handled projects for the individual students in the field of
textile Biotechnology and nanoparticles in protective textiles. He is also a life member of the
Indian Society of Human Genetics, Indian Immunological Society, and Society for Applied
Biotechnology and was selected to be the Senior Member of the Asia-Pacific Chemical,
Biological& Environmental Engineering Society (APCBEES), Hongkong in the year 2013. He
has so far authored 14 research papers in national and international journals and 15 research
papers in the proceedings of national and international conferences/seminars. His research
interests are mainly focused on the surface modification of textile substrate using microbial
extracellular combinatorial enzymes and enhancements of antimicrobial efficacy of cotton
fabrics using enzymes.