a practical method for monitoring fret-based biosensors …static.medicine.iupui.edu/obrien/2-tao...
TRANSCRIPT
CALL FOR PAPERS Cell Signaling: Proteins, Pathways and Mechanisms
A practical method for monitoring FRET-based biosensors in living animalsusing two-photon microscopy
Wen Tao,1 Michael Rubart,2 Jennifer Ryan,1 Xiao Xiao,4 Chunping Qiao,4 Takashi Hato,1
Michael W. Davidson,3 Kenneth W. Dunn,1 and Richard N. Day5
1Department of Medicine, Division of Nephrology, Indiana University Medical Center, Indianapolis, Indiana; 2Riley HeartResearch Center, Wells Center for Pediatric Research, and Krannert Institute of Cardiology, Indiana University School ofMedicine, Indianapolis, Indiana; 3National High Magnetic Field Laboratory and Department of Biological Science, TheFlorida State University, Tallahassee, Florida; 4Division of Molecular Pharmaceutics, Eshelman School of Pharmacy,University of North Carolina at Chapel Hill, Chapel Hill, North Carolina; and 5Department of Cellular and IntegrativePhysiology, Indiana University School of Medicine, Indianapolis, Indiana
Submitted 23 June 2015; accepted in final form 25 August 2015
Tao W, Rubart M, Ryan J, Xiao X, Qiao C, Hato T, DavidsonMW, Dunn KW, Day RN. A practical method for monitoringFRET-based biosensors in living animals using two-photon micros-copy. Am J Physiol Cell Physiol 309: C724–C735, 2015. Firstpublished September 2, 2015; doi:10.1152/ajpcell.00182.2015.—Thecommercial availability of multiphoton microscope systems has nur-tured the growth of intravital microscopy as a powerful technique forevaluating cell biology in the relevant context of living animals. Inparallel, new fluorescent protein (FP) biosensors have become avail-able that enable studies of the function of a wide range of proteins inliving cells. Biosensor probes that exploit Förster resonance energytransfer (FRET) are among the most sensitive indicators of an array ofcellular processes. However, differences between one-photon andtwo-photon excitation (2PE) microscopy are such that measuringFRET by 2PE in the intravital setting remains challenging. Here, wedescribe an approach that simplifies the use of FRET-based biosensorsin intravital 2PE microscopy. Based on a systematic comparison ofmany different FPs, we identified the monomeric (m) FPs mTurquoiseand mVenus as particularly well suited for intravital 2PE FRETstudies, enabling the ratiometric measurements from linked FRETprobes using a pair of experimental images collected simultaneously.The behavior of the FPs is validated by fluorescence lifetime andsensitized emission measurements of a set of FRET standards. Theapproach is demonstrated using a modified version of the AKARprotein kinase A biosensor, first in cells in culture, and then inhepatocytes in the liver of living mice. The approach is compatiblewith the most common 2PE microscope configurations and should beapplicable to a variety of different FRET probes.
two-photon excitation; Förster resonance energy transfer; fluorescentproteins; intravital microscopy; biosensor probe; PKA activity
THE IMAGING OF CELLULAR ACTIVITIES within the tissues of liveanimals using 2-photon excitation (2PE) microscopy has be-come a powerful tool for determining how cells function intheir natural environment (43, 11, 6). Since measurements ofcellular activities obtained by intravital microscopy (IVM) aremade in the context of intact tissue within the living organism,they can provide a unique perspective on disease processes andthe evaluation of therapeutic strategies. The use of exogenous
fluorophores, including the fluorescent proteins (FPs), to gen-erate image contrast has greatly enhanced the utility of IVM(25). Of particular interest are the genetically encoded fluores-cent reporters, known as biosensor proteins, which allow non-invasive monitoring of the spatial and temporal regulation ofcell signaling or metabolic events in situ. The biosensor pro-teins combine reporter modules containing the FPs with sens-ing units that are designed to detect specific cell events, such asthe activity of kinases, or the binding of small molecules orprotein ligands. Many of these biosensor probes rely on Försterresonance energy transfer (FRET) to report the changes inprotein conformation or spatial orientation that accompaniesthe targeted cellular event (5, 19, 37, 39, 40).
These FRET-based biosensor proteins have been exploitedextensively in 1-photon excitation (1PE) microscopy but havefailed to gain traction in 2PE IVM for several reasons. First,some FPs commonly used in 1PE studies are only weaklyexcited by 2PE, particularly over the wavelengths provided bythe titanium-sapphire lasers used in the vast majority of 2PEmicroscope systems. Second, many FPs exhibit complex be-haviors under multiphoton excitation, and these are oftendifficult to predict (3, 14, 23). Third, the utility of FRET-basedbiosensors is confounded by the broad 2PE absorption spectraof FPs (6), which makes it difficult to selectively excite thedonor FP of the FRET pair. The resulting spectral cross talkcomplicates the measurements of FRET by sensitized emissionand requires cross talk correction methods specifically devel-oped for 2PE (24). For example, the quantification of FRETfrom independently produced donor and acceptor probes re-quires systems equipped with two separate infrared lasers andelaborate cross talk correction methods involving collection ofmultiple images (24). This problem is partially mitigated whenusing the linked biosensor probes, since the ratio of the donorto the acceptor is fixed, and the cross talk background isconstant.
The use of 2PE creates additional challenges for othermethods that are commonly used in 1PE microscopy to deter-mine FRET efficiency. For example, the approach of acceptorphotobleaching under 2PE is challenging since it is not possi-ble to selectively excite and bleach only the acceptor FP. Theproblems of spectral cross talk can be avoided by measuring
Address for reprint requests and other correspondence: R. N. Day, Dept. ofCellular and Integrative Physiology, Indiana University School of Medicine,635 Barnhill Dr., Indianapolis, IN 46202 (e-mail: [email protected]).
Am J Physiol Cell Physiol 309: C724–C735, 2015.First published September 2, 2015; doi:10.1152/ajpcell.00182.2015.Methods In Cell Physiology
0363-6143/15 Copyright © 2015 the American Physiological Society http://www.ajpcell.orgC724
by 10.220.33.4 on January 30, 2017http://ajpcell.physiology.org/
Dow
nloaded from

the changes in the donor fluorophore lifetime that result fromFRET (38), but few investigators have access to a time-resolved 2PE microscopy system. Finally, each of these ap-proaches is time-consuming, requiring extended integration, orcollection of multiple images, making them susceptible tomotion-induced artifacts in IVM. What is needed for practical2PE measurements of biosensor activity is a FP pairing withoptimal behavior, but with minimal 2PE cross talk. This wouldallow ratiometric measurements from images collected by IVMusing a single 2PE wavelength and also permit a straightfor-ward cross talk correction to determine of the FRET efficiency.
The cyan and yellow FPs have long been favored forFRET-based imaging studies because of their strong spectraloverlap. Previous studies characterizing these probes for mul-tiphoton FRET experiments clearly demonstrated that wave-lengths near 800 nm were best for selective excitation of CFPover YFP (43). The early versions of the enhanced cyan andyellow FPs (ECFP and EYFP), however, had a number ofdeficiencies that limited their use for quantitative live-cellimaging approaches (31). Efforts to improve the photophysicalcharacteristics of ECFP by directed mutagenesis yielded abrighter variant called mCerulean (28). Similar approacheswere also used to address the deficiencies of EYFP, yieldingmVenus (20) and mCitrine (9). Studies of the 2PE character-istics of mCerulean and mVenus showed that excitation at 820nm reduced the cross talk excitation of mVenus (29). However,mCerulean still has problems associated with photostability(32) and photo-switching behavior (32, 17). To address theseshortcomings, mutagenesis was used to substitute residues thatinfluence the planarity of the chromophore, yielding new cyanFPs called mCerulean3 (17) and mTurquoise (7). These cyanFPs are brighter and more photostable than mCerulean andhave single-component fluorescence lifetimes (4). These newergeneration cyan and yellow FPs share the spectral overlaprequired for efficient energy transfer, and the improved photo-physical characteristics make them most useful for the mea-surement of FRET.
Here, we systematically evaluate and characterize a numberof different FPs for their 2PE characteristics and their suitabil-ity when paired for FRET-based biosensor probe applications.Our studies demonstrate that the optimized monomeric (m)Turquoise (7), and mVenus (20) share regions of minimaloverlap in their 2PE spectra, making them suitable candidatesfor 2PE FRET probes. To validate the use of these probes forIVM, a series of linked FRET standards were developed andthe FRET measurements by 2PE were confirmed by fluores-cence lifetime and acceptor photobleaching methods. Thesestudies demonstrated that FRET probes based on mTurquoiseand mVenus enable a simple and robust method for measuringFRET activities in living animals, based on ratiometric mea-surements obtained from a two-channel 2PE image collectedwith a single excitation wavelength. We demonstrate that thisapproach allows the noninvasive and spatiotemporal detectionof FRET-based biosensor activities in intact mice using astandard multiphoton microscope system.1
MATERIALS AND METHODS
Plasmid DNAs and viral vectors. The cDNA sequences encodingthe mT-Sapphire, mCerulean, mCerulean3, mTurquoise, mTur-quoise2, mTFP1, mVenus, mNeonGreen, Clover, mKO2, andmRuby2 proteins are in the Clontech C1 or N1 plasmid vectors. Whenexpressed individually, the N1 versions with the termination codon atthe immediate end of the FP were used. The plasmids encoding themCerulean-mVenus FRET standards were obtained from Dr. StevenVogel (National Institutes of Health, Bethesda, MD) and are availablefrom Addgene (Cambridge, MA). Dr. Jin Zhang (Johns HopkinsUniversity) provided the A-kinase activity reporter 4 (AKAR4) plas-mid. Recombinant DNA methods were used to replace the sequenceencoding mCerulean with that for mTurquoise in the FRET standardsand in AKAR4. All plasmid inserts were confirmed by direct sequenc-ing.
The adenovirus (Ad) CMV-Turq-AKAR4 vector was made usingthe AdEasy system (16). Briefly, sequence encoding Turq-AKAR4gene was inserted into the pShuttle-CMV vector, which contains someportions of Ad DNA. The resulting pShuttle-CMV-Turq-AKAR4vector was linearized with PmeI and recombined with AdEasy1 inBJ5183 bacterial cells via homologous recombination. The recombi-nant Ad DNA harboring Turq-AKAR4 gene was digested with PacIto expose inverted terminal repeats of Ad, and then propagated inhuman embryonic kidney (HEK)293 cells for generation of Ad-CMV-Turq-AKAR4 vector. The Ad-CMV-Turq-AKAR4 vector was puri-fied by two rounds of CsCl density centrifugation, dialyzed, andstored at �70°C in PBS buffer containing 10% glycerol. The virustiter (1.28 � 1012 particles/ml) was determined by measurement ofoptical density at 260 nm and by counting the fluorescence-positivecells post infection (1 � 1011 infectious U/ml).
Cell culture and transfections. HEK293 cells were maintained inmonolayer culture and harvested at 80% confluence. The cells weretransfected either using X-tremeGene HP DNA transfection reagent(Roche Diagnostics) or by electroporation. Mouse fetal cardiomyo-cytes were isolated from hearts harvested from day 15 embryos byenzymatic digestion with 0.2% collagenase type II in PBS. Theenzymatic digestion was stopped after 75 min by diluting the cellsuspension with culture medium (DMEM supplemented with 10%FBS, 5 mM Na-pyruvate, 50 �g/ml streptomycin and 50 U/mlpenicillin). The cells were maintained in four-well Lab-Tek II cham-bered coverglass (1.5 borosilicate glass; Thermo Fisher Scientific,Waltham, MA) and incubated in 5% CO2-95% O2 at 37°C.
Two-photon microscopy. Nearly all microscopy studies were con-ducted using an Olympus FV1000 inverted IX 81 spectral type laserscanning confocal microscope modified for two-photon excitationwith the addition of a MaiTai Ti-sapphire laser (Spectra-Physics,Santa Clara, CA), a Pockels cell electro-optical attenuator (Conoptics,Danbury, CT), a Keplerian collimator/beam expander, and threegallium arsenide phosphide detectors (Hamamatsu, Middlesex, NJ).Some of the spectral scanning studies (Fig. 1) were conducted usingan Olympus FV1000 MPE inverted IX 81 spectral type laser scanningconfocal/multiphoton microscope system equipped with a MaiTaiDeepSee Ti-sapphire laser (Spectra-Physics). Fluorescence was col-lected via descanned detectors, using emission filters optimized foreach fluorescent protein. Purified FPs (in PBS plus 0.1% BSA solu-tion) or transfected cells (in DMEM-F12 without phenol red) wereimaged in Lab-Tek II 2-well chambered coverglasses using an Olym-pus �60, 1.2 numerical aperture (NA) water immersion objective.The 2PE fluorescence excitation spectra were obtained by measuringfluorescence emissions over a range of excitation wavelengths using aconstant detector gain. The laser power was measured at the specimenplane for each excitation wavelength using a PM100D power meterwith � correction (Thorlabs, Newton, NJ), and adjusted to a constantvalue.
Intravital microscopy. IVM was conducted as previously described(30) using the modified Olympus FV1000 system described above
1 This article is the topic of an Editorial Focus by Randall Lindquist andRaluca Niesner (15a).
Methods In Cell Physiology
C725MONITORING FRET-BASED BIOSENSORS IN LIVING ANIMALS
AJP-Cell Physiol • doi:10.1152/ajpcell.00182.2015 • www.ajpcell.org
by 10.220.33.4 on January 30, 2017http://ajpcell.physiology.org/
Dow
nloaded from
with a �25, NA 1.05 XLPN water immersion objective. Studies wereconducted using 11- to 12-wk-old C57BL/6 mice, obtained fromJackson Laboratories (Bar Harbor, ME). In vivo expression ofAKAR4.1 was accomplished by viral transduction, via tail veininjection of the Ad-CMV-Turq-AKAR4 vector (4.8 � 1010 viralparticles in 200 �l saline per mouse). Seven days after adenovirusinjection, mice were fasted for 3 h, anesthetized with isoflurane, andsurgically prepared for intravital microscopy. A 2-cm ventral incisionwas placed just 1 cm below the rib cage to expose the liver, and asmall section of PE50 tubing was secured in the abdominal cavity forintraperitoneal injection of glucagon on the stage of the microscope.The left lateral lobe of the liver was carefully lifted and secured to aglass-bottom plate. The mouse was then placed ventral side down ona heated microscope stage and covered with a warming blanket. Afteridentifying an appropriate field of fluorescent cells, a series of imagevolumes (10 focal planes spaced 1 �m apart) were collected contin-uously just before and for 15 min following the intraperitonealinjection of 200 �g/kg glucagon, using a heated Olympus �20, NA0.95 objective. All studies were approved by the Institutional AnimalCare and Use Committee of Indiana University School of Medicineand conformed to the Guide for the Care and Use of LaboratoryAnimals published by the National Institutes of Health (NIH Publica-tion No. 85-23, Revised 1996).
Digital image analysis. Quantitative image analysis was carried outusing MetaMorph image processing software (Molecular Devices,Sunnyvale, CA). The relative 2-photon excitation spectra were con-structed from the average fluorescence intensity values at the variouswavelengths for the purified FPs or for the selected regions of interest(ROI) within the imaged cells. To quantify the average fluorescenceintensity, the images collected in channel 1 and channel 2 wereassembled to separate stacks in MetaMorph. The image planes in agiven stack were aligned, and background fluorescence of each planewas measured in a random field outside of cells and subtracted fromthe corresponding plan for all plans. Then, ROIs with relativelyuniform fluorescence within a given cell were selected, and theaverage fluorescence intensity within these regions was quantified.The same regions were used for both channel 1 and channel 2. Thenormalized average fluorescence intensity values were calculated foreach selected region and then pooled and averaged with those derivedfrom other cells. All the FRET quantifications including FRET effi-ciency (EFRET) calculations are based on background-subtracted im-ages without any further processing.
Here, the cells expressing the individual FPs or the FRET standardsare used to characterize 2PE spectral cross talk components for thedonor (mTurquoise) and acceptor (Venus) excitation at 810 nm. TheB and A correction factors for the Turquoise emission cross talk andthe Venus direct excitation cross talk, respectively, allow the deter-mination of the corrected FRET signal (2).
FRETcorr � FRETraw � ASBT � DSBT (1)
which is related to the intensity (I) signal as:
FRETcorr � IFRET � A * IFRET � B * ITurq (2)
Using 810 nm 2PE of cells expressing mTurquoise alone alloweddetermination of the B correction factor (0.295 � 0.002). Similarly,cells expressing only mVenus were measured at both 810 nm and 960nm, and acceptor cross talk component was determined to be 0.030 �0.001. Next, the FRET standards (Fig. 2), as well as cells expressinga mixture of mTurquoise and mVenus, were used to determine theaverage IVen-810/IVen-960 of 0.344 � 0.046. From this, the correctionfor acceptor intensity at 810 nm was determined to be 2.91 � 0.39.Thus, the correction factor A is 2.91 � 0.03 � 0.087 � 0.01 and theFRETcorr can be defined as:
FRETcorr � IFRET � 0.087 * IFRET � 0.295 * ITurq (3)
Visualization of FRET signals in images, subsequent processing,FRET image analysis, and generation of ratio images of FRET/Turquoise were performed as described by Broussard (2). The cor-rected FRET signal is determined using Eq. 3 in RESULTS. The ratioimage of FRET/Turquoise is calculated from the equation:
FRET/Turquoise� �FRETcorr * 1, 000 ⁄ Imax�FRETcorr� ⁄ IT-810 * 1, 000 ⁄ Imax�T-810�� * 100
(4)
Both the numerator (FRETcorr) and denominator (IT-810) are normal-ized to the corresponding maximum gray values (Imax). Since the pixelvalues of nonfloating point images are integers, the factor of 100 isincluded in the resultant ratio images to avoid fractional pixel valuesin 8-bit images for visualization.
The 2PE FRET efficiency is calculated as previously described (24,26, 2) using the equation:
E � Dlost ⁄ Dtotal � Dlost ⁄ �Dlost � Dremains� (5)
where
Dlost � FRETcorr * �QYd ⁄ QYa� * �Sd ⁄ Sa� * �Gd ⁄ Ga�, and Dremains
� ITurq-810 (6)
QYd and QYa denote the quantum yields of the donor and acceptor,respectively, where the quantum yield ratio for Turquoise and Venusis 1.474 (7, 20). Sd and Sa denote the spectral sensitivities of the donorand acceptor channels. The Sd/Sa ratio is approximated by the band-width ratio of channel 1 and channel 2, which is set to 2/3. Gd and Ga
are the detector gains for the donor and acceptor emission channel.FLIM measurements. The fluorescence lifetime measurements are
made using the ISS Alba FastFLIM system (ISS, Champagne, IL)coupled to an Olympus IX71 microscope equipped with a �60, 1.2NA water immersion objective lens. A Pathology Devices (PathologyDevices) stage top environmental control system maintains the tem-perature at 36°C and CO2 at 5%. For FD FLIM using the cyan andyellow FPs the 5 mW 440 nm diode laser is modulated by the AlbaFastFLIM system at a fundamental frequency of 10 MHz, withadditional measurements at 13 sinusoidal harmonics (10–140 MHz).The modulated laser is coupled to the confocal scanning system,which is controlled by the VistaVision software (ISS). The fluores-cence signals emitted from the specimen are routed by a 495 nm longpass beam splitter through the 530/43 nm (acceptor emission) and480/40 (donor emission) band-pass emission filters, and the signalsare detected using two identical avalanche photodiodes. The phasedelays and modulation ratios of the emission relative to the excitationare measured at each pixel of an image for each frequency. The mostaccurate lifetime determinations are obtained by analyzing the first 12frequencies (10–120 MHz), with the quality of the fit judged by thereduced �2 values for the multifrequency response curves (4). Theratio of the donor lifetimes determined in the absence (D) and inthe presence of the acceptor (DA) provides a direct estimate of FRETefficiency (EFRET) by:
EFRET � �1 � �DA ⁄ �D� (7)
RESULTS
Identification of optimal FPs for 2PE biosensor probes. Toidentify FPs with properties that are optimal for 2PE IVMmeasurement of FRET-based biosensor activities, we charac-terized a series of blue to green FPs as potential donor fluoro-phores for these probes (Fig. 1A). Although the titaniumsapphire lasers used in most current 2PE microscope systemsare capable of providing emissions over a range of approxi-mately 700 nm to 1,050 nm, optimal power is found in therange between 800 and 900 nm. Accordingly, we focused ondonor fluorophores with 2PE in this range. Acceptor fluoro-
Methods In Cell Physiology
C726 MONITORING FRET-BASED BIOSENSORS IN LIVING ANIMALS
AJP-Cell Physiol • doi:10.1152/ajpcell.00182.2015 • www.ajpcell.org
by 10.220.33.4 on January 30, 2017http://ajpcell.physiology.org/
Dow
nloaded from
phores were identified based on 1P spectral overlap with donorfluorophores and the absence of untoward effects of excitationat wavelengths near 800 nm. For example, some FPs showed adiscrete band of very strong emission with illumination near720 nm, which corresponds to excitation into higher energyelectronic levels (6) (see Fig. 1A) and results in rapid andirreversible photobleaching at these wavelengths (our unpub-lished observations).
These criteria narrowed the potential group of donor andacceptor FPs suitable for the IVM approach described here to
the newer cyan and yellow FPs, and some of the long stokesshift FPs. Since many existing FRET-based biosensor probeswere developed with earlier variants of the cyan and yellowFPs, most imaging systems are set up for the detection of theseprobes, offering additional advantages to investigators whowish to utilize them for IVM. Spectral scanning showed thatthe spectral characteristics for each of the cyan variants weresimilar (Fig. 1A), with peak excitation at 860 nm falling tominimal excitation at 960 nm, and there was no enhancedexcitation at wavelengths below 780 nm. The improved quan-
720 740 760 780 800 820 840 860 880 900 920 940 960
1.0
0.8
0.6
0.4
0.2
0
Channel 1
Channel 2
Wavelength (nm)
Norm
alize
dAve
rage
dInte
nsity
nel 1 (454 - 510 nm)
Channel 2 (520 - 580 nm)
720 740 760 780 800 820 840 860 880 900 920 940 960
1.0
0.8
0.6
0.4
0.2
0
Channel 1
Channel 2
Wavelength (nm)
Channel 1 (454 - 510 nm)
Channel 2 (520 - 580 nm)
Chan
mTurquoise
mVenus
Norm
alize
dAve
rage
dInte
nsity
B
C
1.0
0.8
0.6
0.4
0.2
0
Wavelength (nm)
Norm
alize
dAve
rage
dInte
nsity
720 740 760 780 800 820 840 860 880 900 920 940 960
mCeruleanmCerulean3mTurquoiseT-Sapphire
mTFP1EGFPCloverNeonGrn
1.0
0.8
0.6
0.4
0.2
0
Wavelength (nm)720 740 760 780 800 820 840 860 880 900 920 940 960
mVenusmKO2mRuby2
A
Fig. 1. A: two-photon excitation (2PE) spectral scan-ning of the indicated fluorescent proteins (FPs) ex-pressed individually in living cells. B and C: therelative 2PE spectral scans for monomeric (m) Tur-quoise (B) and mVenus (C), each expressed individ-ually in living cells. The emission signals at thedifferent excitation wavelengths were simultane-ously detected in channel 1 (cyan, 454–510 nm) andchannel 2 (yellow, 520–580 nm), and the imageswere acquired at each wavelength step (scale bar, 10�m). Red bar indicates excitation at 810 nm.
Methods In Cell Physiology
C727MONITORING FRET-BASED BIOSENSORS IN LIVING ANIMALS
AJP-Cell Physiol • doi:10.1152/ajpcell.00182.2015 • www.ajpcell.org
by 10.220.33.4 on January 30, 2017http://ajpcell.physiology.org/
Dow
nloaded from
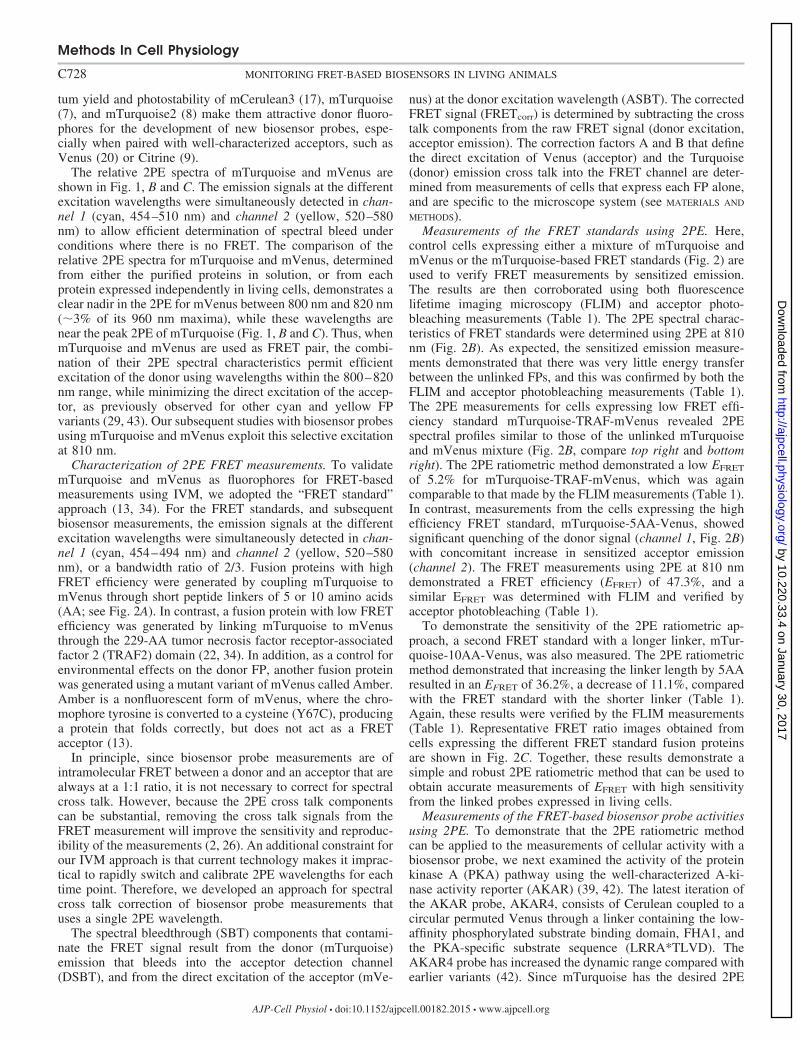
tum yield and photostability of mCerulean3 (17), mTurquoise(7), and mTurquoise2 (8) make them attractive donor fluoro-phores for the development of new biosensor probes, espe-cially when paired with well-characterized acceptors, such asVenus (20) or Citrine (9).
The relative 2PE spectra of mTurquoise and mVenus areshown in Fig. 1, B and C. The emission signals at the differentexcitation wavelengths were simultaneously detected in chan-nel 1 (cyan, 454–510 nm) and channel 2 (yellow, 520–580nm) to allow efficient determination of spectral bleed underconditions where there is no FRET. The comparison of therelative 2PE spectra for mTurquoise and mVenus, determinedfrom either the purified proteins in solution, or from eachprotein expressed independently in living cells, demonstrates aclear nadir in the 2PE for mVenus between 800 nm and 820 nm(3% of its 960 nm maxima), while these wavelengths arenear the peak 2PE of mTurquoise (Fig. 1, B and C). Thus, whenmTurquoise and mVenus are used as FRET pair, the combi-nation of their 2PE spectral characteristics permit efficientexcitation of the donor using wavelengths within the 800–820nm range, while minimizing the direct excitation of the accep-tor, as previously observed for other cyan and yellow FPvariants (29, 43). Our subsequent studies with biosensor probesusing mTurquoise and mVenus exploit this selective excitationat 810 nm.
Characterization of 2PE FRET measurements. To validatemTurquoise and mVenus as fluorophores for FRET-basedmeasurements using IVM, we adopted the “FRET standard”approach (13, 34). For the FRET standards, and subsequentbiosensor measurements, the emission signals at the differentexcitation wavelengths were simultaneously detected in chan-nel 1 (cyan, 454–494 nm) and channel 2 (yellow, 520–580nm), or a bandwidth ratio of 2/3. Fusion proteins with highFRET efficiency were generated by coupling mTurquoise tomVenus through short peptide linkers of 5 or 10 amino acids(AA; see Fig. 2A). In contrast, a fusion protein with low FRETefficiency was generated by linking mTurquoise to mVenusthrough the 229-AA tumor necrosis factor receptor-associatedfactor 2 (TRAF2) domain (22, 34). In addition, as a control forenvironmental effects on the donor FP, another fusion proteinwas generated using a mutant variant of mVenus called Amber.Amber is a nonfluorescent form of mVenus, where the chro-mophore tyrosine is converted to a cysteine (Y67C), producinga protein that folds correctly, but does not act as a FRETacceptor (13).
In principle, since biosensor probe measurements are ofintramolecular FRET between a donor and an acceptor that arealways at a 1:1 ratio, it is not necessary to correct for spectralcross talk. However, because the 2PE cross talk componentscan be substantial, removing the cross talk signals from theFRET measurement will improve the sensitivity and reproduc-ibility of the measurements (2, 26). An additional constraint forour IVM approach is that current technology makes it imprac-tical to rapidly switch and calibrate 2PE wavelengths for eachtime point. Therefore, we developed an approach for spectralcross talk correction of biosensor probe measurements thatuses a single 2PE wavelength.
The spectral bleedthrough (SBT) components that contami-nate the FRET signal result from the donor (mTurquoise)emission that bleeds into the acceptor detection channel(DSBT), and from the direct excitation of the acceptor (mVe-
nus) at the donor excitation wavelength (ASBT). The correctedFRET signal (FRETcorr) is determined by subtracting the crosstalk components from the raw FRET signal (donor excitation,acceptor emission). The correction factors A and B that definethe direct excitation of Venus (acceptor) and the Turquoise(donor) emission cross talk into the FRET channel are deter-mined from measurements of cells that express each FP alone,and are specific to the microscope system (see MATERIALS AND
METHODS).Measurements of the FRET standards using 2PE. Here,
control cells expressing either a mixture of mTurquoise andmVenus or the mTurquoise-based FRET standards (Fig. 2) areused to verify FRET measurements by sensitized emission.The results are then corroborated using both fluorescencelifetime imaging microscopy (FLIM) and acceptor photo-bleaching measurements (Table 1). The 2PE spectral charac-teristics of FRET standards were determined using 2PE at 810nm (Fig. 2B). As expected, the sensitized emission measure-ments demonstrated that there was very little energy transferbetween the unlinked FPs, and this was confirmed by both theFLIM and acceptor photobleaching measurements (Table 1).The 2PE measurements for cells expressing low FRET effi-ciency standard mTurquoise-TRAF-mVenus revealed 2PEspectral profiles similar to those of the unlinked mTurquoiseand mVenus mixture (Fig. 2B, compare top right and bottomright). The 2PE ratiometric method demonstrated a low EFRET
of 5.2% for mTurquoise-TRAF-mVenus, which was againcomparable to that made by the FLIM measurements (Table 1).In contrast, measurements from the cells expressing the highefficiency FRET standard, mTurquoise-5AA-Venus, showedsignificant quenching of the donor signal (channel 1, Fig. 2B)with concomitant increase in sensitized acceptor emission(channel 2). The FRET measurements using 2PE at 810 nmdemonstrated a FRET efficiency (EFRET) of 47.3%, and asimilar EFRET was determined with FLIM and verified byacceptor photobleaching (Table 1).
To demonstrate the sensitivity of the 2PE ratiometric ap-proach, a second FRET standard with a longer linker, mTur-quoise-10AA-Venus, was also measured. The 2PE ratiometricmethod demonstrated that increasing the linker length by 5AAresulted in an EFRET of 36.2%, a decrease of 11.1%, comparedwith the FRET standard with the shorter linker (Table 1).Again, these results were verified by the FLIM measurements(Table 1). Representative FRET ratio images obtained fromcells expressing the different FRET standard fusion proteinsare shown in Fig. 2C. Together, these results demonstrate asimple and robust 2PE ratiometric method that can be used toobtain accurate measurements of EFRET with high sensitivityfrom the linked probes expressed in living cells.
Measurements of the FRET-based biosensor probe activitiesusing 2PE. To demonstrate that the 2PE ratiometric methodcan be applied to the measurements of cellular activity with abiosensor probe, we next examined the activity of the proteinkinase A (PKA) pathway using the well-characterized A-ki-nase activity reporter (AKAR) (39, 42). The latest iteration ofthe AKAR probe, AKAR4, consists of Cerulean coupled to acircular permuted Venus through a linker containing the low-affinity phosphorylated substrate binding domain, FHA1, andthe PKA-specific substrate sequence (LRRA*TLVD). TheAKAR4 probe has increased the dynamic range compared withearlier variants (42). Since mTurquoise has the desired 2PE
Methods In Cell Physiology
C728 MONITORING FRET-BASED BIOSENSORS IN LIVING ANIMALS
AJP-Cell Physiol • doi:10.1152/ajpcell.00182.2015 • www.ajpcell.org
by 10.220.33.4 on January 30, 2017http://ajpcell.physiology.org/
Dow
nloaded from
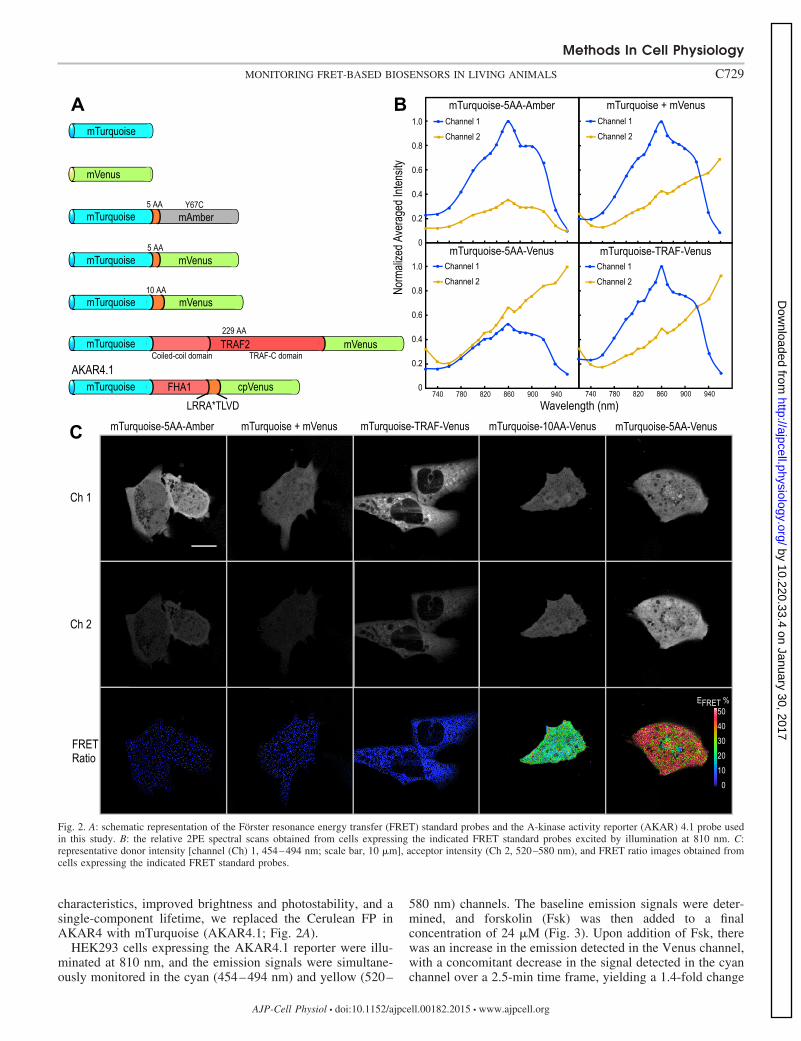
characteristics, improved brightness and photostability, and asingle-component lifetime, we replaced the Cerulean FP inAKAR4 with mTurquoise (AKAR4.1; Fig. 2A).
HEK293 cells expressing the AKAR4.1 reporter were illu-minated at 810 nm, and the emission signals were simultane-ously monitored in the cyan (454–494 nm) and yellow (520–
580 nm) channels. The baseline emission signals were deter-mined, and forskolin (Fsk) was then added to a finalconcentration of 24 �M (Fig. 3). Upon addition of Fsk, therewas an increase in the emission detected in the Venus channel,with a concomitant decrease in the signal detected in the cyanchannel over a 2.5-min time frame, yielding a 1.4-fold change
mVenus
mVenusTRAF2mTurquoiseCoiled-coil domain TRAF-C domain
229 AA
mAmbermTurquoise5 AA Y67C
mTurquoise
mVenusmTurquoise5 AA
mVenusmTurquoise10 AA
cpVenusmTurquoise FHA1AKAR4.1
LRRA*TLVD
mTurquoise-5AA-Amber mTurquoise + mVenus
Channel 1Channel 2
740 780 820 860 900 940
1.0
0.8
0.6
0.4
0.2
0
mTurquoise-5AA-Venus
Wavelength (nm)
mTurquoise-TRAF-Venus
Norm
alize
dAve
raged
Inten
sity
740 780 820 860 900 940
1.0
0.8
0.6
0.4
0.2
0
Channel 1Channel 2
Channel 1Channel 2
Channel 1Channel 2
Ch 1
Ch 2
FRETRatio
mTurquoise-5AA-Amber mTurquoise + mVenus mTurquoise-TRAF-Venus mTurquoise-5AA-VenusmTurquoise-10AA-Venus
5040302010
0
EFRET %
A B
C
Fig. 2. A: schematic representation of the Förster resonance energy transfer (FRET) standard probes and the A-kinase activity reporter (AKAR) 4.1 probe usedin this study. B: the relative 2PE spectral scans obtained from cells expressing the indicated FRET standard probes excited by illumination at 810 nm. C:representative donor intensity [channel (Ch) 1, 454–494 nm; scale bar, 10 �m], acceptor intensity (Ch 2, 520–580 nm), and FRET ratio images obtained fromcells expressing the indicated FRET standard probes.
Methods In Cell Physiology
C729MONITORING FRET-BASED BIOSENSORS IN LIVING ANIMALS
AJP-Cell Physiol • doi:10.1152/ajpcell.00182.2015 • www.ajpcell.org
by 10.220.33.4 on January 30, 2017http://ajpcell.physiology.org/
Dow
nloaded from
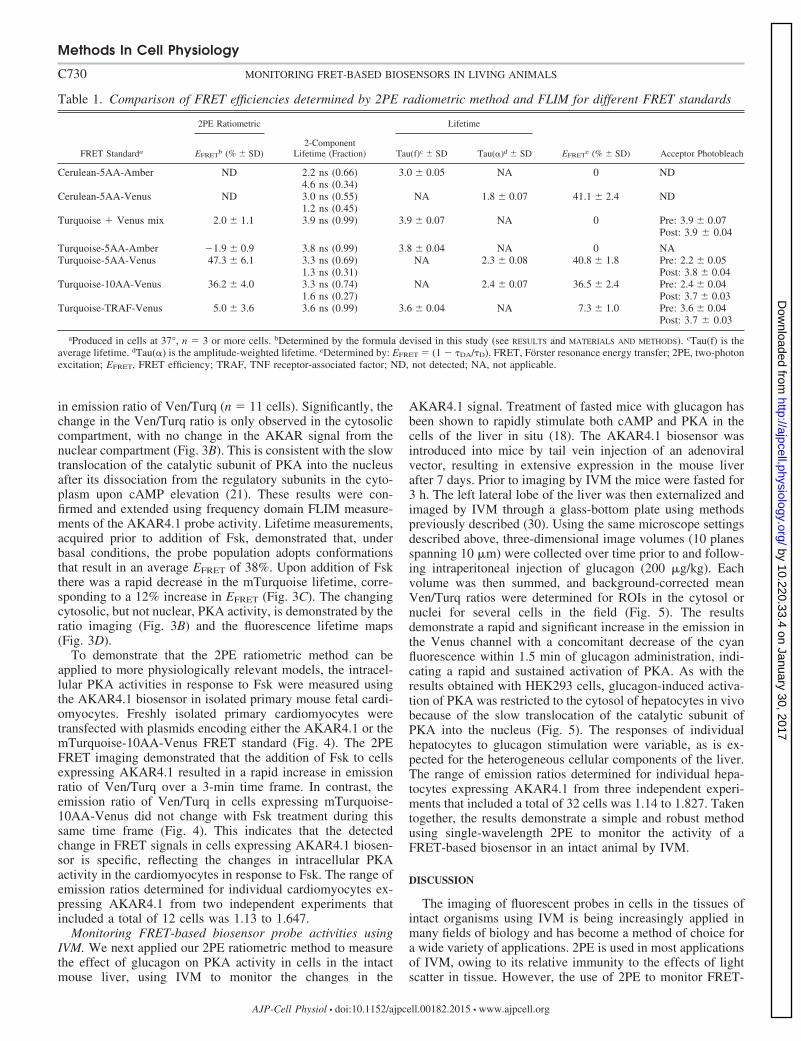
in emission ratio of Ven/Turq (n � 11 cells). Significantly, thechange in the Ven/Turq ratio is only observed in the cytosoliccompartment, with no change in the AKAR signal from thenuclear compartment (Fig. 3B). This is consistent with the slowtranslocation of the catalytic subunit of PKA into the nucleusafter its dissociation from the regulatory subunits in the cyto-plasm upon cAMP elevation (21). These results were con-firmed and extended using frequency domain FLIM measure-ments of the AKAR4.1 probe activity. Lifetime measurements,acquired prior to addition of Fsk, demonstrated that, underbasal conditions, the probe population adopts conformationsthat result in an average EFRET of 38%. Upon addition of Fskthere was a rapid decrease in the mTurquoise lifetime, corre-sponding to a 12% increase in EFRET (Fig. 3C). The changingcytosolic, but not nuclear, PKA activity, is demonstrated by theratio imaging (Fig. 3B) and the fluorescence lifetime maps(Fig. 3D).
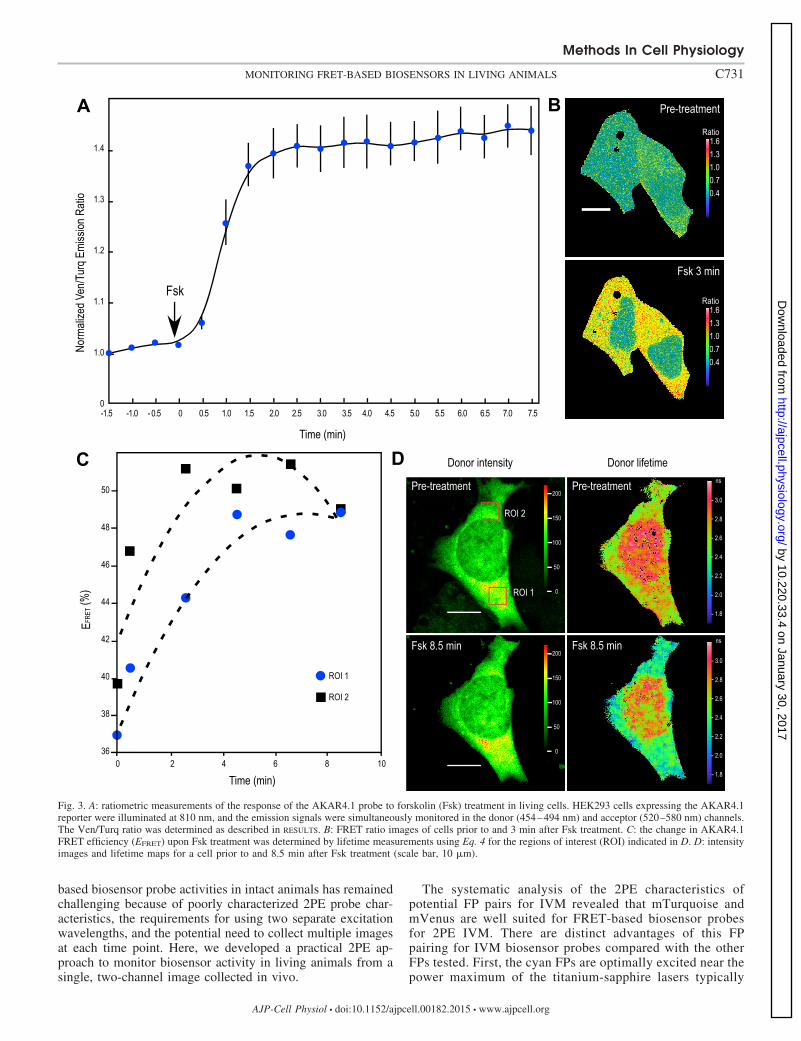
To demonstrate that the 2PE ratiometric method can beapplied to more physiologically relevant models, the intracel-lular PKA activities in response to Fsk were measured usingthe AKAR4.1 biosensor in isolated primary mouse fetal cardi-omyocytes. Freshly isolated primary cardiomyocytes weretransfected with plasmids encoding either the AKAR4.1 or themTurquoise-10AA-Venus FRET standard (Fig. 4). The 2PEFRET imaging demonstrated that the addition of Fsk to cellsexpressing AKAR4.1 resulted in a rapid increase in emissionratio of Ven/Turq over a 3-min time frame. In contrast, theemission ratio of Ven/Turq in cells expressing mTurquoise-10AA-Venus did not change with Fsk treatment during thissame time frame (Fig. 4). This indicates that the detectedchange in FRET signals in cells expressing AKAR4.1 biosen-sor is specific, reflecting the changes in intracellular PKAactivity in the cardiomyocytes in response to Fsk. The range ofemission ratios determined for individual cardiomyocytes ex-pressing AKAR4.1 from two independent experiments thatincluded a total of 12 cells was 1.13 to 1.647.
Monitoring FRET-based biosensor probe activities usingIVM. We next applied our 2PE ratiometric method to measurethe effect of glucagon on PKA activity in cells in the intactmouse liver, using IVM to monitor the changes in the
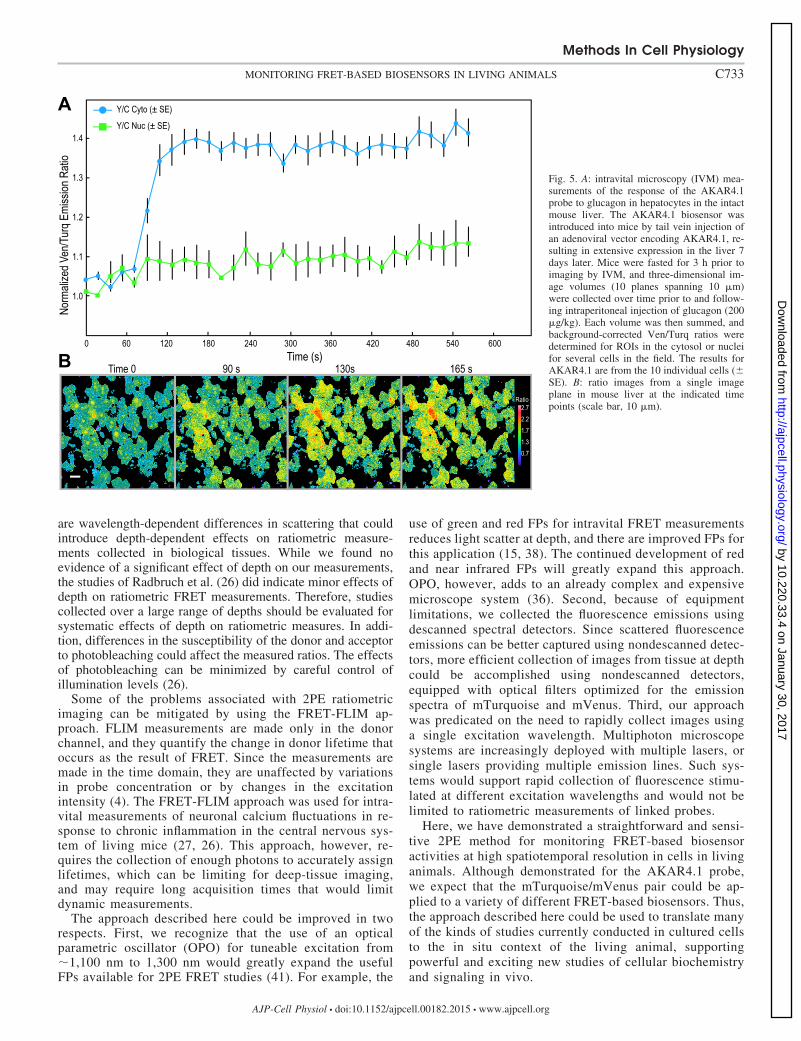
AKAR4.1 signal. Treatment of fasted mice with glucagon hasbeen shown to rapidly stimulate both cAMP and PKA in thecells of the liver in situ (18). The AKAR4.1 biosensor wasintroduced into mice by tail vein injection of an adenoviralvector, resulting in extensive expression in the mouse liverafter 7 days. Prior to imaging by IVM the mice were fasted for3 h. The left lateral lobe of the liver was then externalized andimaged by IVM through a glass-bottom plate using methodspreviously described (30). Using the same microscope settingsdescribed above, three-dimensional image volumes (10 planesspanning 10 �m) were collected over time prior to and follow-ing intraperitoneal injection of glucagon (200 �g/kg). Eachvolume was then summed, and background-corrected meanVen/Turq ratios were determined for ROIs in the cytosol ornuclei for several cells in the field (Fig. 5). The resultsdemonstrate a rapid and significant increase in the emission inthe Venus channel with a concomitant decrease of the cyanfluorescence within 1.5 min of glucagon administration, indi-cating a rapid and sustained activation of PKA. As with theresults obtained with HEK293 cells, glucagon-induced activa-tion of PKA was restricted to the cytosol of hepatocytes in vivobecause of the slow translocation of the catalytic subunit ofPKA into the nucleus (Fig. 5). The responses of individualhepatocytes to glucagon stimulation were variable, as is ex-pected for the heterogeneous cellular components of the liver.The range of emission ratios determined for individual hepa-tocytes expressing AKAR4.1 from three independent experi-ments that included a total of 32 cells was 1.14 to 1.827. Takentogether, the results demonstrate a simple and robust methodusing single-wavelength 2PE to monitor the activity of aFRET-based biosensor in an intact animal by IVM.
DISCUSSION
The imaging of fluorescent probes in cells in the tissues ofintact organisms using IVM is being increasingly applied inmany fields of biology and has become a method of choice fora wide variety of applications. 2PE is used in most applicationsof IVM, owing to its relative immunity to the effects of lightscatter in tissue. However, the use of 2PE to monitor FRET-
Table 1. Comparison of FRET efficiencies determined by 2PE radiometric method and FLIM for different FRET standards
2PE Ratiometric Lifetime
FRET Standarda EFRETb (% � SD)
2-ComponentLifetime (Fraction) Tau(f)c � SD Tau(�)d � SD EFRET
e (% � SD) Acceptor Photobleach
Cerulean-5AA-Amber ND 2.2 ns (0.66) 3.0 � 0.05 NA 0 ND4.6 ns (0.34)
Cerulean-5AA-Venus ND 3.0 ns (0.55) NA 1.8 � 0.07 41.1 � 2.4 ND1.2 ns (0.45)
Turquoise � Venus mix 2.0 � 1.1 3.9 ns (0.99) 3.9 � 0.07 NA 0 Pre: 3.9 � 0.07Post: 3.9 � 0.04
Turquoise-5AA-Amber �1.9 � 0.9 3.8 ns (0.99) 3.8 � 0.04 NA 0 NATurquoise-5AA-Venus 47.3 � 6.1 3.3 ns (0.69) NA 2.3 � 0.08 40.8 � 1.8 Pre: 2.2 � 0.05
1.3 ns (0.31) Post: 3.8 � 0.04Turquoise-10AA-Venus 36.2 � 4.0 3.3 ns (0.74) NA 2.4 � 0.07 36.5 � 2.4 Pre: 2.4 � 0.04
1.6 ns (0.27) Post: 3.7 � 0.03Turquoise-TRAF-Venus 5.0 � 3.6 3.6 ns (0.99) 3.6 � 0.04 NA 7.3 � 1.0 Pre: 3.6 � 0.04
Post: 3.7 � 0.03
aProduced in cells at 37°, n � 3 or more cells. bDetermined by the formula devised in this study (see RESULTS and MATERIALS AND METHODS). cTau(f) is theaverage lifetime. dTau(�) is the amplitude-weighted lifetime. eDetermined by: EFRET � (1 � DA/D). FRET, Förster resonance energy transfer; 2PE, two-photonexcitation; EFRET, FRET efficiency; TRAF, TNF receptor-associated factor; ND, not detected; NA, not applicable.
Methods In Cell Physiology
C730 MONITORING FRET-BASED BIOSENSORS IN LIVING ANIMALS
AJP-Cell Physiol • doi:10.1152/ajpcell.00182.2015 • www.ajpcell.org
by 10.220.33.4 on January 30, 2017http://ajpcell.physiology.org/
Dow
nloaded from
based biosensor probe activities in intact animals has remainedchallenging because of poorly characterized 2PE probe char-acteristics, the requirements for using two separate excitationwavelengths, and the potential need to collect multiple imagesat each time point. Here, we developed a practical 2PE ap-proach to monitor biosensor activity in living animals from asingle, two-channel image collected in vivo.
The systematic analysis of the 2PE characteristics ofpotential FP pairs for IVM revealed that mTurquoise andmVenus are well suited for FRET-based biosensor probesfor 2PE IVM. There are distinct advantages of this FPpairing for IVM biosensor probes compared with the otherFPs tested. First, the cyan FPs are optimally excited near thepower maximum of the titanium-sapphire lasers typically
1.4
1.3
1.2
1.1
1.0
0
Time (min)
-1.5 -1.0 - 0.5 0 0.5 1.0 1.5 2.0 2.5 3.0 3.5 4.0 4.5 5.0 5.5 6.0 6.5 7.0 7.5
Pre-treatment
Fsk 3 min
3.0
2.8
2.6
2.4
2.2
2.0
1.8
ns
ROI 1
ROI 2
3.0
2.8
2.6
2.4
2.2
2.0
1.8
ns
200
150
100
50
0
200
150
100
50
0
Pre-treatment
Fsk 8.5 min Fsk 8.5 min
50
48
46
44
40
38
360 2 4 6 8 10
42
EFRE
T(%
)
ROI 1
ROI 2
Pre-treatment
Donor intensity Donor lifetime
Time (min)
Fsk
A B
C D
1.61.31.00.70.4
Ratio
1.61.31.00.70.4
Ratio
Norm
alize
dVen
/Tur
qEmi
ssion
Ratio
Fig. 3. A: ratiometric measurements of the response of the AKAR4.1 probe to forskolin (Fsk) treatment in living cells. HEK293 cells expressing the AKAR4.1reporter were illuminated at 810 nm, and the emission signals were simultaneously monitored in the donor (454–494 nm) and acceptor (520–580 nm) channels.The Ven/Turq ratio was determined as described in RESULTS. B: FRET ratio images of cells prior to and 3 min after Fsk treatment. C: the change in AKAR4.1FRET efficiency (EFRET) upon Fsk treatment was determined by lifetime measurements using Eq. 4 for the regions of interest (ROI) indicated in D. D: intensityimages and lifetime maps for a cell prior to and 8.5 min after Fsk treatment (scale bar, 10 �m).
Methods In Cell Physiology
C731MONITORING FRET-BASED BIOSENSORS IN LIVING ANIMALS
AJP-Cell Physiol • doi:10.1152/ajpcell.00182.2015 • www.ajpcell.org
by 10.220.33.4 on January 30, 2017http://ajpcell.physiology.org/
Dow
nloaded from
used for 2PE microscopy. While the usefulness of the earliervariants of the cyan FPs was limited by poor brightness andphotostability, and unfavorable photoswitching behavior,the newer versions of these probes, including mTurquoise,have largely overcome these problems (7, 8, 17, 32). Sec-ond, mVenus is an efficient FRET acceptor for mTurquoise,but it is minimally excited between 800 nm and 820 nm.This reduces the fluorescence cross talk caused by the directexcitation of mVenus at the wavelengths used to excitemTurquoise. Finally, many existing FRET-based biosensorprobes were developed with earlier variants of the cyan andyellow FPs, so most imaging systems are already designedfor the detection of these probes.
Here, the FRET standard approach was used to substantiatemTurquoise and mVenus for 2PE ratiometric measurements.Furthermore, this approach enabled the development of asimple and robust correction method to obtain accurate deter-minations of EFRET with high sensitivity from two-channelimages of the biosensor probes expressed in cells of intactanimals. It is important to point out that the cross talk correc-tions we identified are specific to our system and must bedetermined for each microscope. Here, we provided a straight-forward method for this evaluation. We demonstrated that 2PEmeasurements for cells expressing each of the FRET standardsproduced the expected FRET efficiency (EFRET), as validatedby FLIM and verified by acceptor photobleaching. The sensi-tivity of the approach was demonstrated in the direct compar-ison of the FRET standards with linker lengths of 5AA and10AA. Measurements using the 2PE approach clearly distin-guished an 11% decrease in EFRET for the standard with the
longer linker—a difference that was verified by the FLIM. Thisdemonstrates that the approach can be used to obtain accuratemeasurements of EFRET with high sensitivity from the linkedprobes expressed in living cells.
The approach was validated for biosensor probes usingAKAR4.1 to detect changes in the activity of PKA. The single2PE wavelength ratiometric measurement detected rapid andspecific changes in cytoplasmic PKA activity in culturedHEK293 cells and primary cardiomyocytes in response totreatment with forskolin and in hepatocytes in the liver ofliving mice upon stimulation with glucagon. These resultsdemonstrate that this simple approach, using a standard mul-tiphoton microscope system, can enable the noninvasive de-tection of FRET-based biosensor activities in intact mice athigh spatiotemporal resolution. A similar 2PE ratiometric ap-proach was used earlier to detect calpain or caspase-3 proteaseactivity in vivo (1, 12, 33). The linkers separating the FPs inthe sensing units of these biosensors contain the substrate for aspecific protease, with the cleavage of the linker reportingprotease activity that is typically associated with the onset ofcell death. The resulting “on-off” FRET signal can be apowerful tool in studies of responses to therapeutic strategies(12). In contrast, the conformational biosensors such as AKARdetect the dynamic response to cellular signaling events, withratiometric measurements of biosensor activity reporting thechanging spatiotemporal landscape of cell signaling (5, 19, 37,39, 40, 42).
It is important to recognize that measurements collected atgreater depth in vivo will have a higher detection thresholdbecause of signal attenuation at depth (10). Furthermore, there
0 60 120 180 240 300 360 420 480 540 600
1.4
1.3
1.2
1.1
1.0
Time (s)
A
B
AKAR4.1 (± SE)
Turq-10aa-Venus (± SE)
Fsk
Time 0 210 s 390 sRatio
2.2
1.8
1.2
0.9
0.5
Norm
alize
dVen
/Tur
qEmi
ssion
Ratio
Fig. 4. A: ratiometric measurements of theresponse of the AKAR4.1 probe to forskolin(Fsk) in isolated primary mouse fetal cardi-omyocytes. Freshly isolated primary cardio-myocytes were transfected with either theplasmid encoding AKAR4.1 or the mTur-quoise-10AA-Venus FRET standard. Therewas a rapid increase in the Ven/Turq ratiofor the cells expressing AKAR4.1, but notthe FRET standard over a 3-min time frame.The results for AKAR4.1 are from the 9individual cells (� SE). B: ratio images of asingle cardiomyocyte at the indicated timepoints (scale bar, 10 �m).
Methods In Cell Physiology
C732 MONITORING FRET-BASED BIOSENSORS IN LIVING ANIMALS
AJP-Cell Physiol • doi:10.1152/ajpcell.00182.2015 • www.ajpcell.org
by 10.220.33.4 on January 30, 2017http://ajpcell.physiology.org/
Dow
nloaded from
are wavelength-dependent differences in scattering that couldintroduce depth-dependent effects on ratiometric measure-ments collected in biological tissues. While we found noevidence of a significant effect of depth on our measurements,the studies of Radbruch et al. (26) did indicate minor effects ofdepth on ratiometric FRET measurements. Therefore, studiescollected over a large range of depths should be evaluated forsystematic effects of depth on ratiometric measures. In addi-tion, differences in the susceptibility of the donor and acceptorto photobleaching could affect the measured ratios. The effectsof photobleaching can be minimized by careful control ofillumination levels (26).
Some of the problems associated with 2PE ratiometricimaging can be mitigated by using the FRET-FLIM ap-proach. FLIM measurements are made only in the donorchannel, and they quantify the change in donor lifetime thatoccurs as the result of FRET. Since the measurements aremade in the time domain, they are unaffected by variationsin probe concentration or by changes in the excitationintensity (4). The FRET-FLIM approach was used for intra-vital measurements of neuronal calcium fluctuations in re-sponse to chronic inflammation in the central nervous sys-tem of living mice (27, 26). This approach, however, re-quires the collection of enough photons to accurately assignlifetimes, which can be limiting for deep-tissue imaging,and may require long acquisition times that would limitdynamic measurements.
The approach described here could be improved in tworespects. First, we recognize that the use of an opticalparametric oscillator (OPO) for tuneable excitation from1,100 nm to 1,300 nm would greatly expand the usefulFPs available for 2PE FRET studies (41). For example, the
use of green and red FPs for intravital FRET measurementsreduces light scatter at depth, and there are improved FPs forthis application (15, 38). The continued development of redand near infrared FPs will greatly expand this approach.OPO, however, adds to an already complex and expensivemicroscope system (36). Second, because of equipmentlimitations, we collected the fluorescence emissions usingdescanned spectral detectors. Since scattered fluorescenceemissions can be better captured using nondescanned detec-tors, more efficient collection of images from tissue at depthcould be accomplished using nondescanned detectors,equipped with optical filters optimized for the emissionspectra of mTurquoise and mVenus. Third, our approachwas predicated on the need to rapidly collect images usinga single excitation wavelength. Multiphoton microscopesystems are increasingly deployed with multiple lasers, orsingle lasers providing multiple emission lines. Such sys-tems would support rapid collection of fluorescence stimu-lated at different excitation wavelengths and would not belimited to ratiometric measurements of linked probes.
Here, we have demonstrated a straightforward and sensi-tive 2PE method for monitoring FRET-based biosensoractivities at high spatiotemporal resolution in cells in livinganimals. Although demonstrated for the AKAR4.1 probe,we expect that the mTurquoise/mVenus pair could be ap-plied to a variety of different FRET-based biosensors. Thus,the approach described here could be used to translate manyof the kinds of studies currently conducted in cultured cellsto the in situ context of the living animal, supportingpowerful and exciting new studies of cellular biochemistryand signaling in vivo.
0 60 120 180 240 300 360 420 480 540 600
1.4
1.3
1.2
1.1
1.0
Time (s)
A
B
Y/C Cyto (± SE)
Y/C Nuc (± SE)
Time 0 90 s 130s 165 s
2.72.21.71.30.7
Ratio
Norm
alize
dVen
/Tur
qEmi
ssion
Ratio
Fig. 5. A: intravital microscopy (IVM) mea-surements of the response of the AKAR4.1probe to glucagon in hepatocytes in the intactmouse liver. The AKAR4.1 biosensor wasintroduced into mice by tail vein injection ofan adenoviral vector encoding AKAR4.1, re-sulting in extensive expression in the liver 7days later. Mice were fasted for 3 h prior toimaging by IVM, and three-dimensional im-age volumes (10 planes spanning 10 �m)were collected over time prior to and follow-ing intraperitoneal injection of glucagon (200�g/kg). Each volume was then summed, andbackground-corrected Ven/Turq ratios weredetermined for ROIs in the cytosol or nucleifor several cells in the field. The results forAKAR4.1 are from the 10 individual cells (�SE). B: ratio images from a single imageplane in mouse liver at the indicated timepoints (scale bar, 10 �m).
Methods In Cell Physiology
C733MONITORING FRET-BASED BIOSENSORS IN LIVING ANIMALS
AJP-Cell Physiol • doi:10.1152/ajpcell.00182.2015 • www.ajpcell.org
by 10.220.33.4 on January 30, 2017http://ajpcell.physiology.org/
Dow
nloaded from
ACKNOWLEDGMENTS
We thank Dr. Malgorzata Kamocka and Seth Winfree for assistance inmicroscopy, and Paula Cranfill (Florida State University) for the plasmidsencoding the fluorescent proteins. Microscopy studies were conducted at theIndiana Center for Biological Microscopy.
GRANTS
This research was supported by the National Institutes of HealthO’Brien Center for Advanced Renal Microscopic Analysis (NIH-NIDDKP30DK079312).
DISCLOSURES
No conflicts of interest, financial or otherwise, are declared by the author(s).
AUTHOR CONTRIBUTIONS
W.T., M.R., J.R., X.X., C.Q., T.H., M.W.D., and R.N.D. performed exper-iments; W.T. analyzed data; W.T., K.W.D., and R.N.D. interpreted results ofexperiments; W.T., M.R., J.R., X.X., C.Q., T.H., K.W.D., and R.N.D. editedand revised manuscript; W.T., M.R., J.R., X.X., C.Q., T.H., M.W.D., K.W.D.,and R.N.D. approved final version of manuscript; K.W.D. and R.N.D. con-ception and design of research; K.W.D. and R.N.D. drafted manuscript; R.N.D.prepared figures.
REFERENCES
1. Breart B, Lemaitre F, Celli S, Bousso P. Two-photon imaging ofintratumoral CD8� T cell cytotoxic activity during adoptive T cell therapyin mice. J Clin Invest 118: 1390–1397, 2008.
2. Broussard JA, Rappaz B, Webb DJ, Brown CM. Fluorescence reso-nance energy transfer microscopy as demonstrated by measuring theactivation of the serine/threonine kinase Akt. Nat Protoc 8: 265–281,2013.
3. Chen TS, Zeng SQ, Luo QM, Zhang ZH, Zhou W. High-order photo-bleaching of green fluorescent protein inside live cells in two-photonexcitation microscopy. Biochem Biophys Res Commun 291: 1272–1275,2002.
4. Day RN. Measuring protein interactions using Forster resonance energytransfer and fluorescence lifetime imaging microscopy. Methods 66: 200–207, 2014.
5. DiPilato LM, Zhang J. Fluorescent protein-based biosensors: resolvingspatiotemporal dynamics of signaling. Curr Opin Chem Biol 14: 37–42,2010.
6. Drobizhev M, Makarov NS, Tillo SE, Hughes TE, Rebane A. Two-photon absorption properties of fluorescent proteins. Nat Methods 8:393–399, 2011.
7. Goedhart J, van Weeren L, Hink MA, Vischer NO, Jalink K, GadellaTW Jr. Bright cyan fluorescent protein variants identified by fluorescencelifetime screening. Nat Methods 7: 137–139, 2010.
8. Goedhart J, von Stetten D, Noirclerc-Savoye M, Lelimousin M, JoosenL, Hink MA, van Weeren L, Gadella TW Jr, Royant A. Structure-guided evolution of cyan fluorescent proteins towards a quantum yield of93%. Nat Commun 3: 751, 2012.
9. Griesbeck O, Baird GS, Campbell RE, Zacharias DA, Tsien RY.Reducing the environmental sensitivity of yellow fluorescent protein.Mechanism and applications. J Biol Chem 276: 29188–29194, 2001.
10. Heim N, Garaschuk O, Friedrich MW, Mank M, Milos RI, KovalchukY, Konnerth A, Griesbeck O. Improved calcium imaging in transgenicmice expressing a troponin C-based biosensor. Nat Methods 4: 127–129,2007.
11. Helmchen F, Denk W. Deep tissue two-photon microscopy. Nat Methods2: 932–940, 2005.
12. Janssen A, Beerling E, Medema R, van Rheenen J. Intravital FRETimaging of tumor cell viability and mitosis during chemotherapy. PLosOne 8: e64029, 2013.
13. Koushik SV, Chen H, Thaler C, Puhl HL 3rd, Vogel SS. Cerulean,Venus, and VenusY67C FRET reference standards. Biophys J 91: L99–L101, 2006.
14. Kremers GJ, Hazelwood KL, Murphy CS, Davidson MW, Piston DW.Photoconversion in orange and red fluorescent proteins. Nat Methods 6:355–358, 2009.
15. Lam AJ, St-Pierre F, Gong Y, Marshall JD, Cranfill PJ, Baird MA,McKeown MR, Wiedenmann J, Davidson MW, Schnitzer MJ, Tsien
RY, Lin MZ. Improving FRET dynamic range with bright green and redfluorescent proteins. Nat Methods 9: 1005–1012, 2012.
15a.Lindquist R, Niesner R. Intravital FRET: comprehending life at single-molecule level. Focus on “A practical method for monitoring FRET-basedbiosensors in living animals using two-photon microscopy.” Am J PhysiolCell Physiol (October 14, 2015). doi:10.1152/ajpcell.00286.2015.
16. Luo J, Deng ZL, Luo X, Tang N, Song WX, Chen J, Sharff KA, LuuHH, Haydon RC, Kinzler KW, Vogelstein B, He TC. A protocol forrapid generation of recombinant adenoviruses using the AdEasy system.Nat Protoc 2: 1236–1247, 2007.
17. Markwardt ML, Kremers GJ, Kraft CA, Ray K, Cranfill PJ, WilsonKA, Day RN, Wachter RM, Davidson MW, Rizzo MA. An improvedcerulean fluorescent protein with enhanced brightness and reduced revers-ible photoswitching. PLos One 6: e17896, 2011.
18. Miller RA, Chu Q, Xie J, Foretz M, Viollet B, Birnbaum MJ.Biguanides suppress hepatic glucagon signalling by decreasing productionof cyclic AMP. Nature 494: 256–260, 2013.
19. Miyawaki A. Development of probes for cellular functions using fluores-cent proteins and fluorescence resonance energy transfer. Annu RevBiochem 80: 357–373, 2011.
20. Nagai T, Ibata K, Park ES, Kubota M, Mikoshiba K, Miyawaki A. Avariant of yellow fluorescent protein with fast and efficient maturation forcell-biological applications. Nat Biotechnol 20: 87–90, 2002.
21. Ni Q, Titov DV, Zhang J. Analyzing protein kinase dynamics in livingcells with FRET reporters. Methods 40: 279–286, 2006.
22. Park YC, Burkitt V, Villa AR, Tong L, Wu H. Structural basis forself-association and receptor recognition of human TRAF2. Nature 398:533–538, 1999.
23. Patterson GH, Piston DW. Photobleaching in two-photon excitationmicroscopy. Biophys J 78: 2159–2162, 2000.
24. Periasamy A, Day RN. Molecular Imaging: FRET Microscopy andSpectroscopy. New York: Oxford Univ. Press, 2005, p. 312.
25. Pittet MJ, Weissleder R. Intravital imaging. Cell 147: 983–991, 2011.26. Radbruch H, Bremer D, Mothes R, Gunther R, Rinnenthal JL,
Pohlan J, Ulbricht C, Hauser AE, Niesner R. Intravital FRET: probingcellular and tissue function in vivo. Int J Mol Sci 16: 11713–11727, 2015.
27. Rinnenthal JL, Bornchen C, Radbruch H, Andresen V, MossakowskiA, Siffrin V, Seelemann T, Spiecker H, Moll I, Herz J, Hauser AE,Zipp F, Behne MJ, Niesner R. Parallelized TCSPC for dynamic intravitalfluorescence lifetime imaging: quantifying neuronal dysfunction in neu-roinflammation. PLos One 8: e60100, 2013.
28. Rizzo MA, Springer GH, Granada B, Piston DW. An improved cyanfluorescent protein variant useful for FRET. Nat Biotechnol 22: 445–449,2004.
29. Rizzo MA, Springer G, Segawa K, Zipfel WR, Piston DW. Optimiza-tion of pairings and detection conditions for measurement of FRETbetween cyan and yellow fluorescent proteins. Microsc Microanal 12:238–254, 2006.
30. Ryan JC, Dunn KW, Decker BS. Effects of chronic kidney disease onliver transport: quantitative intravital microscopy of fluorescein transportin the rat liver. Am J Physiol Regul Integr Comp Physiol 307: R1488–R1492, 2014.
31. Shaner NC, Steinbach PA, Tsien RY. A guide to choosing fluorescentproteins. Nat Methods 2: 905–909, 2005.
32. Shaner NC, Lin MZ, McKeown MR, Steinbach PA, Hazelwood KL,Davidson MW, Tsien RY. Improving the photostability of bright mono-meric orange and red fluorescent proteins. Nat Methods 5: 545–551, 2008.
33. Stockholm D, Bartoli M, Sillon G, Bourg N, Davoust J, Richard I.Imaging calpain protease activity by multiphoton FRET in living mice. JMol Biol 346: 215–222, 2005.
34. Thaler C, Koushik SV, Blank PS, Vogel SS. Quantitative multiphotonspectral imaging and its use for measuring resonance energy transfer.Biophys J 89: 2736–2749, 2005.
35. Tillo SE, Hughes TE, Makarov NS, Rebane A, Drobizhev M. A newapproach to dual-color two-photon microscopy with fluorescent proteins.BMC Biotechnol 10: 6, 2010.
36. Timpson P, McGhee EJ, Anderson KI. Imaging molecular dynamics invivo–from cell biology to animal models. J Cell Sci 124: 2877–2890,2011.
37. VanEngelenburg SB, Palmer AE. Fluorescent biosensors of proteinfunction. Curr Opin Chem Biol 12: 60–65, 2008.
38. Yasuda R, Harvey CD, Zhong H, Sobczyk A, van Aelst L, SvobodaK. Supersensitive Ras activation in dendrites and spines revealed by
Methods In Cell Physiology
C734 MONITORING FRET-BASED BIOSENSORS IN LIVING ANIMALS
AJP-Cell Physiol • doi:10.1152/ajpcell.00182.2015 • www.ajpcell.org
by 10.220.33.4 on January 30, 2017http://ajpcell.physiology.org/
Dow
nloaded from

two-photon fluorescence lifetime imaging. Nat Neurosci 9: 283–291,2006.
39. Zhang J, Ma Y, Taylor SS, Tsien RY. Genetically encoded reporters ofprotein kinase A activity reveal impact of substrate tethering. Proc NatlAcad Sci USA 98: 14997–15002, 2001.
40. Zhang J, Campbell RE, Ting AY, Tsien RY. Creating new fluorescentprobes for cell biology. Nat Rev Mol Cell Biol 3: 906–918, 2002.
41. Zhang W, Parsons M, McConnell G. Flexible and stableoptical parametric oscillator based laser system for coherent anti-
Stokes Raman scattering microscopy. Microsc Res Tech 73: 650 –656,2010.
42. Zhou X, Herbst-Robinson KJ, Zhang J. Visualizing dynamic activ-ities of signaling enzymes using genetically encodable FRET-basedbiosensors from designs to applications. Methods Enzymol 504: 317–340, 2012.
43. Zipfel WR, Williams RM, Webb WW. Nonlinear magic: multi-photon microscopy in the biosciences. Nat Biotechnol 21: 1369 –1377,2003.
Methods In Cell Physiology
C735MONITORING FRET-BASED BIOSENSORS IN LIVING ANIMALS
AJP-Cell Physiol • doi:10.1152/ajpcell.00182.2015 • www.ajpcell.org
by 10.220.33.4 on January 30, 2017http://ajpcell.physiology.org/
Dow
nloaded from