a practical procedure for real-time functional mapping - schalk lab
TRANSCRIPT
Epilepsy & Behavior 15 (2009) 278–286
Contents lists available at ScienceDirect
Epilepsy & Behavior
journal homepage: www.elsevier .com/locate /yebeh
A practical procedure for real-time functional mapping of eloquent cortexusing electrocorticographic signals in humans
Peter Brunner a,b, Anthony L. Ritaccio c, Timothy M. Lynch c, Joseph F. Emrich d, J. Adam Wilson e,Justin C. Williams e, Erik J. Aarnoutse f, Nick F. Ramsey f, Eric C. Leuthardt g, Horst Bischof b,Gerwin Schalk a,c,g,h,i,*
a Brain–Computer Interface R&D Program, Wadsworth Center, New York State Department of Health, Albany, NY, USAb Institute for Computer Graphics and Vision, Graz University of Technology, Graz, Austriac Department of Neurology, Albany Medical College, Albany, NY, USAd Department of Neurosurgery, Albany Medical College, Albany, NY, USAe Department of Biomedical Engineering, University of Wisconsin at Madison, Madison, WI, USAf Rudolf Magnus Institute of Neuroscience, University Medical Center Utrecht, Utrecht, The Netherlandsg Department of Neurological Surgery, Washington University School of Medicine, St. Louis, MO, USAh Department of Biomedical Engineering, Rensselaer Polytechnic Institute, Troy, NY, USAi Department of Biomedical Sciences, School of Public Health, State University of New York at Albany, Albany, NY, USA
a r t i c l e i n f o
Article history:Received 13 February 2009Revised 31 March 2009Accepted 1 April 2009Available online 17 June 2009
Keywords:Electrical cortical stimulationFunctional mappingFunctional magnetic resonance imagingElectrocorticography
1525-5050/$ - see front matter � 2009 Elsevier Inc. Adoi:10.1016/j.yebeh.2009.04.001
* Corresponding author. Brain-Computer Interface RDepartment of Health, C650 Empire State Plaza, Alban+1 (518) 486 4910.
E-mail address: [email protected] (G. Schalk)
a b s t r a c t
Functional mapping of eloquent cortex is often necessary prior to invasive brain surgery, but currenttechniques that derive this mapping have important limitations. In this article, we demonstrate the firstcomprehensive evaluation of a rapid, robust, and practical mapping system that uses passive recordingsof electrocorticographic signals. This mapping procedure is based on the BCI2000 and SIGFRIED technol-ogies that we have been developing over the past several years. In our study, we evaluated 10 patientswith epilepsy from four different institutions and compared the results of our procedure with the resultsderived using electrical cortical stimulation (ECS) mapping. The results show that our procedure derives afunctional motor cortical map in only a few minutes. They also show a substantial concurrence with theresults derived using ECS mapping. Specifically, compared with ECS maps, a next-neighbor evaluationshowed no false negatives, and only 0.46 and 1.10% false positives for hand and tongue maps, respec-tively. In summary, we demonstrate the first comprehensive evaluation of a practical and robust mappingprocedure that could become a new tool for planning of invasive brain surgeries.
� 2009 Elsevier Inc. All rights reserved.
1. Introduction
Resective brain surgery is often performed in people withintractable epilepsy, congenital structural lesions, vascular anoma-lies, and neoplasms. Surgical planning of the resection proceduredepends substantially on the delineation of abnormal tissue, forexample, epileptic foci or tumor tissue, and on the creation of afunctional map of eloquent cortex in the area close to that abnor-mal tissue. Traditionally, different methodologies have been usedto produce this functional map: electrical cortical stimulation(ECS) [1–3], functional magnetic resonance imaging (fMRI) [4],positron emission tomography (PET) [5,6], magnetoencephalogra-phy (MEG) [7], and evoked potentials (EP) [8]. Each of these meth-
ll rights reserved.
&D Program, New York Statey, New York 12201, USA. Fax:
.
ods has problems that include morbidity, time consumption,expense, and practicality. As ECS has three-quarters of a centuryof historical and clinical relevance [9], and perhaps also becauseof its relative procedural simplicity and low cost, ECS has becomethe gold standard in mapping eloquent cortex. It has gained broadacceptance despite limited data to support efficacy [10] and de-spite several substantial issues. For example, ECS is time consum-ing because it requires a comprehensive search, that is, stimulationof each grid contact, while simultaneously determining the appro-priate stimulation amplitude. ECS can also produce afterdischargesthat may trigger seizures or even status epilepticus. This can resultin substantial delays, aborted procedures, and patient morbidity.The results derived using ECS may also not be correct because:(1) stimulation may produce inhibitory responses that cannotreadily be observed; (2) propagation of stimulation current is af-fected by the anatomy and potential after discharges, and thus var-iable; (3) there may be substantial procedural variability; and (4)stimulation-based mapping is based on a lesional and not a phys-

Table 1Comparison of the properties of ECS mapping and ECoG-based mapping
Electrical corticalstimulation
ECoG-based passivemapping
Time consuming Yes NoRisk of seizure induction Yes NoDifficulty in observing inhib. resp. Yes NoNecessity for antiepileptic drugs Yes NoVariable prop. of stim. current Yes NoProcedural variability Yes NoNonphysiological model Yes NoPatient compliance necessary Yes Currently yesProven by clinical studies Yes Not yet
Fig. 2. Example of an implanted subdural grid in patient AMC3. (A) Subdural gridplaced over frontoparietal areas. (B) Lateral radiograph indicating the position ofthe grid.
P. Brunner et al. / Epilepsy & Behavior 15 (2009) 278–286 279
iological model. Finally, ECS depends on patient compliance and,thus, cannot easily be used in some patient populations (such aspediatric patients). The characteristics of ECS are summarized inTable 1 and are reviewed in [11,12]. The problems described aboveincrease the risk to the patient and the time and cost associatedwith surgical planning.
Patients undergoing invasive brain surgery would benefitgreatly from a mapping methodology that does not have the prob-lems associated with existing techniques, that is, a method that issafe, can be rapidly applied, is comparatively inexpensive, is proce-durally simple, and also is congruent to existing techniques (in par-ticular to electrical stimulation). Task-related changes detected inelectrocorticographic (ECoG) recordings appear to have attractiveproperties (see Table 1) and, thus, could provide the basis for atechnique with those desirable characteristics. This approachseems particularly attractive because existing surgical protocolstypically already include the placement of subdural electrodes,and because a number of recent studies have shown that ECoGactivity recorded from these electrodes reflects task-relatedchanges [13–24]. These studies showed that ECoG amplitudes, inparticular, frequency bands carry substantial information aboutmovement or language tasks. Specifically, amplitudes typically de-crease in the mu (8–12 Hz) and beta (18–25 Hz) bands, whereas
Fig. 1. Example of ECoG signal changes between the tasks of repetitively openingand closing the hand and resting. (A) Signals in the mu/beta band (5–30 Hz)decrease with the task and are spatially less specific (lower topography), whereassignals in the gamma band (70–116 Hz) increase with the task and are spatiallymore specific (upper topography). (B) The power spectrum on a logarithmic scalefor the electrode marked with a star in the topographies illustrates the spectraldecrease in the mu/beta band (marked by the green bar) and the spectral increase inthe gamma band (orange bar). (For interpretation of the references to color in thisfigure legend, the reader is referred to the web version of this paper.)
amplitudes usually increase in the gamma (>40 Hz) band (seeFig. 1). Furthermore, recent studies have demonstrated that suchECoG changes, in particular those in the gamma band, were in gen-eral agreement with those derived using fMRI [25] and with resultsdetermined using ECS [22–24]. However, these traditional ECoG-based analyses usually need to be optimized for each individual.Typically they are generated by signal processing experts aftercomprehensive post hoc analyses. Although a few recent studieshave provided encouraging evidence that ECoG-based analysescould become more accessible to clinicians [26–28], a widely avail-able and robust procedure that can be used by nonexperts isneeded (See Fig. 2).
We demonstrate here a comprehensive evaluation of a robust,practical, and readily available procedure for presurgical functionalmapping of eloquent cortex using subdural electrodes. This proce-dure is based on our BCI2000 and SIGFRIED (SIGnal modeling ForReal-time Identification and Event Detection) technologies.BCI2000 is a general-purpose software platform for real-time bio-signal acquisition, processing, and feedback [29,30] (http://www.bci2000.org). In collaboration with other institutions, mostnotably the University of Tübingen in Germany, we have beendeveloping BCI2000 for close to 10 years. BCI2000 is currently inuse by more than 350 laboratories worldwide for a variety of stud-ies. It supports more than 15 different signal acquisition devicesand can thus be readily integrated into different research or clinicalenvironments. SIGFRIED [31,32] is a signal processing procedureimplemented within BCI2000 that can detect and visualize task-re-lated changes in real-time without prior parameterization (e.g., offrequency bands, visualization parameters, etc.) by an expert.
In this article, we demonstrate the use of the SIGFRIED/BCI2000system for delineating cortical areas related to tongue and handmotor function in 10 patients from four institutions. The resultsshow that our method can provide a functional map within onlya few minutes and that this map is in strong congruence to that de-rived by ECS mapping. Furthermore, they demonstrate that ourtechnique provides robust and practical mapping capabilities indifferent clinical environments.
2. Material and methods
2.1. Human subjects
A total of 10 patients (Table 2) at Albany Medical Center (Al-bany, NY, USA) [AMC1-5], Barnes–Jewish Hospital (St. Louis, MO,USA) [BJH1], Middleton Memorial Veterans Hospital (Madison,WI, USA) [VAH1-2], and University Medical Center Utrecht (Utr-echt, The Netherlands) [UMC1-2] were implanted with subduralplatinum electrode arrays (4 mm diameter, 2.3 mm exposed,1 cm interelectrode spacing, Ad-Tech, Racine, WI, USA) for a periodof 5–12 days prior to resection of a seizure focus. In each patient,

Table 2Patient characteristics
Subject Age Handedness Gender Hemispheric dominancefor language (IPA)
Full Scale IQ Surgery hemisphere Stimulationduration (h)
Fraction of electrodesstimulated
AMC1 19 Right Male N/Aa N/Ab Left 5 100% (48/48)AMC2 61 Right Female Left 95 Left 5 71% (52/77)AMC3 32 Right Female Left 99 Right 4 40% (24/48)AMC4 29 Right Male Left 94 Right 3 100% (84/84)AMC5 50 Right Male Bilateral 109 Right 2 43% (36/83)VAH1 62 Right Male Left N/Ac Right 1.5 70% (45/64)VAH2 36 Right Male Left N/Ad Right 2.5 26% (26/128)UMC1 28 Right Male Left 92 Left 4.5 93% (112/120)UMC2 27 Right Female Left 69 Left 7.5 69% (72/112)BJH1 44 Left Female Bilateral 95 Left 1.5 88% (56/64)
a IPA was not administered.b IQ was not tested; patient completed 12 years of education.c IQ was not tested; information about education not available.d IQ was not tested; patient completed 13 years of education.
280 P. Brunner et al. / Epilepsy & Behavior 15 (2009) 278–286
the seizure focus was identified by neurologists using visualinspection, and eloquent cortex was identified over a period of1.5–7.5 hours using ECS. For the majority of patients, this stimula-tion was not completed, thereby leaving 12 to 74% of the coveredcortex without stimulation results. Grid locations were classifiedas hand or tongue function if stimulation (typically 1–4 mA) elic-ited or inhibited motor activity or sensation. Some of the contactswere not stimulated for different reasons: (1) They had no rele-vance to the surgical procedure; that is, they were sufficiently dis-tant to any planned resection. (2) The minimum stimulationcurrent (e.g., 4 mA) could not be reached without inducing pain.(3) Stimulation induced a seizure before any response was de-tected. (4) There were time constraints. (5) Stimulation inducedglobal afterdischarges. The locations of the seizure foci and elo-quent cortex were subsequently used for planning surgical resec-tion. Location and duration of the implantation were determinedsolely by clinical criteria and only patients with some perirolandiccoverage were included in the study. All patients gave informedconsent through a protocol reviewed and approved by each ofthe participating institutions’ review boards (see Fig. 2).
2.2. Data collection
During the monitoring period, we recorded ECoG signals at thebedside from 32 to 128 contacts of the implanted grids using dif-ferent biosignal acquisition devices (Table 3). Scalp or grid elec-trodes were used for reference and ground. Data collection andstimulus presentation was accomplished using BCI2000 [29] soft-ware, a general-purpose system for real-time biosignal acquisition,processing and feedback. Real-time signal processing and visuali-zation were performed using the SIGFRIED method [31,32] imple-mented within BCI2000.
Table 3Signal recording properties
Subject Channels Sampling (Hz) Filter (Hz) Update rate (Hz)
AMC1 32 256 0.1 32AMC2 32 256 0.1 32AMC3 32 1200 0.1 30AMC4 32 1200 0.1 30AMC5 64 1200 0.01 15VAH1 32 1061 3–512 35VAH2 64 1061 3–512 35UMC1 128 512 0.15–134.4 16UMC2 128 512 0.15–134.4 16BJH1 64 1200 0.1 30
2.3. Experimental protocol
We first recorded 6 minutes of baseline data during which thesubject was asked to remain relaxed and to avoid any movements.Then, each subject performed alternating sequences of repetitivemovements of the tongue, that is, protrusion and retraction ofthe tongue; movements of the hand, that is, opening and closingof the hand contralateral to the side of the grid placement; andresting. The subject was visually cued by the word ‘‘tongue” or‘‘hand”, which was presented on a computer screen (a blank screenindicated the resting period). Each task was performed for 3 sec-onds (15 seconds for subject UMC1) at a self-paced rate of abouttwo repetitions per second, followed by a resting period of thesame duration (Fig. 3) before the next task. One run consisted of15 repetitions of this sequence over the course of 180 seconds.We typically recorded one initial run to familiarize the subject withthe task. All analyses in this article are for one run following theinitial training run. The visual display to the investigator duringonline operation of this run was provided as described below.
2.4. Signal analysis
To provide a basis for real-time feedback, we first used the SIG-FRIED procedure [31,32] to establish a statistical model of the re-corded baseline data. While the subject executed the task, wethen used this procedure to identify in real-time those grid con-tacts that showed activity changes that were statistically differentfrom the baseline model. In short, we used the following signalpreprocessing, feature extraction, and feature selection configura-tions: First, the signal from each grid contact was re-referencedusing a common average reference (CAR) filter [33]. Then, for eachgrid contact and 500-ms period, the time series ECoG signal wasconverted into the frequency domain using an autoregressive mod-el [34–36] with a model order of 1/10th of the sampling rate. Fre-quencies between 70 and 100 Hz (10 bins at 4-Hz bandwidth) weresubmitted to SIGFRIED. During online processing, SIGFRIED thenused the established baseline model to calculate for each grid con-tact the likelihood that the signal at that grid contact was statisti-cally different from the modeled baseline signals. This likelihoodwas calculated every 28.27 to 66.66 ms (see Table 3).
Fig. 4 illustrates time courses of the negative log-transformedlikelihood values for two locations recorded from subject VAH2.The upper trace corresponds to the location marked with a starin (See Fig. 2)Fig. 7. The bottom trace corresponds to the locationmarked with a rectangle. The times of cue presentation for handmovements are marked with yellow bars, and those for tongue

Fig. 3. SIGFRIED-based mapping procedure: After an initial 6-minute baseline period, an automated routine generates a statistical signal model for that baseline period foreach electrode (this automated procedure takes less than 1 minute). The subject then alternated between hand and tongue movement tasks interspersed with rest periods.
Fig. 4. Output of the SIGFRIED procedure for two locations recorded from subject VAH2. Locations for hand (top) and tongue (bottom) electrodes are each marked in Fig. 7 bya star and rectangle, respectively.
P. Brunner et al. / Epilepsy & Behavior 15 (2009) 278–286 281
movements, with red bars. Interleaved rest periods are shown inwhite. The SIGFRIED trace in the upper figure detects hand move-ments but not tongue movements, whereas the bottom trace de-tects tongue but not hand movements.
Finally, for each grid contact and task, the distribution of thenegative log-transformed likelihood values was further re-refer-enced to those values calculated during the resting period betweenthe tasks by calculating the value of r2, that is, the proportion ofvalues that was accounted for by the task. This resulted in a value
Fig. 5. Equipment setup and interface to the investigator. The subject is presented withrecorded. Both the patient screen and the data acquisition device are interfaced with a lathese signals in real time to the SIGFRIED method, and presents the results visually in a
between 0 (not different) and 1 (very different) for each grid con-tact and task.
2.5. Interface to the investigator
The results from the signal analyses described above were pre-sented to the investigator in real-time using a topographic interface(Fig. 5). The interface contained, for each task (i.e., hand or tongue), adisplay of the r2 values at each location. Each display contained one
visual cues shown on a computer monitor while electrocorticographic signals areptop computer running BCI2000. BCI2000 acquires signals from the device, submitstopographical display to the investigator.

282 P. Brunner et al. / Epilepsy & Behavior 15 (2009) 278–286
circle at each electrode’s location. The size of each circle and its tintwas proportional to the r2 value. Thus, a large red circle representeda large statistical difference between the corresponding task andrest, whereas a small black circle indicated a small statistical differ-ence. The display corresponding to each task was autoscaled to theminimum and maximum r2 value. Thus, no parameter (e.g., fre-quency range, display or detection parameters) needed to be chan-ged by the investigator prior to or during system operation.
Fig. 6. Results of electrical cortical stimulation (left) and passive functional mapping usiresults of electrical cortical stimulation for hand (yellow) and tongue (red) and no respolateral radiographs (right) show the result of passive functional mapping using SIGFRIEDindicates the final maximum r2 between the stimulus and the SIGFRIED response (0 toreferred to the web version of this paper.)
3. Results
3.1. Qualitative results
The following paragraphs describe the results derived using theSIGFRIED mapping procedure, and qualitatively and quantitativelycompare the results with those obtained with ECS mapping.
ng SIGFRIED (right) for subjects AMC1 to AMC5. Lateral radiographs (left) show thense to hand or tongue (white). Transparent circles indicate no stimulation. Detailedafter 30, 60, 120, and 180 seconds for hand (yellow) and tongue (red). The number
1). (For interpretation of the references to color in this figure legend, the reader is

P. Brunner et al. / Epilepsy & Behavior 15 (2009) 278–286 283
The main results of this article are illustrated for all subjects inFigs. 6 and 7, and in Supplementary Videos 1 and 2. In each figure,the lateral radiographs (all subjects except UMC1 and UMC2) orcomputer tomography (CT) images (UMC1 and UMC2) on the leftshow grid contacts marked by colored circles. Contacts that werestimulated and identified as eloquent cortex associated with hand
Fig. 7. Results of electrical cortical stimulation (left) and passive functional mappingradiographs or computer tomographic renderings (left) show the results of electrical cotongue (white). Transparent circles indicate no stimulation. Detailed lateral radiographs120, and 180 seconds for hand (yellow) and tongue (red). The number indicates the final mSIGFRIED traces in Fig. 4 are for the locations marked by a yellow star and red rectanglefigure legend, the reader is referred to the web version of this paper.)
function are shown in yellow, those associated with tongue func-tion are shown in red, and those associated with neither handnor tongue function are shown in white. Semitransparent whitecircles indicate locations that were not stimulated.
The four detailed lateral radiographs/CT images on the rightshow the results of the SIGFRIED mapping procedure derived after
using SIGFRIED (right) for subjects VAH1, VAH2, UMC1, UMC2, and BJH1. Lateralrtical stimulation for hand (yellow) and tongue (red) and no response to hand or(right) show the result of passive functional mapping using SIGFRIED after 30, 60,aximum r2 between the stimulus and the SIGFRIED response (0 to 1). The real-timein subject VAH2, respectively. (For interpretation of the references to color in this
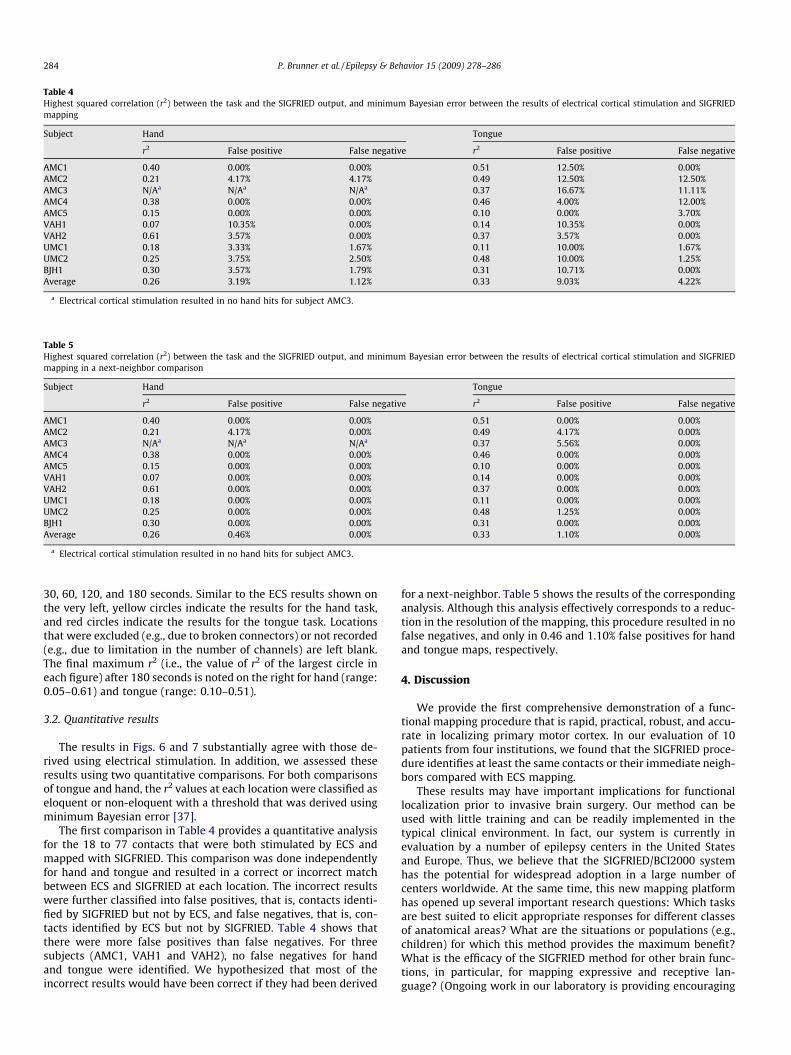
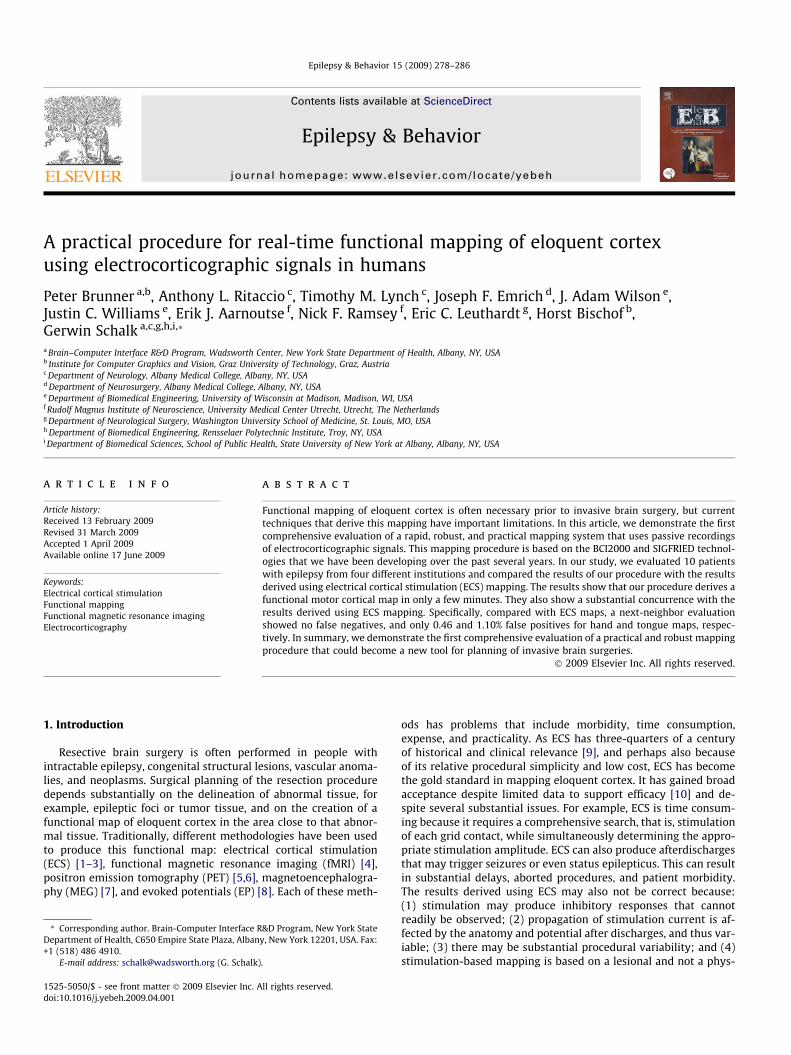
Table 4Highest squared correlation (r2) between the task and the SIGFRIED output, and minimum Bayesian error between the results of electrical cortical stimulation and SIGFRIEDmapping
Subject Hand Tongue
r2 False positive False negative r2 False positive False negative
AMC1 0.40 0.00% 0.00% 0.51 12.50% 0.00%AMC2 0.21 4.17% 4.17% 0.49 12.50% 12.50%AMC3 N/Aa N/Aa N/Aa 0.37 16.67% 11.11%AMC4 0.38 0.00% 0.00% 0.46 4.00% 12.00%AMC5 0.15 0.00% 0.00% 0.10 0.00% 3.70%VAH1 0.07 10.35% 0.00% 0.14 10.35% 0.00%VAH2 0.61 3.57% 0.00% 0.37 3.57% 0.00%UMC1 0.18 3.33% 1.67% 0.11 10.00% 1.67%UMC2 0.25 3.75% 2.50% 0.48 10.00% 1.25%BJH1 0.30 3.57% 1.79% 0.31 10.71% 0.00%Average 0.26 3.19% 1.12% 0.33 9.03% 4.22%
a Electrical cortical stimulation resulted in no hand hits for subject AMC3.
Table 5Highest squared correlation (r2) between the task and the SIGFRIED output, and minimum Bayesian error between the results of electrical cortical stimulation and SIGFRIEDmapping in a next-neighbor comparison
Subject Hand Tongue
r2 False positive False negative r2 False positive False negative
AMC1 0.40 0.00% 0.00% 0.51 0.00% 0.00%AMC2 0.21 4.17% 0.00% 0.49 4.17% 0.00%AMC3 N/Aa N/Aa N/Aa 0.37 5.56% 0.00%AMC4 0.38 0.00% 0.00% 0.46 0.00% 0.00%AMC5 0.15 0.00% 0.00% 0.10 0.00% 0.00%VAH1 0.07 0.00% 0.00% 0.14 0.00% 0.00%VAH2 0.61 0.00% 0.00% 0.37 0.00% 0.00%UMC1 0.18 0.00% 0.00% 0.11 0.00% 0.00%UMC2 0.25 0.00% 0.00% 0.48 1.25% 0.00%BJH1 0.30 0.00% 0.00% 0.31 0.00% 0.00%Average 0.26 0.46% 0.00% 0.33 1.10% 0.00%
a Electrical cortical stimulation resulted in no hand hits for subject AMC3.
284 P. Brunner et al. / Epilepsy & Behavior 15 (2009) 278–286
30, 60, 120, and 180 seconds. Similar to the ECS results shown onthe very left, yellow circles indicate the results for the hand task,and red circles indicate the results for the tongue task. Locationsthat were excluded (e.g., due to broken connectors) or not recorded(e.g., due to limitation in the number of channels) are left blank.The final maximum r2 (i.e., the value of r2 of the largest circle ineach figure) after 180 seconds is noted on the right for hand (range:0.05–0.61) and tongue (range: 0.10–0.51).
3.2. Quantitative results
The results in Figs. 6 and 7 substantially agree with those de-rived using electrical stimulation. In addition, we assessed theseresults using two quantitative comparisons. For both comparisonsof tongue and hand, the r2 values at each location were classified aseloquent or non-eloquent with a threshold that was derived usingminimum Bayesian error [37].
The first comparison in Table 4 provides a quantitative analysisfor the 18 to 77 contacts that were both stimulated by ECS andmapped with SIGFRIED. This comparison was done independentlyfor hand and tongue and resulted in a correct or incorrect matchbetween ECS and SIGFRIED at each location. The incorrect resultswere further classified into false positives, that is, contacts identi-fied by SIGFRIED but not by ECS, and false negatives, that is, con-tacts identified by ECS but not by SIGFRIED. Table 4 shows thatthere were more false positives than false negatives. For threesubjects (AMC1, VAH1 and VAH2), no false negatives for handand tongue were identified. We hypothesized that most of theincorrect results would have been correct if they had been derived
for a next-neighbor. Table 5 shows the results of the correspondinganalysis. Although this analysis effectively corresponds to a reduc-tion in the resolution of the mapping, this procedure resulted in nofalse negatives, and only in 0.46 and 1.10% false positives for handand tongue maps, respectively.
4. Discussion
We provide the first comprehensive demonstration of a func-tional mapping procedure that is rapid, practical, robust, and accu-rate in localizing primary motor cortex. In our evaluation of 10patients from four institutions, we found that the SIGFRIED proce-dure identifies at least the same contacts or their immediate neigh-bors compared with ECS mapping.
These results may have important implications for functionallocalization prior to invasive brain surgery. Our method can beused with little training and can be readily implemented in thetypical clinical environment. In fact, our system is currently inevaluation by a number of epilepsy centers in the United Statesand Europe. Thus, we believe that the SIGFRIED/BCI2000 systemhas the potential for widespread adoption in a large number ofcenters worldwide. At the same time, this new mapping platformhas opened up several important research questions: Which tasksare best suited to elicit appropriate responses for different classesof anatomical areas? What are the situations or populations (e.g.,children) for which this method provides the maximum benefit?What is the efficacy of the SIGFRIED method for other brain func-tions, in particular, for mapping expressive and receptive lan-guage? (Ongoing work in our laboratory is providing encouraging

P. Brunner et al. / Epilepsy & Behavior 15 (2009) 278–286 285
evidence in this regard.) It is at present also unclear how this meth-od will be integrated into the clinical workflow. Despite the strongcongruence of the SIGFRIED-based results with ECS-based results,it is likely premature to replace ECS mapping with SIGFRIED-basedmapping. Rather, it seems more appropriate to optimize ECS map-ping based on the results of prior SIGFRIED mapping.
Like the recent study by Miller et al. [23], our study demon-strates considerable variance in the somatotopy across subjectsand coherence with the ECS mapping results. Both location andarea identified as eloquent cortex vary among subjects. Althoughfor Miller et al. it was not clear whether this was due to subjectvariability or expert variability in performing the ECS, our studyshows that a next-neighbor analysis achieves almost perfect coher-ence with the ECS mapping results. This suggests that most of thevariance is due to expert variability.
Crone et al. [14] reported that not all subjects displayed changesin the gamma band. This contrasts with the results of this study,which showed adequate task-related changes of gamma ampli-tudes (which were the basis for the SIGFRIED calculations) in all10 subjects. It is possible that this is due to a difference in hard-ware, processing, or motor tasks. For example, our own experience,and also results from a previous study [15], suggests that morecomplex tasks (such as the Rubic’s cube manipulation task in Sup-plementary Videos 1 and 2) increase the amplitude of the gammachanges.
The SIGFRIED results were generally in substantial agreementwith those derived using electrical stimulation, but there weresome differences. These differences could be attributed to severalfactors that include expert variability in ECS mapping or ECS’s var-iable current spread, low statistical significance, or the characteris-tics of the subject’s task. Cortex at remote locations may beactivated due to current spread, resulting in a site that is registeredby ECS and not by SIGFRIED. Conversely, SIGFRIED may falsely reg-ister sites with low statistical significance. For example, considerthe map for hand function in subject AMC3 (shown in Fig. 6). Thissubject’s grid did not have hand coverage; that is, ECS mapping didnot detect hand function in any electrode. The SIGFRIED map high-lights several sites, although the maximum r2 value (0.05) was verylow. Thus, the magnitude of the maximum r2 value provides andindex of confidence in a particular map. Future versions of the soft-ware could even calculate such a confidence index (i.e., a p value)explicitly. The factor that may have the largest influence on the dif-ferences between the ECS and SIGFRIED maps may be the nature ofthe subject’s task. In one extreme, this task would be very simple,and require only very limited areas of cortex for its execution. Inthis case, SIGFRIED would register only very few electrodes or noneat all. In the other extreme, the subject’s task would be difficult andrequire engagement of different cortical facilities. Thus, the use ofthis task would result in activation of more widespread areas ofcortex, and consequently, SIGFRIED would detect changes in moreelectrodes. As described above, recent experiments suggest thatthe use of more complex visuomotor tasks results in even more ro-bust maps. In sum, the optimal tasks for mapping motor and othercortices using the SIGFRIED method are currently unknown. How-ever, the rapidity of our method facilitates the use of several tasksthat engage the desired cortical area in different ways.
SIGFRIED mapping overcomes many problems associated withECS. It is also based on a different principle. Although ECS is basedon a lesional model [38], SIGFRIED is based on task-related changesin ECoG signals. The clinical impact of this difference is currentlyunclear. It is thought that the lesional model used with ECS closelyresembles the effect of surgical resection, in that it allows the iden-tification of those areas that are critical for a particular function. Incontrast, SIGFRIED detects those areas that change their activitywith a particular task. It may not detect areas that do not changetheir activity but are critical for a particular function, or may detect
areas that change their activity but are not critical. At the sametime, ECS clearly has problems of accuracy itself, for example, be-cause there is no defined standard for ECS mapping, because thereare practical (in particular, time) constraints for using ECS, and be-cause the resolution of ECS is limited due to current spread and theneed for bipolar stimulation. In summary, at this early stage of clin-ical validation, replacing ECS with the SIGFRIED/BCI2000 system isnot warranted. Nevertheless, despite its potential limitations, theremay already be distinct advantages over ECS mapping.
The ECS protocol labels each contact with the eloquent functionthat is elicited or inhibited as the contact is stimulated. Findingeloquent function at a low threshold terminates the protocol forthis contact, assuming that each type of eloquent function is spa-tially contiguous, as is suggested by the motor homunculus model[39]. Recent fMRI [40] and ECS [10] studies, however, show a morecomplex and spatially noncontiguous somatotopy. SIGFRIED map-ping could establish a comparable somatotopy by exploring differ-ent tasks, for example, a dedicated motor/sensory evaluation foreach finger. This could allow more detailed surgical planning andthus benefit the outcome of the resection procedure. However,the lack of a verifiable gold standard makes it difficult to assessthe quality of such a more detailed somatotopy. Only surgical out-come can provide a detailed assessment on whether a more de-tailed somatotopy may be beneficial.
Studies have shown task-related changes associated with ipsi-lateral movements in the low-frequency band [41–48]. The impli-cations of resecting cortical areas associated with these ipsilateralmovements have not been defined, mainly because ECS is not ableto elicit ipsilateral limb movement within the conventional stimu-lation thresholds [49,50]. SIGFRIED mapping could facilitate suchstudies by exploring ipsilateral tasks.
An initial application of the SIGFRIED/BCI2000 system is shownhere, but there are several ways in which this system can be fur-ther improved. As a first example of the potential for improvement,we observed a noticeable delay between stimulus onset and thepatient’s response even when there was good compliance of thesubject. Crone et al. also reported such delays, and estimated themto be in the 300–400 ms range for simple visually cued hand move-ments and tongue protrusions [14]. Our results show similar de-lays (see Fig. 4). Because the total duration of each stimulus wasonly 3 seconds (15 seconds for subject UMC1), a significant fractionof the signals were thus effectively assigned to the incorrect taskcategory. In more recent experiments, we have begun to alert thesubject to the change in condition by presenting an auditory stim-ulus, and we suspend data analysis for 1 second. In the end, it maybe possible to partially or even completely eliminate this need forpatient compliance, which is currently an issue for all mappingtechniques. For example, for motor tasks it would be relativelystraightforward to use motion sensors, such as a data glove, motioncapture device, or EMG electrodes, and simply to correlate SIG-FRIED values with the detected motion rather than with the stim-ulus. For sensory input, it would be possible to use programmabletactile stimulators and earphones. Thus, such approaches may fullyremove the requirement for patient compliance and facilitate map-ping in pediatric environments where patient compliance is eitherimpossible (e.g., with infants) or hard to obtain (e.g., with youngchildren). As another example of a potential improvement, it maybe possible to use SIGFRIED mapping intraoperatively. This couldreplace the two surgeries that are currently necessary with onesurgery that encompasses grid placement, mapping of eloquentcortex, and resection. In particular, in patients who do not requirelonger monitoring periods (e.g., patients with tumor), this wouldsignificantly decrease risks to the patient and costs ofhospitalization.
In conclusion, we have described the SIGFRIED/BCI2000 systemas a practical functional mapping procedure. This system is readily

286 P. Brunner et al. / Epilepsy & Behavior 15 (2009) 278–286
available at no cost for research and educational purposes atwww.bci2000.org, and there is substantial documentation on itstheory [29–32] and use (doc.bci2000.org). BCI2000 currently sup-ports signal acquisition from 15 different devices, and more arecontinually added. This should facilitate integration into existingclinical environments.
Acknowledgement
We acknowledge Dr. Michael Gruenthal for his helpful com-ments and Dr. Karl Sillay for his strong support for this study. Thiswork was supported by the US Army Research Office (W911NF-07-1-0415 (GS) and W911NF-08-1-0216 (GS)), and the NIH(EB006356 (GS), EB00856 (JRW and GS), K12-HD049077 (JCW),1KL2RR025012-01 (JCW), and 1T90DK070079-01 (JCW)).
Appendix A. Supplementary data
Supplementary data associated with this article can be found, inthe online version, at doi:10.1016/j.yebeh.2009.04.001.
References
[1] Hara K, Uematsu S, Lesser R, Gordon B, Hart J, Vining E. Representation ofprimary motor cortex in humans: studied with chronic subdural grid. Epilepsia1991;32(Suppl.):23–4.
[2] Ojemann GA. Cortical organization of language. J Neurosci 1991;11:2281–7.[3] Uematsu S, Lesser R, Fisher RS, et al. Motor and sensory cortex in humans:
topography studied with chronic subdural stimulation. Neurosurgery1992;31:59–71.
[4] Chakraborty A, McEvoy AW. Presurgical functional mapping with functionalMRI. Curr Opin Neurol 2008;21:446–51.
[5] Bittar RG, Olivier A, Sadikot AF, et al. Localization of somatosensory function byusing positron emission tomography scanning: a comparison withintraoperative cortical stimulation. J Neurosurg 1999;90:478–83.
[6] Meyer PT, Sturz L, Sabri O, et al. Preoperative motor system brain mappingusing positron emission tomography and statistical parametric mapping: hintson cortical reorganisation. J Neurol Neurosurg Psychiatry 2003;74:471–8.
[7] Ganslandt O, Fahlbusch R, Nimsky C, et al. Functional neuronavigation withmagnetoencephalography: outcome in 50 patients with lesions around themotor cortex. J Neurosurg 1999;91:73–9.
[8] Dinner DS, Lüders H, Lesser RP, Morris HH. Invasive methods of somatosensoryevoked potential monitoring. J Clin Neurophysiol 1986;3:113–30.
[9] Foerster O. The cerebral cortex in man. Lancet 1931;221:309–12.[10] Hamberger MJ. Cortical language mapping in epilepsy: a critical review.
Neuropsychol Rev 2007;17(4):477–89.[11] Devinsky O, Beric A, Dogali M. Electrical and magnetic stimulation of the brain
and spinal cord. New York: Raven Press; 1993.[12] Ojemann G, Ojemann J, Lettich E, Berger M. Cortical language localization in
left, dominant hemisphere. An electrical stimulation mapping investigation in117 patients. J Neurosurg 1989;71:316–26.
[13] Crone NE, Miglioretti DL, Gordon B, et al. Functional mapping of humansensorimotor cortex with electrocorticographic spectral analysis: 1. Alpha andbeta event-related desynchronization. Brain 1998;121(Pt. 12):2271–99.
[14] Crone NE, Miglioretti DL, Gordon B, Lesser RP. Functional mapping of humansensorimotor cortex with electrocorticographic spectral analysis. II. Event-related synchronization in the gamma band. Brain 1998;121(Pt. 12):2301–15.
[15] Aoki F, Fetz EE, Shupe L, Lettich E, Ojemann GA. Increased gamma-rangeactivity in human sensorimotor cortex during performance of visuomotortasks. J Clin Neurophysiol 1999;110:524–37.
[16] Aoki F, Fetz EE, Shupe L, Lettich E, Ojemann GA. Changes in power andcoherence of brain activity in human sensorimotor cortex during performanceof visuomotor tasks. Biosystems 2001;63:89–99.
[17] Crone NE, Boatman D, Gordon B, Hao L. Induced electrocorticographic gammaactivity during auditory perception. J Clin Neurophysiol 2001;112:565–82.
[18] Varela F, Lachaux JP, Rodriguez E, Martinerie J. The brainweb: phasesynchronization and large-scale integration. Nat Rev Neurosci 2001;2:229–39.
[19] Graimann B, Huggins JE, Levine SP, Pfurtscheller G. Visualization of significantERD/ERS patterns in multichannel EEG and ECoG data. J Clin Neurophysiol2002;113:43–7.
[20] Lachaux JP, Rudrauf D, Kahane P. Intracranial EEG and human brain mapping. JPhysiol Paris 2003;97:613–28.
[21] Fries P. A mechanism for cognitive dynamics: neuronal communicationthrough neuronal coherence. Trends Cogn Sci 2005;9:474–80.
[22] Sinai A, Bowers CW, Crainiceanu CM, et al. Electrocorticographic high gammaactivity versus electrical cortical stimulation mapping of naming. Brain2005;128(Pt. 7):1556–70.
[23] Miller KJ, Leuthardt EC, Schalk G, et al. Spectral changes in cortical surfacepotentials during motor movement. J Neurosci 2007;27:2424–32.
[24] Leuthardt EC, Miller K, Anderson NR, et al. Electrocorticographic frequencyalteration mapping: a clinical technique for mapping the motor cortex.Neurosurgery 2007;60(4, Suppl. 2):260–70.
[25] Lachaux JP, Fonlupt P, Kahane PP, et al. Relationship between task-relatedgamma oscillations and bold signal: new insights from combined fMRI andintracranial EEG. Hum Brain Mapp 2007;28:1368–75.
[26] Lachaux JP, Jerbi K, Bertrand O. et al., A blueprint for real-time functionalmapping via human intracranial recordings. PLoS ONE 2.
[27] Lachaux JP, Jerbi K, Bertrand O, et al. BrainTV: a novel approach for onlinemapping of human brain functions. Biol Res 2007;40:401–13.
[28] Miller KJ, denNijs M, Shenoy P, Miller JW, Rao RP, Ojemann JG. Real-timefunctional brain mapping using electrocorticography. Neuroimage2007;37:504–7.
[29] Schalk G, McFarland D, Hinterberger T, Birbaumer N, Wolpaw J. BCI2000: ageneral-purpose brain–computer interface (BCI) system. IEEE Trans BiomedEng 2004;51:1034–43.
[30] Mellinger J, Schalk G. BCI2000: a general-purpose software platform for BCI.In: Dornhege G, del R. Millan J, Hinterberger T, McFarland D, Müller K, editors.Toward brain–computer interfacing. Cambridge: MIT Press; 2007. p. 359–67.
[31] Schalk G, Brunner P, Gerhardt LA, Bischof H, Wolpaw JR. Brain–computerinterfaces (BCIs): detection instead of classification. J Neurosci Methods2008;167:51–62.
[32] Schalk G, Leuthardt EC, Brunner P, Ojemann JG, Gerhardt LA, Wolpaw JR. Real-time detection of event-related brain activity. Neuroimage 2008;43:245–9.
[33] McFarland DJ, McCane LM, David SV, Wolpaw JR. Spatial filter selection forEEG-based communication. Electroencephalogr Clin Neurophysiol1997;103:386–94.
[34] Burg JP. A new analysis technique for time series data, NATO Advanced StudyInstitute on Signal Processing: Underwater Acoustics 1968. Reprinted in [36].p. 42–8.
[35] Burg JP. The relationship between maximum entropy spectra and maximumlikelihood spectra. Geophysics 1972;37:375–6.
[36] Childers D, editor. Modern spectrum analysis. IEEE Press; 1978.[37] Berger J. Statistical decision theory and Bayesian analysis. Berlin: Springer–
Verlag; 1985.[38] Engel J, editor. Surgical treatment of the epilepsies. Philadelphia: Lippincott
Williams & Wilkins; 1993.[39] Penfield W, Rasmussen T, editors. The cerebral cortex of man. New
York: MacMillan; 1950.[40] Meier JD, Aflalo TN, Kastner S, Graziano MS. Complex organization of human
primary motor cortex: a high-resolution fMRI study. J Neurophysiol2008;100:1800–12.
[41] Yoshii F, Ginsberg MD, Kelley RE, et al. Asymmetric somatosensory activationwith right- vs left-hand stimulation: a positron emission tomographic study.Brain Res 1989;483:355–60.
[42] Chollet F, DiPiero V, Wise RJ, Brooks DJ, Dolan RJ, Frackowiak RS. The functionalanatomy of motor recovery after stroke in humans: a study with positronemission tomography. Ann Neurol 1991;29:63–71.
[43] Colebatch JG, Adams L, Murphy K, et al. Regional cerebral blood flow duringvolitional breathing in man. J Physiol 1991;443:91–103.
[44] Grafton ST, Mazziotta JC, Presty S, Friston KJ, Frackowiak RS, Phelps ME.Functional anatomy of human procedural learning determined with regionalcerebral blood flow and PET. J Neurosci 1992;12:2542–8.
[45] Kawashima R, Yamada K, Kinomura S, et al. Regional cerebral blood flowchanges of cortical motor areas and prefrontal areas in humans related toipsilateral and contralateral hand movement. Brain Res 1993;623:33–40.
[46] Kawashima R, Roland PE, O’Sullivan BT. Activity in the human primary motorcortex related to ipsilateral hand movements. Brain Res 1994;663:251–6.
[47] Kim SG, Ashe J, Georgopoulos AP, et al. Functional imaging of human motorcortex at high magnetic field. J Neurophysiol 1993;69:297–302.
[48] Wisneski KJ, Anderson N, Schalk G, Smyth M, Moran D, Leuthardt EC. Uniquecortical physiology associated with ipsilateral hand movements andneuroprosthetic implications. Stroke 2008;39:3351–9.
[49] Foerster O. The motor cortex in man in the light of Hughlings Jackson’sDoctrines. Brain 1936;59:135–59.
[50] Penfield W, Boldrey E. Somatic motor and sensory representation in thecerebral cortex of man as studied by electrical stimulation. Brain1937;60:389–443.