a pre-restoration fishery resource utilization assessment ... · a pre-restoration fishery resource...
TRANSCRIPT
Approved for public release; distribution is unlimited.
ERDC TN-DOER-E37 June 2013
A Pre-Restoration Fishery Resource Utilization
Assessment of an Estuarine Borrow Pit in Mobile Bay, Alabama
by Kevin J. Reine, Douglas G. Clarke, and Charles Dickerson
ABSTRACT: Many open-water habitats that provide Essential Fish Habitat functions are also thought to be particularly susceptible to dredging project impacts. Evidence exists, however, that placement of dredged material in open-water environments can result in viable — even enhanced — habitat attributes and functions for fish, shellfish and benthic invertebrates. For example, offshore dredged material placement sites are often used extensively as recreational fishing areas. Dredged material can also be used to restore degraded fish habitat, such as to fill artificial pits, holes, and depressions that are scattered throughout a majority of estuaries and coastal embayments. Studies dating back to the 1960s have shown that these artificial pits periodically or chronically have poor water quality conditions and consequently represent degraded fish habitat. Several factors contributing to the degraded habitat within the pits include both low dissolved oxygen and high hydrogen sulfide concentrations, particularly during summer months. A major contributing factor to potentially poor water quality in dredged holes is hypoxia or anoxia resulting from accumulation of organic material, poor tidal flushing, and water column stratification. In 2011, the Engineer Research and Development Center (ERDC) conducted a joint study with the U.S. Army Corps of Engineers, Mobile District to assess habitat quality of two dredged holes, designated Brookley and Airport Holes, located in upper Mobile Bay, Alabama. Seasonal conditions in both borrow pits were assessed in terms of water quality, benthic invertebrate community structure, and fishery resource assemblage composition and borrow pit utilization patterns. Water quality data indicated hypoxic/anoxic conditions were present during spring and summer with dissolved oxygen (DO) concentrations less than 2.5 mg/L (< 30% saturation) at depths of 4 m, falling to near 0.0 mg/L at depths greater than 5 m. During fall, lowest DO concentrations were slightly lower than 3 mg/l at water depths greater than 4.5 m. Haloclines were present during both spring and fall sampling events. Benthic macroinvertebrates were sampled by Ponar grab seasonally to evaluate recruitment and community structure. Thirty-eight taxa were collected over the course of the three sampling events. The average number of animals/sample (abundance) of natural bottoms was generally twice that of Airport Hole and nearly twenty-five times greater than Brookley Hole. Average number of taxa per sample at stations in natural bottoms was two to four times greater than at stations in both Airport and Brookley Holes. Benthic assemblages were dominated by polychaetous annelids. The capitellid polychaetes of the genus Mediomastus was the most abundant taxon comprising 52% of all specimens collected. Fishery hydroacoustic surveys were used to assess temporal and spatial distributions of fishes by site and season. In Brookley Hole, fish densities were greater during summer (mean = 68.5 fish/100 m3), followed by spring (mean = 11.4 fish/100 m3) and fall (8.2 fish/100 m3). At the control site (Airport Hole), fish densities were greater in fall, averaging 29.9 fish/100 m3, followed by spring (mean = 18.7 fish/100 m3) and summer (mean = 13.2 fish/100 m3). Conventional otter trawling was used to determine the composition of the fishery assemblage at each site by season. Spring
Report Documentation Page Form ApprovedOMB No. 0704-0188
Public reporting burden for the collection of information is estimated to average 1 hour per response, including the time for reviewing instructions, searching existing data sources, gathering andmaintaining the data needed, and completing and reviewing the collection of information. Send comments regarding this burden estimate or any other aspect of this collection of information,including suggestions for reducing this burden, to Washington Headquarters Services, Directorate for Information Operations and Reports, 1215 Jefferson Davis Highway, Suite 1204, ArlingtonVA 22202-4302. Respondents should be aware that notwithstanding any other provision of law, no person shall be subject to a penalty for failing to comply with a collection of information if itdoes not display a currently valid OMB control number.
1. REPORT DATE JUN 2013 2. REPORT TYPE
3. DATES COVERED 00-00-2013 to 00-00-2013
4. TITLE AND SUBTITLE A Pre-Restoration Fishery Resource Utilization Assessment of anEstuarine Borrow Pit in Mobile Bay, Alabama
5a. CONTRACT NUMBER
5b. GRANT NUMBER
5c. PROGRAM ELEMENT NUMBER
6. AUTHOR(S) 5d. PROJECT NUMBER
5e. TASK NUMBER
5f. WORK UNIT NUMBER
7. PERFORMING ORGANIZATION NAME(S) AND ADDRESS(ES) US Army Engineer Research and Development Center,DredgingOperations and Environmental Program (DOER),3909 Halls Ferry Road,Vicksburg,MS,39180
8. PERFORMING ORGANIZATIONREPORT NUMBER
9. SPONSORING/MONITORING AGENCY NAME(S) AND ADDRESS(ES) 10. SPONSOR/MONITOR’S ACRONYM(S)
11. SPONSOR/MONITOR’S REPORT NUMBER(S)
12. DISTRIBUTION/AVAILABILITY STATEMENT Approved for public release; distribution unlimited
13. SUPPLEMENTARY NOTES
14. ABSTRACT Many open-water habitats that provide Essential Fish Habitat functions are also thought to be particularlysusceptible to dredging project impacts. Evidence exists, however, that placement of dredged material inopen-water environments can result in viable ? even enhanced ? habitat attributes and functions for fish,shellfish and benthic invertebrates. For example offshore dredged material placement sites are often usedextensively as recreational fishing areas. Dredged material can also be used to restore degraded fishhabitat, such as to fill artificial pits holes, and depressions that are scattered throughout a majority ofestuaries and coastal embayments. Studies dating back to the 1960s have shown that these artificial pitsperiodically or chronically have poor water quality conditions and consequently represent degraded fishhabitat. Several factors contributing to the degraded habitat within the pits include both low dissolvedoxygen and high hydrogen sulfide concentrations, particularly during summer months. A majorcontributing factor to potentially poor water quality in dredged holes is hypoxia or anoxia resulting fromaccumulation of organic material, poor tidal flushing, and water column stratification. In 2011, theEngineer Research and Development Center (ERDC) conducted a joint study with the U.S. Army Corps ofEngineers, Mobile District to assess habitat quality of two dredged holes designated Brookley and AirportHoles, located in upper Mobile Bay, Alabama. Seasonal conditions in both borrow pits were assessed interms of water quality, benthic invertebrate community structure, and fishery resource assemblagecomposition and borrow pit utilization patterns. Water quality data indicated hypoxic/anoxic conditionswere present during spring and summer with dissolved oxygen (DO) concentrations less than 2.5 mg/L (<30% saturation) at depths of 4 m, falling to near 0.0 mg/L at depths greater than 5 m. During fall, lowestDO concentrations were slightly lower than 3 mg/l at water depths greater than 4.5 m. Haloclines werepresent during both spring and fall sampling events. Benthic macroinvertebrates were sampled by Ponargrab seasonally to evaluate recruitment and community structure. Thirty-eight taxa were collected overthe course of the three sampling events. The average number of animals/sample (abundance) of naturalbottoms was generally twice that of Airport Hole and nearly twenty-five times greater than Brookley Hole.Average number of taxa per sample at stations in natural bottoms was two to four times greater than atstations in both Airport and Brookley Holes. Benthic assemblages were dominated by polychaetousannelids. The capitellid polychaetes of the genus Mediomastus was the most abundant taxon comprising52% of all specimens collected. Fishery hydroacoustic surveys were used to assess temporal and spatialdistributions of fishes by site and
15. SUBJECT TERMS
16. SECURITY CLASSIFICATION OF: 17. LIMITATION OF ABSTRACT Same as
Report (SAR)
18. NUMBEROF PAGES
33
19a. NAME OFRESPONSIBLE PERSON
a. REPORT unclassified
b. ABSTRACT unclassified
c. THIS PAGE unclassified
Standard Form 298 (Rev. 8-98) Prescribed by ANSI Std Z39-18
ERDC TN-DOER-E37 June 2013
2
samples were characterized by juvenile drum (Sciaenidae spp.) and brown shrimp at Airport Hole, and white shrimp (Penaeus setiferus) and juvenile drum at Brookley Hole. Fall samples were characterized by Atlantic croaker (Micropogonias undulatus) in Brookley Hole and bay anchovy (Anchoa mitchilli) at Airport Hole. At both dredged holes, summer samples were characterized by bay anchovy, spot (Leiostomus xanthurus), threadfin shad (Dorosoma petenense), Atlantic croaker and white shrimp. Differences between borrow pits included proportionally smaller numbers of Atlantic croaker and spot and high numbers of white shrimp (numerically dominant species) at Brookley Hole, while at Airport Hole the distribution of these five species was fairly uniform; although bay anchovy was numerically dominant.
INTRODUCTION: Many harbor and inshore coastal habitats have been altered extensively by sand excavation for commercial aggregate and beach nourishment purposes. These topographic depressions or dredged holes are potential repositories for significant volumes of dredged material. In many cases, the depressions are characterized by poor sediment and water quality issues. Many dredged holes were created in bay areas that have low velocity water currents, which allows for fine sediment and organic material to accumulate. The resultant organic material buildup coupled with poor water circulation results in anaerobic decomposition and the production of hydrogen sulfide gas. This, in turn, depletes near bottom dissolved oxygen. Murawski (1969) reported that 21 of the 38 dredged holes in Barnegat Bay, NJ had low dissolved oxygen and high hydrogen sulfide concentrations, and that 20 of the 38 dredged holes were devoid of benthic invertebrates. When benthic invertebrates are present, they are generally represented by pollution indicator species, such as the annelid polychaetes Capitella capitata or Streblospio benedicti (Culter and Truitt, 1997). In 1992, the New Jersey Department of Environmental Protection (NJDEP) resurveyed the Barnegat Bay dredged holes (cited in USACE 2001) and found that they contained water quality conditions that did not differ substantially from those reported by Murawski (1969). Yozzo et al. (2004) reported similar conditions for many borrow sites located in Lower NY/NJ Harbor and Jamaica Bay. Borrow pits in NY/NJ Harbor (e.g., CAC pit and North and South Hoffman-Swinburne Pits) and Jamaica Bay (e.g., Little Bay and Norton Basin) are generally characterized by deep water, reduced hydrodynamic exchange, changes in sedimentation patterns, and altered biological communities. Wind-wave-induced current velocities also tended to increase when passing over deep waters of a borrow pit, enhancing the strength of waves reaching adjacent shorelines. In Jamaica Bay, pits are located in sheltered basins not subject to strong tidal currents, which results in persistent hypoxic conditions. Bokuniewicz et al. (1986) and Cerrato et al. (1989) reported significantly lower abundance and diversity of infaunal and epifaunal organisms for borrow pits within the New York Bight when compared to adjacent control sites. Not limited to the Eastern Seaboard of the United States, dredged holes can be found throughout Florida’s bays and estuaries (e.g., Tampa Bay, Florida) as well as along the northern Gulf of Mexico (e.g., Brookley and Airport Holes, Mobile, Alabama). The Tampa Bay Dredged Hole Habitat Assessment Advisory Team (2005) surveyed 16 dredged holes in Tampa Bay, Florida during summer and fall seasons and 14 holes during spring and early summer seasons. Density stratification was evident at some sites during all sampling periods. The authors also reported dissolved oxygen concentrations were anoxic (< 0.2 ppm) at some sites and hypoxic (< 2 ppm) at others. Benthic assemblages were extremely degraded at seven holes during summer and fall 2002 and at five dredged holes during spring 2003.
ERDC TN-DOER-E37 June 2013
3
Although degraded habitat conditions within dredged holes have existed for decades, to date there have been few examples of borrow pit restoration. Reine et al. (2012) studied the effects of a partial restoration of Dredged Hole #6 located in the Borough of Harvey Cedars in Barnegat Bay, NJ. Results were compared to an unrestored pit (Dredged Hole #5) located approximately 1.5 km south near the town of Loveladies, NJ. Dredged Hole #6 was filled to a target elevation of -5.5 m (-18 ft) MLW by placing dredged material derived from the Double Creek Channel using a hydraulic pipeline cutterhead dredge. The final restoration design included formation of six mounds in the elevated basin of the hole to add relief and increase the bathymetric complexity of the borrow pit basin. By mounding the sediments during the dredge and fill operation, it was theorized that the tops of sides of the mounds would provide conditions suitable to sustain and support a healthy and diverse benthic invertebrate community. Dredged sediments consisted primarily of sandy material with 70 to 90% coarse fractions. Approximately 96,000 cubic meters (125,000 cubic yards) of dredged material was pumped into Dredged Hole #6. A minimum of one-meter of sand was placed over the underlying fine-grained sediment as a foundation for creation of sand mounds. No evidence of hypoxia or water column stratification was evident post-restoration. Both ANOVA and Student’s T test indicated that the number of benthic taxa per sample and animals per sample were significantly higher (p<0.05) post-restoration.
From several perspectives, filling existing borrow pits represents a logistically and ecologically feasible restoration option. Borrow pits are potential placement sites for substantial volumes of dredged material if navigation channels requiring periodic maintenance dredging lie within reasonable pumping distances. Returning subtidal bottoms in the estuary to their historical depth contours could reestablish preexisting habitat attributes and functions. Detractors opposed to filling dredged holes claim that existing pits provide valuable recreational fishing areas and critical over-wintering habitat for various fishery resources. Potential benefits and detriments of borrow pits are reviewed in USACE (2001) and Yozzo et al. (2004).
BACKGROUND: In 2011, The Mobile Bay Interagency Working Group (IWG) selected Brookley Hole as a viable alternative as a locally preferred plan for beneficial use (BU) of dredged material from the Mobile Bay navigation channel (USACE 2012). Three filling scenarios were considered by the IWG: One alternative was to place enough material into the pit to bring the bottom elevation to a level where the basin would no longer exhibit hypoxic conditions, thereby returning some level of environmental productivity. This, in turn, would have allowed for both the reestablishment of benthic invertebrates in the basin bottom while not adversely impacting the pit with regards to fish utilization or recreational fishing. A second alternative consisted of successive dredge and fill cycles to return the bathymetry to historical depth contours matching existing surrounding bottom habitat. Filling to this level would allow the bottom, following consolidation of the dredged material, to support establishment of natural communities such as submerged aquatic vegetation (SAV) and oyster beds. A third alternative was to continue placement in successive dredging cycles until elevations were created that would support an emergent wetland. Such a feature would have provided a variety of natural ecosystems that would have been bene-ficial to numerous birds, fish, and benthic communities. The consensus of the IWG was to fill the Brookley Hole basin in stages. Post-fill monitoring would then be used to evaluate the performance of the fill and to then decide on a final plan. The initial placement action consisted of pumping approximately 1.2 million cubic yards of fine-grained material from the upper reach of the Mobile Bay navigation channel into the deepest area of Brookley Hole. This was accomplished by using a
ERDC TN-DOER-E37 June 2013
4
30-inch hydraulic cutterhead pipeline dredge. A submerged 30-inch pipeline ran east to west from the navigation channel to the Brookley Hole placement site. An anchored placement barge was tethered to the submerged line using approximately 1,000 feet (303 m) of floating pipeline. The placement barge was outfitted with a vertically down-turned terminus extending to a depth of approximately -15 ft (-4.5 m) MLLW for subaqueous placement within the hole. The dredged material slurry was discharged through the down-pipe fitted with a baffle plate to dissipate surge forces and enhance settling, approximately 5 feet (1.5 m) above the existing bottom.
METHODS
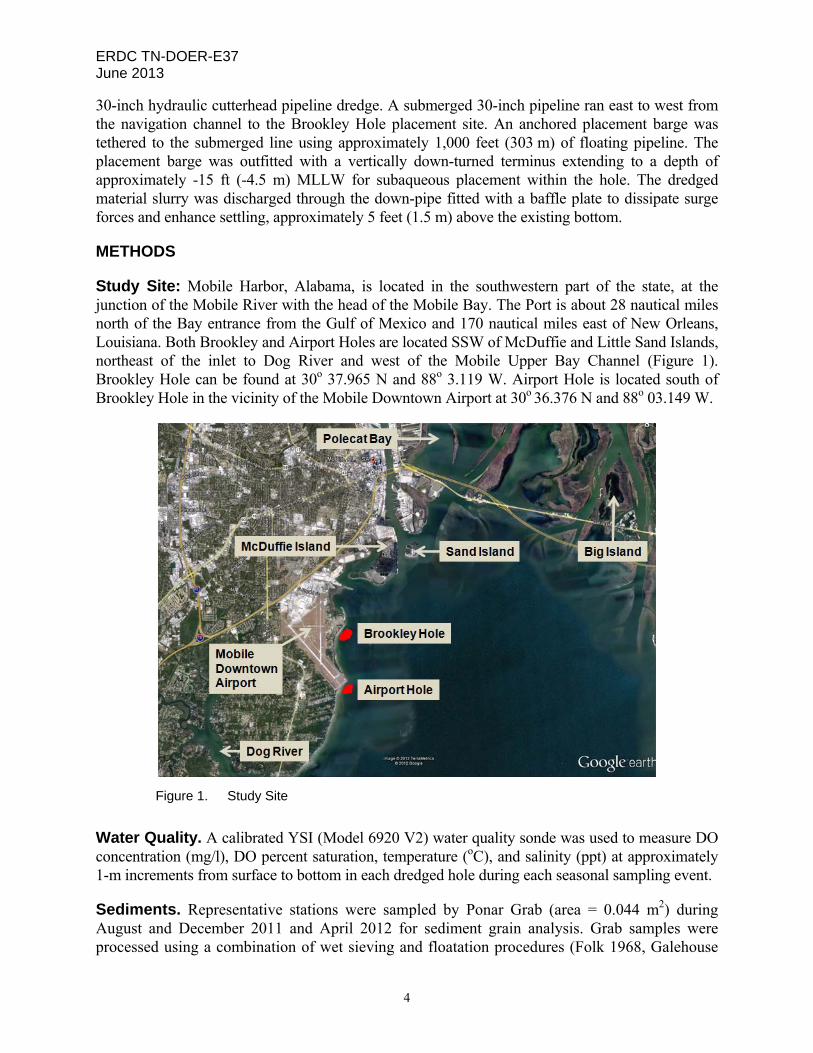
Study Site: Mobile Harbor, Alabama, is located in the southwestern part of the state, at the junction of the Mobile River with the head of the Mobile Bay. The Port is about 28 nautical miles north of the Bay entrance from the Gulf of Mexico and 170 nautical miles east of New Orleans, Louisiana. Both Brookley and Airport Holes are located SSW of McDuffie and Little Sand Islands, northeast of the inlet to Dog River and west of the Mobile Upper Bay Channel (Figure 1). Brookley Hole can be found at 30o 37.965 N and 88o 3.119 W. Airport Hole is located south of Brookley Hole in the vicinity of the Mobile Downtown Airport at 30o 36.376 N and 88o 03.149 W.
Figure 1. Study Site
Water Quality. A calibrated YSI (Model 6920 V2) water quality sonde was used to measure DO concentration (mg/l), DO percent saturation, temperature (oC), and salinity (ppt) at approximately 1-m increments from surface to bottom in each dredged hole during each seasonal sampling event.
Sediments. Representative stations were sampled by Ponar Grab (area = 0.044 m2) during August and December 2011 and April 2012 for sediment grain analysis. Grab samples were processed using a combination of wet sieving and floatation procedures (Folk 1968, Galehouse
ERDC TN-DOER-E37 June 2013
5
1971). Samples were first soaked in a 20% sodium hexametaphosphate solution to disaggregate the silt and clay fractions; then agitated in a sonic bath for several minutes. The disaggregation procedure was repeated prior to pipette analysis to ensure complete separation of the silt and clay fractions. Sediment data analysis was conducted using a Gradistat 4.0 (Blott 2000). Sediment analyses were supplemented with visual observations of materials present in the grab samples.
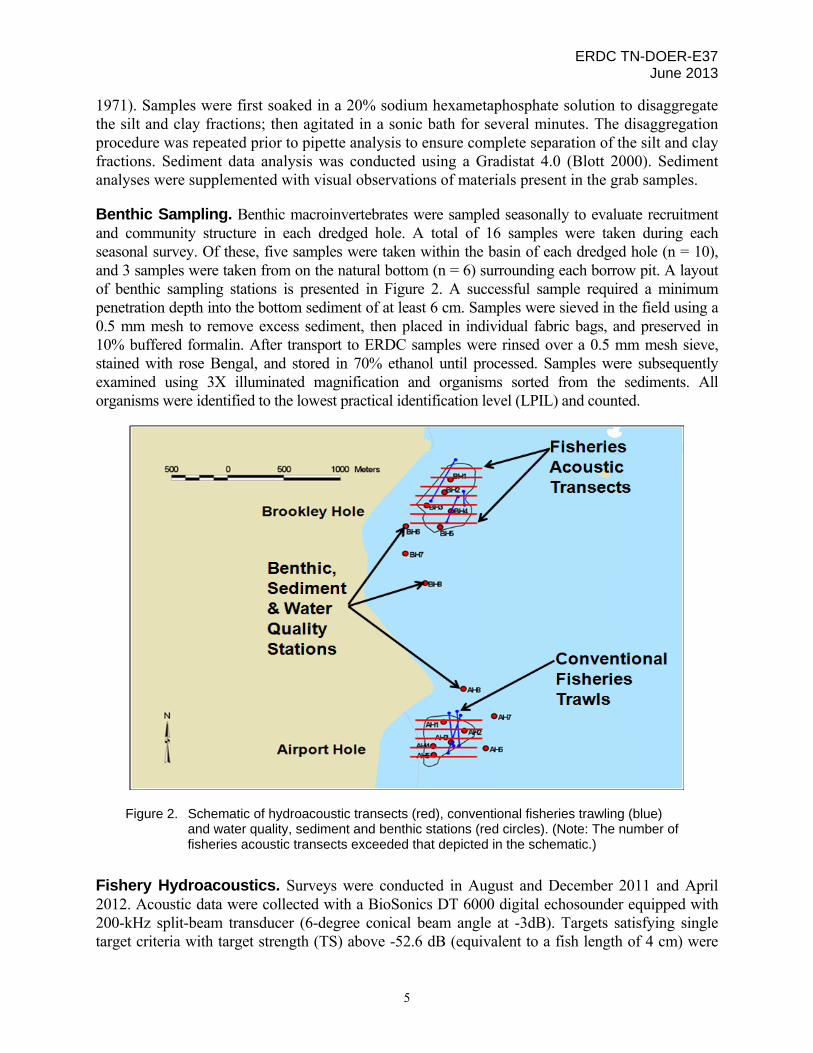
Benthic Sampling. Benthic macroinvertebrates were sampled seasonally to evaluate recruitment and community structure in each dredged hole. A total of 16 samples were taken during each seasonal survey. Of these, five samples were taken within the basin of each dredged hole (n = 10), and 3 samples were taken from on the natural bottom (n = 6) surrounding each borrow pit. A layout of benthic sampling stations is presented in Figure 2. A successful sample required a minimum penetration depth into the bottom sediment of at least 6 cm. Samples were sieved in the field using a 0.5 mm mesh to remove excess sediment, then placed in individual fabric bags, and preserved in 10% buffered formalin. After transport to ERDC samples were rinsed over a 0.5 mm mesh sieve, stained with rose Bengal, and stored in 70% ethanol until processed. Samples were subsequently examined using 3X illuminated magnification and organisms sorted from the sediments. All organisms were identified to the lowest practical identification level (LPIL) and counted.
Figure 2. Schematic of hydroacoustic transects (red), conventional fisheries trawling (blue) and water quality, sediment and benthic stations (red circles). (Note: The number of fisheries acoustic transects exceeded that depicted in the schematic.)
Fishery Hydroacoustics. Surveys were conducted in August and December 2011 and April 2012. Acoustic data were collected with a BioSonics DT 6000 digital echosounder equipped with 200-kHz split-beam transducer (6-degree conical beam angle at -3dB). Targets satisfying single target criteria with target strength (TS) above -52.6 dB (equivalent to a fish length of 4 cm) were
ERDC TN-DOER-E37 June 2013
6
accepted. The acoustic resolution (minimum target separation distance) of single targets was determined to be 0.23 m following R = cτ/2 (Simmonds and MacLennan 2005), where c = speed of sound in water (1,500 m s-1) and τ is pulse length duration (0.3 ms). Water temperature, salinity and depth were measured at stations in each borrow pit for correct calculation of speed of sound and absorption coefficients. Before each sampling period, the hydroacoustic equipment was calibrated using a tungsten carbide sphere (38.1 mm diameter) standard target of known acoustic TS (~39.2 dB in seawater). The calibration was stable over all sampling periods.
The transducer was mounted in a downward, vertical orientation on an adjustable aluminum frame affixed to the gunnels of the survey vessel. Acoustic data were collected and stored on a laptop computer running BioSonics Acquisition Program (version 4.1) software. Post-processing analyses were performed using Hydroacoustic Data Analysis Software (HADAS), developed by the U.S. Army Engineer Research and Development Center (ERDC). Data were collected during mobile surveys with boat speed limited to 5 km h-1. Each site was divided into parallel transects covering the full east to west footprint of each dredged hole (Figure 2, red transect lines). Eleven transects (mean length = 337 m) were occupied at Brookley Hole and 12 transects (mean length = 288 m) at Airport Hole. Total survey distance was 3.7 km (Brookley Hole) and 3.5 km (Airport Hole), respectively. During each seasonal survey, all transects were surveyed during daylight hours only. Relative fish density was estimated using standard echo-integration techniques, which process the 20logR Time Varied Gain (TVG) signals. To determine absolute fish density values, the contribution of single fish (average backscattering cross section or σ) was measured. This value (σ) corresponds to the acoustic equivalent of the length of the insonified fish after conversion to target strength (TS). TS values (dB) were converted to fish length using a BioSonics variant of the dorsal-aspect equation developed by Love (1971). Based on the total and the mean echo strength per fish, the absolute number of fish can be calculated in the area insonified. Thus, every ping transmitted by the sounder provides a measurement of fish density, in fish per cubic meter, along each transect or within each cell (scaled to fish per 100 m3).
Conventional Fisheries Gears. Otter trawls were used to examine fish assemblage taxonomic composition, and to provide ground truth data for the hydroacoustic surveys (Figure 2, blue transect lines). Triplicate fish trawls using an 8 foot (2.4 m) shrimp trawl were conducted seasonally within the deepest portion of each hole. All fish collected were identified to species, counted, and total length (TL) measured to the nearest mm.
RESULTS AND DISCUSSION
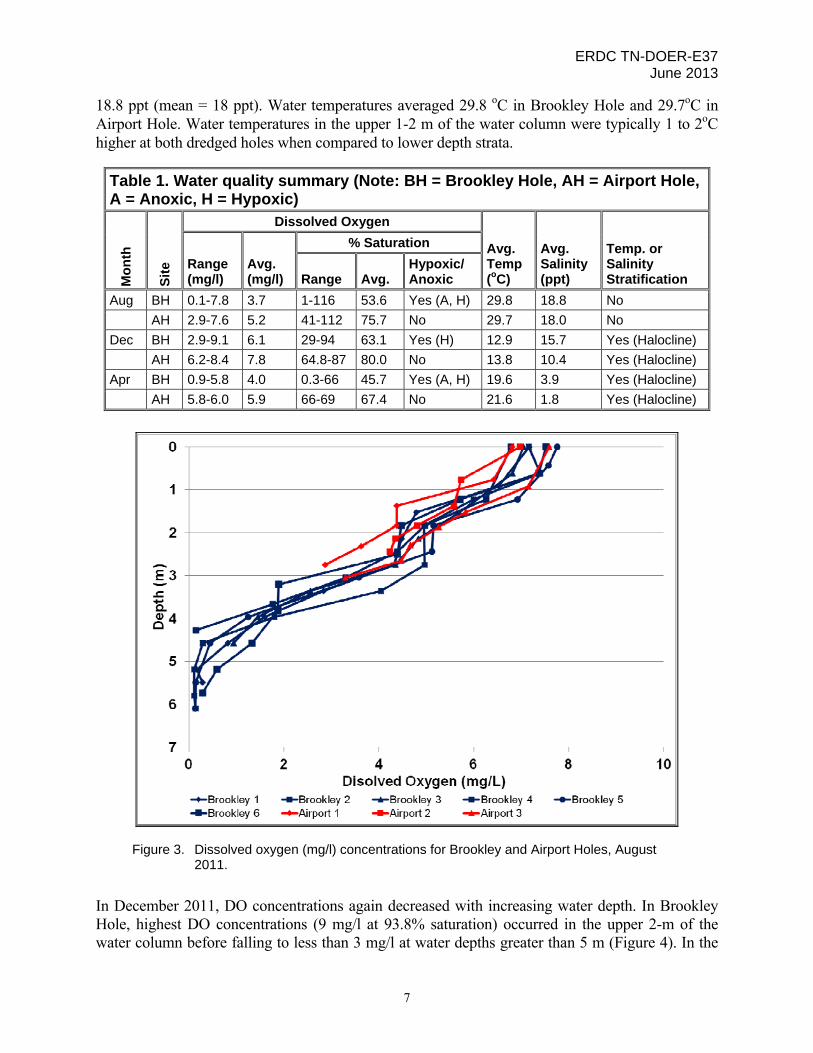
Water Quality: A water quality summary is presented in Table 1. Water quality measurements taken in August 2011 in Brookley Hole indicated that DO concentrations decreased with water depth from a maximum of 7.8 mg/l (113.5% saturation) at the surface to anoxic levels (0.11 mg/l at 1.6% saturation) in the lower 1 m of the water column (Figure 3). At the majority of stations sampled, hypoxic levels (< 2 mg/l) occurred at water depths greater than 3.5 m. The trend of decreasing DO concentrations with increasing water depth also occurred at the much shallower Airport Hole. Maximum DO concentrations fell from 7.6 mg/l at 112.2% saturation to a low of 2.9 mg/l at 41.2% saturation at 2.7 m water depth. Average salinity was 18.8 ppt, SD+1.1 ppt (range = 17-21.1 ppt) throughout the water column, indicating the absence of stratification in Brookley Hole. Similar conditions were found in Airport Hole where salinities ranged from 17.8 to
ERDC TN-DOER-E37 June 2013
7
18.8 ppt (mean = 18 ppt). Water temperatures averaged 29.8 oC in Brookley Hole and 29.7oC in Airport Hole. Water temperatures in the upper 1-2 m of the water column were typically 1 to 2oC higher at both dredged holes when compared to lower depth strata.
Table 1. Water quality summary (Note: BH = Brookley Hole, AH = Airport Hole, A = Anoxic, H = Hypoxic)
Mo
nth
Sit
e
Dissolved Oxygen
Avg. Temp (oC)
Avg. Salinity (ppt)
Temp. or Salinity Stratification
Range (mg/l)
Avg. (mg/l)
% Saturation
Range Avg. Hypoxic/ Anoxic
Aug BH 0.1-7.8 3.7 1-116 53.6 Yes (A, H) 29.8 18.8 No
AH 2.9-7.6 5.2 41-112 75.7 No 29.7 18.0 No
Dec BH 2.9-9.1 6.1 29-94 63.1 Yes (H) 12.9 15.7 Yes (Halocline)
AH 6.2-8.4 7.8 64.8-87 80.0 No 13.8 10.4 Yes (Halocline)
Apr BH 0.9-5.8 4.0 0.3-66 45.7 Yes (A, H) 19.6 3.9 Yes (Halocline)
AH 5.8-6.0 5.9 66-69 67.4 No 21.6 1.8 Yes (Halocline)
Figure 3. Dissolved oxygen (mg/l) concentrations for Brookley and Airport Holes, August 2011.
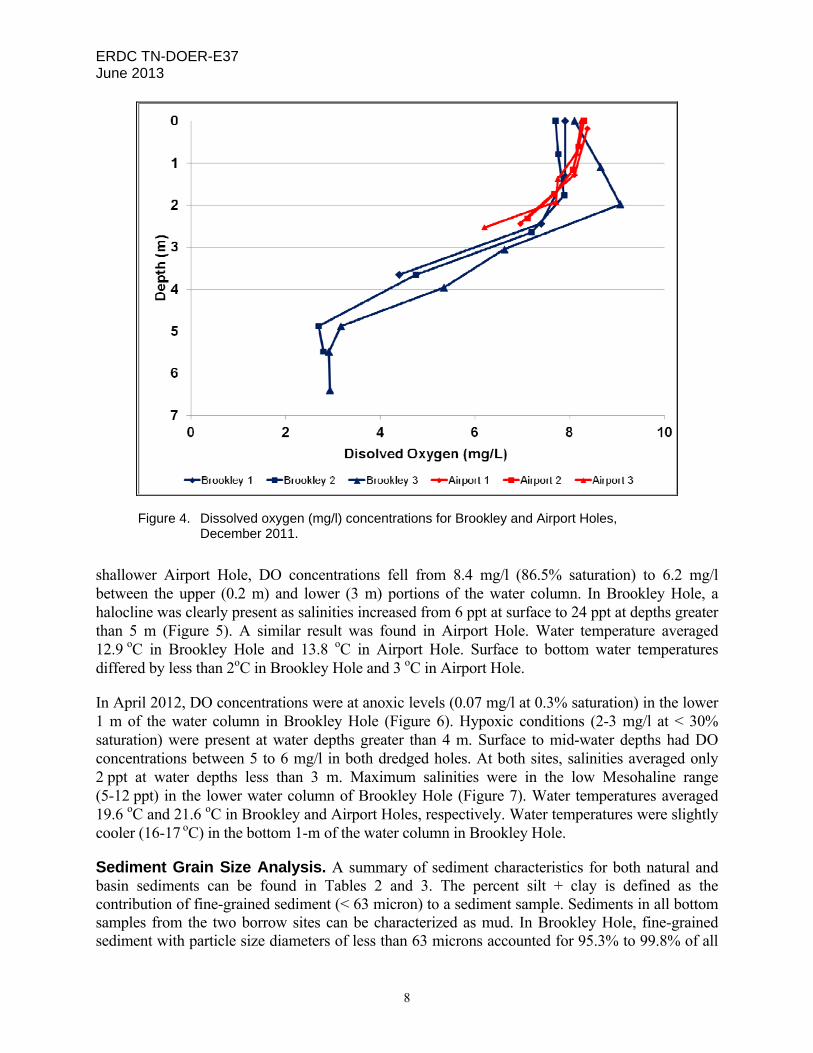
In December 2011, DO concentrations again decreased with increasing water depth. In Brookley Hole, highest DO concentrations (9 mg/l at 93.8% saturation) occurred in the upper 2-m of the water column before falling to less than 3 mg/l at water depths greater than 5 m (Figure 4). In the
ERDC TN-DOER-E37 June 2013
8
Figure 4. Dissolved oxygen (mg/l) concentrations for Brookley and Airport Holes, December 2011.
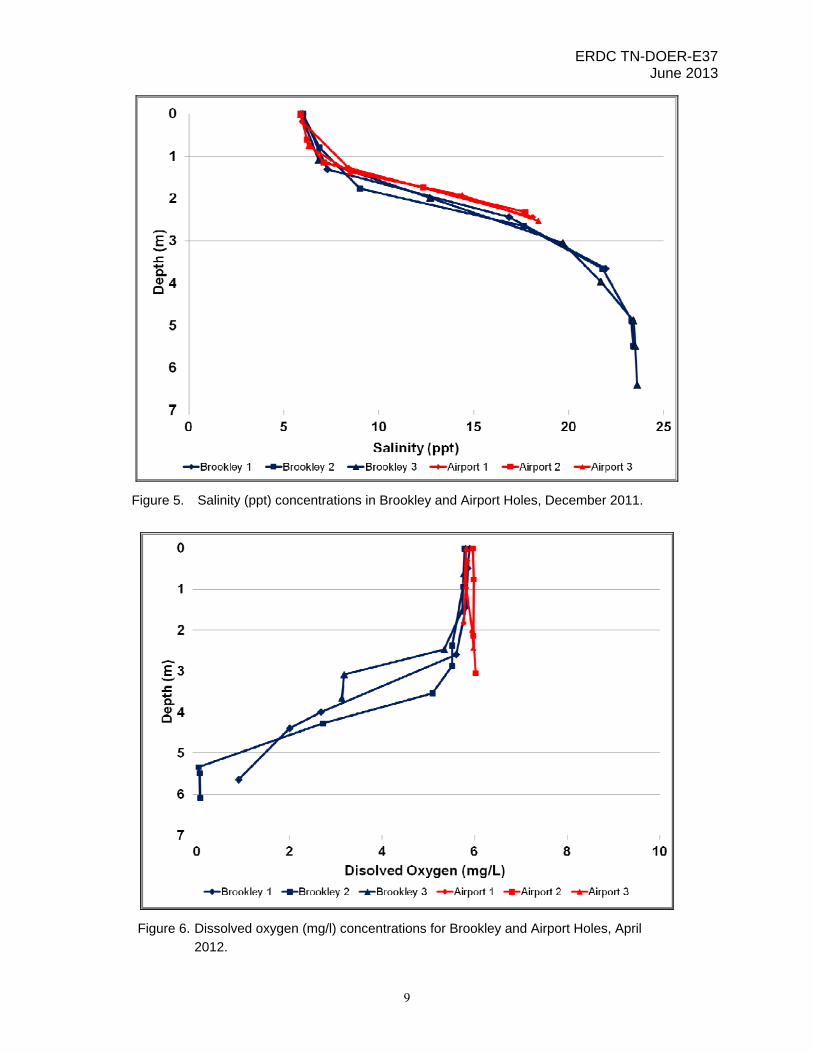
shallower Airport Hole, DO concentrations fell from 8.4 mg/l (86.5% saturation) to 6.2 mg/l between the upper (0.2 m) and lower (3 m) portions of the water column. In Brookley Hole, a halocline was clearly present as salinities increased from 6 ppt at surface to 24 ppt at depths greater than 5 m (Figure 5). A similar result was found in Airport Hole. Water temperature averaged 12.9 oC in Brookley Hole and 13.8 oC in Airport Hole. Surface to bottom water temperatures differed by less than 2oC in Brookley Hole and 3 oC in Airport Hole.
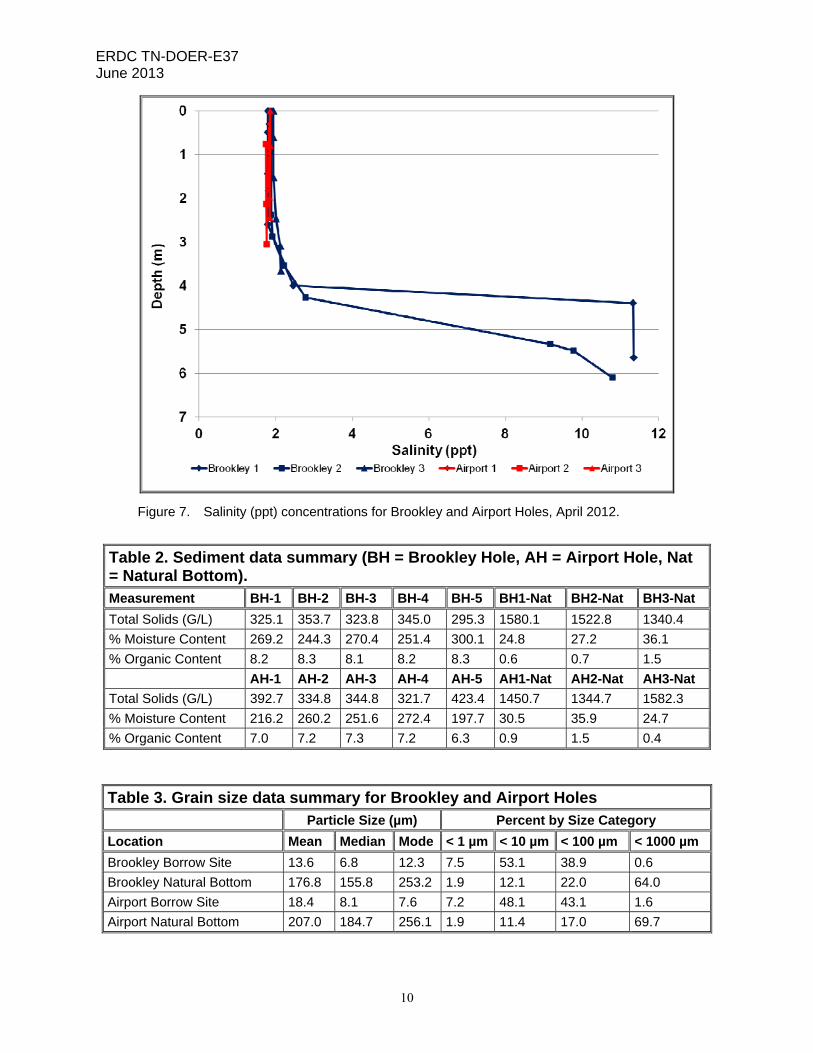
In April 2012, DO concentrations were at anoxic levels (0.07 mg/l at 0.3% saturation) in the lower 1 m of the water column in Brookley Hole (Figure 6). Hypoxic conditions (2-3 mg/l at < 30% saturation) were present at water depths greater than 4 m. Surface to mid-water depths had DO concentrations between 5 to 6 mg/l in both dredged holes. At both sites, salinities averaged only 2 ppt at water depths less than 3 m. Maximum salinities were in the low Mesohaline range (5-12 ppt) in the lower water column of Brookley Hole (Figure 7). Water temperatures averaged 19.6 oC and 21.6 oC in Brookley and Airport Holes, respectively. Water temperatures were slightly cooler (16-17 oC) in the bottom 1-m of the water column in Brookley Hole.
Sediment Grain Size Analysis. A summary of sediment characteristics for both natural and basin sediments can be found in Tables 2 and 3. The percent silt + clay is defined as the contribution of fine-grained sediment (< 63 micron) to a sediment sample. Sediments in all bottom samples from the two borrow sites can be characterized as mud. In Brookley Hole, fine-grained sediment with particle size diameters of less than 63 microns accounted for 95.3% to 99.8% of all
ERDC TN-DOER-E37 June 2013
9
Figure 5. Salinity (ppt) concentrations in Brookley and Airport Holes, December 2011.
Figure 6. Dissolved oxygen (mg/l) concentrations for Brookley and Airport Holes, April
2012.
ERDC TN-DOER-E37 June 2013
10
Figure 7. Salinity (ppt) concentrations for Brookley and Airport Holes, April 2012.
Table 2. Sediment data summary (BH = Brookley Hole, AH = Airport Hole, Nat = Natural Bottom). Measurement BH-1 BH-2 BH-3 BH-4 BH-5 BH1-Nat BH2-Nat BH3-Nat
Total Solids (G/L) 325.1 353.7 323.8 345.0 295.3 1580.1 1522.8 1340.4
% Moisture Content 269.2 244.3 270.4 251.4 300.1 24.8 27.2 36.1
% Organic Content 8.2 8.3 8.1 8.2 8.3 0.6 0.7 1.5
AH-1 AH-2 AH-3 AH-4 AH-5 AH1-Nat AH2-Nat AH3-Nat
Total Solids (G/L) 392.7 334.8 344.8 321.7 423.4 1450.7 1344.7 1582.3
% Moisture Content 216.2 260.2 251.6 272.4 197.7 30.5 35.9 24.7
% Organic Content 7.0 7.2 7.3 7.2 6.3 0.9 1.5 0.4
Table 3. Grain size data summary for Brookley and Airport Holes Particle Size (µm) Percent by Size Category
Location Mean Median Mode < 1 µm < 10 µm < 100 µm < 1000 µm
Brookley Borrow Site 13.6 6.8 12.3 7.5 53.1 38.9 0.6
Brookley Natural Bottom 176.8 155.8 253.2 1.9 12.1 22.0 64.0
Airport Borrow Site 18.4 8.1 7.6 7.2 48.1 43.1 1.6
Airport Natural Bottom 207.0 184.7 256.1 1.9 11.4 17.0 69.7
ERDC TN-DOER-E37 June 2013
11
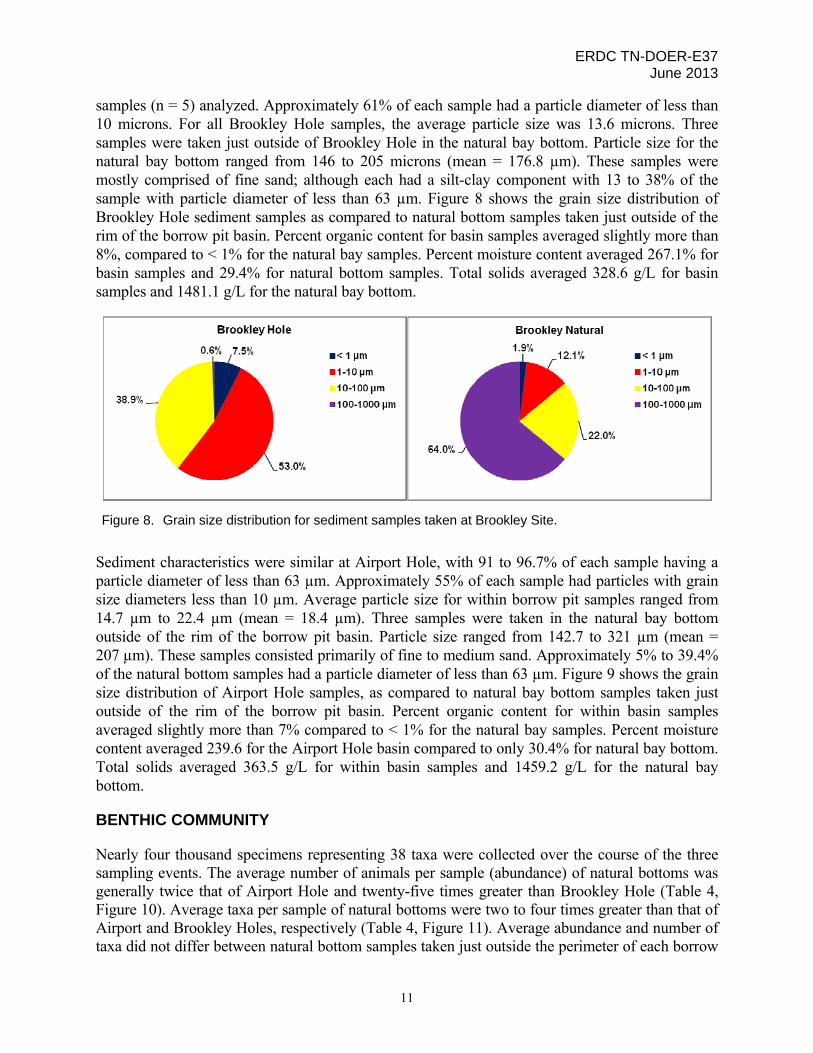
samples (n = 5) analyzed. Approximately 61% of each sample had a particle diameter of less than 10 microns. For all Brookley Hole samples, the average particle size was 13.6 microns. Three samples were taken just outside of Brookley Hole in the natural bay bottom. Particle size for the natural bay bottom ranged from 146 to 205 microns (mean = 176.8 µm). These samples were mostly comprised of fine sand; although each had a silt-clay component with 13 to 38% of the sample with particle diameter of less than 63 µm. Figure 8 shows the grain size distribution of Brookley Hole sediment samples as compared to natural bottom samples taken just outside of the rim of the borrow pit basin. Percent organic content for basin samples averaged slightly more than 8%, compared to < 1% for the natural bay samples. Percent moisture content averaged 267.1% for basin samples and 29.4% for natural bottom samples. Total solids averaged 328.6 g/L for basin samples and 1481.1 g/L for the natural bay bottom.
Figure 8. Grain size distribution for sediment samples taken at Brookley Site.
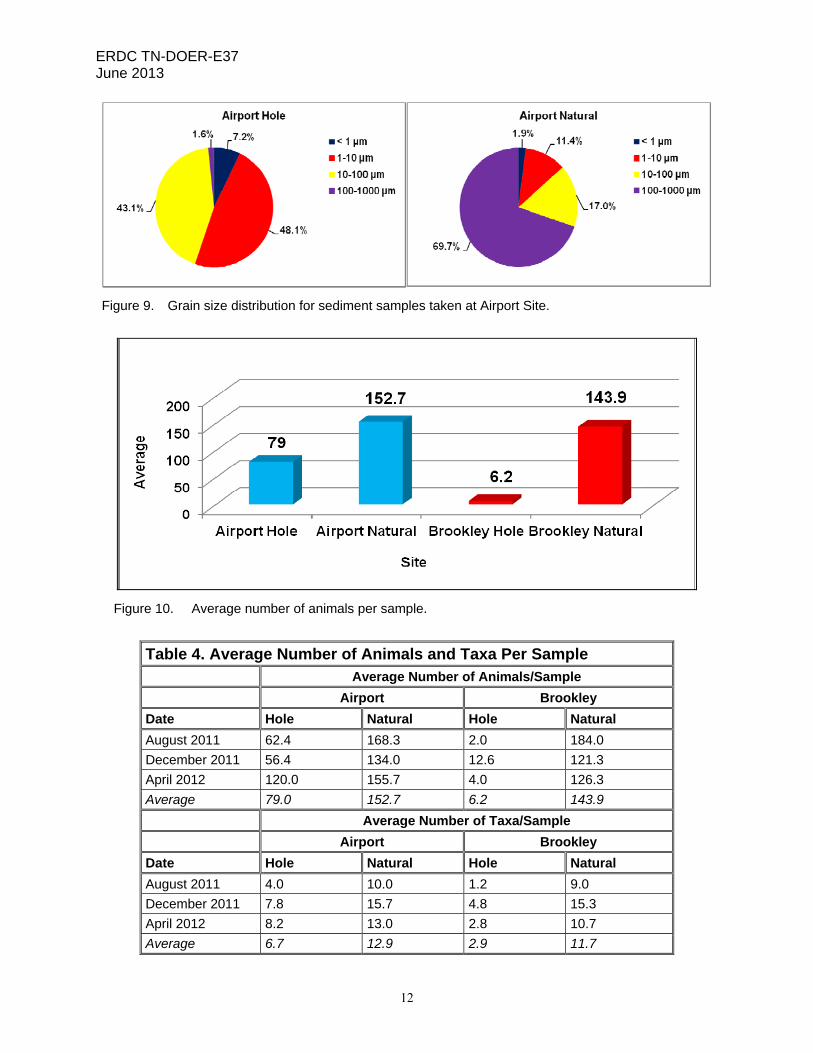
Sediment characteristics were similar at Airport Hole, with 91 to 96.7% of each sample having a particle diameter of less than 63 µm. Approximately 55% of each sample had particles with grain size diameters less than 10 µm. Average particle size for within borrow pit samples ranged from 14.7 µm to 22.4 µm (mean = 18.4 µm). Three samples were taken in the natural bay bottom outside of the rim of the borrow pit basin. Particle size ranged from 142.7 to 321 µm (mean = 207 µm). These samples consisted primarily of fine to medium sand. Approximately 5% to 39.4% of the natural bottom samples had a particle diameter of less than 63 µm. Figure 9 shows the grain size distribution of Airport Hole samples, as compared to natural bay bottom samples taken just outside of the rim of the borrow pit basin. Percent organic content for within basin samples averaged slightly more than 7% compared to < 1% for the natural bay samples. Percent moisture content averaged 239.6 for the Airport Hole basin compared to only 30.4% for natural bay bottom. Total solids averaged 363.5 g/L for within basin samples and 1459.2 g/L for the natural bay bottom.
BENTHIC COMMUNITY
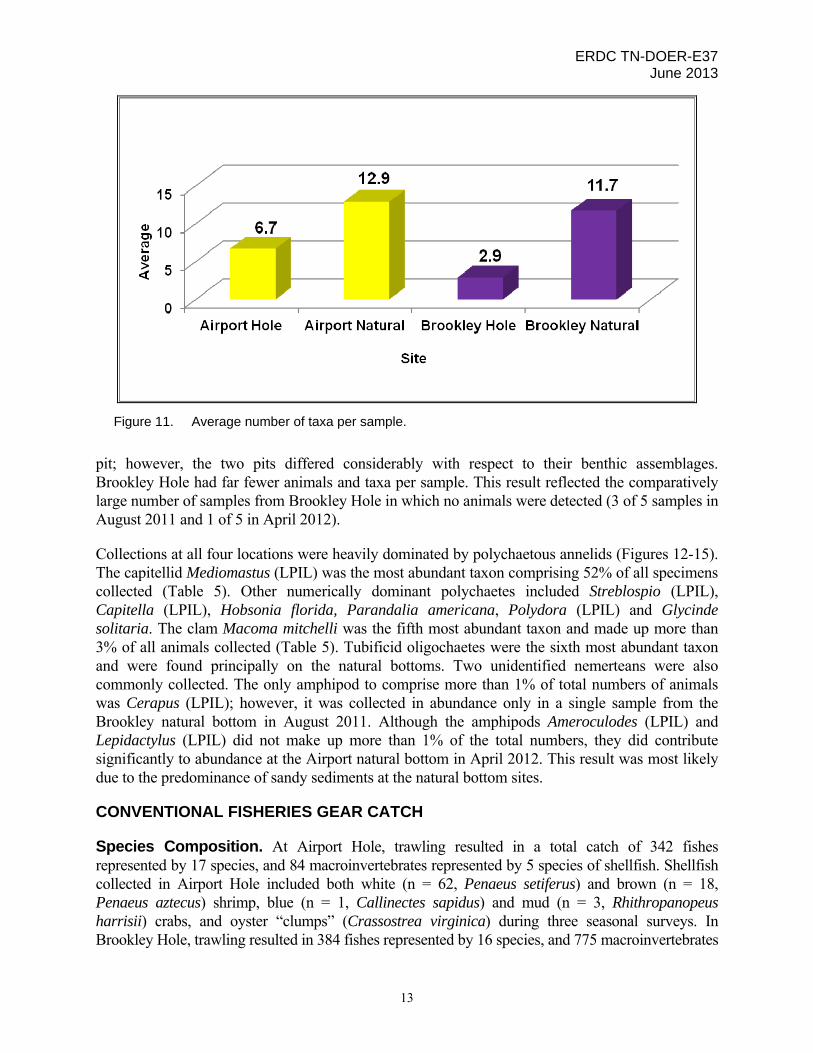
Nearly four thousand specimens representing 38 taxa were collected over the course of the three sampling events. The average number of animals per sample (abundance) of natural bottoms was generally twice that of Airport Hole and twenty-five times greater than Brookley Hole (Table 4, Figure 10). Average taxa per sample of natural bottoms were two to four times greater than that of Airport and Brookley Holes, respectively (Table 4, Figure 11). Average abundance and number of taxa did not differ between natural bottom samples taken just outside the perimeter of each borrow
ERDC TN-DOER-E37 June 2013
12
Figure 9. Grain size distribution for sediment samples taken at Airport Site.
Figure 10. Average number of animals per sample.
Table 4. Average Number of Animals and Taxa Per Sample Average Number of Animals/Sample
Airport Brookley
Date Hole Natural Hole Natural
August 2011 62.4 168.3 2.0 184.0
December 2011 56.4 134.0 12.6 121.3
April 2012 120.0 155.7 4.0 126.3
Average 79.0 152.7 6.2 143.9
Average Number of Taxa/Sample
Airport Brookley
Date Hole Natural Hole Natural
August 2011 4.0 10.0 1.2 9.0
December 2011 7.8 15.7 4.8 15.3
April 2012 8.2 13.0 2.8 10.7
Average 6.7 12.9 2.9 11.7
ERDC TN-DOER-E37 June 2013
13
Figure 11. Average number of taxa per sample.
pit; however, the two pits differed considerably with respect to their benthic assemblages. Brookley Hole had far fewer animals and taxa per sample. This result reflected the comparatively large number of samples from Brookley Hole in which no animals were detected (3 of 5 samples in August 2011 and 1 of 5 in April 2012).
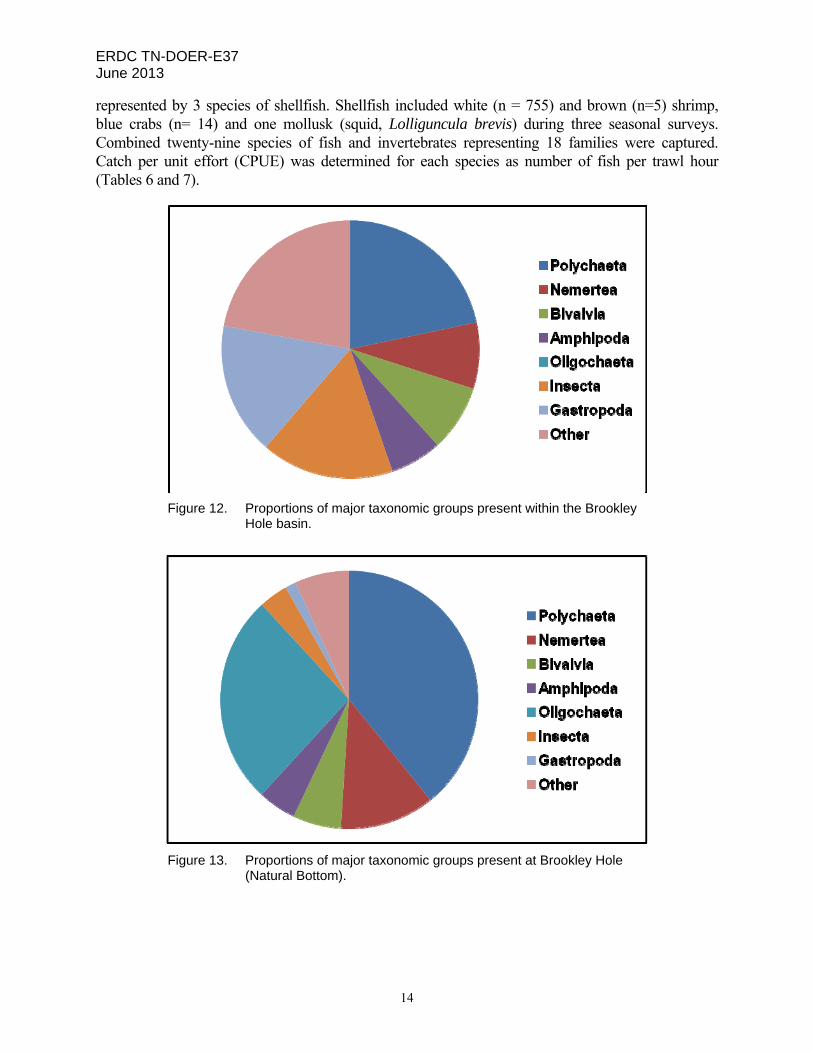
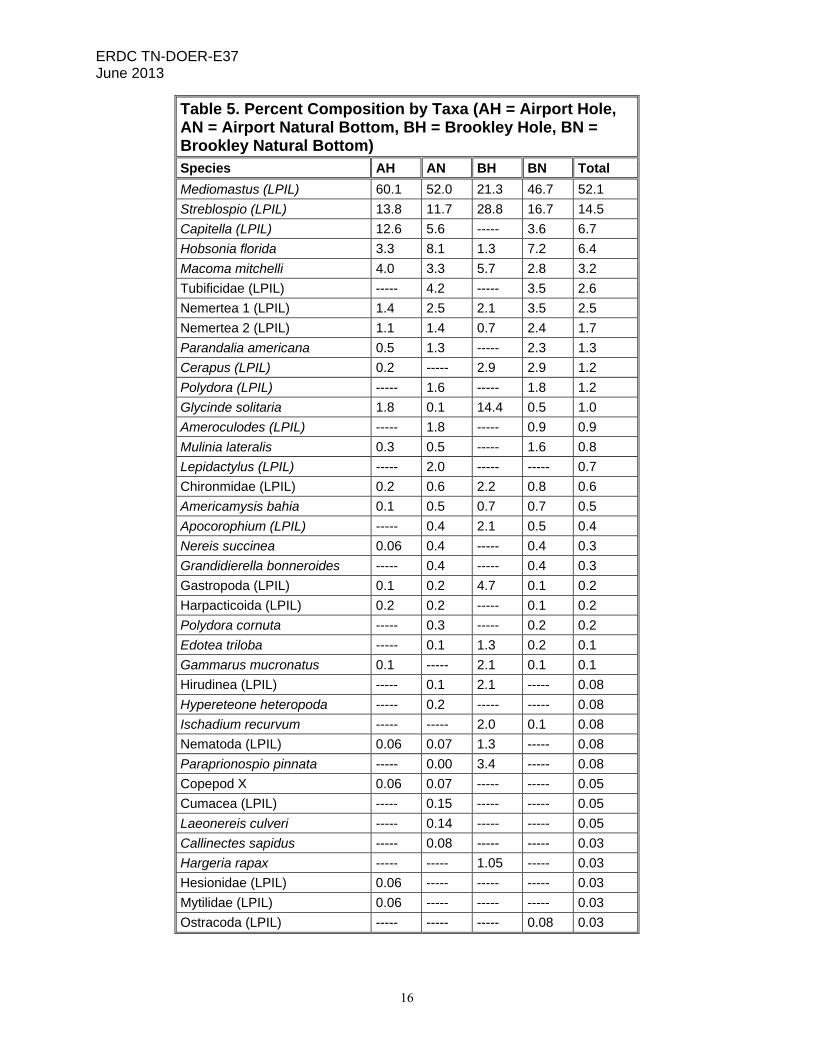
Collections at all four locations were heavily dominated by polychaetous annelids (Figures 12-15). The capitellid Mediomastus (LPIL) was the most abundant taxon comprising 52% of all specimens collected (Table 5). Other numerically dominant polychaetes included Streblospio (LPIL), Capitella (LPIL), Hobsonia florida, Parandalia americana, Polydora (LPIL) and Glycinde solitaria. The clam Macoma mitchelli was the fifth most abundant taxon and made up more than 3% of all animals collected (Table 5). Tubificid oligochaetes were the sixth most abundant taxon and were found principally on the natural bottoms. Two unidentified nemerteans were also commonly collected. The only amphipod to comprise more than 1% of total numbers of animals was Cerapus (LPIL); however, it was collected in abundance only in a single sample from the Brookley natural bottom in August 2011. Although the amphipods Ameroculodes (LPIL) and Lepidactylus (LPIL) did not make up more than 1% of the total numbers, they did contribute significantly to abundance at the Airport natural bottom in April 2012. This result was most likely due to the predominance of sandy sediments at the natural bottom sites.
CONVENTIONAL FISHERIES GEAR CATCH
Species Composition. At Airport Hole, trawling resulted in a total catch of 342 fishes represented by 17 species, and 84 macroinvertebrates represented by 5 species of shellfish. Shellfish collected in Airport Hole included both white (n = 62, Penaeus setiferus) and brown (n = 18, Penaeus aztecus) shrimp, blue (n = 1, Callinectes sapidus) and mud (n = 3, Rhithropanopeus harrisii) crabs, and oyster “clumps” (Crassostrea virginica) during three seasonal surveys. In Brookley Hole, trawling resulted in 384 fishes represented by 16 species, and 775 macroinvertebrates
ERDC TN-DOER-E37 June 2013
14
represented by 3 species of shellfish. Shellfish included white (n = 755) and brown (n=5) shrimp, blue crabs (n= 14) and one mollusk (squid, Lolliguncula brevis) during three seasonal surveys. Combined twenty-nine species of fish and invertebrates representing 18 families were captured. Catch per unit effort (CPUE) was determined for each species as number of fish per trawl hour (Tables 6 and 7).
Figure 12. Proportions of major taxonomic groups present within the Brookley Hole basin.
Figure 13. Proportions of major taxonomic groups present at Brookley Hole (Natural Bottom).

ERDC TN-DOER-E37 June 2013
15
Figure 14. Proportions of major taxonomic groups present within the Airport Hole basin.
Figure 15. Proportions of major taxonomic groups present at Airport Hole (Natural Bottom).
Summer Catch (September 2011). Trawl data for Brookley Hole are given in Table 6. Two of the trawls (S1 and S2) were performed in the deepest section of the basin (approximately 6.1 m deep). Species composition was numerically dominated by white shrimp (n = 631, CPUE = 1893 shrimp/trawl hour). The third trawl was performed at shallower depths (approximately 3.6-4.8 m). White shrimp were present in high numbers (n = 65, CPUE = 390 shrimp/trawl hour); although CPUE rates were not as high as catch rates obtained for the deeper trawls. Both deep and shallower water trawls produced a combined CPUE of 1392 white shrimp per trawl hour. The two trawls in the deeper part of the basin contained a total of 8 different species, of which bay anchovy
ERDC TN-DOER-E37 June 2013
16
Table 5. Percent Composition by Taxa (AH = Airport Hole, AN = Airport Natural Bottom, BH = Brookley Hole, BN = Brookley Natural Bottom) Species AH AN BH BN Total
Mediomastus (LPIL) 60.1 52.0 21.3 46.7 52.1
Streblospio (LPIL) 13.8 11.7 28.8 16.7 14.5
Capitella (LPIL) 12.6 5.6 ----- 3.6 6.7
Hobsonia florida 3.3 8.1 1.3 7.2 6.4
Macoma mitchelli 4.0 3.3 5.7 2.8 3.2
Tubificidae (LPIL) ----- 4.2 ----- 3.5 2.6
Nemertea 1 (LPIL) 1.4 2.5 2.1 3.5 2.5
Nemertea 2 (LPIL) 1.1 1.4 0.7 2.4 1.7
Parandalia americana 0.5 1.3 ----- 2.3 1.3
Cerapus (LPIL) 0.2 ----- 2.9 2.9 1.2
Polydora (LPIL) ----- 1.6 ----- 1.8 1.2
Glycinde solitaria 1.8 0.1 14.4 0.5 1.0
Ameroculodes (LPIL) ----- 1.8 ----- 0.9 0.9
Mulinia lateralis 0.3 0.5 ----- 1.6 0.8
Lepidactylus (LPIL) ----- 2.0 ----- ----- 0.7
Chironmidae (LPIL) 0.2 0.6 2.2 0.8 0.6
Americamysis bahia 0.1 0.5 0.7 0.7 0.5
Apocorophium (LPIL) ----- 0.4 2.1 0.5 0.4
Nereis succinea 0.06 0.4 ----- 0.4 0.3
Grandidierella bonneroides ----- 0.4 ----- 0.4 0.3
Gastropoda (LPIL) 0.1 0.2 4.7 0.1 0.2
Harpacticoida (LPIL) 0.2 0.2 ----- 0.1 0.2
Polydora cornuta ----- 0.3 ----- 0.2 0.2
Edotea triloba ----- 0.1 1.3 0.2 0.1
Gammarus mucronatus 0.1 ----- 2.1 0.1 0.1
Hirudinea (LPIL) ----- 0.1 2.1 ----- 0.08
Hypereteone heteropoda ----- 0.2 ----- ----- 0.08
Ischadium recurvum ----- ----- 2.0 0.1 0.08
Nematoda (LPIL) 0.06 0.07 1.3 ----- 0.08
Paraprionospio pinnata ----- 0.00 3.4 ----- 0.08
Copepod X 0.06 0.07 ----- ----- 0.05
Cumacea (LPIL) ----- 0.15 ----- ----- 0.05
Laeonereis culveri ----- 0.14 ----- ----- 0.05
Callinectes sapidus ----- 0.08 ----- ----- 0.03
Hargeria rapax ----- ----- 1.05 ----- 0.03
Hesionidae (LPIL) 0.06 ----- ----- ----- 0.03
Mytilidae (LPIL) 0.06 ----- ----- ----- 0.03
Ostracoda (LPIL) ----- ----- ----- 0.08 0.03
ERDC TN-DOER-E37 June 2013
17
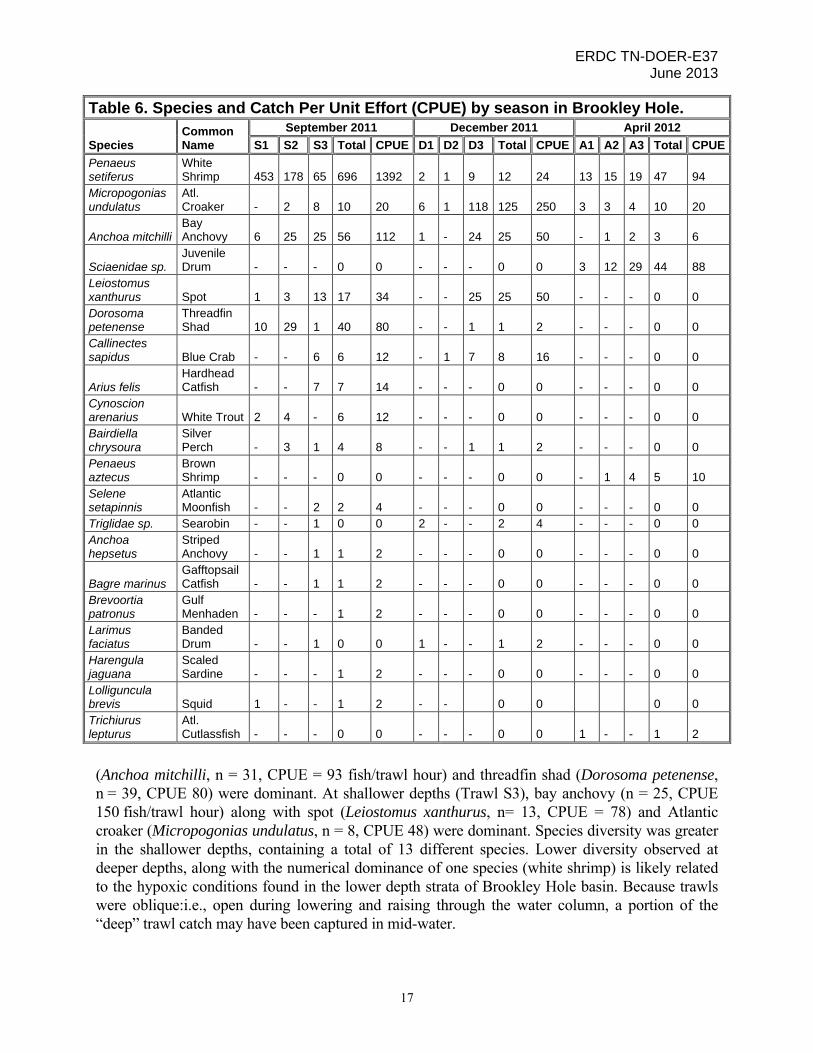
Table 6. Species and Catch Per Unit Effort (CPUE) by season in Brookley Hole.
Species Common Name
September 2011 December 2011 April 2012
S1 S2 S3 Total CPUE D1 D2 D3 Total CPUE A1 A2 A3 Total CPUE
Penaeus setiferus
White Shrimp 453 178 65 696 1392 2 1 9 12 24 13 15 19 47 94
Micropogonias undulatus
Atl. Croaker - 2 8 10 20 6 1 118 125 250 3 3 4 10 20
Anchoa mitchilli Bay Anchovy 6 25 25 56 112 1 - 24 25 50 - 1 2 3 6
Sciaenidae sp. Juvenile Drum - - - 0 0 - - - 0 0 3 12 29 44 88
Leiostomus xanthurus Spot 1 3 13 17 34 - - 25 25 50 - - - 0 0 Dorosoma petenense
Threadfin Shad 10 29 1 40 80 - - 1 1 2 - - - 0 0
Callinectes sapidus Blue Crab - - 6 6 12 - 1 7 8 16 - - - 0 0
Arius felis Hardhead Catfish - - 7 7 14 - - - 0 0 - - - 0 0
Cynoscion arenarius White Trout 2 4 - 6 12 - - - 0 0 - - - 0 0 Bairdiella chrysoura
Silver Perch - 3 1 4 8 - - 1 1 2 - - - 0 0
Penaeus aztecus
Brown Shrimp - - - 0 0 - - - 0 0 - 1 4 5 10
Selene setapinnis
Atlantic Moonfish - - 2 2 4 - - - 0 0 - - - 0 0
Triglidae sp. Searobin - - 1 0 0 2 - - 2 4 - - - 0 0 Anchoa hepsetus
Striped Anchovy - - 1 1 2 - - - 0 0 - - - 0 0
Bagre marinus Gafftopsail Catfish - - 1 1 2 - - - 0 0 - - - 0 0
Brevoortia patronus
Gulf Menhaden - - - 1 2 - - - 0 0 - - - 0 0
Larimus faciatus
Banded Drum - - 1 0 0 1 - - 1 2 - - - 0 0
Harengula jaguana
Scaled Sardine - - - 1 2 - - - 0 0 - - - 0 0
Lolliguncula brevis Squid 1 - - 1 2 - - 0 0 0 0 Trichiurus lepturus
Atl. Cutlassfish - - - 0 0 - - - 0 0 1 - - 1 2
(Anchoa mitchilli, n = 31, CPUE = 93 fish/trawl hour) and threadfin shad (Dorosoma petenense, n = 39, CPUE 80) were dominant. At shallower depths (Trawl S3), bay anchovy (n = 25, CPUE 150 fish/trawl hour) along with spot (Leiostomus xanthurus, n= 13, CPUE = 78) and Atlantic croaker (Micropogonias undulatus, n = 8, CPUE 48) were dominant. Species diversity was greater in the shallower depths, containing a total of 13 different species. Lower diversity observed at deeper depths, along with the numerical dominance of one species (white shrimp) is likely related to the hypoxic conditions found in the lower depth strata of Brookley Hole basin. Because trawls were oblique:i.e., open during lowering and raising through the water column, a portion of the “deep” trawl catch may have been captured in mid-water.
ERDC TN-DOER-E37 June 2013
18
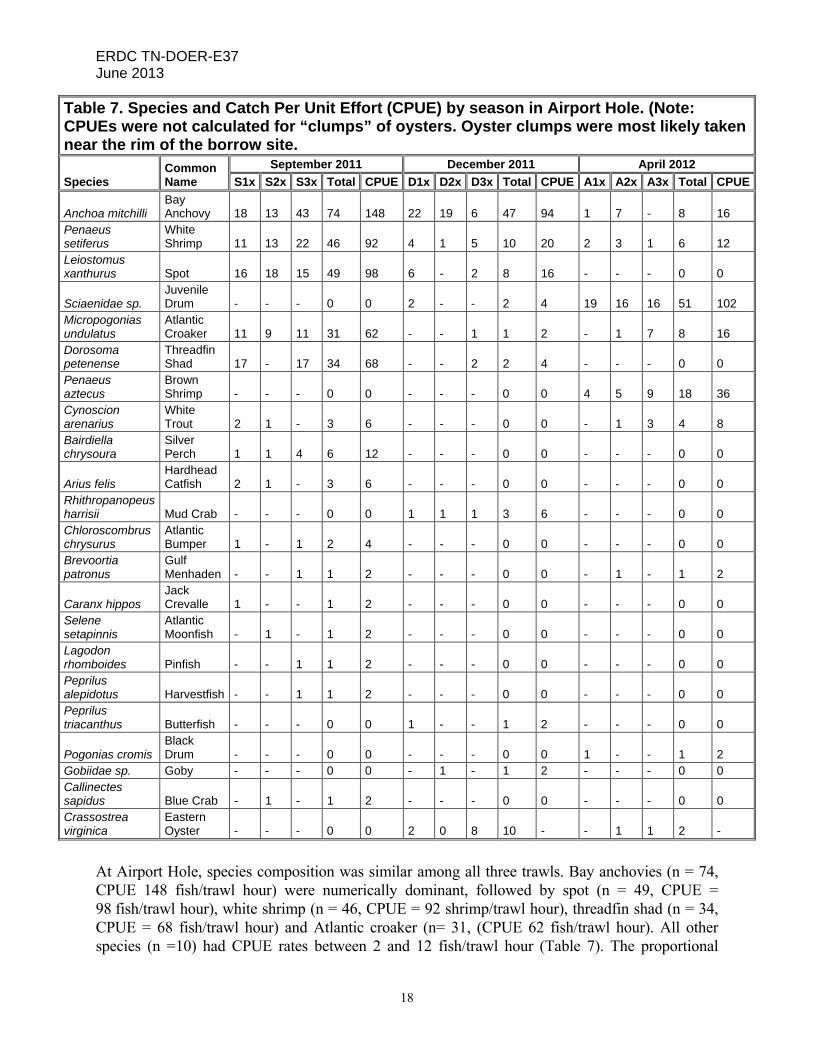
Table 7. Species and Catch Per Unit Effort (CPUE) by season in Airport Hole. (Note: CPUEs were not calculated for “clumps” of oysters. Oyster clumps were most likely taken near the rim of the borrow site.
Species Common Name
September 2011 December 2011 April 2012
S1x S2x S3x Total CPUE D1x D2x D3x Total CPUE A1x A2x A3x Total CPUE
Anchoa mitchilli Bay Anchovy 18 13 43 74 148 22 19 6 47 94 1 7 - 8 16
Penaeus setiferus
White Shrimp 11 13 22 46 92 4 1 5 10 20 2 3 1 6 12
Leiostomus xanthurus Spot 16 18 15 49 98 6 - 2 8 16 - - - 0 0
Sciaenidae sp. Juvenile Drum - - - 0 0 2 - - 2 4 19 16 16 51 102
Micropogonias undulatus
Atlantic Croaker 11 9 11 31 62 - - 1 1 2 - 1 7 8 16
Dorosoma petenense
Threadfin Shad 17 - 17 34 68 - - 2 2 4 - - - 0 0
Penaeus aztecus
Brown Shrimp - - - 0 0 - - - 0 0 4 5 9 18 36
Cynoscion arenarius
White Trout 2 1 - 3 6 - - - 0 0 - 1 3 4 8
Bairdiella chrysoura
Silver Perch 1 1 4 6 12 - - - 0 0 - - - 0 0
Arius felis Hardhead Catfish 2 1 - 3 6 - - - 0 0 - - - 0 0
Rhithropanopeus harrisii Mud Crab - - - 0 0 1 1 1 3 6 - - - 0 0 Chloroscombrus chrysurus
Atlantic Bumper 1 - 1 2 4 - - - 0 0 - - - 0 0
Brevoortia patronus
Gulf Menhaden - - 1 1 2 - - - 0 0 - 1 - 1 2
Caranx hippos Jack Crevalle 1 - - 1 2 - - - 0 0 - - - 0 0
Selene setapinnis
Atlantic Moonfish - 1 - 1 2 - - - 0 0 - - - 0 0
Lagodon rhomboides Pinfish - - 1 1 2 - - - 0 0 - - - 0 0 Peprilus alepidotus Harvestfish - - 1 1 2 - - - 0 0 - - - 0 0 Peprilus triacanthus Butterfish - - - 0 0 1 - - 1 2 - - - 0 0
Pogonias cromis Black Drum - - - 0 0 - - - 0 0 1 - - 1 2
Gobiidae sp. Goby - - - 0 0 - 1 - 1 2 - - - 0 0 Callinectes sapidus Blue Crab - 1 - 1 2 - - - 0 0 - - - 0 0 Crassostrea virginica
Eastern Oyster - - - 0 0 2 0 8 10 - - 1 1 2 -
At Airport Hole, species composition was similar among all three trawls. Bay anchovies (n = 74, CPUE 148 fish/trawl hour) were numerically dominant, followed by spot (n = 49, CPUE = 98 fish/trawl hour), white shrimp (n = 46, CPUE = 92 shrimp/trawl hour), threadfin shad (n = 34, CPUE = 68 fish/trawl hour) and Atlantic croaker (n= 31, (CPUE 62 fish/trawl hour). All other species (n =10) had CPUE rates between 2 and 12 fish/trawl hour (Table 7). The proportional
ERDC TN-DOER-E37 June 2013
19
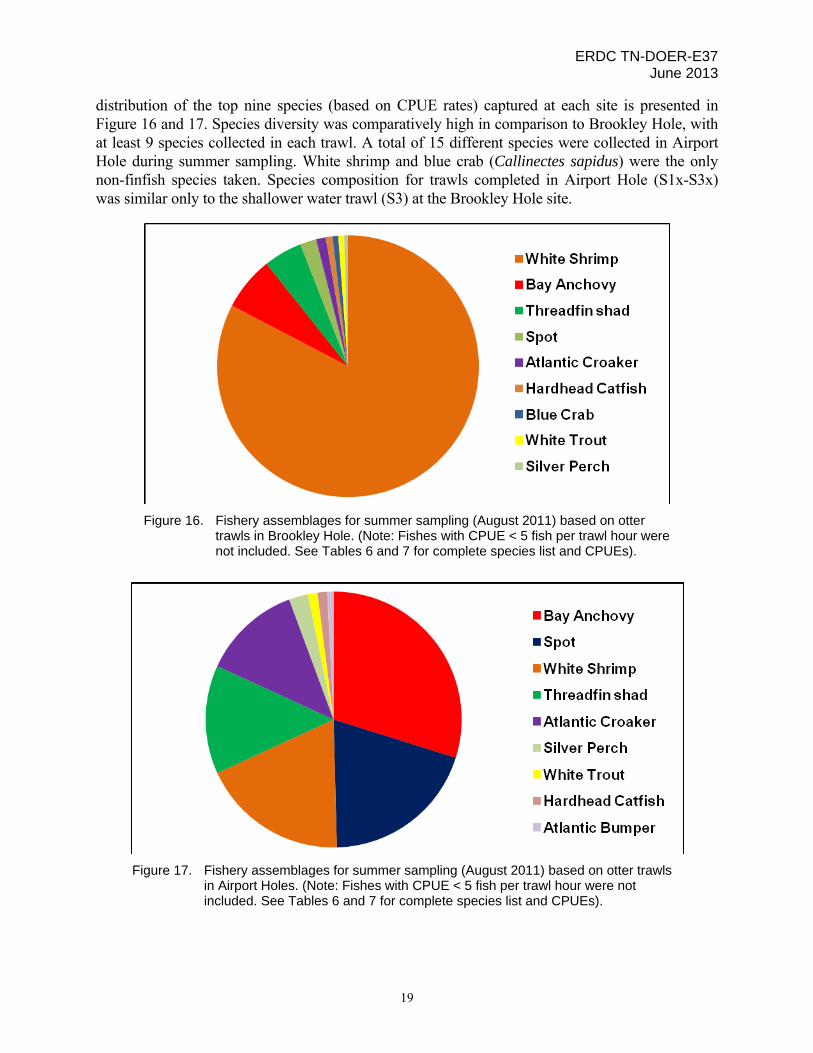
distribution of the top nine species (based on CPUE rates) captured at each site is presented in Figure 16 and 17. Species diversity was comparatively high in comparison to Brookley Hole, with at least 9 species collected in each trawl. A total of 15 different species were collected in Airport Hole during summer sampling. White shrimp and blue crab (Callinectes sapidus) were the only non-finfish species taken. Species composition for trawls completed in Airport Hole (S1x-S3x) was similar only to the shallower water trawl (S3) at the Brookley Hole site.
Figure 16. Fishery assemblages for summer sampling (August 2011) based on otter trawls in Brookley Hole. (Note: Fishes with CPUE < 5 fish per trawl hour were not included. See Tables 6 and 7 for complete species list and CPUEs).
Figure 17. Fishery assemblages for summer sampling (August 2011) based on otter trawls in Airport Holes. (Note: Fishes with CPUE < 5 fish per trawl hour were not included. See Tables 6 and 7 for complete species list and CPUEs).
ERDC TN-DOER-E37 June 2013
20
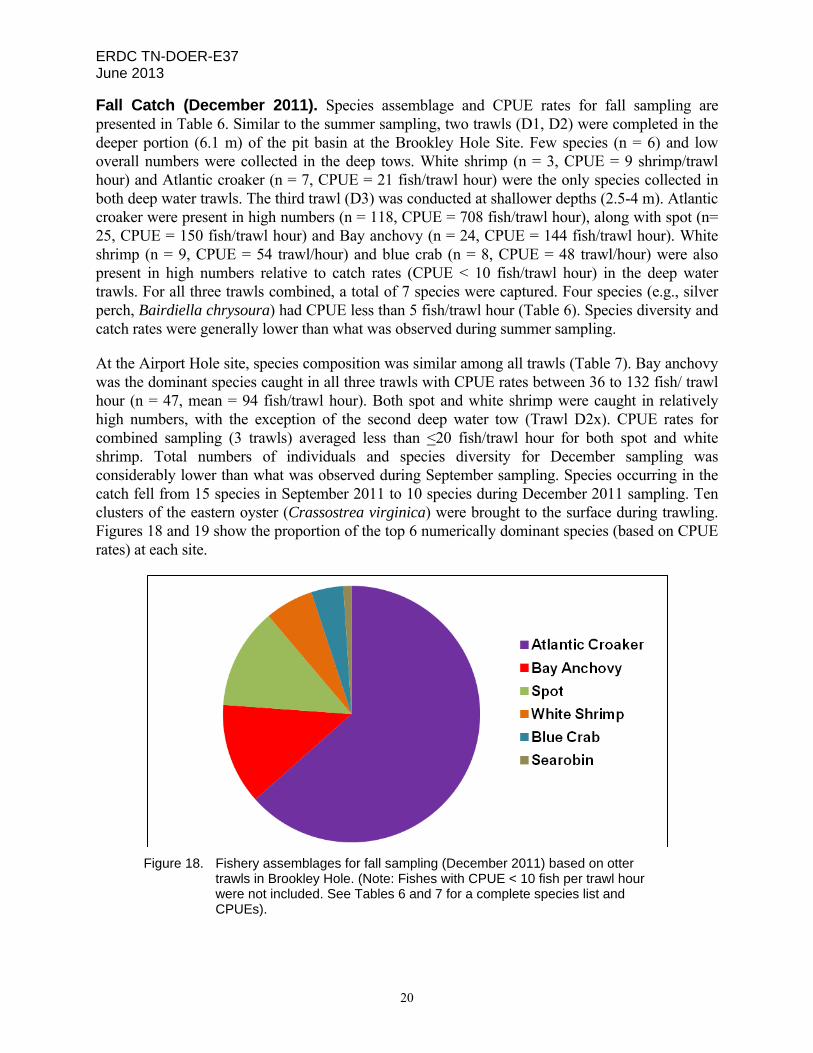
Fall Catch (December 2011). Species assemblage and CPUE rates for fall sampling are presented in Table 6. Similar to the summer sampling, two trawls (D1, D2) were completed in the deeper portion (6.1 m) of the pit basin at the Brookley Hole Site. Few species (n = 6) and low overall numbers were collected in the deep tows. White shrimp (n = 3, CPUE = 9 shrimp/trawl hour) and Atlantic croaker (n = 7, CPUE = 21 fish/trawl hour) were the only species collected in both deep water trawls. The third trawl (D3) was conducted at shallower depths (2.5-4 m). Atlantic croaker were present in high numbers (n = 118, CPUE = 708 fish/trawl hour), along with spot (n= 25, CPUE = 150 fish/trawl hour) and Bay anchovy (n = 24, CPUE = 144 fish/trawl hour). White shrimp (n = 9, CPUE = 54 trawl/hour) and blue crab (n = 8, CPUE = 48 trawl/hour) were also present in high numbers relative to catch rates (CPUE < 10 fish/trawl hour) in the deep water trawls. For all three trawls combined, a total of 7 species were captured. Four species (e.g., silver perch, Bairdiella chrysoura) had CPUE less than 5 fish/trawl hour (Table 6). Species diversity and catch rates were generally lower than what was observed during summer sampling.
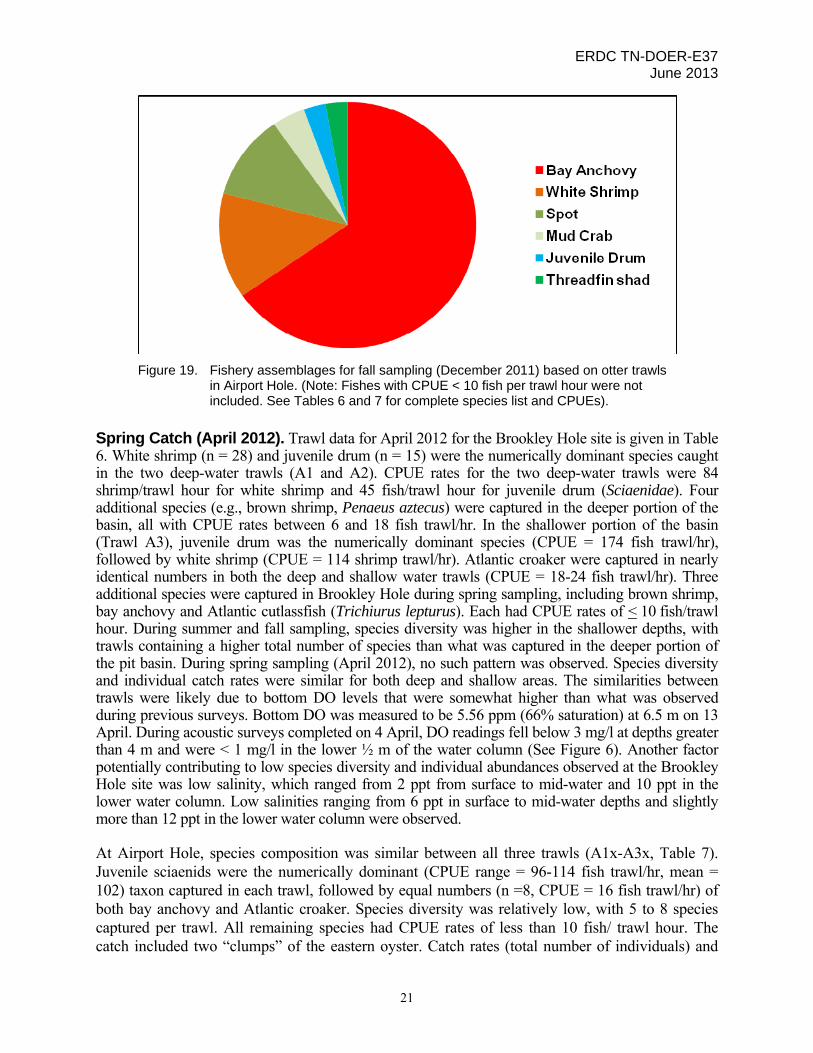
At the Airport Hole site, species composition was similar among all trawls (Table 7). Bay anchovy was the dominant species caught in all three trawls with CPUE rates between 36 to 132 fish/ trawl hour (n = 47, mean = 94 fish/trawl hour). Both spot and white shrimp were caught in relatively high numbers, with the exception of the second deep water tow (Trawl D2x). CPUE rates for combined sampling (3 trawls) averaged less than <20 fish/trawl hour for both spot and white shrimp. Total numbers of individuals and species diversity for December sampling was considerably lower than what was observed during September sampling. Species occurring in the catch fell from 15 species in September 2011 to 10 species during December 2011 sampling. Ten clusters of the eastern oyster (Crassostrea virginica) were brought to the surface during trawling. Figures 18 and 19 show the proportion of the top 6 numerically dominant species (based on CPUE rates) at each site.
Figure 18. Fishery assemblages for fall sampling (December 2011) based on otter trawls in Brookley Hole. (Note: Fishes with CPUE < 10 fish per trawl hour were not included. See Tables 6 and 7 for a complete species list and CPUEs).
ERDC TN-DOER-E37 June 2013
21
Figure 19. Fishery assemblages for fall sampling (December 2011) based on otter trawls in Airport Hole. (Note: Fishes with CPUE < 10 fish per trawl hour were not included. See Tables 6 and 7 for complete species list and CPUEs).
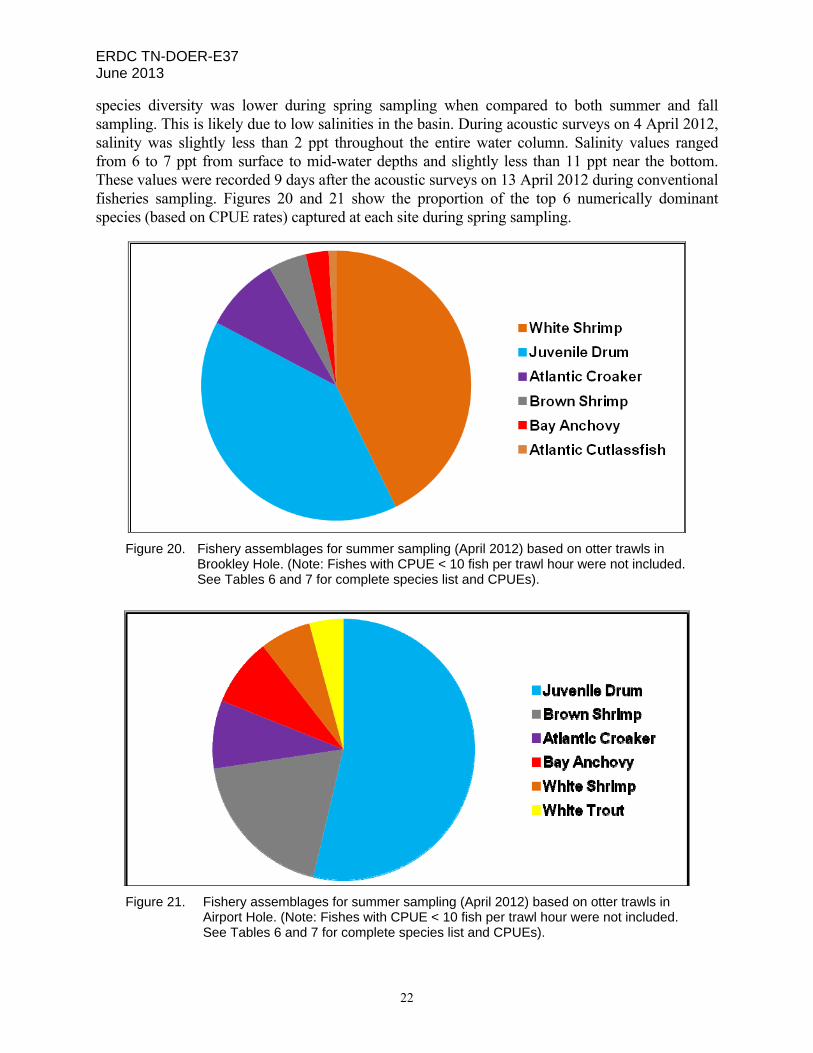
Spring Catch (April 2012). Trawl data for April 2012 for the Brookley Hole site is given in Table 6. White shrimp (n = 28) and juvenile drum (n = 15) were the numerically dominant species caught in the two deep-water trawls (A1 and A2). CPUE rates for the two deep-water trawls were 84 shrimp/trawl hour for white shrimp and 45 fish/trawl hour for juvenile drum (Sciaenidae). Four additional species (e.g., brown shrimp, Penaeus aztecus) were captured in the deeper portion of the basin, all with CPUE rates between 6 and 18 fish trawl/hr. In the shallower portion of the basin (Trawl A3), juvenile drum was the numerically dominant species (CPUE = 174 fish trawl/hr), followed by white shrimp (CPUE = 114 shrimp trawl/hr). Atlantic croaker were captured in nearly identical numbers in both the deep and shallow water trawls (CPUE = 18-24 fish trawl/hr). Three additional species were captured in Brookley Hole during spring sampling, including brown shrimp, bay anchovy and Atlantic cutlassfish (Trichiurus lepturus). Each had CPUE rates of < 10 fish/trawl hour. During summer and fall sampling, species diversity was higher in the shallower depths, with trawls containing a higher total number of species than what was captured in the deeper portion of the pit basin. During spring sampling (April 2012), no such pattern was observed. Species diversity and individual catch rates were similar for both deep and shallow areas. The similarities between trawls were likely due to bottom DO levels that were somewhat higher than what was observed during previous surveys. Bottom DO was measured to be 5.56 ppm (66% saturation) at 6.5 m on 13 April. During acoustic surveys completed on 4 April, DO readings fell below 3 mg/l at depths greater than 4 m and were < 1 mg/l in the lower ½ m of the water column (See Figure 6). Another factor potentially contributing to low species diversity and individual abundances observed at the Brookley Hole site was low salinity, which ranged from 2 ppt from surface to mid-water and 10 ppt in the lower water column. Low salinities ranging from 6 ppt in surface to mid-water depths and slightly more than 12 ppt in the lower water column were observed.
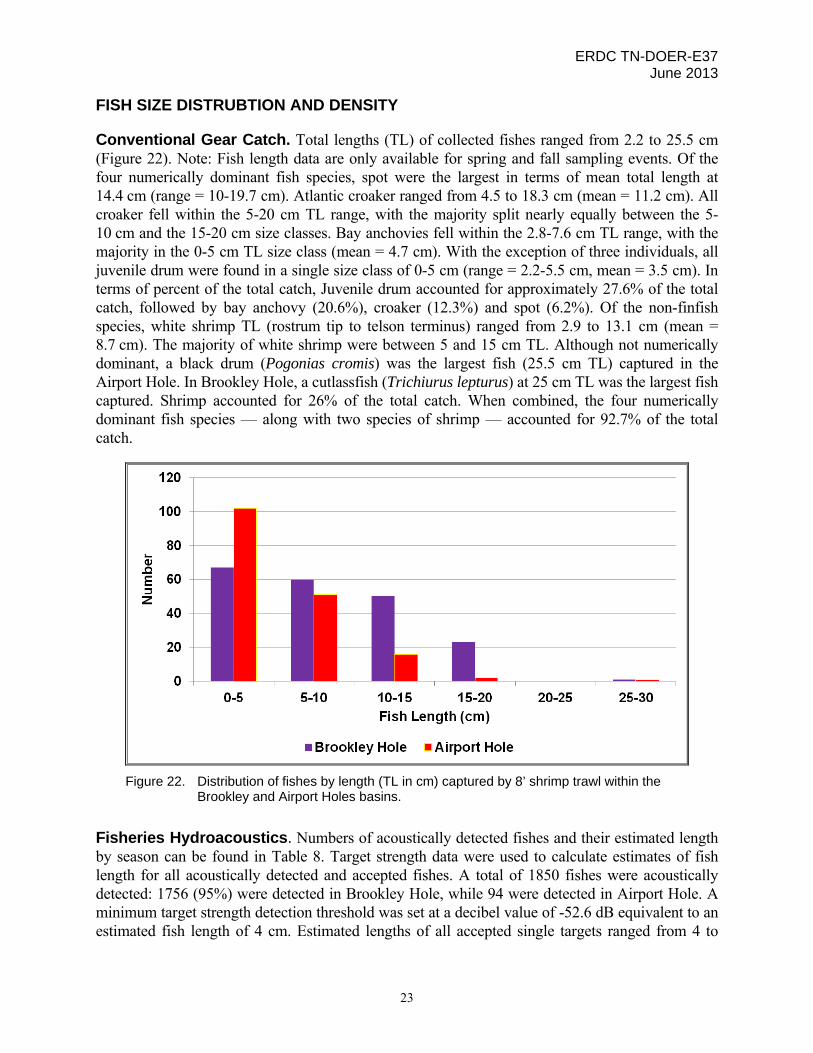
At Airport Hole, species composition was similar between all three trawls (A1x-A3x, Table 7). Juvenile sciaenids were the numerically dominant (CPUE range = 96-114 fish trawl/hr, mean = 102) taxon captured in each trawl, followed by equal numbers (n =8, CPUE = 16 fish trawl/hr) of both bay anchovy and Atlantic croaker. Species diversity was relatively low, with 5 to 8 species captured per trawl. All remaining species had CPUE rates of less than 10 fish/ trawl hour. The catch included two “clumps” of the eastern oyster. Catch rates (total number of individuals) and
ERDC TN-DOER-E37 June 2013
22
species diversity was lower during spring sampling when compared to both summer and fall sampling. This is likely due to low salinities in the basin. During acoustic surveys on 4 April 2012, salinity was slightly less than 2 ppt throughout the entire water column. Salinity values ranged from 6 to 7 ppt from surface to mid-water depths and slightly less than 11 ppt near the bottom. These values were recorded 9 days after the acoustic surveys on 13 April 2012 during conventional fisheries sampling. Figures 20 and 21 show the proportion of the top 6 numerically dominant species (based on CPUE rates) captured at each site during spring sampling.
Figure 20. Fishery assemblages for summer sampling (April 2012) based on otter trawls in Brookley Hole. (Note: Fishes with CPUE < 10 fish per trawl hour were not included. See Tables 6 and 7 for complete species list and CPUEs).
Figure 21. Fishery assemblages for summer sampling (April 2012) based on otter trawls in Airport Hole. (Note: Fishes with CPUE < 10 fish per trawl hour were not included. See Tables 6 and 7 for complete species list and CPUEs).
ERDC TN-DOER-E37 June 2013
23
FISH SIZE DISTRUBTION AND DENSITY
Conventional Gear Catch. Total lengths (TL) of collected fishes ranged from 2.2 to 25.5 cm (Figure 22). Note: Fish length data are only available for spring and fall sampling events. Of the four numerically dominant fish species, spot were the largest in terms of mean total length at 14.4 cm (range = 10-19.7 cm). Atlantic croaker ranged from 4.5 to 18.3 cm (mean = 11.2 cm). All croaker fell within the 5-20 cm TL range, with the majority split nearly equally between the 5-10 cm and the 15-20 cm size classes. Bay anchovies fell within the 2.8-7.6 cm TL range, with the majority in the 0-5 cm TL size class (mean = 4.7 cm). With the exception of three individuals, all juvenile drum were found in a single size class of 0-5 cm (range = 2.2-5.5 cm, mean = 3.5 cm). In terms of percent of the total catch, Juvenile drum accounted for approximately 27.6% of the total catch, followed by bay anchovy (20.6%), croaker (12.3%) and spot (6.2%). Of the non-finfish species, white shrimp TL (rostrum tip to telson terminus) ranged from 2.9 to 13.1 cm (mean = 8.7 cm). The majority of white shrimp were between 5 and 15 cm TL. Although not numerically dominant, a black drum (Pogonias cromis) was the largest fish (25.5 cm TL) captured in the Airport Hole. In Brookley Hole, a cutlassfish (Trichiurus lepturus) at 25 cm TL was the largest fish captured. Shrimp accounted for 26% of the total catch. When combined, the four numerically dominant fish species — along with two species of shrimp — accounted for 92.7% of the total catch.
Figure 22. Distribution of fishes by length (TL in cm) captured by 8’ shrimp trawl within the Brookley and Airport Holes basins.
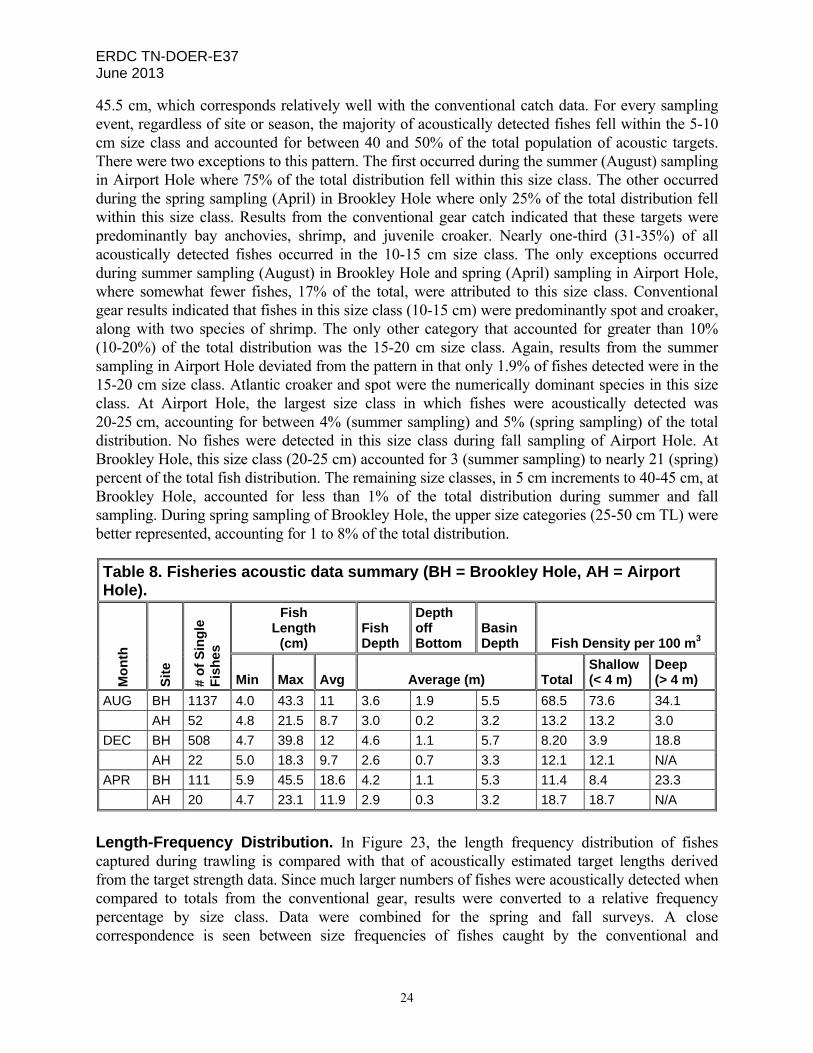
Fisheries Hydroacoustics. Numbers of acoustically detected fishes and their estimated length by season can be found in Table 8. Target strength data were used to calculate estimates of fish length for all acoustically detected and accepted fishes. A total of 1850 fishes were acoustically detected: 1756 (95%) were detected in Brookley Hole, while 94 were detected in Airport Hole. A minimum target strength detection threshold was set at a decibel value of -52.6 dB equivalent to an estimated fish length of 4 cm. Estimated lengths of all accepted single targets ranged from 4 to
ERDC TN-DOER-E37 June 2013
24
45.5 cm, which corresponds relatively well with the conventional catch data. For every sampling event, regardless of site or season, the majority of acoustically detected fishes fell within the 5-10 cm size class and accounted for between 40 and 50% of the total population of acoustic targets. There were two exceptions to this pattern. The first occurred during the summer (August) sampling in Airport Hole where 75% of the total distribution fell within this size class. The other occurred during the spring sampling (April) in Brookley Hole where only 25% of the total distribution fell within this size class. Results from the conventional gear catch indicated that these targets were predominantly bay anchovies, shrimp, and juvenile croaker. Nearly one-third (31-35%) of all acoustically detected fishes occurred in the 10-15 cm size class. The only exceptions occurred during summer sampling (August) in Brookley Hole and spring (April) sampling in Airport Hole, where somewhat fewer fishes, 17% of the total, were attributed to this size class. Conventional gear results indicated that fishes in this size class (10-15 cm) were predominantly spot and croaker, along with two species of shrimp. The only other category that accounted for greater than 10% (10-20%) of the total distribution was the 15-20 cm size class. Again, results from the summer sampling in Airport Hole deviated from the pattern in that only 1.9% of fishes detected were in the 15-20 cm size class. Atlantic croaker and spot were the numerically dominant species in this size class. At Airport Hole, the largest size class in which fishes were acoustically detected was 20-25 cm, accounting for between 4% (summer sampling) and 5% (spring sampling) of the total distribution. No fishes were detected in this size class during fall sampling of Airport Hole. At Brookley Hole, this size class (20-25 cm) accounted for 3 (summer sampling) to nearly 21 (spring) percent of the total fish distribution. The remaining size classes, in 5 cm increments to 40-45 cm, at Brookley Hole, accounted for less than 1% of the total distribution during summer and fall sampling. During spring sampling of Brookley Hole, the upper size categories (25-50 cm TL) were better represented, accounting for 1 to 8% of the total distribution.
Table 8. Fisheries acoustic data summary (BH = Brookley Hole, AH = Airport Hole).
Mo
nth
Sit
e
# o
f S
ing
le
Fis
hes
Fish Length
(cm) Fish Depth
Depth off Bottom
Basin Depth Fish Density per 100 m3
Min Max Avg Average (m) Total Shallow (< 4 m)
Deep (> 4 m)
AUG BH 1137 4.0 43.3 11 3.6 1.9 5.5 68.5 73.6 34.1
AH 52 4.8 21.5 8.7 3.0 0.2 3.2 13.2 13.2 3.0
DEC BH 508 4.7 39.8 12 4.6 1.1 5.7 8.20 3.9 18.8
AH 22 5.0 18.3 9.7 2.6 0.7 3.3 12.1 12.1 N/A
APR BH 111 5.9 45.5 18.6 4.2 1.1 5.3 11.4 8.4 23.3
AH 20 4.7 23.1 11.9 2.9 0.3 3.2 18.7 18.7 N/A
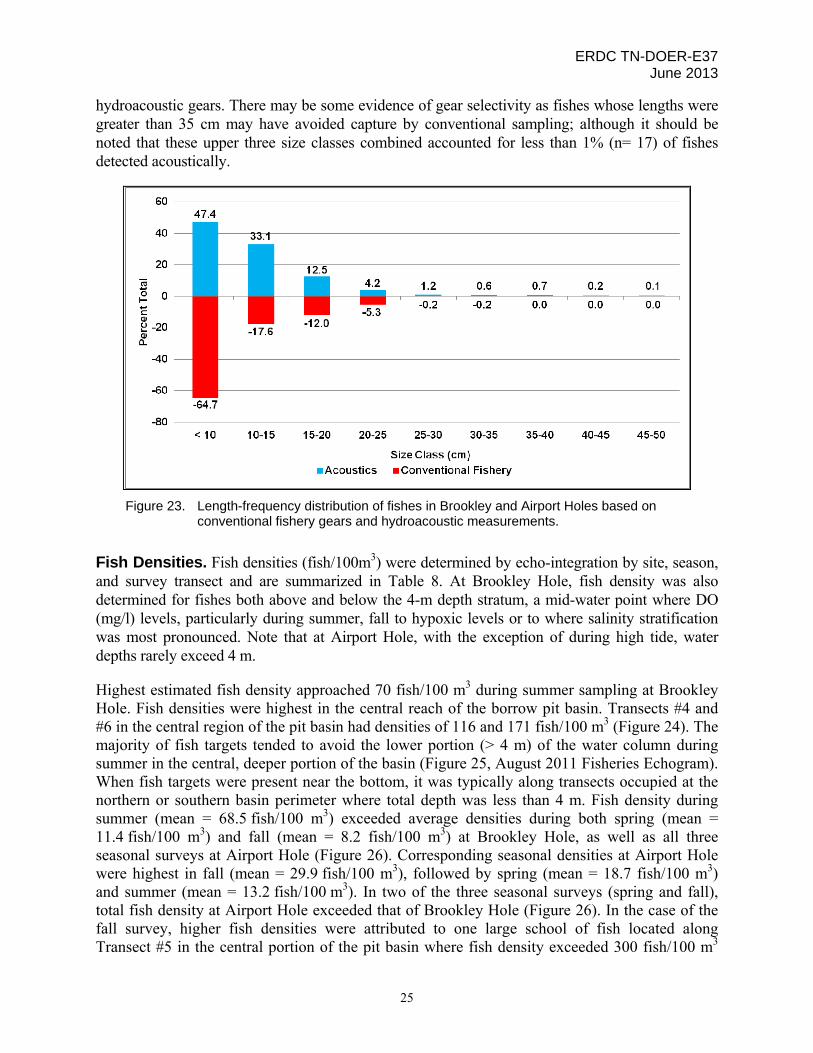
Length-Frequency Distribution. In Figure 23, the length frequency distribution of fishes captured during trawling is compared with that of acoustically estimated target lengths derived from the target strength data. Since much larger numbers of fishes were acoustically detected when compared to totals from the conventional gear, results were converted to a relative frequency percentage by size class. Data were combined for the spring and fall surveys. A close correspondence is seen between size frequencies of fishes caught by the conventional and
ERDC TN-DOER-E37 June 2013
25
hydroacoustic gears. There may be some evidence of gear selectivity as fishes whose lengths were greater than 35 cm may have avoided capture by conventional sampling; although it should be noted that these upper three size classes combined accounted for less than 1% (n= 17) of fishes detected acoustically.
Figure 23. Length-frequency distribution of fishes in Brookley and Airport Holes based on conventional fishery gears and hydroacoustic measurements.
Fish Densities. Fish densities (fish/100m3) were determined by echo-integration by site, season, and survey transect and are summarized in Table 8. At Brookley Hole, fish density was also determined for fishes both above and below the 4-m depth stratum, a mid-water point where DO (mg/l) levels, particularly during summer, fall to hypoxic levels or to where salinity stratification was most pronounced. Note that at Airport Hole, with the exception of during high tide, water depths rarely exceed 4 m.
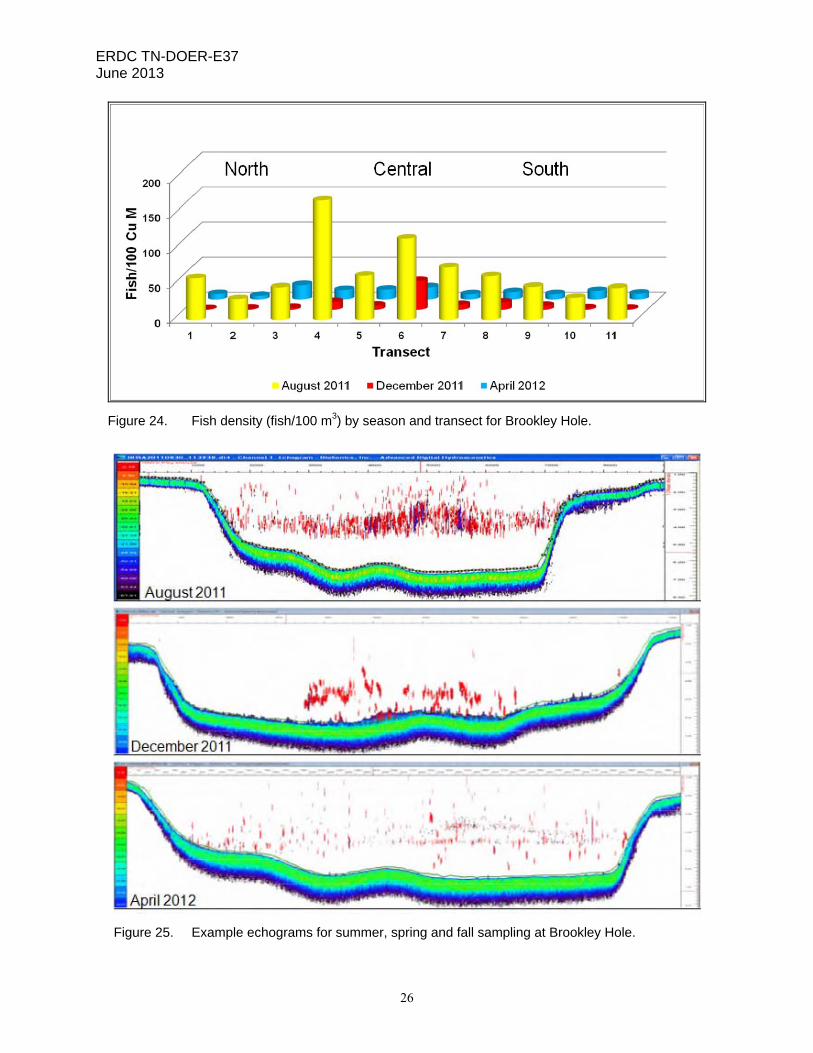
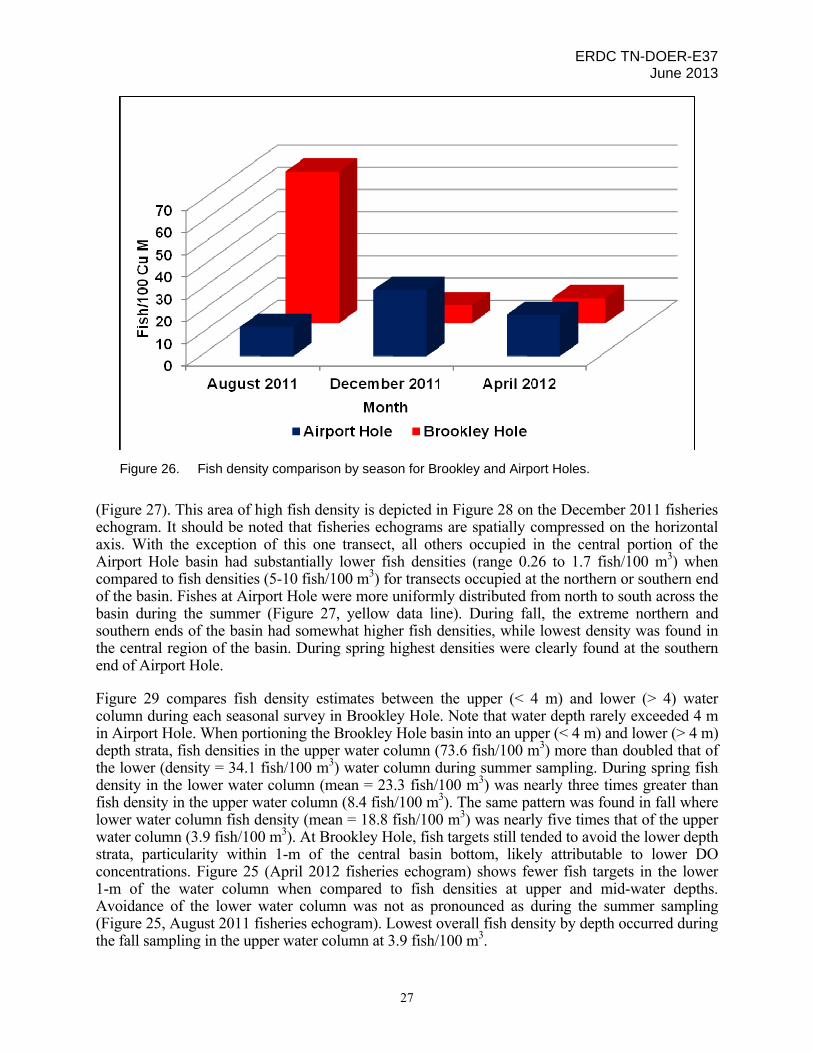
Highest estimated fish density approached 70 fish/100 m3 during summer sampling at Brookley Hole. Fish densities were highest in the central reach of the borrow pit basin. Transects #4 and #6 in the central region of the pit basin had densities of 116 and 171 fish/100 m3 (Figure 24). The majority of fish targets tended to avoid the lower portion (> 4 m) of the water column during summer in the central, deeper portion of the basin (Figure 25, August 2011 Fisheries Echogram). When fish targets were present near the bottom, it was typically along transects occupied at the northern or southern basin perimeter where total depth was less than 4 m. Fish density during summer (mean = 68.5 fish/100 m3) exceeded average densities during both spring (mean = 11.4 fish/100 m3) and fall (mean = 8.2 fish/100 m3) at Brookley Hole, as well as all three seasonal surveys at Airport Hole (Figure 26). Corresponding seasonal densities at Airport Hole were highest in fall (mean = 29.9 fish/100 m3), followed by spring (mean = 18.7 fish/100 m3) and summer (mean = 13.2 fish/100 m3). In two of the three seasonal surveys (spring and fall), total fish density at Airport Hole exceeded that of Brookley Hole (Figure 26). In the case of the fall survey, higher fish densities were attributed to one large school of fish located along Transect #5 in the central portion of the pit basin where fish density exceeded 300 fish/100 m3
ERDC TN-DOER-E37 June 2013
26
Figure 24. Fish density (fish/100 m3) by season and transect for Brookley Hole.
Figure 25. Example echograms for summer, spring and fall sampling at Brookley Hole.
ERDC TN-DOER-E37 June 2013
27
Figure 26. Fish density comparison by season for Brookley and Airport Holes.
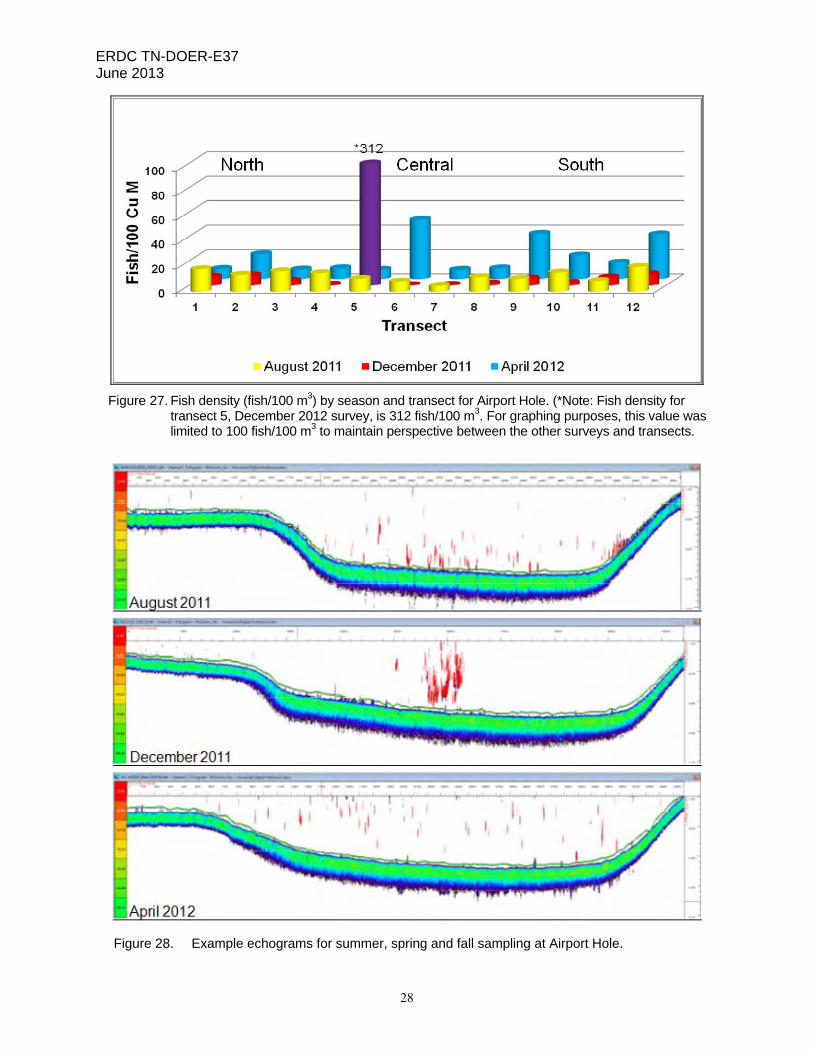
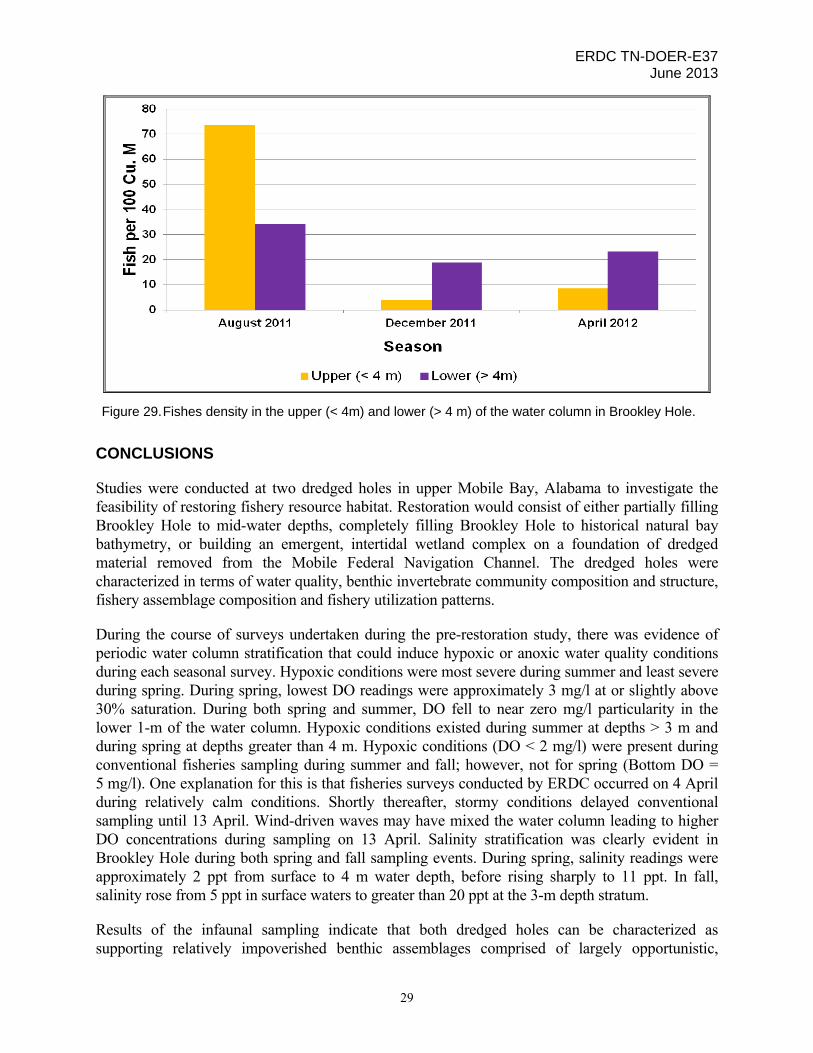
(Figure 27). This area of high fish density is depicted in Figure 28 on the December 2011 fisheries echogram. It should be noted that fisheries echograms are spatially compressed on the horizontal axis. With the exception of this one transect, all others occupied in the central portion of the Airport Hole basin had substantially lower fish densities (range 0.26 to 1.7 fish/100 m3) when compared to fish densities (5-10 fish/100 m3) for transects occupied at the northern or southern end of the basin. Fishes at Airport Hole were more uniformly distributed from north to south across the basin during the summer (Figure 27, yellow data line). During fall, the extreme northern and southern ends of the basin had somewhat higher fish densities, while lowest density was found in the central region of the basin. During spring highest densities were clearly found at the southern end of Airport Hole.
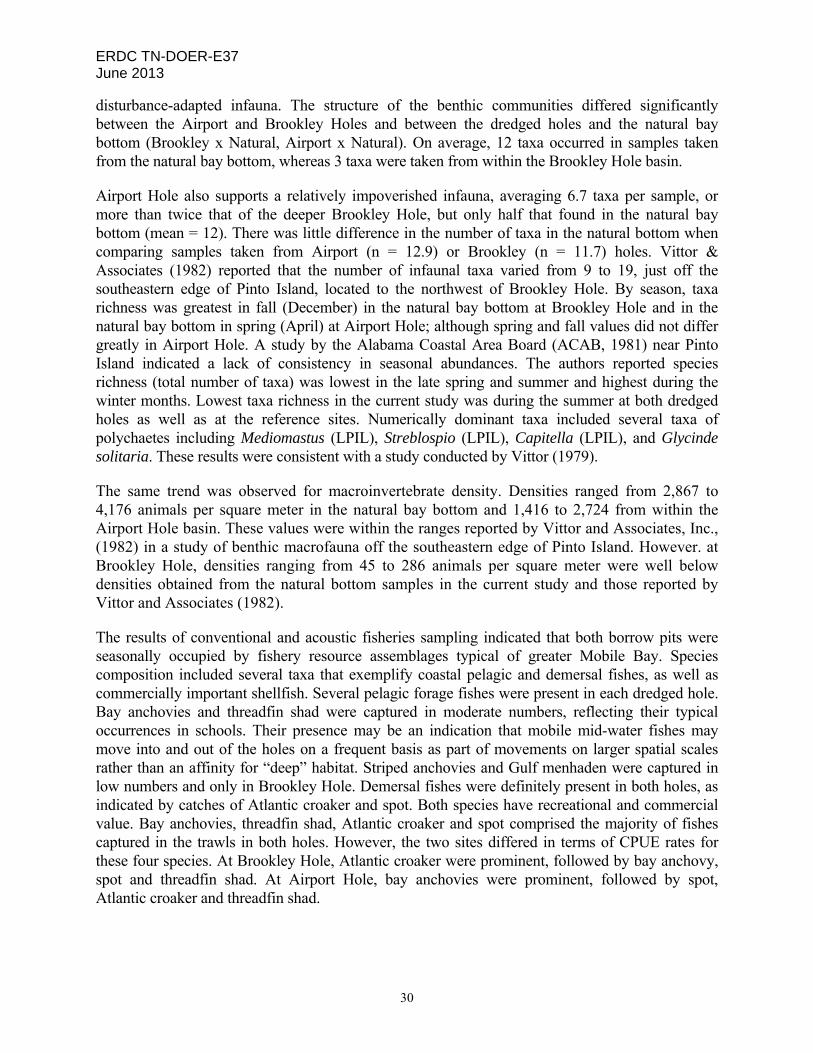
Figure 29 compares fish density estimates between the upper (< 4 m) and lower (> 4) water column during each seasonal survey in Brookley Hole. Note that water depth rarely exceeded 4 m in Airport Hole. When portioning the Brookley Hole basin into an upper (< 4 m) and lower (> 4 m) depth strata, fish densities in the upper water column (73.6 fish/100 m3) more than doubled that of the lower (density = 34.1 fish/100 m3) water column during summer sampling. During spring fish density in the lower water column (mean = 23.3 fish/100 m3) was nearly three times greater than fish density in the upper water column (8.4 fish/100 m3). The same pattern was found in fall where lower water column fish density (mean = 18.8 fish/100 m3) was nearly five times that of the upper water column (3.9 fish/100 m3). At Brookley Hole, fish targets still tended to avoid the lower depth strata, particularity within 1-m of the central basin bottom, likely attributable to lower DO concentrations. Figure 25 (April 2012 fisheries echogram) shows fewer fish targets in the lower 1-m of the water column when compared to fish densities at upper and mid-water depths. Avoidance of the lower water column was not as pronounced as during the summer sampling (Figure 25, August 2011 fisheries echogram). Lowest overall fish density by depth occurred during the fall sampling in the upper water column at 3.9 fish/100 m3.
ERDC TN-DOER-E37 June 2013
28
Figure 27. Fish density (fish/100 m3) by season and transect for Airport Hole. (*Note: Fish density for transect 5, December 2012 survey, is 312 fish/100 m3. For graphing purposes, this value was limited to 100 fish/100 m3 to maintain perspective between the other surveys and transects.
Figure 28. Example echograms for summer, spring and fall sampling at Airport Hole.
ERDC TN-DOER-E37 June 2013
29
Figure 29. Fishes density in the upper (< 4m) and lower (> 4 m) of the water column in Brookley Hole.
CONCLUSIONS
Studies were conducted at two dredged holes in upper Mobile Bay, Alabama to investigate the feasibility of restoring fishery resource habitat. Restoration would consist of either partially filling Brookley Hole to mid-water depths, completely filling Brookley Hole to historical natural bay bathymetry, or building an emergent, intertidal wetland complex on a foundation of dredged material removed from the Mobile Federal Navigation Channel. The dredged holes were characterized in terms of water quality, benthic invertebrate community composition and structure, fishery assemblage composition and fishery utilization patterns.
During the course of surveys undertaken during the pre-restoration study, there was evidence of periodic water column stratification that could induce hypoxic or anoxic water quality conditions during each seasonal survey. Hypoxic conditions were most severe during summer and least severe during spring. During spring, lowest DO readings were approximately 3 mg/l at or slightly above 30% saturation. During both spring and summer, DO fell to near zero mg/l particularity in the lower 1-m of the water column. Hypoxic conditions existed during summer at depths > 3 m and during spring at depths greater than 4 m. Hypoxic conditions (DO < 2 mg/l) were present during conventional fisheries sampling during summer and fall; however, not for spring (Bottom DO = 5 mg/l). One explanation for this is that fisheries surveys conducted by ERDC occurred on 4 April during relatively calm conditions. Shortly thereafter, stormy conditions delayed conventional sampling until 13 April. Wind-driven waves may have mixed the water column leading to higher DO concentrations during sampling on 13 April. Salinity stratification was clearly evident in Brookley Hole during both spring and fall sampling events. During spring, salinity readings were approximately 2 ppt from surface to 4 m water depth, before rising sharply to 11 ppt. In fall, salinity rose from 5 ppt in surface waters to greater than 20 ppt at the 3-m depth stratum.
Results of the infaunal sampling indicate that both dredged holes can be characterized as supporting relatively impoverished benthic assemblages comprised of largely opportunistic,
ERDC TN-DOER-E37 June 2013
30
disturbance-adapted infauna. The structure of the benthic communities differed significantly between the Airport and Brookley Holes and between the dredged holes and the natural bay bottom (Brookley x Natural, Airport x Natural). On average, 12 taxa occurred in samples taken from the natural bay bottom, whereas 3 taxa were taken from within the Brookley Hole basin.
Airport Hole also supports a relatively impoverished infauna, averaging 6.7 taxa per sample, or more than twice that of the deeper Brookley Hole, but only half that found in the natural bay bottom (mean = 12). There was little difference in the number of taxa in the natural bottom when comparing samples taken from Airport (n = 12.9) or Brookley (n = 11.7) holes. Vittor & Associates (1982) reported that the number of infaunal taxa varied from 9 to 19, just off the southeastern edge of Pinto Island, located to the northwest of Brookley Hole. By season, taxa richness was greatest in fall (December) in the natural bay bottom at Brookley Hole and in the natural bay bottom in spring (April) at Airport Hole; although spring and fall values did not differ greatly in Airport Hole. A study by the Alabama Coastal Area Board (ACAB, 1981) near Pinto Island indicated a lack of consistency in seasonal abundances. The authors reported species richness (total number of taxa) was lowest in the late spring and summer and highest during the winter months. Lowest taxa richness in the current study was during the summer at both dredged holes as well as at the reference sites. Numerically dominant taxa included several taxa of polychaetes including Mediomastus (LPIL), Streblospio (LPIL), Capitella (LPIL), and Glycinde solitaria. These results were consistent with a study conducted by Vittor (1979).
The same trend was observed for macroinvertebrate density. Densities ranged from 2,867 to 4,176 animals per square meter in the natural bay bottom and 1,416 to 2,724 from within the Airport Hole basin. These values were within the ranges reported by Vittor and Associates, Inc., (1982) in a study of benthic macrofauna off the southeastern edge of Pinto Island. However. at Brookley Hole, densities ranging from 45 to 286 animals per square meter were well below densities obtained from the natural bottom samples in the current study and those reported by Vittor and Associates (1982).
The results of conventional and acoustic fisheries sampling indicated that both borrow pits were seasonally occupied by fishery resource assemblages typical of greater Mobile Bay. Species composition included several taxa that exemplify coastal pelagic and demersal fishes, as well as commercially important shellfish. Several pelagic forage fishes were present in each dredged hole. Bay anchovies and threadfin shad were captured in moderate numbers, reflecting their typical occurrences in schools. Their presence may be an indication that mobile mid-water fishes may move into and out of the holes on a frequent basis as part of movements on larger spatial scales rather than an affinity for “deep” habitat. Striped anchovies and Gulf menhaden were captured in low numbers and only in Brookley Hole. Demersal fishes were definitely present in both holes, as indicated by catches of Atlantic croaker and spot. Both species have recreational and commercial value. Bay anchovies, threadfin shad, Atlantic croaker and spot comprised the majority of fishes captured in the trawls in both holes. However, the two sites differed in terms of CPUE rates for these four species. At Brookley Hole, Atlantic croaker were prominent, followed by bay anchovy, spot and threadfin shad. At Airport Hole, bay anchovies were prominent, followed by spot, Atlantic croaker and threadfin shad.

ERDC TN-DOER-E37 June 2013
31
Commercially important shellfish taken at both sites include both brown and white shrimp, eastern oyster and blue crab. In terms of the entire fishery assemblages, white shrimp was the numerically dominant species captured in Brookley Hole and the second most abundant species captured at Airport Hole. Although brown shrimp were present at both sites, they were taken in far fewer numbers. Oyster “clumps” were present only in Airport Hole, but these were most likely incidental captures taken along the rim or upper side slopes of the basin. Blue crabs were present at both sites but in low numbers.
Fishes were observed to move freely within and outside of both borrow pits. The “flux” of fishes between the holes and adjacent shallow habitats may be influenced by proximity of both dredged holes to shorelines, and the lack of strong tidal flows. Inspection of individual echograms of transects across the dredged holes yielded some evidence of association between fish targets and bathymetric features, such as the toes or upper rims of the side slopes of the holes. It should be noted that fisheries acoustics techniques provide data on fishes in the water column only and not in contact with the substrate. Therefore, fish densities estimated acoustically herein do not include flatfishes, gobies, and other bottom-oriented species.
There was strong evidence of fish avoiding the lower depth strata in Brookley Hole, particularity during summer and to a lesser degree during spring. In summer the avoidance zone typically spanned from mid-water to hole bottom, particularly in the central deeper portion of the pit basin. In spring, the avoidance zone was generally limited to the lower 1 to 1 ½ m of the water column. This area was shown to be persistently hypoxic in Brookley Hole. Depth distribution of fishes was shown to change subtly between seasons and regions of the basin. The latter observation may simply reflect differences in geometry, and bathymetry of the dredged holes and orientations to prevailing currents. Fishes were more evenly distributed throughout the water column in both dredged holes in the spring survey, but congregated at mid-water depths during summer in Brookley Hole. At Airport Hole, fishes tended to favor the lower depth strata during summer, but were more evenly distributed throughout the water column during spring.
In conclusion, Brookley Hole is a suitable candidate for either partial or full restoration. From an ecological perspective, the partial or complete filling of these dredged holes would benefit fishery resources through elimination of hypoxic/anoxic zones common to these bathymetric features. Partial filling would restore the degraded habitat, while not negatively impacting the upper portion of the water column utilized by a variety of fish and shellfish species. Complete filling would restore historical bathymetric contours to that area of upper Mobile Bay. Other long-term restoration endpoints might be considered, such as establishment of submerged aquatic vegetation, oyster reef, or benthic habitats that support fishery resources.
ACKNOWLEDGMENTS
The authors wish to thank Dr. Gary Ray, ERDC-Environmental Lab (Retired) for the processing of benthic samples, Mr. Richard Hudson of the Environmental Lab, ERDC for processing sediment samples and Barry Vittor & Associates for conventional fisheries data collection. The authors also thank Captains Alan Lang and Stephen Reid of the Irvington Site Office, USACE Mobile District. Sincere appreciation is also extended to Larry Parson, Nate Lovelace, and Herbert Bullock of the USACE Mobile District for technical and logistical support.
ERDC TN-DOER-E37 June 2013
32
POINT OF CONTACT: Contact author, Kevin J. Reine (601-634-3436), Kevin.J.Reine@ usace.army.mil) Wetlands and Coastal Ecology Branch, Ecosystem Evaluation and Engineering Division, Environmental Laboratory, or the manager of the Dredging Operations and Environmental Research Program, Dr. Todd Bridges, (601-634-3626), Todd.S.Bridges@ usace.army.mil). This technical note should be cited as follows:
Reine, K. J., D. G. Clarke, and C. Dickerson. 2013. Pre-restoration assessment of fishery resource utilization of an estuarine borrow pit in Mobile Bay, Alabama. Technical Note ERDC TN-DOER-E37. Vicksburg, MS: U.S. Army Engineer Research and Development Center.
REFERENCES
Alabama Coastal Area Board (ACAB) and the Marine Environmental Sciences Consortium (1981). Final Report CAB 81-05, Daphne, Alabama.
Blott, S. 2000. GRADISTAT Version 4.0: A grain size distribution and statistics package for the analysis of unconsolidated sediments by sieving or laser granulome.
Bokuniewicz, H., R. Cerrato, , and D. Hirschberg. 1896. Studies in the Lower Bay of New York Harbor associated with the burial of dredged sediment in subaqueous borrow pits. Special Report 74. Ref. 86-12. New York, NY: U.S. Army Corps of Engineers, New York District.
Cerrato, R. M., H. Bokuniewicz, , and M. H. Wiggins. 1989. A spatial and seasonal study of the benthic fauna in the Lower Bay of New York Harbor. Special Report 64, Ref. 89-1, 1-325. State University of New York at Stony Brook: Marine Sciences Research Center.
Culter, J. K. and C. Truitt. 1997. Artificial reef construction as a soft-bottom habitat restoration tools. Sarasota Bay National Estuary Program. Mote Marine Laboratory Technical Report no. 530. 43 p. and appendix.
Folk, R.L. 1968. Petrology of Sedimentary Rocks. Hemphills, Austin, TX: University of Texas.
Galehouse, R.L. 1971. Sieve Analysis, pp. 49-94 in R. Carver (ed.), Procedures in Sedimentary Petrology, New York, NY: Wiley Interscience.
Tampa Bay Dredged Hole Habitat Assessment Advisory Team. 2005. Tampa Bay Dredged Hole Habitat Assessment Project. Tampa Bay Estuary Program, Technical Publication #04-05 submitted to the U. S. Environmental Protection Agency, Region 4.
Love, R.H. 1971. Dorsal aspect target strength of an individual fish. Journal of the Acoustical Society of America 46, 746-752.
Murawski, W.S. 1969. A study of submerged dredge holes in New Jersey estuaries with respect to their fitness as fish habitat. New Jersey Department of Conservation and Economic Development, Division of Fish and Game, Miscellaneous Report 2M. 1-32.
Reine, K., D. G. Clarke, G. L. Ray and C. Dickerson. 2012. Fishery resource utilization of a restored estuarine borrow pit: A beneficial use of dredged material case study. ERDC TN-DOER-E33. DOER Technical Notes Collection. Vicksburg, MS: U. S. Army Engineer Research and Development Center.
Simmonds, J., and MacLennan, D. 2005. Fisheries Acoustics Theory and Practice. Second Edition, Oxford, U.K.: Blackwell Publishing Company.
U.S. Army Corps of Engineers (USACE). 2012. Brookley Hole Demonstration: Beneficial Use of Dredged Material from Mobile Harbor Federal Navigation Channel, Mobile County, Alabama. Draft Environmental Assessment prepared by the U.S. Army Engineer District: Mobile, Planning and Environmental Division, Environment and Resources Branch, Coastal Environment Team. 45 pp.
ERDC TN-DOER-E37 June 2013
33
USACE 2001. Environmental restoration of Dredged Hole #6, Barnegat Bay, New Jersey feasibility report and environmental assessment. Joint study by the U.S. Army Corps of Engineers and New Jersey Department of Environmental Protection. 105 pp.
Vittor and Associates, Inc. 1982. Ecological Characterization of Southeastern Pinto Island, Alabama Drydock and Shipping Company, Mobile, Alabama.
Vittor, B. A. 1979. Benthos of the Mobile Bay Estuary, Symposium on the natural resources of the Mobile Bay Estuary, Alabama, pp 143-150, U.S. Army Corps of Engineers, Mobile District, Alabama.
Yozzo, D. J., P. Wilber, and R. J. Will. 2004. Beneficial use of dredged material for habitat creation, enhancement, and restoration in New York-New Jersey Harbor. Journal of Environmental Management 73 (1): 39-52.
NOTE: The contents of this technical note are not to be used for advertising, publication, or promotional purposes. Citation of trade names does not constitute an official endorsement or approval of the use of such products.