a precise measurement of the w boson mass at cdf precise measurement of the w boson mass at cdf...
TRANSCRIPT

A Precise Measurement of the W Boson Mass at CDF
Ashutosh KotwalDuke University
For the CDF Collaboration
University of OxfordMarch 5, 2013

Spontaneous Symmetry Breaking
● 2008 Nobel Prize in Physics
"for the discovery of the mechanism of spontaneously broken symmetry in subatomic physics"
● The mass of the W boson is linked to the mechanism of Electroweak Symmetry Breaking
Yoichiro Nambu

Spontaneous Symmetry Breaking
● Is the mechanism of Electroweak Symmetry Breaking, the Standard Model Higgs mechanism?

● The electroweak gauge sector of the standard model, defined by (g, g', v), is constrained by three precisely known parameters
– αEM (MZ) = 1 / 127.918(18)
– GF = 1.16637 (1) x 10-5 GeV-2
– MZ = 91.1876 (21) GeV
● At tree-level, these parameters are related to other electroweak observables, e.g. MW
– MW2 = παΕΜ / √2GF sin2ϑW
● where ϑW is the Weinberg mixing angle
cos ϑW = MW/MZ
Motivation for Precision Measurements

● Radiative corrections due to heavy quark and Higgs loops and exotica
Motivation for Precision Measurements
Motivate the introduction of the ρ parameter: MW2 = ρ [MW(tree)]2
with the predictions Δρ = (ρ−1) ∼ Μtop2 and Δρ ∼ ln MH
● In conjunction with Mtop, the W boson mass constrains the mass of the Higgs boson, and possibly new particles beyond the standard model

Detecting New Physics through Precision Measurements
● Willis Lamb (Nobel Prize 1955) measured the difference between energies of 2S
½ and 2P
½ states of hydrogen atom
– 4 micro electron volts diference compared to few electron volts binding energy
– States should be degenerate in energy according to tree-level calculation
● Harbinger of vacuum fluctuations to be calculated by Feynman diagrams containing quantum loops
– Modern quantum field theory of electrodynamics followed ( Nobel Prize 1965 for Schwinger, Feynman, Tomonaga)

Contributions from Supersymmetric Particles
● Radiative correction depends on chiral structure of SUSY sector and mass splitting (∆m2) between squarks in SU(2) doublet
● After folding in limits on SUSY particles from direct searches, SUSY loops can contribute ~100 MeV to M
W

Uncertainty from αEM
(MZ)
● δαEM dominated by uncertainty from non-perturbative contributions: hadronic loops in photon propagator at low Q2
● equivalent δMW ≈ 4 MeV for the same Higgs mass constraint– Was equivalent δMW ≈ 15 MeV a decade ago
Line thickness due to δα
EM
(40% C.L.)

Progress on Mtop at the Tevatron
● From the Tevatron, ∆Mtop = 0.9 GeV => ∆MH / MH = 8%● equivalent ∆MW = 6 MeV for the same Higgs mass constraint (and further
improvements possible from Tevatron and LHC)● 2011 world average ∆MW = 23 MeV
– progress on ∆MW has the biggest impact on Higgs constraint

● SM Higgs fit: MH = 94+29-24 GeV (LEPEWWG)
● Direct searches: MH ~ 125 GeV (ATLAS, CMS)
Motivation II
In addition to the Higgs, is there another missing piece ?
AFBb vs ALR: ~3σ
Must continue improvingprecision of MW , Mtop ...
other precision measurementsconstrain Higgs, equivalent to δMW ~ 15 MeV
Motivate direct measurement of MW at the 15 MeV level and better
GFitter

● Generic parameterization of new physics contributing to W and Z boson self-energies through radiative corrections in propagators
– S, T, U parameters (Peskin & Takeuchi, Marciano & Rosner, Kennedy & Langacker, Kennedy & Lynn)
Motivation III
q2
ΠV V
ΠWW
(q2)
ΠΖΖ
(q2)
TS ~ slope
S+U ~ slope

● Generic parameterization of new physics contributing to W and Z boson self-energies: S, T, U parameters (Peskin & Takeuchi)
Motivation III
MW
and Asymmetries are the most powerful observables in this parameterization
(from P. Langacker, 2012)
Additionally, MW
is the
only measurement whichconstrains U
MH ~ 120 GeV
MH > 600 GeV

● An example: extending the Higgs sector to two SU(2) doublets (required in SUSY) predicts additional neutral scalar and pseudo-scalar, and charged Higgs bosons
Motivation III
T parameter responds strongly to 2HDM parameters(from M. Baak et al. (Gfitter Group) Eur. Phys. J. C (2012) 72:2003)

1998 Status of MW vs Mtop

2012 Status of MW vs Mtop

Previous CDF Result (200 pb-1)Transverse Mass Fit Uncertainties (MeV)
electrons commonW statistics 48 54 0Lepton energy scale 30 17 17Lepton resolution 9 3 -3Recoil energy scale 9 9 9Recoil energy resolution 7 7 7Selection bias 3 1 0Lepton removal 8 5 5Backgrounds 8 9 0pT(W) model 3 3 3Parton dist. Functions 11 11 11QED rad. Corrections 11 12 11Total systematic 39 27 26Total 62 60
muons
Systematic uncertainties shown in green: statistics-limited by control data samples
(CDF, PRL 99:151801, 2007; Phys. Rev. D 77:112001, 2008)Total uncertainty of 48 MeV on W mass

W Boson Production at the Tevatron
Neutrino
LeptonW
GluonsQuark
Antiquark
Quark-antiquark annihilationdominates (80%)
Lepton pT carries most of W mass information, can be measured precisely (achieved 0.01%)
Initial state QCD radiation is O(10 GeV), measure as soft 'hadronic recoil' incalorimeter (calibrated to ~0.5%)dilutes W mass information, fortunately pT(W) << MW
e

Quadrant of Collider Detector at Fermilab (CDF)
.η = 1Central electromagnetic calorimeter
Central hadronic calorimeter
Select W and Z bosons with central ( | η | < 1 ) leptons
COT providesprecise lepton track momentummeasurement
EM calorimeter provides preciseelectron energymeasurement
Calorimeters measure hadronic recoil particles

Collider Detector at Fermilab (CDF)
Centralhadroniccalorimeter
Muondetector
Centraloutertracker(COT)
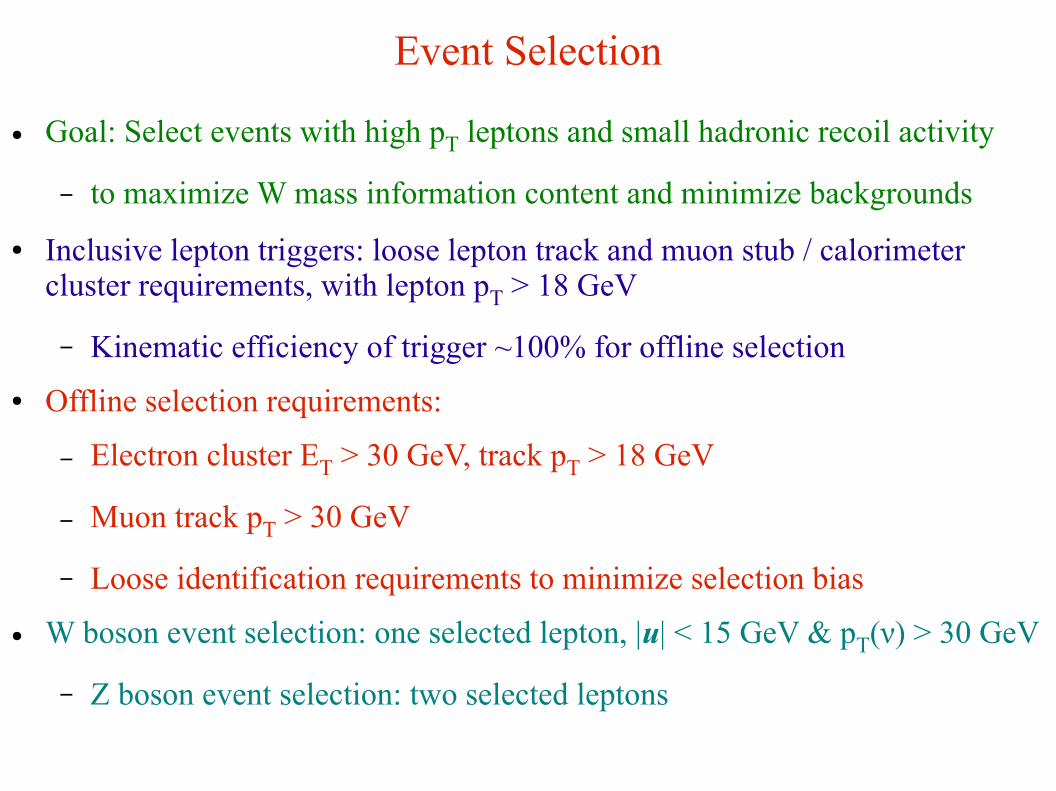
Event Selection
● Goal: Select events with high pT leptons and small hadronic recoil activity
– to maximize W mass information content and minimize backgrounds
● Inclusive lepton triggers: loose lepton track and muon stub / calorimeter cluster requirements, with lepton pT > 18 GeV
– Kinematic efficiency of trigger ~100% for offline selection
● Offline selection requirements:
– Electron cluster ET > 30 GeV, track pT > 18 GeV
– Muon track pT > 30 GeV
– Loose identification requirements to minimize selection bias
● W boson event selection: one selected lepton, |u| < 15 GeV & pT(ν) > 30 GeV
– Z boson event selection: two selected leptons

W & Z Data Samples
● Integrated Luminosity (collected between February 2002 – August 2007):
– Electron and muon channels: L = 2.2 fb-1
– Identical running conditions for both channels, guarantees cross-calibration
● Event selection gives fairly clean samples
– Mis-identification backgrounds ~ 0.5%

Analysis Strategy

Strategy
Maximize the number of internal constraints and cross-checks
Driven by two goals:
1) Robustness: constrain the same parameters in as many different ways as possible
2) Precision: combine independent measurements after showing consistency

Outline of AnalysisEnergy scale measurements drive the W mass measurement
● Tracker Calibration
– alignment of the COT (~2400 cells) using cosmic rays
– COT momentum scale and tracker non-linearity constrained using J/ψ µµ and ϒ µµ mass fits
– Confirmed using Z µµ mass fit
● EM Calorimeter Calibration
– COT momentum scale transferred to EM calorimeter using a fit to the peak of the E/p spectrum, around E/p ~ 1
– Calorimeter energy scale confirmed using Z ee mass fit
● Tracker and EM Calorimeter resolutions
● Hadronic recoil modelling
– Characterized using pT-balance in Z ll events

Drift Chamber (COT) Alignment
COT endplategeometry

Internal Alignment of COT
● Use a clean sample of ~400k cosmic rays for cell-by-cell internal alignment
● Fit COT hits on both sides simultaneously to a single helix (A. Kotwal, H. Gerberich and C. Hays, NIM A506, 110 (2003))
– Time of incidence is a floated parameter in this 'dicosmic fit'

Residuals of COT cells after alignment
Final relative alignment of cells ~2 µm (initial alignment ~50 µm)
Res
idua
l (m
icro
ns)
Cell number (φ)
Cell number (φ)
Before alignment
CDFII preliminary
after alignment25
-25

Cross-check of COT alignment
● Cosmic ray alignment removes most deformation degrees of freedom, but “weakly constrained modes” remain
● Final cross-check and correction to beam-constrained track curvature based on difference of <E/p> for positrons vs electrons
● Smooth ad-hoc curvature corrections as a function of polar and azimuthal angle: statistical errors => ∆MW = 2 MeV
CDFII preliminary L = 2.2 fb-1

Signal Simulation and Fitting

Signal Simulation and Template Fitting● All signals simulated using a Custom Monte Carlo
– Generate finely-spaced templates as a function of the fit variable
– perform binned maximum-likelihood fits to the data
● Custom fast Monte Carlo makes smooth, high statistics templates
– And provides analysis control over key components of the simulation
● We will extract the W mass from six kinematic distributions: Transverse mass, charged lepton pT and missing ET using both electron and muon channels
MW = 80 GeV
MW = 81 GeVMonte Carlo template

Generator-level Signal Simulation
● Generator-level input for W & Z simulation provided by RESBOS (C. Balazs & C.-P. Yuan, PRD56, 5558 (1997) and references therein), which
– Calculates triple-differential production cross section, and pT-dependent double-differential decay angular distribution
– calculates boson pT spectrum reliably over the relevant pT range: includes tunable parameters in the non-perturbative regime at low pT
● Multiple radiative photons generated according to PHOTOS (P. Golonka and Z. Was, Eur. J. Phys. C 45, 97 (2006) and references therein)
RESBOS
PHOTOS
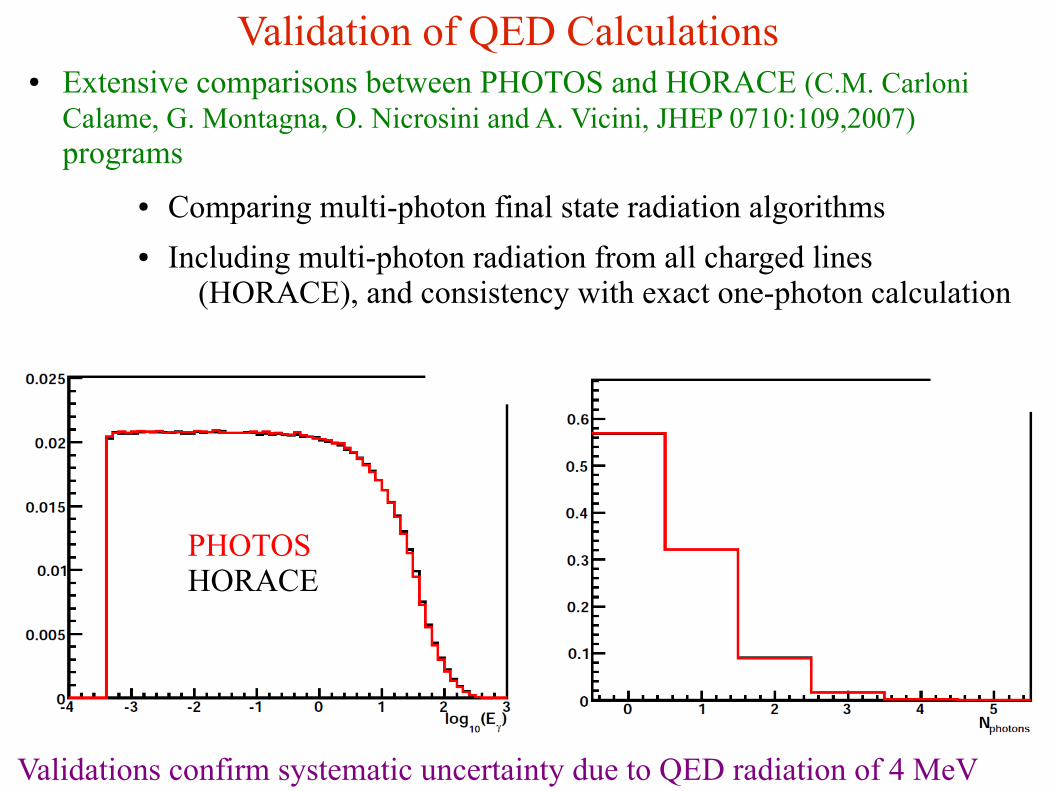
Validation of QED Calculations ● Extensive comparisons between PHOTOS and HORACE (C.M. Carloni
Calame, G. Montagna, O. Nicrosini and A. Vicini, JHEP 0710:109,2007) programs
● Comparing multi-photon final state radiation algorithms● Including multi-photon radiation from all charged lines
(HORACE), and consistency with exact one-photon calculation
Validations confirm systematic uncertainty due to QED radiation of 4 MeV
PHOTOSHORACE

Uncertainties in QED Calculations
● Extensive studies performed on uncertainties arising from
● leading logarithm approximation● Multi-photon calculation ● higher order soft and virtual corrections● Electron-positron pair creation (included at LO) ● QED/QCD interference● dependence on electroweak parameters/scheme
● Total systematic uncertainty due to QED radiation of 4 MeV on W mass

Constraining Boson pT Spectrum
● Fit the non-perturbative parameter g2 and QCD coupling αS in
RESBOS to pT(ll) spectra: ∆MW = 5 MeV
Position of peak in boson pT spectrum depends on g2
DataSimulationDataSimulation
DataSimulationDataSimulation
Tail to peak ratio depends on αS

Outline of AnalysisEnergy scale measurements drive the W mass measurement
● Tracker Calibration
– alignment of the COT (~2400 cells) using cosmic rays
– COT momentum scale and tracker non-linearity constrained using J/ψ µµ and ϒ µµ mass fits
– Confirmed using Z µµ mass fit
● EM Calorimeter Calibration
– COT momentum scale transferred to EM calorimeter using a fit to the peak of the E/p spectrum, around E/p ~ 1
– Calorimeter energy scale confirmed using Z ee mass fit
● Tracker and EM Calorimeter resolutions
● Hadronic recoil modelling
– Characterized using pT-balance in Z ll events

Custom Monte Carlo Detector Simulation● A complete detector simulation of all quantities measured in the data
● First-principles simulation of tracking
– Tracks and photons propagated through a high-resolution 3-D lookup table of material properties for silicon detector and COT
– At each material interaction, calculate
● Ionization energy loss according to detailed formulae and Landau distribution
● Generate bremsstrahlung photons down to 0.4 MeV, using detailed cross section and spectrum calculations
● Simulate photon conversion and compton scattering
● Propagate bremsstrahlung photons and conversion electrons
● Simulate multiple Coulomb scattering, including non-Gaussian tail
– Deposit and smear hits on COT wires, perform full helix fit including optional beam-constraint

Custom Monte Carlo Detector Simulation● A complete detector simulation of all quantities measured in the data
● First-principles simulation of tracking
– Tracks and photons propagated through a high-resolution 3-D lookup table of material properties for silicon detector and COT
– At each material interaction, calculate
● Ionization energy loss according to complete Bethe-Bloch formula
● Generate bremsstrahlung photons down to 4 MeV, using detailed cross section and spectrum calculations
● Simulate photon conversion and compton scattering
● Propagate bremsstrahlung photons and conversion electrons
● Simulate multiple Coulomb scattering, including non-Gaussian tail
– Deposit and smear hits on COT wires, perform full helix fit including optional beam-constraint
e-
e-
e+Calor
imeter
e-
γ

3-D Material Map in Simulation● Built from detailed construction-level knowledge of inner tracker: silicon
ladders, bulkheads, port-cards etc.
● Tuned based on studies of inclusive photon conversions
● Radiation lengths vs (φ,z) at different radii shows localized nature of material distribution
Z (cm)
φ
● Include dependence on type of material via Landau-Pomeranchuk-Migdal suppression of soft bremsstrahlung

Tracking Momentum Scale

Tracking Momentum Scale
Set using J/ψ µµ and ϒ µµ resonance and Z µµ masses
– Extracted by fitting J/ψ mass in bins of 1/pT(µ), and
extrapolating momentum scale to zero curvature
– J/ψ µµ mass independent of pT(µ) after 4% tuning of energy loss
<1/pT(µ)> (GeV-1)
∆p/p
Default energy loss * 1.04J/ψ µµ mass fit (bin 5)
DataSimulation

Tracking Momentum Scale
ϒ µµ resonance provides
– Momentum scale measurement at higher pT
– Validation of beam-constaining procedure (upsilons are promptly produced)– Cross-check of non-beam-constrained (NBC) and beam-constrained
(BC) fits
NBC ϒ µµ mass fit
DataSimulation

Tracking Momentum Scale Systematics
Systematic uncertainties on momentum scale
Uncertainty dominated by QED radiative corrections and magnetic fieldnon-uniformity
∆MW,Z = 6 MeV

Tracking Momentum Scale
DataSimulation
BC ϒ µµ mass fit
ϒ µµ resonance provides
– Cross-check of non-beam-constrained (NBC) and beam-constrained (BC) fits
– Difference used to set additional systematic uncertainty

Z µµ Mass Cross-check & Combination● Using the J/ψ and ϒ momentum scale, performed “blinded” measurement of
Z mass
– Z mass consistent with PDG value (91188 MeV) (0.7σ statistical)
– MZ = 91180 ± 12
stat ± 9
momentum ± 5
QED ± 2
alignment MeV
M(µµ) (GeV)
DataSimulation

Tracker Linearity Cross-check & Combination
● Final calibration using the J/ψ, ϒ and Z bosons for calibration
● Combined momentum scale correction:
Δp/p = ( -1.29 ± 0.07independent ± 0.05QED ± 0.02align ) x 10 -3
∆MW = 7 MeV

EM Calorimeter Response

Calorimeter Simulation for Electrons and Photons● Distributions of lost energy calculated using detailed GEANT4 simulation
of calorimeter
– Leakage into hadronic
calorimeter
– Absorption in the coil
– Dependence on incident angle
and ET
● Energy-dependent gain (non-linearity) parameterized and fit from data
● Energy resolution parameterized as fixed sampling term and tunable constant term
– Constant terms are fit from the width of E/p peak and Z ee mass peak

EM Calorimeter Scale
● E/p peak from W eυ decays provides measurements of EM calorimeter scale and its (ET-dependent) non-linearity
∆SE = (9stat ± 5non-linearity ± 5X0 ± 9Tracker) x 10
-5
Setting SE to 1 using E/p calibration from combined W eυ and Z ee samples
DataSimulation
Tail of E/p spectrumused for tuning model ofradiative material
ECAL / ptrack
∆MW = 13 MeV
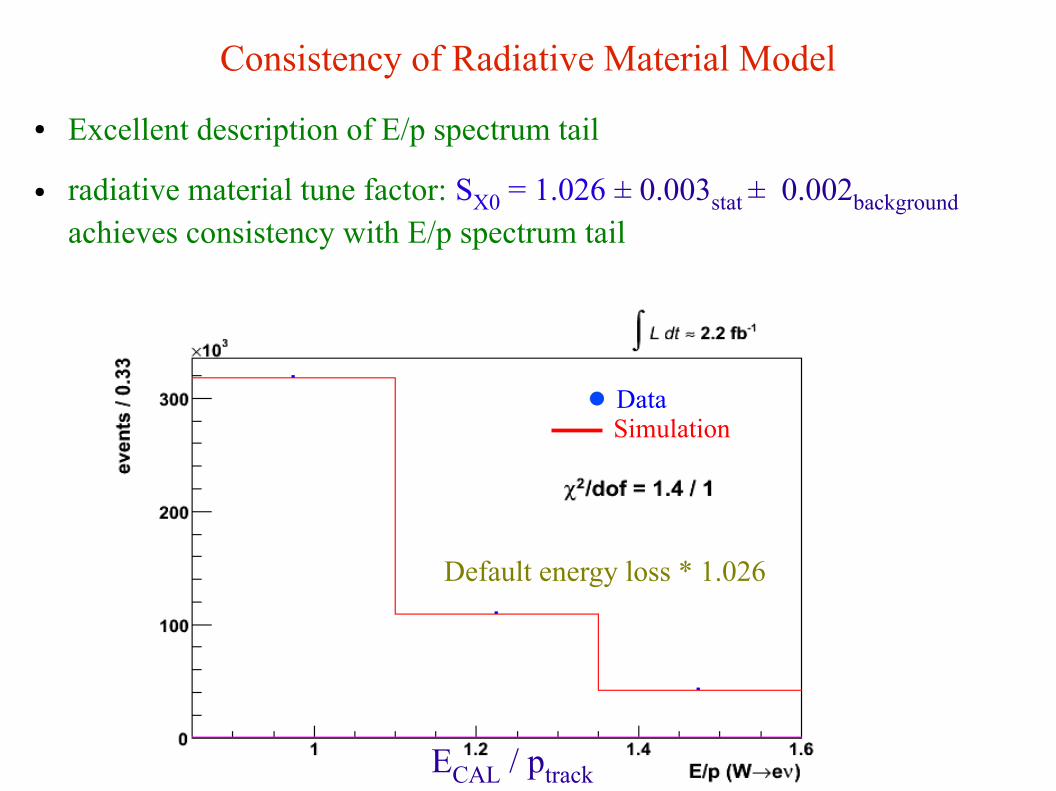
Consistency of Radiative Material Model
● Excellent description of E/p spectrum tail
● radiative material tune factor: SX0 = 1.026 ± 0.003stat ± 0.002background
achieves consistency with E/p spectrum tail
DataSimulation
ECAL / ptrack
Default energy loss * 1.026

Measurement of EM Calorimeter Non-linearity
● Perform E/p fit-based calibration in bins of electron ET
● GEANT-motivated parameterization of non-linear response: SE = 1 + β log(ET / 39 GeV)
● Tune on W and Z data: β = (5.2±0.7stat) x 10-3
=> ∆MW = 4 MeV
Z data
W data

EM Calorimeter Uniformity
● Checking uniformity of energy scale in bins of electron pseudo-rapidity
W data

Z ee Mass Cross-check and Combination● Performed “blind” measurement of Z mass using E/p-based calibration
– Consistent with PDG value (91188 MeV) within 1.4σ (statistical)
– MZ = 91230 ± 30
stat ± 10
calorimeter ± 8
momentum ± 5
QED ± 2
alignment MeV
● Combine E/p-based calibration with Z ee mass for maximum precision
– SE = 1.00001 ± 0.00037
DataSimulation
M(ee) ( GeV)
DataSimulation
∆MW = 10 MeV

Lepton Resolutions
● Tracking resolution parameterized in the custom simulation by
– Radius-dependent drift chamber hit resolution σh ∼ (150 ± 1stat) µm
– Beamspot size σb= (35 ± 1stat) µm
– Tuned on the widths of the Z µµ (beam-constrained) and ϒ µµ (both beam constrained and non-beam constrained) mass peaks
–. => ∆MW = 1 MeV (muons)
● Electron cluster resolution parameterized in the custom simulation by
– 12.6% / √ET (sampling term)
– Primary constant term κ = (0.68 ± 0.05stat) %
– Secondary photon resolution κγ = (7.4 ± 1.8stat) %
– Tuned on the widths of the E/p peak and the Z ee peak (selecting radiative electrons) => ∆MW = 4 MeV (electrons)

Hadronic Recoil Model

● We remove the calorimeter towers containing lepton energy from the hadronic recoil calculation– Lost underlying event energy is measured in
φ-rotated windows
Electron channel W data Muon channel W data
∆MW = 2 MeV
.φ
.η .η
Lepton Tower Removal
φ

Constraining the Hadronic Recoil Model
Exploit similarity in productionand decay of W and Z bosons
Detector response model forhadronic recoil tuned usingpT-balance in Z ll events
Transverse momentum of Hadronic recoil (u) calculated as 2-vector-sum over calorimeter towers

Hadronic Recoil SimulationRecoil momentum 2-vector u has ● a soft 'spectator interaction' component, randomly oriented
– Modelled using minimum-bias data with tunable magnitude
● A hard 'jet' component, directed opposite the boson pT
– PT-dependent response and resolution parameterizations
– Hadronic response R = ureconstructed / utrue parameterized as a logarithmically increasing function of boson pT motivated by Z boson data
DataSimulation

Tuning Recoil Response Model with Z events
Project the vector sum of pT(ll) and u on a set of orthogonal axes definedby boson p
T
Mean and rms of projections as a function of pT(ll) provideinformation on hadronic model parameters
mea
n of
pT-b
alan
ce (
GeV
)
µµ
pΤ
Ζ
u
∆MW = 4 MeV
DataSimulation
Hadronic model parameterstuned by minimizing χ2
between data and simulation

Tuning Recoil Resolution Model with Z events
At low pT(Z), pT-balance constrains hadronic resolution due tounderlying event
At high pT(Z), pT-balance constrains jet resolution
Res
olut
ion
of p
T-b
alan
ce (
GeV
)
∆MW = 4 MeV
µµ
pΤ
Ζ
u
DataSimulation

Testing Hadronic Recoil Model with W events
u (recoil)
Recoil projection (GeV) on lepton direction
Compare recoil distributions between simulation and data
Recoil projection (GeV) perpendicular to lepton
l
DataSimulation
DataSimulation

Recoil model validation plots confirm the consistency of the model
u (recoil)
Testing Hadronic Recoil Model with W events
DataSimulation
l
pT(W), electron channel
DataSimulation
DataSimulation
pT(W), muon channel
Parton Distribution Functions
● Affect W kinematic lineshapes through acceptance cuts
● We use CTEQ6 as the default PDF
● Use ensemble of 'uncertainty' PDFs
– Represent variations of eigenvectors in the PDF parameter space
– compute δMW contribution from each error PDF
● Using MSTW2008 PDF ensemble defined for 68% CL, obtain systematic uncertainty of 10 MeV
● Comparing CTEQ and MSTW at 90% CL, yield similar uncertainty (CTEQ is 10% larger)
– Cross-check: default MSTW2008 relative to default CTEQ6 yields 6 MeV shift in W mass

Backgrounds in the W sample
Backgrounds are small (except Z µµ with a forward muon)

W Mass Fits

Blind Analysis Technique
● All W and Z mass fit results were blinded with a random [-75,75] MeV offset hidden in the likelihood fitter
● Blinding offset removed after the analysis was declared frozen
● Technique allows to study all aspects of data while keeping Z mass and W mass result unknown within 75 MeV

W Transverse Mass Fit
Muons DataSimulation

W Mass Fit using Lepton pT
Electrons DataSimulation

Summary of W Mass Fits

Combined Results
● Combined electrons (3 fits): MW = 80406 ± 25 MeV, P(χ2) = 49%
● Combined muons (3 fits): MW = 80374 ± 22 MeV, P(χ2) = 12%
● All combined (6 fits): MW = 80387 ± 19 MeV, P(χ2) = 25%

Previous CDF Result (200 pb-1)Transverse Mass Fit Uncertainties (MeV)
electrons commonW statistics 48 54 0Lepton energy scale 30 17 17Lepton resolution 9 3 -3Recoil energy scale 9 9 9Recoil energy resolution 7 7 7Selection bias 3 1 0Lepton removal 8 5 5Backgrounds 8 9 0pT(W) model 3 3 3Parton dist. Functions 11 11 11QED rad. Corrections 11 12 11Total systematic 39 27 26Total 62 60
muons
Systematic uncertainties shown in green: statistics-limited by control data samples

New CDF Result (2.2 fb-1)Transverse Mass Fit Uncertainties (MeV)
electrons commonW statistics 19 16 0Lepton energy scale 10 7 5Lepton resolution 4 1 0Recoil energy scale 5 5 5Recoil energy resolution 7 7 7Selection bias 0 0 0Lepton removal 3 2 2Backgrounds 4 3 0pT(W) model 3 3 3Parton dist. Functions 10 10 10QED rad. Corrections 4 4 4Total systematic 18 16 15Total 26 23
muons
Systematic uncertainties shown in green: statistics-limited by control data samples

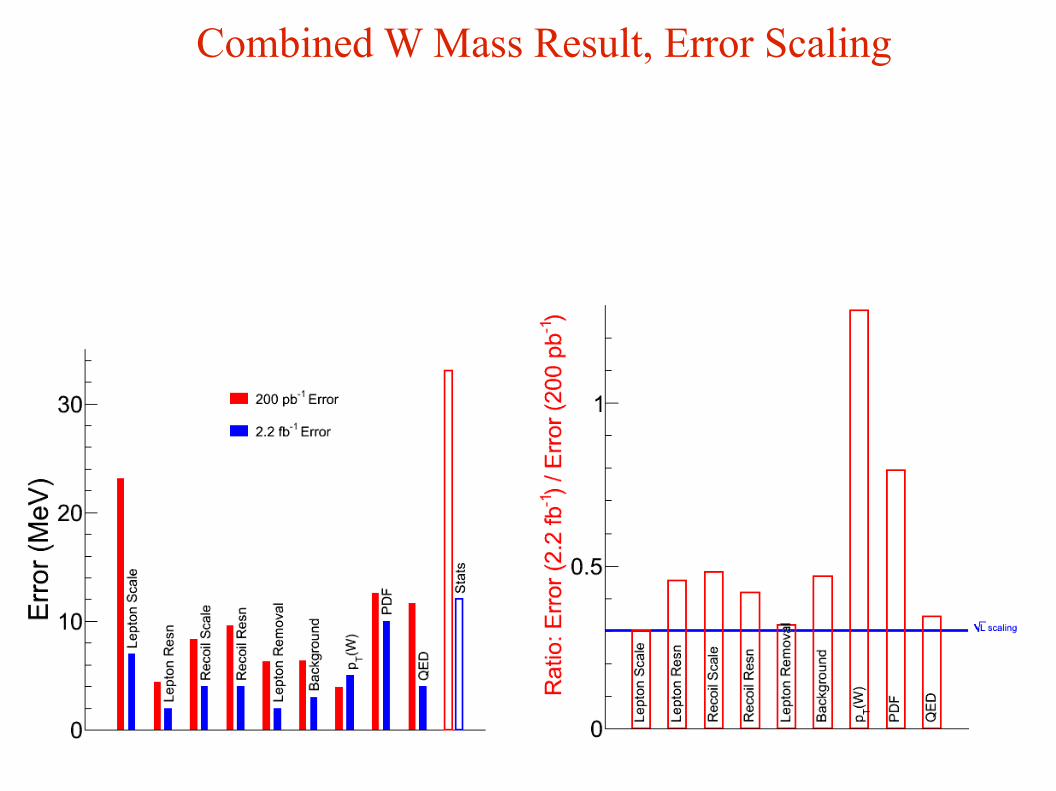
Combined W Mass Result, Error Scaling

2012 Status of MW vs Mtop

W Boson Mass Measurements from Different Experiments
Previous world average= 80399 ± 23 MeV
new CDF result more precise than other measurements
World average computed by TeVEWWGArXiv: 1204.0042
(PRL 108, 151803)
5 fb-1
2.2 fb-1
(PRL 108, 151804)

Improvement of MW Uncertainty with Sample Statistics
Non-scaling floor (11 MeV) dominated by PDF uncertainty (10 MeV)
Run2 (e)

Future MW
Measurements at Tevatron and LHC● Factor of 2-5 bigger samples of W and Z bosons available
● Huge samples at LHC
● For most of the sources of systematic uncertainties, we have demonstrated that we can find ways to constrain them with data and scale systematic uncertainties with data statistics
● Exception is the PDF uncertainty, where we have not made a dedicated effort to constrain the PDFs within the analysis
● We need to address specific PDF degrees of freedom to answer the question:
– Can we approach total uncertainty on MW
~ 10 MeV at the
Tevatron? 5 MeV at the LHC? ● (A.V. Kotwal and J. Stark, Ann. Rev. Nucl. Part. Sci., vol. 58, Nov 2008)

PDF Uncertainties – scope for improvement
● Newer PDF sets, e.g. CT10W include more recent data, such as Tevatron W charge asymmetry data
● Dominant sources of W mass uncertainty are the dvalence
and d-u degrees
of freedom
– Understand consistency of data constraining these d.o.f.
– PDF fitters increase tolerance to accommodate inconsistent datasets
● Fermilab/Seaquest, Tevatron and LHC measurements that can further constrain PDFs:
– Drell-Yan, Z boson rapidity distribution
– W → lν lepton rapidity distribution
– W boson charge asymmetry

Improvement of MW Uncertainty with W Asymmetry data
ATLAS and CMS measurements of W charge asymmetry (~35 pb-1) with 7% uncertainty => pseudo-data with 1% uncertainty
G. Bozzi et al,

Summary● The W boson mass is a very interesting parameter to measure with
increasing precision
● New Tevatron W mass results are very precise:
– MW = 80387 ± 19 MeV (CDF) = 80375 ± 23 MeV (D0) = 80385 ± 15 MeV (world average)
● New global electroweak fit MH = 94+29
-24 GeV @ 68% CL (LEPEWWG)
– SM Higgs prediction is pinned in the low-mass range
– Consistent with mass of Higgs-like boson ~ 125 GeV
● Looking forward to ∆MW < 10 MeV from full Tevatron dataset goal of ∆MW ~ 5 MeV from LHC data

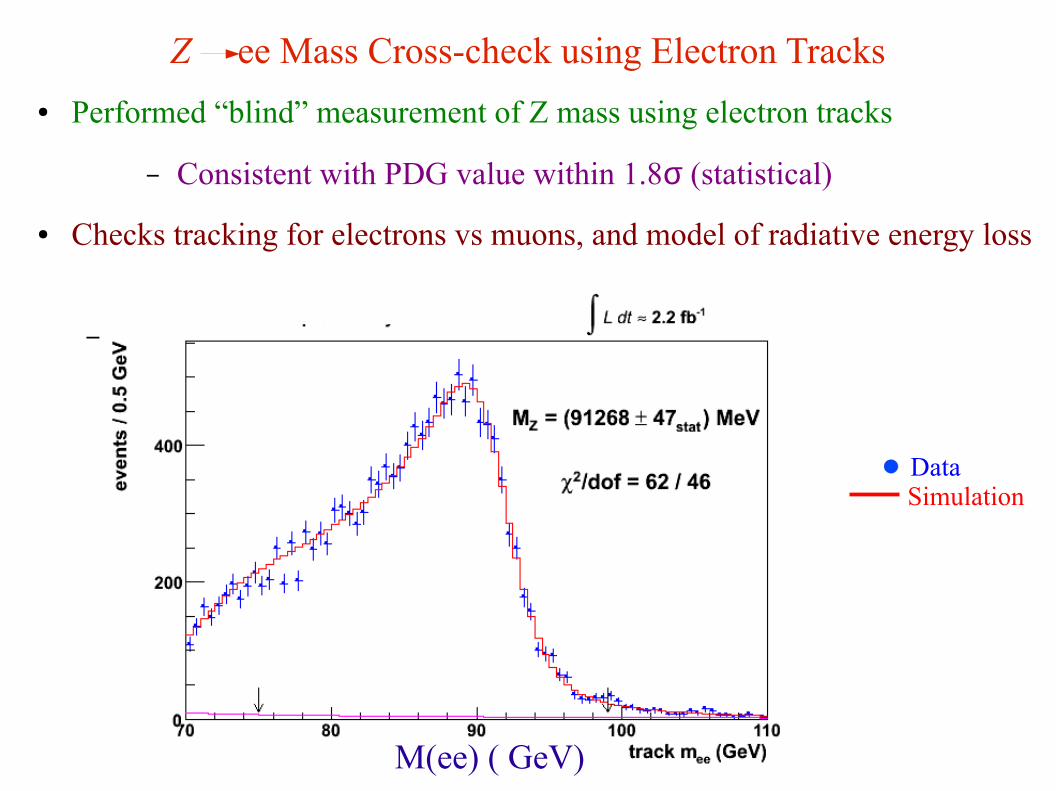
Z ee Mass Cross-check using Electron Tracks
● Performed “blind” measurement of Z mass using electron tracks
– Consistent with PDG value within 1.8σ (statistical)
● Checks tracking for electrons vs muons, and model of radiative energy loss
– SE = 1.00001 ± 0.00037
DataSimulation
M(ee) ( GeV)

W Transverse Mass Fit
Electrons
DataSimulation

W Lepton pT Fit
Muons
DataSimulation

W Missing ET Fit
Electrons
DataSimulation

W Missing ET Fit
Muons
DataSimulation

W Mass Fit Residuals, Muon Channel
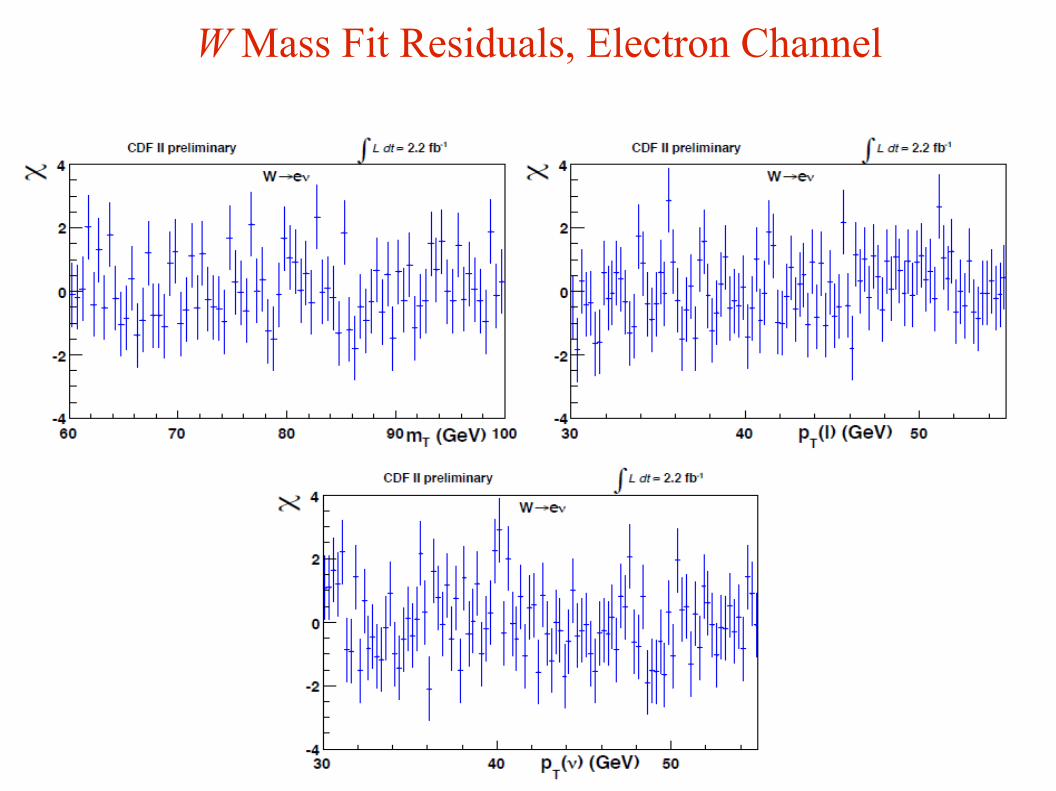
W Mass Fit Residuals, Electron Channel

W Mass Fit Window Variation, mT Fit

W Mass Fit Window Variation, pT(l) Fit

W Mass Fit Window Variation, pT(υ) Fit

W Mass Fit Results
Combined W Mass Result, Error Scaling

pT(ν) Fit Systematic Uncertainties

Combined Fit Systematic Uncertainties

pT(l) Fit Systematic Uncertainties

QCD Background Estimation in Muon Channel

Decay-in-Flight Background Estimation in Muon Channel
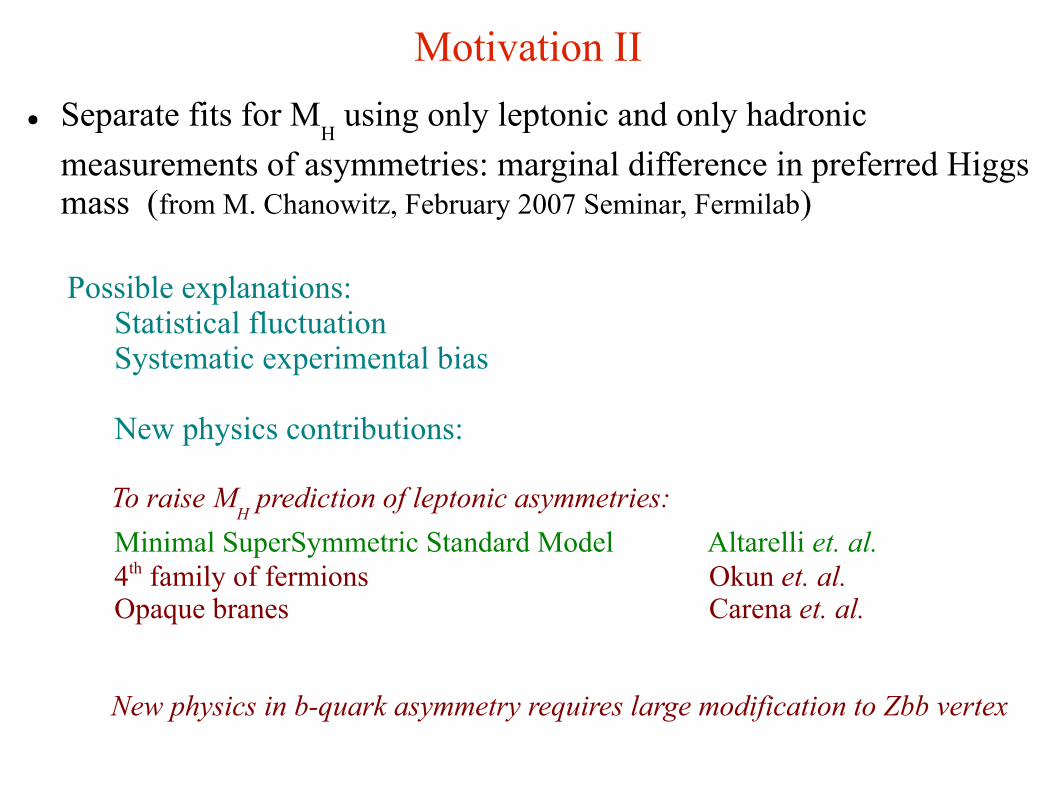
● Separate fits for MH using only leptonic and only hadronic
measurements of asymmetries: marginal difference in preferred Higgs mass (from M. Chanowitz, February 2007 Seminar, Fermilab)
Motivation II
Possible explanations:Statistical fluctuation
Systematic experimental bias
New physics contributions:
To raise MH prediction of leptonic asymmetries:
Minimal SuperSymmetric Standard Model Altarelli et. al.4th family of fermions Okun et. al.Opaque branes Carena et. al.
New physics in b-quark asymmetry requires large modification to Zbb vertex

Parameters of Electro-Weak Interactions

Radiative Corrections to W Boson Mass

Radiative Corrections to Electromagnetic Coupling
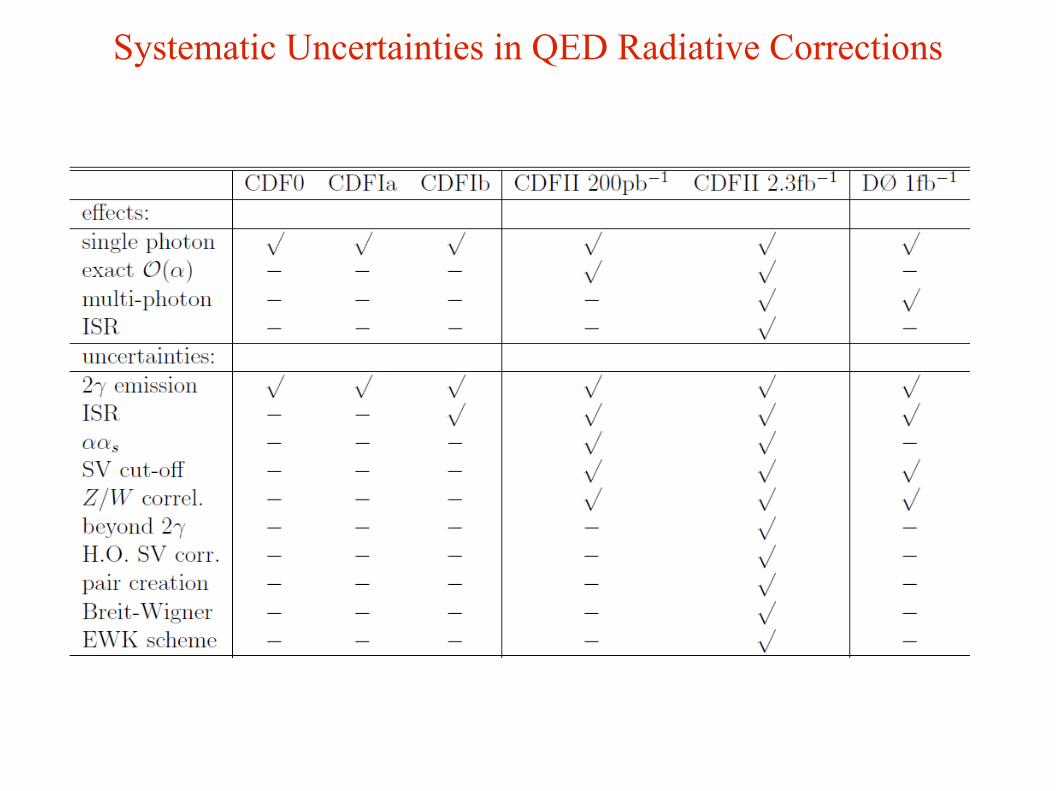
Systematic Uncertainties in QED Radiative Corrections

Consistency check of COT alignment procedure
● Fit separate helices to cosmic ray tracks on each side
● Compare track parameters (eg. Curvature, shown below) of the two tracks: a measure of track parameter bias
Z (cm)
∆ c
(cm
-1)
False curvature smaller than 0.1% for 40 GeV track, over the length of the COT
CDFII preliminary

Previous MW vs Mtop

Updated MW vs Mtop

MW vs Mtop