a predictive study of use impacts on the denali park road ted morris 1 john hourdos, ph.d. 1 prof....
Post on 21-Dec-2015
216 views
TRANSCRIPT

A Predictive Study of Use Impacts on the Denali Park
Road
Ted Morris1
John Hourdos, Ph.D.1
Prof. Max Donath, Ph.D.2
1 Minnesota Traffic Observatory, Dept of Civil Engineering, U of Minnesota
2 Intelligent Transportation Systems Institute, U of Minnesota

• General Management Plan authorized limit of 10,512 vehicle trips annually on park road in 1986. Restricted to mostly buses since 1972.
• Limit based on 1984 use levels allowing a 20% increase in buses and 45% decrease in private vehicles. Limit NOT based on research.
• Current pressure to increase access to Denali Park from various interest groups.
• NPS designed this study to determine carrying capacity of park road to be able to define and explore limits set on traffic.
Background

The Road
• ~90 miles, restricted gravel road
• Variable lane width, 2 at beginning, 1 and 1.5 further in
• Unparalleled wildlife viewing
• Only road access to interior park wilderness and campsites

Previous Studies
• Tracy 1977 – first traffic/wildlife study; observations from bus; noted negative reactions from some wildlife <100 m from road
• Singer and Beattie 1986 – study compared results to Tracy. Saw decrease in # of bears and caribou near road. Observations of disturbance to wildlife especially close to road and during periods of increased traffic (road lottery).
• Putera and Keay 1996 – focused on migration of Dall sheep across road. Sheep seem to be very sensitive to traffic during migration. Suggested numerous traffic behavior “rules” to decrease disturbance.

• Taylor et al. 1997 – used observations from 15 bus drivers over 4 years to develop monitoring protocol; # of moose and wolves showed a negative relationship with numbers of private vehicles.
• Yost 1998 – examined wildlife densities within “viewsheds”; moose perhaps avoided areas <200m of road.
• Burson et al. 2000 – compared their observations to those of all previous wildlife/traffic studies; moose declined by 50% but estimated overall population also declined; did not detect any significant impacts of increased road traffic in distribution or abundance of wildlife
Previous Studies…

Previous Studies: Limitations• Generally results of previous
studies suggestive of negative effects on visitor experience and wildlife but inconclusive:
– Habituation of animals observed
– Observation based studies
– Little known about wildlife use of areas away from road
– Limited ability to determine difference between general population declines and avoidance of road
– Lack consideration of logistical constraints of traffic on park road (scheduling constraints, driver and traffic behaviors, road travel time)

• Park Road Capacity Study (2006-2008)– Develop simulation model in order to determine whether road is
currently at, under, or over *capacity• The term capacity refers to social (and biological) capacity
• If model indicate road use is under capacity, conduct EIS to establish alternatives for increased road use (2007-2008)– Any increased traffic would be implemented over numerous years
and alternate time periods– Select a feasible set of alternative traffic management strategies
guided by simulation model results
• A Before-After-Control-Impact (BACI) study would be implemented to evaluate effects of EXPERIMENTAL traffic increase (2008-2010)– May include studies on traffic flow, animal movements, wildlife
sightings, dust, noise, visitor experience, bird densities
Study Design: potential for 3 phases

Study Design: three Interrelated Components
• Road Traffic Model: Predict traffic patterns based on driving behaviors and other logistics and road constraints
• Road Capacity Model: Identify indicators of a visitor’s quality of experience of road trip and related activities
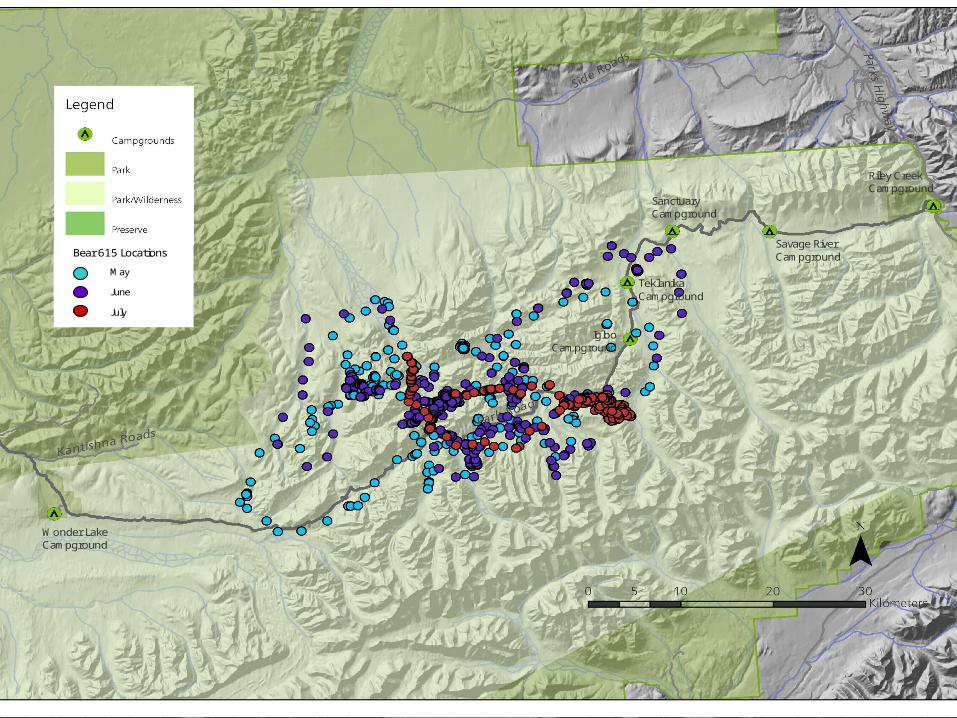
• Wildlife movement Model: Factor effects of daily traffic volumes on Bear and Dall Sheep species locations

Wildlife Movment • 20 grizzly bears captured and
fitted with GPS collars in Spring 2006 (one location point/hr)
• Collars retrieved on Sept 20 2006 to download data
• Spatial analysis performed this winter for movement model, factoring effects of recorded daily road traffic volumes
• Cooperators: Rick Mace, Montana Department of Fish, Wildlife and Parks
`
Wonder Lake Campground
Igloo Campground
Sanctuary Campground
TeklanikaCampground
Savage River CampgroundBear 615 Locations
May
June
July
Riley Creek Campground

Road Capacity Study: Visitors 2006
• 120 qualitative visitor surveys conducted this summer about visitor experience on the park road– “Can you describe the role that the
Denali Park Road plays in your visit to the park?”
– “How does the number of vehicles on the Denali Park Road affect your enjoyment of visiting the park?”
…..• Qualitative visitor surveys will be
analyzed for indicators of quality of experience which will then be used to create quantitative survey for 2007 season
• Cooperators: Robert Manning and Jeff Hallo, University of Vermont

Traffic Microsimulation Rationale
• Earlier studies have explored the reactions of wildlife to increased vehicle volumes- mainly directed to understanding the impact of rural highway traffic
• In the case of Denali, the traffic patterns are as unique as the park itself (Complex traffic ‘rules’ & logistics, terrain and road geometry)
• Facilitate quantitative + visual analysis of predicted queue formations (e.g., ‘bunching’), travel times, and following distances between buses and other vehicles along the road
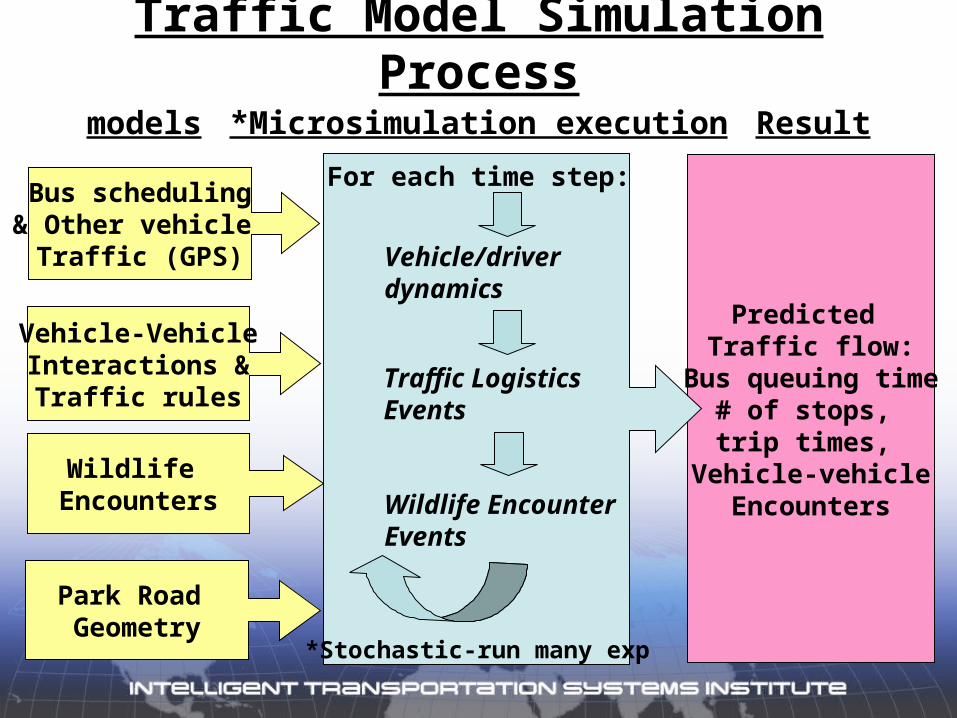
Traffic Model Simulation Process
*Microsimulation execution
Predicted Traffic flow:
Bus queuing time# of stops, trip times,
Vehicle-vehicleEncounters
Bus scheduling& Other vehicle
Traffic (GPS)
Wildlife Encounters
Park Road Geometry
Vehicle-VehicleInteractions &Traffic rules
For each time step:
Vehicle/driver dynamics
Traffic Logistics Events
Wildlife Encounter Events
models Result
*Stochastic-run many exp

Traffic Model Simulation Process
Predicted Traffic flow:
Bus queuing time# of stops, trip times,
Vehicle-vehicleEncounters
Monitor
Mitigate
Over-
Capacity
Prepare EIS, Select Alternative
At-Capacity
Under Capacity
Calculate VQE Indicators.Indicator model derivedfrom 2007 Social Surveys

Simulation Scenarios
Propose bus Schedules - minimize impact on wildlife
Propose changes in logistical rules.Example: increase/decrease amount of time to stop and view wildlife, rest stops
Microsimulation execution

Traffic Speed Characteristics (GPS)
Bus position and speed data between 6/19/06 and 6/25/06 for 3 miles of the 95 mile road. 85 buses and 33 NPS vehicles equipped in 2006, 150 buses in 2007.

Stopping Reasons/Wildlife Encounters
Species typeStopping reasons
Relative species loc.Passenger stop pick-up/drop-off
• Touch panel data loggers on buses allow drivers to categorize, timestamp, and geo-locate reasons for stopping. 13 buses equipped by tail end of 2006 season.

Logistics, Wildlife Encounter Rules
yes
For each time step
Advance position of each vehicle based on: Traffic rules Route paths and schedules Vehicle-vehicle interactions (right figs)
Wildlife encounter‘creates’ road incidentat location x, time t, duration t.
no
Time length of stop, Twe.
Vehicle Stops
Vehicle/Bus yield behavior
Bus arrives at x, within t, t+ t?
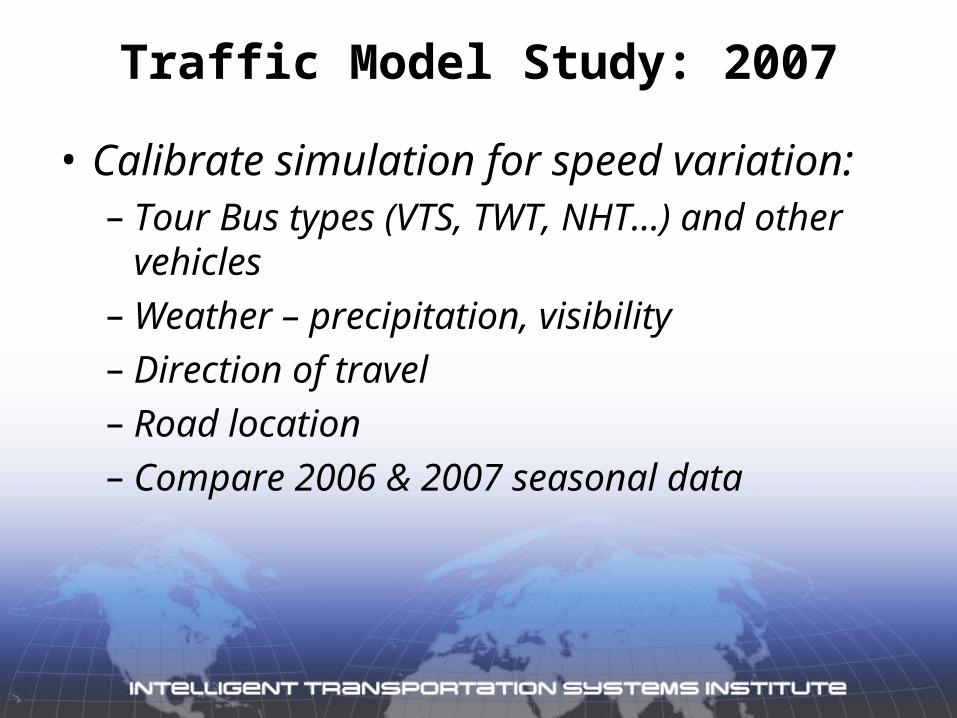
Traffic Model Study: 2007
• Calibrate simulation for speed variation:– Tour Bus types (VTS, TWT, NHT…) and other
vehicles– Weather – precipitation, visibility– Direction of travel– Road location– Compare 2006 & 2007 seasonal data

Traffic Model Study: 2007
• Wildlife encounter and other stop behaviors – Species type– Species distance from road– Effects from previous
encounters– Bus tour type– Other traffic logistics
(...?)ft?)(...fTwe

Traffic Model Limitations
• Possible dynamic ‘feedback’ mechanisms between wildlife movement and traffic characteristics not considered
• Limited data loggers (20 equipped for 2007) affect characterization of all stopping reasons and associated driver behaviors & wildlife encounters– Sampling frequency of events low (20/150 buses)– Driver acceptance/usage habits– Bus not in service
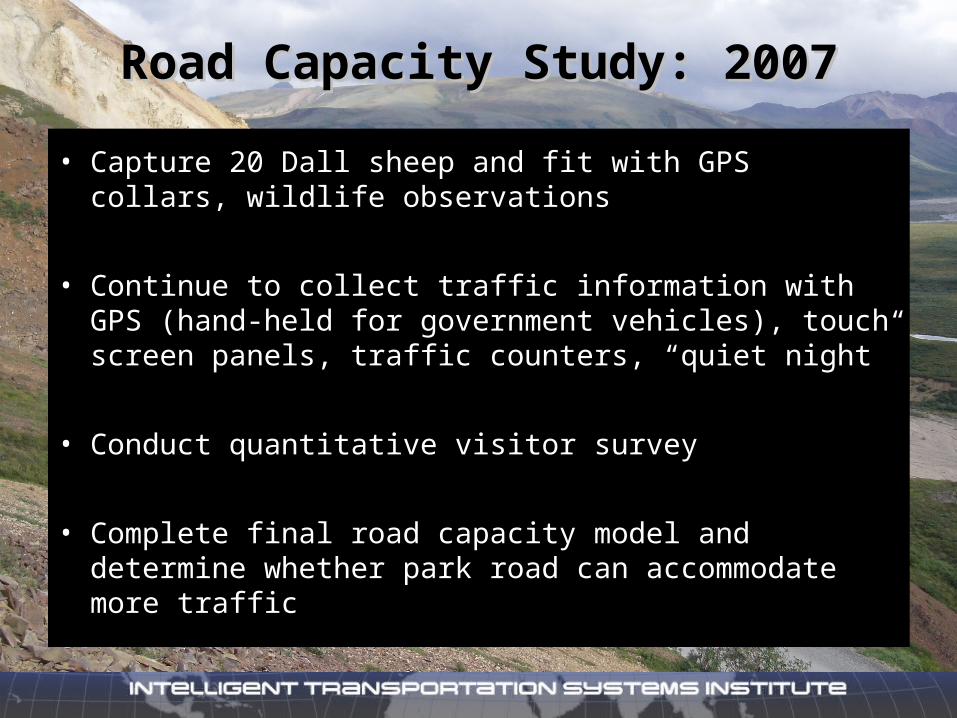
Road Capacity Study: 2007Road Capacity Study: 2007
• Capture 20 Dall sheep and fit with GPS collars, wildlife observations
• Continue to collect traffic information with GPS (hand-held for government vehicles), touch screen panels, traffic counters, “quiet night”
• Conduct quantitative visitor survey
• Complete final road capacity model and determine whether park road can accommodate more traffic
AcknowledgementsAcknowledgements• Project sponsor and data management: Phillip Hooge (Asst.
Superintendent, project lead ), Tom Meier, Pat Owen, Laura Phillips, Amanda Peacock, John Paynter Denali Park, National Park Service http://www.nps.gov/dena/parkmgmt/upload/RoadCapacityFactSheetFinal.pdf
• Road Capacity model development: Robert Manning, Jeffrey Hallo, Park Studies Laboratory, Rubenstein School of Environment And Natural Resources, University of Vermont http://www.uvm.edu/envnr/parkstudies
• Bear and sheep movement: Rick Mace, Montana Fish & Wildlifehttp://fwp.mt.gov/wildthings/tande/monitoring.html , e-mail: [email protected]
• Bus GIS/GPS instrumentation and systems integration: Brian Hewitt, Bill Ward, Matt Gerber, Dominic Canale, Doyon/Aramark http://www.reservedenali.com/
Questions?Questions?