a preliminary assessment of the status of the western atlantic bluefin tuna stock … ·...
TRANSCRIPT

SCRS/2014/153 Collect. Vol. Sci. Pap. ICCAT, 71(4): 1545-1603 (2015)
A PRELIMINARY ASSESSMENT OF THE STATUS OF THE WESTERN
ATLANTIC BLUEFIN TUNA STOCK (1970-2013)
Matthew Lauretta1, Ai Kimoto2, Clay E. Porch1 and Alex Hanke3
SUMMARY
This document presents an updated assessment of the western Atlantic stock of bluefin tuna using data through 2013. The analysis was conducted by the western evaluation team in accordance with the specifications of the bluefin tuna work plan and the Report of the 2014 ICCAT Bluefin Data Preparatory Meeting.
RÉSUMÉ
Le présent document contient une mise à jour de l'évaluation du stock de thon rouge de l’Atlantique Ouest au moyen des données allant jusqu'en 2013. L'analyse a été réalisée par l'équipe d'évaluation de l'Ouest en appliquant les spécifications du plan de travail du thon rouge et du rapport de la réunion ICCAT de préparation des données sur le thon rouge tenue en 2014.
RESUMEN
Este documento presenta una evaluación actualizada del stock de atún rojo del Atlántico oeste utilizando datos hasta 2013. El análisis lo llevó a cabo el equipo de evaluación del oeste de acuerdo con las especificaciones del plan de trabajo de atún rojo y del Informe de la reunión de preparación de datos de atún rojo de ICCAT de 2014.
KEYWORDS
Stock assessment, Atlantic bluefin tuna
1. Introduction The bluefin tuna working group agreed at the data preparatory meeting (held May 5-10, 2014, in Madrid) to establish two evaluation teams to conduct preliminary stock assessments of eastern and western Atlantic bluefin tuna in preparation for the 2014 species group meeting. The western team was charged with conducting a preliminary update of the 2012 assessment for the western Atlantic stock using data through 2013. The report of the 2014 ICCAT bluefin data preparatory meeting indicated that the data series and parameter specifications should be identical to those use for the 2012 VPA assessment of western Atlantic bluefin tuna except for some minor changes relating to the indices of abundance and corresponding partial catch-at-age (described in section 7 of that report). The specifications for the projections were also to be retained with the following exceptions:
• use the 2012 Parrack and Phares, September weight-length relationship, • use geometric mean selectivity from 2010-2012, • compute ‘low’ recruitment scenario with the two line relationship where the spawning biomass at the
hinge point is set equal to the lowest average of any 6 consecutive years in the series (probably during 1990-1995) and the asymptotic recruitment is the geometric mean from 1976-2010,
1 U.S. National Marine Fisheries Service, Southeast Fisheries Center, Sustainable Fisheries Division, 75 Virginia Beach Drive, Miami, FL, 33149-1099, USA. E-mail: [email protected] 2 Japan National Research Institute of Far Seas Fisheries, 5-6-2 A-44 Orido Shimizu Shizuoka, Japan. E-mail:[email protected] 3 Department of Fisheries and Oceans Canada. 531 Brandy Cove Rd, St. Andrews, New Brunswick, Canada, E5B 2L9. Email: [email protected].
1545
• compute the ‘high’ recruitment scenario with the Beverton and Holt curve fitted to recruitment estimates from 1971-2010 and corresponding spawning biomass estimates from 1970-2009.
The report of the 2014 ICCAT bluefin data preparatory meeting also recommended the following model sensitivity analyses:
• a sensitivity of the estimated selectivity of the plus group based on results from an integrated catch-at-size model to be evaluated by changing the F-ratio parameter of the plus group to age 15,
• alternative maturity schedules to match the estimated early maturity-at-age of the eastern stock as well as a sensitivity of late maturity-at-age of 15 and 16+ aged fish under the assumption that only the largest fish spawn in the Gulf of Mexico,
• an index jackknife sensitivity where each CPUE index is iteratively removed from the VPA to assess the effect on model estimates,
• alternative natural mortality vector, using the estimated mortality-at-age of the eastern stock opposed to constant natural mortality of 0.14,
• alternative partial catch-at-age of the U.S. Gulf of Mexico larval index fixed at the maturity schedule, and
• a retrospective analysis to evaluate the effects of removing recent years data. The western evaluation team completed all of the above analyses with the exception of the sensitivity run exploring possible alternative values of the F-ratio, which required inputs from an integrated catch-at-size model that had not yet been completed. The team was charged with producing an SCRS document detailing the methods and results with the same format as the detailed reports from previous assessments, therefore the remainder of this report adopts the structure and numbering conventions of the 2012 Detailed Report (SCI-033 / 2012). 2. Summary of available data for assessment A discussion of catch statistics, fishery trends and relative abundance indices is available in the Report of the 2014 ICCAT Bluefin Data Preparatory Meeting. For the most part the present document does not depart from the established work plan or the recommendations made at the data preparatory meeting. However, there was a significant departure from the work plan in regards to generating the catch at size and catch at age, which is detailed below. 2.1 Catch and other Fishery Statistics 2.1.1 Western Atlantic Catch-at-size (CAS) and catch-at-age (CAA) The CAS and CAA for the western Atlantic were generated by the secretariat using the methods described in documents SCRS/2010/119 (revised) and SCRS/2010/120. However, the evaluation team discovered an error in the 2011 CAS statistics submitted by the United States. While the correct statistics were submitted to the Secretariat shortly after the error was discovered, it was well after the May 31, 2014 deadline and there was insufficient time for the secretariat staff to reconstruct the CAS data base and recalculate the CAA. After consulting with the SCRS chair, Secretariat and working group chairs, it was decided that the best course of action was for the western evaluation team to reconstruct the CAS themselves and reproduce the corresponding catch-at-age estimates using the same code employed by the Secretariat (Ageit_BFT_ver4 R script). These analyses are documented in a separate paper. The output from the R-Script AgeIT was used to generate partial CAA corresponding to the indices of abundance used in the assessment following the restrictions on sizes and month specified in Table 2. The final CAA and partial CAA matrices are shown with the other inputs to the VPA in Appendix 1.
1546

3. Methods and other data relevant to the assessment 3.1 Methods – West 3.1.1 VPA applied to the West Atlantic Tuned virtual population analyses (VPA) were conducted using the VPA-2BOX software featured in the ICCAT Software Catalog. The parameter specifications used in the 2014 VPA assessments were identical to those used in the 2012 base-case assessment. The same data sets were used, although in a few cases the indices of abundance were computed somewhat differently than in 2012 (see the Data Preparatory Meeting Report in 2014). This section reviews the details of these specifications. The reader may refer to Table 1 for a summary of the parameter specifications for the various model runs and Table 2 for the specifications for the partial catch-at-ages related to indices of abundance. General specifications The oldest age class represents a plus group (ages 16 and older) and the fishing mortality rate on that age is specified as the product of the fishing mortality rate on the next younger age (F15) and an ‘F-ratio’ parameter that represents the ratio of F16 to F15. For the 2010, 2012 and the 2014 models, the F-ratio was pre-specified at 1.0 for the entire period as there is no reason to expect the selectivity to differ on fish age 15 and older (growth is relatively slow at this age and all animals are fully mature). The fishing mortality rates for each age in the last year of the VPA (except the oldest age) were estimated as free parameters, but subject to a constraint restricting the amount of change in the vulnerability pattern during the most recent three years with a standard deviation of 0.5 (see SCRS/2008/089 for more details). The indices of abundance were fitted assuming a lognormal error structure and equal weighting (i.e., the coefficient of variation was represented by a single estimated parameter for all years and indices). The catchability (scaling) coefficients for each index were assumed constant over the duration of that index and estimated by the corresponding concentrated likelihood formula. The natural mortality rate was assumed age-independent (=0.14 yr-1) as in previous assessments. The maturity vector used in prior assessments assumed ages 1-8 were immature and ages 9 and older were fully mature. Detailed specifications for the 2014 base case and alternative runs This section details all the model settings examined during the assessment. Note that Run 4 (below) is our proposed base case because it most closely repeated the specifications of the base model from the 2012 assessment while still accommodating all the modifications recommended during the 2014 ICCAT Bluefin Data Preparatory Meeting.
• Continuity run 0: This run most strictly adhered to the specifications of the 2012 base assessment with the updated data in 2014, including catch-at-age, partial catch-at-age, weight-at-age, and abundance indices. There were some minor changes relating to the indices of abundance: 1) U.S. RR indices were calculated using a negative binomial error distribution assumption instead of the delta-Poisson assumption (SCRS/2014/055), and 2) U.S. pelagic longline index in the Gulf of Mexico was adjusted the effect of a ‘weak hook’ introduced in 2011 (SCRS/2014/058). Note that this run used the ‘continuous’ version of the U.S. pelagic longline index, i.e., without ‘splitting’ the series in 1992 (see description of Run 3).
• Run 1: Like run 0, but replaced the partial catch at age for the Canadian Gulf of St. Lawrence and SW Nova Scotia indices with the spatially explicit filtering to more appropriately match data used in the standardization of the indices (see Table 2)
• Run 2: Like run 1, but Canadian Gulf of St. Lawrence and SW Nova Scotia indices were considered
indices for ages 8-16+ (13-16+ in prior assessments), and for ages 5-16+ (8-14 in prior assessments), respectively based on otolith aging results presented during the Data Workshop.
• Run 3: Like run 2, but ‘split’ U.S. pelagic longline index into two periods 1987-1991 and 1992-2013. The
Data Preparatory working group recommended that this index be split owing to important management regulations that occurred in 1991. After a review of available catch-at-size information, it was determined that complete size data were not available for the Gulf of Mexico for the years prior to 1992 and therefore
1547

that accurate partial-catch-at-ages could not be created for those years. Therefore this run fixed the selectivity of the early part of the index, 1987-1991 at the estimated selectivity for the USA GOM PLL from Run 2 (see also Run 4).
Run 4: Like run 2, but did not use the early period (1987-1991) from the newly developed ‘split’ U.S.
pelagic longline index. This run represented the proposed base model. • Runs 5-16 Jack-knife sensitivity analyses. The influence of the various indices of abundance on the
proposed base case model results were examined by removing one index at a time, running the VPA with the same model specifications, and comparing various reference statistics.
• Runs 17: A Retrospective analysis was conducted for the proposed base case model (run 4) by
sequentially removing inputs of catch and abundance indices in annual increments, back to 2008.
• Run 18: Sensitivity analysis on Canadian Gulf of St. Laurence index. The influence of the 2010 data point for the Gulf of St. Lawrence on the proposed base case model results was examined by including it.
• Run 19: Sensitivity analysis on natural mortality. The influence of the natural mortality on the proposed
base case model results was examined by assuming the estimated mortality-at-age of the eastern stock as opposed to constant natural mortality of 0.14.
• Runs 20-21: Sensitivity analyses on maturity schedule. The influence of two maturity schedules on the
proposed base case model results was examined by assuming a) the estimated early maturity-at-age of the eastern stock as well as b) a late maturity-at-age of fish 9 to 16 (0% at age 8, increasing logistically to 100% at age 16 as described in SCRS/2010/018).
• Run 22: Sensitivity analysis on the larval index. The influence of alternative partial catch-at-age of the
U.S. Gulf of Mexico larval index on the proposed base case model results was examined by fixing the selectivities to match the maturity schedule in the base case model.
4. Stock status results 4.1 Stock status – West This Section summarizes the results from the VPA analyses explained in Section 5.2. The inputs and output files of the VPA-2BOX software for the proposed base VPA model (Run 4) are included as Appendix 1. The output reports contain a complete description of the VPA results, including the matrix of estimated fishing mortality rates, abundance-at-age, stock biomass, recruitment, fits to indices, estimated index selectivities, F-ratios and F-at-age in the terminal year 4.1.1 Diagnostics Fits to the indices of abundance for the 2014 proposed base model (Run 4) are shown in Figure 1 and compared to those of the 2012 base model in Figure 2. The fits to the relative abundance indices were similar between the 2012 base and 2014 base models, with a noticeable increase in model estimates for the Canadian Southwest Nova Scotia, U.S. rod and reel >177cm, and U.S. Gulf of Mexico longline indices (Figure 2). The fits to indices from the jack-knife sensitivity analyses (where individual relative abundance indices were excluded one at a time) were similar to those of the proposed base model (Figure 3), even when the most influential indices (Canadian GSL or US RR > 177 cm) were removed. Fits to the indices for large fish (Canadian Gulf of St. Lawrence, Canadian Southwest Nova Scotia, U.S. rod and reel >177 cm, Japan longline Area 2, and U.S. Gulf of Mexico longline) generally showed an increase in recent years. This increasing trend was even more apparent when the US RR > 177 cm was dropped as that index is the only one that suggested a decline in the abundance of older fish over the last decade (with only a slight increase in recent years). The increasing trend in the fits to the indices for large fish was less noticeable when the Canada Gulf of St. Lawrence index was dropped. The model fits were similar to the fits of the proposed base model for most of the other sensitivity runs and are therefore not shown.
1548
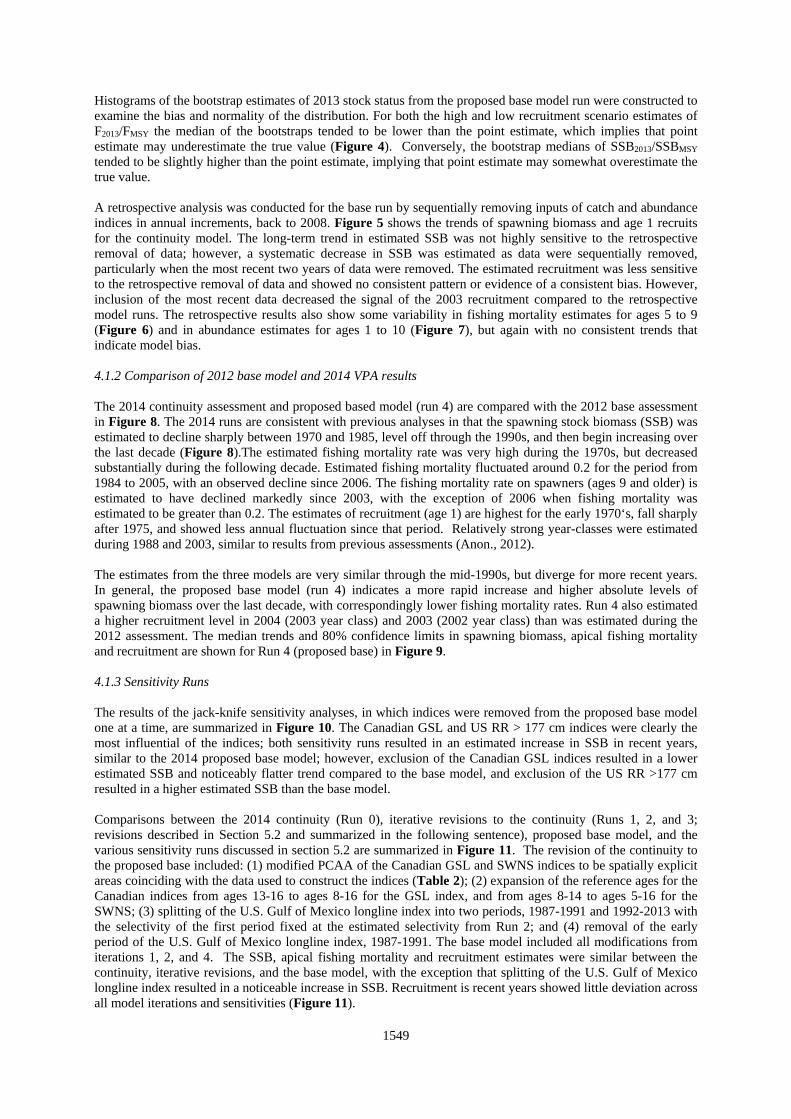
Histograms of the bootstrap estimates of 2013 stock status from the proposed base model run were constructed to examine the bias and normality of the distribution. For both the high and low recruitment scenario estimates of F2013/FMSY the median of the bootstraps tended to be lower than the point estimate, which implies that point estimate may underestimate the true value (Figure 4). Conversely, the bootstrap medians of SSB2013/SSBMSY tended to be slightly higher than the point estimate, implying that point estimate may somewhat overestimate the true value. A retrospective analysis was conducted for the base run by sequentially removing inputs of catch and abundance indices in annual increments, back to 2008. Figure 5 shows the trends of spawning biomass and age 1 recruits for the continuity model. The long-term trend in estimated SSB was not highly sensitive to the retrospective removal of data; however, a systematic decrease in SSB was estimated as data were sequentially removed, particularly when the most recent two years of data were removed. The estimated recruitment was less sensitive to the retrospective removal of data and showed no consistent pattern or evidence of a consistent bias. However, inclusion of the most recent data decreased the signal of the 2003 recruitment compared to the retrospective model runs. The retrospective results also show some variability in fishing mortality estimates for ages 5 to 9 (Figure 6) and in abundance estimates for ages 1 to 10 (Figure 7), but again with no consistent trends that indicate model bias. 4.1.2 Comparison of 2012 base model and 2014 VPA results The 2014 continuity assessment and proposed based model (run 4) are compared with the 2012 base assessment in Figure 8. The 2014 runs are consistent with previous analyses in that the spawning stock biomass (SSB) was estimated to decline sharply between 1970 and 1985, level off through the 1990s, and then begin increasing over the last decade (Figure 8).The estimated fishing mortality rate was very high during the 1970s, but decreased substantially during the following decade. Estimated fishing mortality fluctuated around 0.2 for the period from 1984 to 2005, with an observed decline since 2006. The fishing mortality rate on spawners (ages 9 and older) is estimated to have declined markedly since 2003, with the exception of 2006 when fishing mortality was estimated to be greater than 0.2. The estimates of recruitment (age 1) are highest for the early 1970‘s, fall sharply after 1975, and showed less annual fluctuation since that period. Relatively strong year-classes were estimated during 1988 and 2003, similar to results from previous assessments (Anon., 2012). The estimates from the three models are very similar through the mid-1990s, but diverge for more recent years. In general, the proposed base model (run 4) indicates a more rapid increase and higher absolute levels of spawning biomass over the last decade, with correspondingly lower fishing mortality rates. Run 4 also estimated a higher recruitment level in 2004 (2003 year class) and 2003 (2002 year class) than was estimated during the 2012 assessment. The median trends and 80% confidence limits in spawning biomass, apical fishing mortality and recruitment are shown for Run 4 (proposed base) in Figure 9. 4.1.3 Sensitivity Runs The results of the jack-knife sensitivity analyses, in which indices were removed from the proposed base model one at a time, are summarized in Figure 10. The Canadian GSL and US RR > 177 cm indices were clearly the most influential of the indices; both sensitivity runs resulted in an estimated increase in SSB in recent years, similar to the 2014 proposed base model; however, exclusion of the Canadian GSL indices resulted in a lower estimated SSB and noticeably flatter trend compared to the base model, and exclusion of the US RR >177 cm resulted in a higher estimated SSB than the base model. Comparisons between the 2014 continuity (Run 0), iterative revisions to the continuity (Runs 1, 2, and 3; revisions described in Section 5.2 and summarized in the following sentence), proposed base model, and the various sensitivity runs discussed in section 5.2 are summarized in Figure 11. The revision of the continuity to the proposed base included: (1) modified PCAA of the Canadian GSL and SWNS indices to be spatially explicit areas coinciding with the data used to construct the indices (Table 2); (2) expansion of the reference ages for the Canadian indices from ages 13-16 to ages 8-16 for the GSL index, and from ages 8-14 to ages 5-16 for the SWNS; (3) splitting of the U.S. Gulf of Mexico longline index into two periods, 1987-1991 and 1992-2013 with the selectivity of the first period fixed at the estimated selectivity from Run 2; and (4) removal of the early period of the U.S. Gulf of Mexico longline index, 1987-1991. The base model included all modifications from iterations 1, 2, and 4. The SSB, apical fishing mortality and recruitment estimates were similar between the continuity, iterative revisions, and the base model, with the exception that splitting of the U.S. Gulf of Mexico longline index resulted in a noticeable increase in SSB. Recruitment is recent years showed little deviation across all model iterations and sensitivities (Figure 11).
1549

Results from the maturity sensitivity analyses indicated that the estimated SSB was sensitive to the assumption of maturity. The assumption of early maturity (i.e. eastern Atlantic ogive with 50% maturity at age 4) resulted in greater estimated SSB over the entire time series and the assumption of late maturation (i.e. approximately logistic increase in maturity from 0% mature at ages 8 to 100% mature at age 16) resulted in decreased estimates of SSB compared to the base model (fully mature at age 9). The overall estimated long-term trend in SSB was not sensitive to the maturity schedule and the estimates of apical fishing mortality and recruitment were nearly identical across model runs (Figure 11). 4.1.4 Stock status A key factor in determining stock status is the estimation of the MSY-related benchmarks against which the current condition of the stock is measured. These benchmarks depend to a large extent on the relationship between spawning biomass and recruitment. Two alternative spawner-recruit hypotheses were explored consistent with several prior assessments: the two-line (low recruitment potential hypothesis) and the Beverton and Holt spawner-recruit formulation (high recruitment potential hypothesis). The two-line model assumes recruitment increases linearly with SSB from zero to a maximum value (RMAX) when SSB reaches the current carrying capacity (assumed to be lower than the historical carrying capacity observed during 1970 to 1975). Here the SSB threshold (hinge) was set at the average SSB during 1990-1995 (the period with the lowest estimated SSB), and RMAX was calculated as the geometric mean recruitment during 1976-2010 (the recruitment estimates for the last three years were deemed unreliable). The Beverton and Holt function was fit to the SSB and recruitment estimates corresponding to the period 1971-2010. The two curves are shown in Figure 12. Due to uncertainty in the estimation of the spawner-recruit relationship, reference points based on F0.1 are presented in addition to FMSY (consistent with the 2012 assessment). Note that F0.1 is calculated as the fishing mortality rate corresponding to 10% of the slope of the yield-per-recruit curve at the origin; as such it is calculated independently of the presumed spawner-recruit relationship. The spawning biomass corresponding to F0.1, SSB0.1, is calculated as the equilibrium level of spawning biomass achieved by fishing indefinitely at F0.1. Stock status was determined using the two-line (low recruitment potential) and Beverton-Holt (high recruitment potential) scenarios for the proposed base model from 1970 to current (Figure 13). The results under the two-line (low recruitment) scenario suggest that the stock has achieved the convention objective (level that supports MSY). The results under the Beverton-Holt (high recruitment) scenario suggest that the stock biomass has been below convention objectives since 1970 and that overfishing was occurring throughout the period of record until very recently. The estimated status of the stock in 2013 is summarized for the two alternative recruitment hypotheses in Figures 13 and 14. The estimated median trajectories of stock status since 1970 are shown in Figure 13. Figure 14 shows the results for the proposed base case and the jack-knife analysis runs excluding the Canadian GSL and US RR > 177 cm indices. The two jack-knife runs were included because their divergence from the base model helps to bracket the uncertainty in SSB and fishing mortality. The two-line base model (low recruitment hypothesis) estimated recent F (geometric mean from 2010-2013) to be 0.35 FMSY (0.28-0.43 at the 80% confidence level). In comparison, the jack-knife sensitivity analyses resulted in similar estimates of F below FMSY compared to the base model. Spawning stock biomass under the two-line recruitment hypothesis was estimated to be 2.3 SSBMSY (1.92 to 2.68 confidence interval) and 1.29 SSB0.1 (1.13 to 1.52 at the 80% confidence level). Under the Beverton and Holt recruitment hypothesis, recent F was estimated to be 0.86 FMSY (0.64 to 1.08 at the 80% confidence level) and 0.61 F0.1 (0.50 to 0.72 confidence interval). Spawning stock biomass under the Beverton and Holt recruitment hypothesis was estimated to be 0.48 of SSBMSY (0.35 to 0.72) and 0.76 of SSB0.1 (0.58 to 1.04 at the 80% confidence level). The results of this assessment do not capture the full degree of uncertainty in the assessments and stock projections. An important factor contributing to uncertainty is mixing between fish of eastern and western origin. Recent analyses have indicated that stock mixing occurs (empirical tag return information and otolith microchemistry) and that stock assessment is sensitive to the stock mixing assumptions. Based on earlier work, the estimates of stock status can be expected to vary considerably depending on the type of data used to estimate mixing (conventional tagging or isotope signature samples) and stock mixing assumption. More research and data synthesis needs to be done before mixing models can be used operationally for management advice. Another important source of uncertainty is recruitment, both in terms of recent levels (which are estimated with low precision in the assessment), and potential future levels (the "low" vs "high" recruitment hypotheses which affect management benchmarks). Improved knowledge of maturity at age will also affect the perception of changes in stock size. Finally, determining the catch at age from length samples is imprecise for larger bluefin tuna and should be addressed in a sensitivity analysis in which the catch is characterized using direct ageing results.
1550
5. Projections 5.1 Projections WBFT 5.1.1 Methods As in 2012, the two recruitment scenarios discussed in Section 5.2: a low recruitment potential scenario (two-line model) that assumes average recruitment cannot reach the high levels from the early 1970s (ostensibly owing to some unknown change in the environment) and a high recruitment potential scenario that assumes the number of recruits is a Beverton and Holt function of the spawning biomass in the previous year, were considered. In past assessments of the stock the working group indicated that there was no strong evidence to favor one scenario over the other and that the two scenarios provide reasonable (but not extreme) lower and upper bounds on rebuilding potential. The projections for the western stock were based on the bootstrap replicates of the fishing mortality-at-age and numbers-at-age matrices produced by the VPA-2BOX software. Projections and benchmarks were computed for the Beverton and Holt (high) and two-line scenarios (low) to account for the uncertainty regarding the true form of the stock-recruitment relationship, consistent with the approach used during the 2012 assessment (see Figure 6.2.12). The Beverton-Holt stock-recruitment relationship was fitted to the estimates of spawning stock size and recruitment for the 1970-2009 year-classes by means of maximum likelihood estimation (lognormal error structure). The extent of recruitment variability, σR, for each bootstrap replicate was equal to the maximum likelihood estimate (0.30). As in 2012, future recruitment was allowed to deviate from its expectation as a first-order multiplicative (lognormal) autocorrelated process. Generally the lognormal structure is preferred because it does not admit negative recruitments and because it allows the variance in recruitment to increase with its expectation. The autocorrelation parameter (ρ) was estimated to be equal to 0.416 for the proposed base case. The 2-line stock-recruitment relationship assumes a linear increase in recruitment from the origin to a “pivot” level of spawning stock size above which recruitment is independent of spawning stock size. The “pivot” spawning stock size is defined as the mean spawning stock size over 1990-95 (the period that includes the lowest estimates of spawning biomass). The constant level of recruitment is defined as the geometric mean recruitment over the years 1976-2010, a period over which recruitment showed less variation compared the full time series. Similar to the Beverton-Holt model, the 2-line stock recruitment relationship used a first-order autocorrelated process with the standard deviation (σR) estimated at 0.204 and the autocorrelation parameter (ρ) estimated at 0.359. The recruitment estimates from the VPA for 2011-2013 were replaced with values generated from the fitted stock-recruitment relationship underlying the projection (for both low and high recruitment scenarios). Numbers and fishing mortality-at-age for ages 1-3 at the start of 2011 were therefore re-calculated by projecting these generated recruitments forward under the known catches-at-age. The projected partial recruitment (which combines the effects of gear selectivity and availability of fish by age) was calculated from the geometric mean values of fishing mortality-at-age for the years 2010-2012 (rescaled to a maximum of 1.0). The average age of the plus-group at the start of the projections was computed from the observed average weight of the plus-group in the last year of the VPA by inverting the growth curve. The average age of the plus-group was then updated in subsequent years of the projection and the weight of the plus-group computed from the updated average age by use of the growth curve (as done in 2012). In this way the average weight of the plus-group is allowed to increase with reductions in the fishing mortality rate. The projected catch for 2014 was assumed to be equal 1,750 t [Rec. 12-02]. For years beyond 2014, projections were continued using various levels of constant catch with the restriction that the fully-selected F was constrained not to exceed 2 yr-1. Medium-term projections were conducted to cover the time of the rebuilding plan (2019). Projected spawning stock size was expressed relative to the spawning stock size associated with MSY and F0.1 (i.e., BMSY, B0.1) for the appropriate recruitment scenario. BMSY was used as a reference level for rebuilding because it is the target of the current rebuilding program. The reference point F0.1 is often used rather than FMSY by other stock assessment groups, particularly when the stock-recruitment relationship is poorly known. It should be noted that F0.1 is calculated independent of an underlying stock recruitment relationship in VPA-2BOX, and in some cases F0.1 can exceed FMSY.
1551
5.1.2 Results The recruitment expected at BMSY was much lower with the two-line scenario (96,500) than with the Beverton-Holt scenario (210,000), with correspondingly lower estimates of MSY and BMSY. However, the two-line and Beverton-Holt scenarios predict similar levels of recruitment when spawning stock sizes are low (i.e., between 5,000 and 13,000 t). Projections of SSB from the proposed base VPA were made through 2019 under constant catches of 0 t to 3500 t in 100 t intervals, with an additional projection at the current TAC of 1,750 t [Rec. 12-02]. The associated benchmarks for the base case are given in Table 3. The results assuming low recruitment potential (Figure 15) indicate there is better than a 60% chance that the stock is currently at or above the convention objective (BMSY = 12,900 t). Accordingly, there is less than a 50% chance of overfishing if catches are maintained at less than or equal to the maximum sustainable yield (2,650 t). The outlook under high recruitment potential (Figure 16) is less optimistic, indicating a stock that is currently overfished but not experiencing overfishing. The median estimates of projected SSB, SSB/SSBMSY, F, F/FMSY, F, F/F01 and recruitment for the high and low recruitment scenarios are shown in Figure 15 to 16. Under the low recruitment potential scenario (Figures 15 and 17) the current TAC will lead to the 2019 SSB being higher than the estimated SSB for 2014. Constant catches at 2500 t would lead to no increase in the SSB in 2019 compared to 2014, while catches above 2500 t will result in the 2019 SSB being smaller than the 2014 SSB. The high recruitment potential scenario (Figure 16) suggests that the western stock will not rebuild by 2019 even with no catch (0 t), although the current TAC was estimated to have ended overfishing in 2013 and initiated rebuilding in recent years. At the current TAC of 1,750 t, the high recruitment scenario indicated that the stock is not expected to be rebuilt to SSBMSY before 2025. Spawning stock biomass predictions were similar between the low and high recruitment scenarios for the period 2014 to 2019 (Figure 18). Comparison of results with the previous update assessment showed that the 2014 estimated stock biomass trajectory under the low and high recruitment scenarios is considerably higher than the results of the 2012 assessment (Figure 18). The 2014 assessment indicated a higher level of SSB and SSB relative to MSY between 2014 and 2019. The 60th percentile of projected SSB/SSBMSY and F/FMSY were also computed, and are illustrated in Figure 17. The projected stock status under the two recruitment scenarios resulted in different estimates of overfished status (B < BMSY), but both scenarios indicated that the recent harvest levels were below the overfishing threshold (F>FMSY). The Kobe 2 Strategy Matrices are summarized in Tables 4-6. Table 5 summarizes the chance that various constant catch policies will allow rebuilding under the low and high recruitment scenarios and maintain SSB above SSBMSY. Table 4 summarizes the chance that various constant catch policies will prevent overfishing whereas Table 6 summarizes the joint distribution (SSB>SSBMSY and F<FMSY). The results are consistent with those discussed above (Figures 15-17).
1552

Run number 0,1,4,5-16 2 3First Age 1 1 1Plus Group Age 16+ 16+ 16+First Year 1970 1970 1970Last Year 2013 2013 2013Natural Mortality 0.14 all ages 0.14 all ages 0.14 all agesMaturity Same as 2010:
Knife-Edged; 0.0 for ages 0-8;
1.0 at 9+
Same as 2010: Knife-Edged; 0.0 for ages 0-
8; 1.0 at 9+
Same as 2010: Knife-Edged; 0.0 for ages 0-
8; 1.0 at 9+Constraint on Vulnerability (Applied to Last N Years; Std Dev; First Age - Last Age)
3; 0.5; 1-15 3; 0.5; 1-15 3; 0.5; 1-15
F in last year F-ratio Index Weighting Bootstrap Specifications
Estimated for ages 1-15
If bootstapped, used Stine correction to inflate
Fixed at 1.0 for all yearsIndices equally weighted (estimating a single
Table 1. Parameter specifications for the VPA continuity run (0) and sensitivity analyses (runs 1-16). Differences from the continuity run (0) are highlighted in gray.
1553

Table 2. Specifications for indices of abundance for western bluefin tuna.
Index Ages Time period Partial Catch-at-Age Filter CriteriaCanadian Gulf of St. Lawrence 13-16 1981-2009, 2011-2013 FlagName="Canada"
GearGrpCode="RR" or "TL" Monthc="Aug","Sep", or "Oct"
Canadian Southwest Nova Scotia 8-14 1988-2013 FlagName="Canada", GearGrpCode="RR","TL", or "HP" Monthc="Aug","Sep", or "Oct"
U.S.A. Rod and Reel <145 cm 1-5 1980-83, 1985-1992 FlagName="U.S.A." GearGrpCode="RR" Size<145 Monthc="Jun", "Jul", Aug", or "Sep"
U.S.A. Rod and Reel 66-114 cm 2-3 1993-2013 FlagName="U.S.A." GearGrpCode="RR" Size>66 and Size<115 Monthc="Jun", "Jul", Aug" or ,"Sep"
U.S.A. Rod and Reel 115-144 cm 4-5 1993-2013 FlagName="U.S.A." GearGrpCode="RR" Size>114 and Size<145 Monthc="Jun", "Jul", Aug" or ,"Sep"
U.S.A. Rod and Reel >195 cm 10-16 1983-1992 FlagName="U.S.A." GearGrpCode="RR" Size>195 Monthc="Jul", Aug","Sep", or "Oct"
U.S.A. Rod and Reel >177 cm 8-16 1993-2013 FlagName="U.S.A." GearGrpCode="RR" Size>177 Monthc="Jul", Aug" ,"Sep", or "Oct"
Japan Longline Area 2 2-16 1976-2013 FlagName="Japan"Gulf of Mexico Larval Survey 9-16 1977-78, 1981-84, 1986-2013 Equal to Japan GOM LL 1974-1981 and
U.S.A. GOM LL 2004-2013U.S.A. Gulf of Mexico Longline 9-16 1987-2013 FlagName="U.S.A."
GearGrpCode="LL" Monthc="Jan", "Feb", "Mar", "Apr", or "May" SampAreaCode="BF60"
Japan Gulf of Mexico Longline 9-16 1974-1981 FlagName="Japan"Tagging 1-3 1970-1981 Fixed selectivity: ages 1-3 fully selected,
ages 4+ not selected
Canadian Gulf of St. Lawrence 8-16 No change FlagName="Canada" GearCode="RR", "RRFB", or "TL" Monthc="Aug","Sep", or "Oct" Lat=45 (1991 and later) Lon=60 (1991 and later)
Canadian Southwest Nova Scotia 5-16 No change FlagName="Canada" Monthc="Aug","Sep", or "Oct" GearCode="HARP" or "HP-E" (Lat=40, Lon=60) for 1991 and later plus GearCode="RR", "RRFP", "TL", "HARP" or "HP-E" (Lat=45, Lon=60) for 1991 and later
CONTINUITY MODEL INDEX SPECIFICATIONS
MODIFICATIONS TO INDEX SPECIFICATIONS FOR BASE MODEL
1554

Table 3. WBFT: Estimated benchmarks and reference points with 80% confidence intervals.
MEASURE LOWER CL MEDIAN UPPER CL AVERAGE RUN 0 STD. DEV.F at MSY 0.17 0.20 0.24 0.21 0.19 0.03MSY 2807 3050 3307 3056 3086 200Y/R at MSY 30.3 31.6 32.7 31.5 32.0 1.0S/R at MSY 130 137 144 137 138 5SPR AT MSY 0.19 0.20 0.21 0.20 0.21 0.01SSB AT MSY 12969 13226 13645 13268 13343 263F at max. Y/R 0.20 0.23 0.26 0.23 0.23 0.02Y/R maximum 30.4 31.7 32.8 31.6 32.1 1.0S/R at Fmax 113 122 129 122 113 6SPR at Fmax 0.17 0.18 0.19 0.18 0.17 0.01SSB at Fmax 0 0 0 514 0 2588F 0.1 0.11 0.12 0.13 0.12 0.12 0.01Y/R at F0.1 28.0 29.0 29.8 29.0 29.5 0.7S/R at F0.1 226 239 250 239 229 10SPR at F0.1 0.34 0.36 0.37 0.36 0.34 0.01SSB at F0.1 21330 23042 24966 23140 22101 1432
MEASURE LOWER CL MEDIAN UPPER CL AVERAGE RUN 0 STD. DEV.F at MSY 0.07 0.08 0.10 0.08 0.08 0.01MSY 4442 5316 5863 5233 5343 554Y/R at MSY 24.4 25.9 27.2 25.9 25.6 1.0S/R at MSY 288 307 323 307 312 14SPR AT MSY 0.43 0.46 0.48 0.46 0.46 0.02SSB AT MSY 50096 63102 72921 62443 64998 9166F at max. Y/R 0.20 0.23 0.26 0.23 0.23 0.02Y/R maximum 30.5 31.7 32.8 31.7 32.2 1.0S/R at Fmax 113 121 129 121 113 6SPR at Fmax 0.17 0.18 0.19 0.18 0.17 0.01SSB at Fmax 0 1244 6317 2192 0 2624F 0.1 0.11 0.12 0.13 0.12 0.12 0.01Y/R at F0.1 28.1 29.1 29.8 29.0 29.5 0.7S/R at F0.1 226 238 250 239 229 10SPR at F0.1 0.34 0.35 0.37 0.36 0.34 0.01SSB at F0.1 32329 40179 45458 39559 36554 5095
Low Recruitment
High Recruitment
1555

Table 4. WBFT: The annual probability that F < FMSY at various levels of total allowable catch. The current TAC of 1,750 mt is highlighted in bold. A) Low Recruitment
B) High Recruitment
Probability that F < Fmsy (No Overfishing)TAC 2012 2013 2014 2015 2016 2017 2018 20190-1600 mt' 100.0% 100.0% 100.0% 100.0% 100.0% 100.0% 100.0% 100.0%1700 mt 100.0% 100.0% 100.0% 100.0% 100.0% 100.0% 100.0% 100.0%1750 mt 100.0% 100.0% 100.0% 100.0% 100.0% 100.0% 100.0% 100.0%1800 mt 100.0% 100.0% 100.0% 100.0% 100.0% 100.0% 100.0% 100.0%1900 mt 100.0% 100.0% 100.0% 100.0% 100.0% 100.0% 100.0% 100.0%2000 mt 100.0% 100.0% 100.0% 100.0% 100.0% 100.0% 100.0% 100.0%2100 mt 100.0% 100.0% 100.0% 100.0% 100.0% 100.0% 100.0% 100.0%2200 mt 100.0% 100.0% 100.0% 100.0% 100.0% 100.0% 100.0% 100.0%2300 mt 100.0% 100.0% 100.0% 100.0% 100.0% 100.0% 100.0% 100.0%2400 mt 100.0% 100.0% 100.0% 100.0% 100.0% 100.0% 100.0% 100.0%2500 mt 100.0% 100.0% 100.0% 100.0% 100.0% 100.0% 100.0% 100.0%2600 mt 100.0% 100.0% 100.0% 100.0% 100.0% 100.0% 100.0% 100.0%2700 mt 100.0% 100.0% 100.0% 100.0% 100.0% 100.0% 100.0% 100.0%2800 mt 100.0% 100.0% 100.0% 100.0% 100.0% 100.0% 100.0% 100.0%2900 mt 100.0% 100.0% 100.0% 100.0% 100.0% 100.0% 100.0% 99.8%3000 mt 100.0% 100.0% 100.0% 100.0% 100.0% 100.0% 100.0% 99.6%3100 mt 100.0% 100.0% 100.0% 100.0% 100.0% 100.0% 99.8% 99.4%3200 mt 100.0% 100.0% 100.0% 100.0% 100.0% 99.8% 99.4% 98.6%3300 mt 100.0% 100.0% 100.0% 100.0% 99.8% 99.4% 99.2% 98.0%3400 mt 100.0% 100.0% 100.0% 100.0% 99.4% 98.8% 98.4% 97.2%3500 mt 100.0% 100.0% 100.0% 99.6% 99.4% 98.6% 97.6% 96.4%
Probability that F < Fmsy (No Overfishing)TAC 2012 2013 2014 2015 2016 2017 2018 20190-400 mt 79.8% 94.8% 97.4% 100.0% 100.0% 100.0% 100.0% 100.0%500 mt 79.8% 94.8% 97.4% 100.0% 100.0% 100.0% 100.0% 100.0%600 mt 79.8% 94.8% 97.4% 100.0% 100.0% 100.0% 100.0% 100.0%700 mt 79.8% 94.8% 97.4% 100.0% 100.0% 100.0% 100.0% 100.0%800 mt 79.8% 94.8% 97.4% 100.0% 100.0% 100.0% 100.0% 100.0%900 mt 79.8% 94.8% 97.4% 100.0% 100.0% 100.0% 100.0% 100.0%1000 mt 79.8% 94.8% 97.4% 100.0% 100.0% 100.0% 100.0% 100.0%1100 mt 79.8% 94.8% 97.4% 100.0% 100.0% 100.0% 100.0% 100.0%1200 mt 79.8% 94.8% 97.4% 100.0% 100.0% 100.0% 100.0% 100.0%1300 mt 79.8% 94.8% 97.4% 100.0% 100.0% 100.0% 100.0% 100.0%1400 mt 79.8% 94.8% 97.4% 99.8% 100.0% 100.0% 100.0% 100.0%1500 mt 79.8% 94.8% 97.4% 99.8% 99.8% 100.0% 100.0% 100.0%1600 mt 79.8% 94.8% 97.4% 98.6% 98.8% 99.2% 99.6% 99.8%1700 mt 79.8% 94.8% 97.4% 98.0% 98.2% 98.6% 98.8% 99.2%1750 mt 79.8% 94.8% 97.4% 97.2% 97.8% 98.2% 98.8% 99.0%1800 mt 79.8% 94.8% 97.4% 96.6% 97.4% 97.8% 98.2% 98.6%1900 mt 79.8% 94.8% 97.4% 92.8% 94.6% 96.4% 97.2% 97.2%2000 mt 79.8% 94.8% 97.4% 89.2% 91.6% 93.2% 94.8% 96.0%2100 mt 79.8% 94.8% 97.4% 84.2% 87.6% 90.2% 91.8% 93.4%2200 mt 79.8% 94.8% 97.4% 79.2% 82.2% 85.6% 88.0% 89.6%2300 mt 79.8% 94.8% 97.4% 69.2% 75.4% 79.6% 83.8% 85.8%
1556

Table 5. WBFT: The annual probability that SSB > SSBMSY at various levels of total allowable catch. The current TAC of 1,750 mt is highlighted in bold. A) Low Recruitment
B) High Recruitment
Probability that SSB > SSBmsy (Not Overfished)TAC 2012 2013 2014 2015 2016 2017 2018 20190-1600 mt 100.0% 100.0% 100.0% 100.0% 100.0% 100.0% 100.0% 100.0%1700 mt 100.0% 100.0% 100.0% 100.0% 100.0% 100.0% 100.0% 100.0%1750 mt 100.0% 100.0% 100.0% 100.0% 100.0% 100.0% 100.0% 100.0%1800 mt 100.0% 100.0% 100.0% 100.0% 100.0% 100.0% 100.0% 100.0%1900 mt 100.0% 100.0% 100.0% 100.0% 100.0% 100.0% 100.0% 100.0%2000 mt 100.0% 100.0% 100.0% 100.0% 100.0% 100.0% 100.0% 100.0%2100 mt 100.0% 100.0% 100.0% 100.0% 100.0% 100.0% 100.0% 100.0%2200 mt 100.0% 100.0% 100.0% 100.0% 100.0% 100.0% 100.0% 100.0%2300 mt 100.0% 100.0% 100.0% 100.0% 100.0% 100.0% 100.0% 100.0%2400 mt 100.0% 100.0% 100.0% 100.0% 100.0% 100.0% 100.0% 100.0%2500 mt 100.0% 100.0% 100.0% 100.0% 100.0% 100.0% 100.0% 100.0%2600 mt 100.0% 100.0% 100.0% 100.0% 100.0% 100.0% 100.0% 100.0%2700 mt 100.0% 100.0% 100.0% 100.0% 100.0% 100.0% 100.0% 100.0%2800 mt 100.0% 100.0% 100.0% 100.0% 100.0% 100.0% 100.0% 100.0%2900 mt 100.0% 100.0% 100.0% 100.0% 100.0% 100.0% 100.0% 100.0%3000 mt 100.0% 100.0% 100.0% 100.0% 100.0% 100.0% 100.0% 100.0%3100 mt 100.0% 100.0% 100.0% 100.0% 100.0% 100.0% 100.0% 100.0%3200 mt 100.0% 100.0% 100.0% 100.0% 100.0% 100.0% 100.0% 100.0%3300 mt 100.0% 100.0% 100.0% 100.0% 100.0% 100.0% 100.0% 100.0%3400 mt 100.0% 100.0% 100.0% 100.0% 100.0% 100.0% 100.0% 99.8%3500 mt 100.0% 100.0% 100.0% 100.0% 100.0% 100.0% 100.0% 99.8%
Probability that SSB > SSBmsy (Not Overfished)TAC 2012 2013 2014 2015 2016 2017 2018 20190-400 mt 0.8% 0.8% 1.0% 1.2% 1.2% 1.2% 1.2% 4.2%500 mt 0.8% 0.8% 1.0% 1.2% 1.2% 1.2% 1.2% 3.8%600 mt 0.8% 0.8% 1.0% 1.2% 1.2% 1.2% 1.2% 3.4%700 mt 0.8% 0.8% 1.0% 1.2% 1.2% 1.2% 1.2% 3.0%800 mt 0.8% 0.8% 1.0% 1.2% 1.2% 1.2% 1.2% 2.4%900 mt 0.8% 0.8% 1.0% 1.2% 1.2% 1.2% 1.2% 2.4%1000 mt 0.8% 0.8% 1.0% 1.2% 1.2% 1.2% 1.2% 2.4%1100 mt 0.8% 0.8% 1.0% 1.2% 1.2% 1.2% 1.2% 2.2%1200 mt 0.8% 0.8% 1.0% 1.2% 1.2% 1.2% 1.2% 2.2%1300 mt 0.8% 0.8% 1.0% 1.2% 1.2% 1.2% 1.2% 1.6%1400 mt 0.8% 0.8% 1.0% 1.2% 1.2% 1.2% 1.2% 1.6%1500 mt 0.8% 0.8% 1.0% 1.2% 1.2% 1.2% 1.2% 1.6%1600 mt 0.8% 0.8% 1.0% 1.2% 1.2% 1.2% 1.2% 1.6%1700 mt 0.8% 0.8% 1.0% 1.2% 1.2% 1.2% 1.2% 1.6%1750 mt 0.8% 0.8% 1.0% 1.2% 1.2% 1.0% 1.2% 1.6%1800 mt 0.8% 0.8% 1.0% 1.2% 1.2% 1.0% 1.2% 1.6%1900 mt 0.8% 0.8% 1.0% 1.2% 1.2% 1.0% 1.2% 1.4%2000 mt 0.8% 0.8% 1.0% 1.2% 1.2% 1.0% 1.2% 1.4%2100 mt 0.8% 0.8% 1.0% 1.2% 1.2% 1.0% 1.0% 1.4%2200 mt 0.8% 0.8% 1.0% 1.2% 1.2% 0.8% 0.4% 1.2%2300 mt 0.8% 0.8% 1.0% 1.2% 1.2% 0.8% 0.4% 1.2%
1557
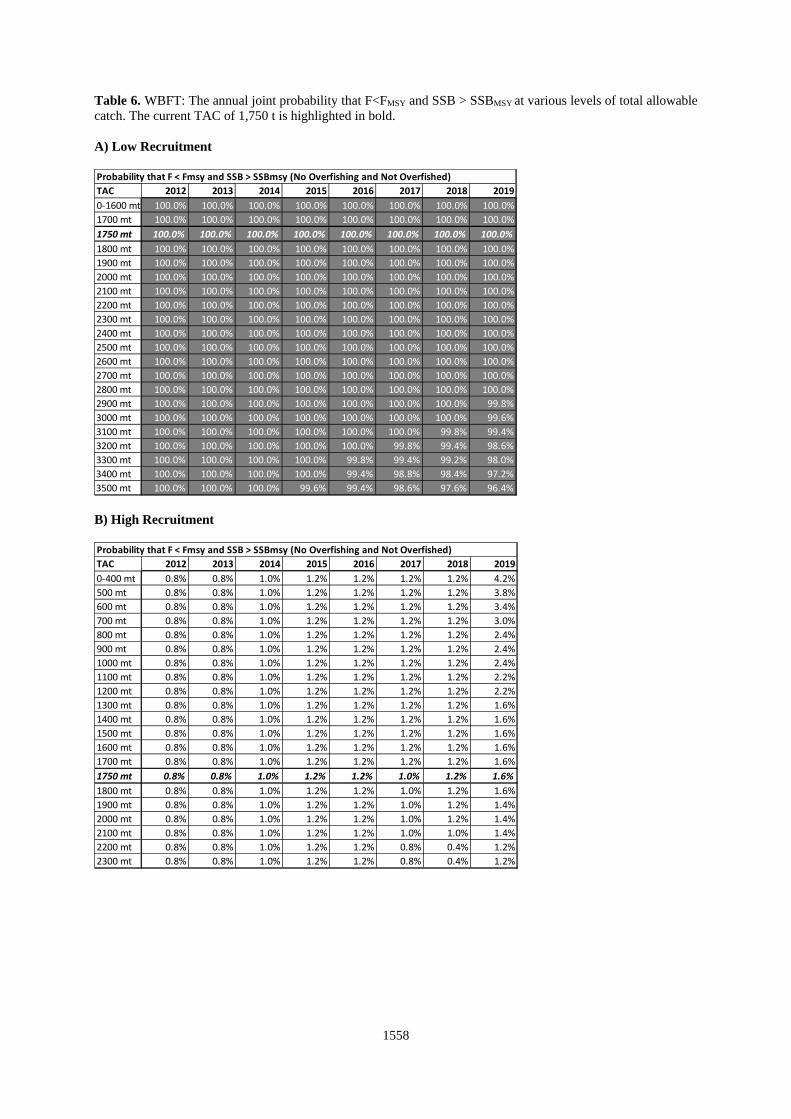
Table 6. WBFT: The annual joint probability that F<FMSY and SSB > SSBMSY at various levels of total allowable catch. The current TAC of 1,750 t is highlighted in bold. A) Low Recruitment
B) High Recruitment
Probability that F < Fmsy and SSB > SSBmsy (No Overfishing and Not Overfished)TAC 2012 2013 2014 2015 2016 2017 2018 20190-1600 mt 100.0% 100.0% 100.0% 100.0% 100.0% 100.0% 100.0% 100.0%1700 mt 100.0% 100.0% 100.0% 100.0% 100.0% 100.0% 100.0% 100.0%1750 mt 100.0% 100.0% 100.0% 100.0% 100.0% 100.0% 100.0% 100.0%1800 mt 100.0% 100.0% 100.0% 100.0% 100.0% 100.0% 100.0% 100.0%1900 mt 100.0% 100.0% 100.0% 100.0% 100.0% 100.0% 100.0% 100.0%2000 mt 100.0% 100.0% 100.0% 100.0% 100.0% 100.0% 100.0% 100.0%2100 mt 100.0% 100.0% 100.0% 100.0% 100.0% 100.0% 100.0% 100.0%2200 mt 100.0% 100.0% 100.0% 100.0% 100.0% 100.0% 100.0% 100.0%2300 mt 100.0% 100.0% 100.0% 100.0% 100.0% 100.0% 100.0% 100.0%2400 mt 100.0% 100.0% 100.0% 100.0% 100.0% 100.0% 100.0% 100.0%2500 mt 100.0% 100.0% 100.0% 100.0% 100.0% 100.0% 100.0% 100.0%2600 mt 100.0% 100.0% 100.0% 100.0% 100.0% 100.0% 100.0% 100.0%2700 mt 100.0% 100.0% 100.0% 100.0% 100.0% 100.0% 100.0% 100.0%2800 mt 100.0% 100.0% 100.0% 100.0% 100.0% 100.0% 100.0% 100.0%2900 mt 100.0% 100.0% 100.0% 100.0% 100.0% 100.0% 100.0% 99.8%3000 mt 100.0% 100.0% 100.0% 100.0% 100.0% 100.0% 100.0% 99.6%3100 mt 100.0% 100.0% 100.0% 100.0% 100.0% 100.0% 99.8% 99.4%3200 mt 100.0% 100.0% 100.0% 100.0% 100.0% 99.8% 99.4% 98.6%3300 mt 100.0% 100.0% 100.0% 100.0% 99.8% 99.4% 99.2% 98.0%3400 mt 100.0% 100.0% 100.0% 100.0% 99.4% 98.8% 98.4% 97.2%3500 mt 100.0% 100.0% 100.0% 99.6% 99.4% 98.6% 97.6% 96.4%
Probability that F < Fmsy and SSB > SSBmsy (No Overfishing and Not Overfished)TAC 2012 2013 2014 2015 2016 2017 2018 20190-400 mt 0.8% 0.8% 1.0% 1.2% 1.2% 1.2% 1.2% 4.2%500 mt 0.8% 0.8% 1.0% 1.2% 1.2% 1.2% 1.2% 3.8%600 mt 0.8% 0.8% 1.0% 1.2% 1.2% 1.2% 1.2% 3.4%700 mt 0.8% 0.8% 1.0% 1.2% 1.2% 1.2% 1.2% 3.0%800 mt 0.8% 0.8% 1.0% 1.2% 1.2% 1.2% 1.2% 2.4%900 mt 0.8% 0.8% 1.0% 1.2% 1.2% 1.2% 1.2% 2.4%1000 mt 0.8% 0.8% 1.0% 1.2% 1.2% 1.2% 1.2% 2.4%1100 mt 0.8% 0.8% 1.0% 1.2% 1.2% 1.2% 1.2% 2.2%1200 mt 0.8% 0.8% 1.0% 1.2% 1.2% 1.2% 1.2% 2.2%1300 mt 0.8% 0.8% 1.0% 1.2% 1.2% 1.2% 1.2% 1.6%1400 mt 0.8% 0.8% 1.0% 1.2% 1.2% 1.2% 1.2% 1.6%1500 mt 0.8% 0.8% 1.0% 1.2% 1.2% 1.2% 1.2% 1.6%1600 mt 0.8% 0.8% 1.0% 1.2% 1.2% 1.2% 1.2% 1.6%1700 mt 0.8% 0.8% 1.0% 1.2% 1.2% 1.2% 1.2% 1.6%1750 mt 0.8% 0.8% 1.0% 1.2% 1.2% 1.0% 1.2% 1.6%1800 mt 0.8% 0.8% 1.0% 1.2% 1.2% 1.0% 1.2% 1.6%1900 mt 0.8% 0.8% 1.0% 1.2% 1.2% 1.0% 1.2% 1.4%2000 mt 0.8% 0.8% 1.0% 1.2% 1.2% 1.0% 1.2% 1.4%2100 mt 0.8% 0.8% 1.0% 1.2% 1.2% 1.0% 1.0% 1.4%2200 mt 0.8% 0.8% 1.0% 1.2% 1.2% 0.8% 0.4% 1.2%2300 mt 0.8% 0.8% 1.0% 1.2% 1.2% 0.8% 0.4% 1.2%
1558

Figure 1. Fits to CPUE indices for 2014 western Atlantic BFT proposed base VPA (observed shown as black points, model predicted shown as red lines).
1970 1980 1990 2000 2010
01
23
45
CAN_GSL
1970 1980 1990 2000 2010
05
1015
CAN_SWNS
1970 1980 1990 2000 2010
0.0
0.5
1.0
1.5
2.0
USA_RR_0_145
1970 1980 1990 2000 2010
0.0
0.5
1.0
1.5
2.0
2.5 USA_RR_66_11
1970 1980 1990 2000 2010
0.0
0.5
1.0
1.5
2.0
2.5
USA_RR_115_1
1970 1980 1990 2000 2010
0.0
0.5
1.0
1.5
2.0
2.5
3.0 USA_RR_195cm
1970 1980 1990 2000 2010
0.0
1.0
2.0
3.0
USA_RR_177cm
1970 1980 1990 2000 2010
01
23
JPN_LL_AREA2
1970 1980 1990 2000 2010
01
23
4
GOM_LARVAL
1970 1980 1990 2000 2010
0.0
0.5
1.0
USA_GOM_LL
1970 1980 1990 2000 2010
0.0
0.4
0.8
1.2
JPN_GOM_LL
1970 1980 1990 2000 2010
0e+0
04e
+05
8e+0
5
TAGGING
Year
Inde
x of
Abu
ndan
ce
1559
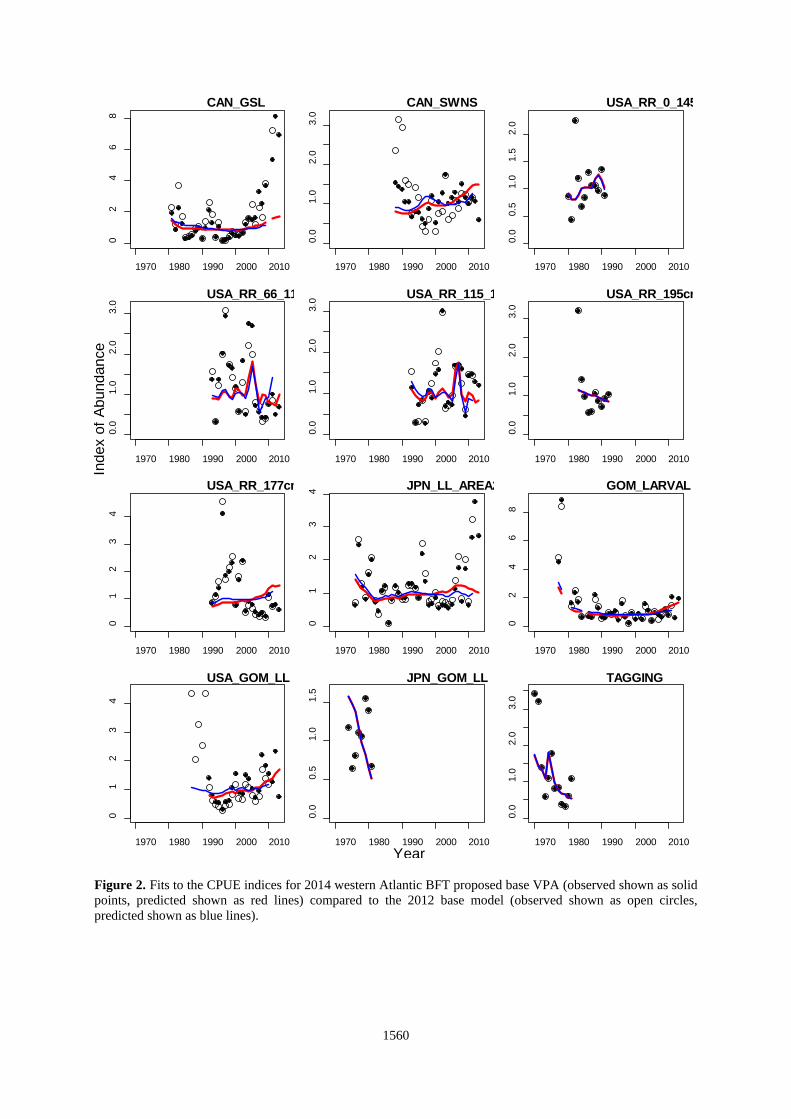
Figure 2. Fits to the CPUE indices for 2014 western Atlantic BFT proposed base VPA (observed shown as solid points, predicted shown as red lines) compared to the 2012 base model (observed shown as open circles, predicted shown as blue lines).
1970 1980 1990 2000 2010
02
46
8CAN_GSL
1970 1980 1990 2000 2010
0.0
1.0
2.0
3.0
CAN_SWNS
1970 1980 1990 2000 2010
0.0
0.5
1.0
1.5
2.0
USA_RR_0_145
1970 1980 1990 2000 2010
0.0
1.0
2.0
3.0
USA_RR_66_11
1970 1980 1990 2000 2010
0.0
1.0
2.0
3.0 USA_RR_115_1
1970 1980 1990 2000 2010
0.0
1.0
2.0
3.0
USA_RR_195cm
1970 1980 1990 2000 2010
01
23
4
USA_RR_177cm
1970 1980 1990 2000 2010
01
23
4 JPN_LL_AREA2
1970 1980 1990 2000 2010
02
46
8
GOM_LARVAL
1970 1980 1990 2000 2010
01
23
4
USA_GOM_LL
1970 1980 1990 2000 2010
0.0
0.5
1.0
1.5
JPN_GOM_LL
1970 1980 1990 2000 2010
0.0
1.0
2.0
3.0
TAGGING
Year
Inde
x of
Abu
ndan
ce
1560
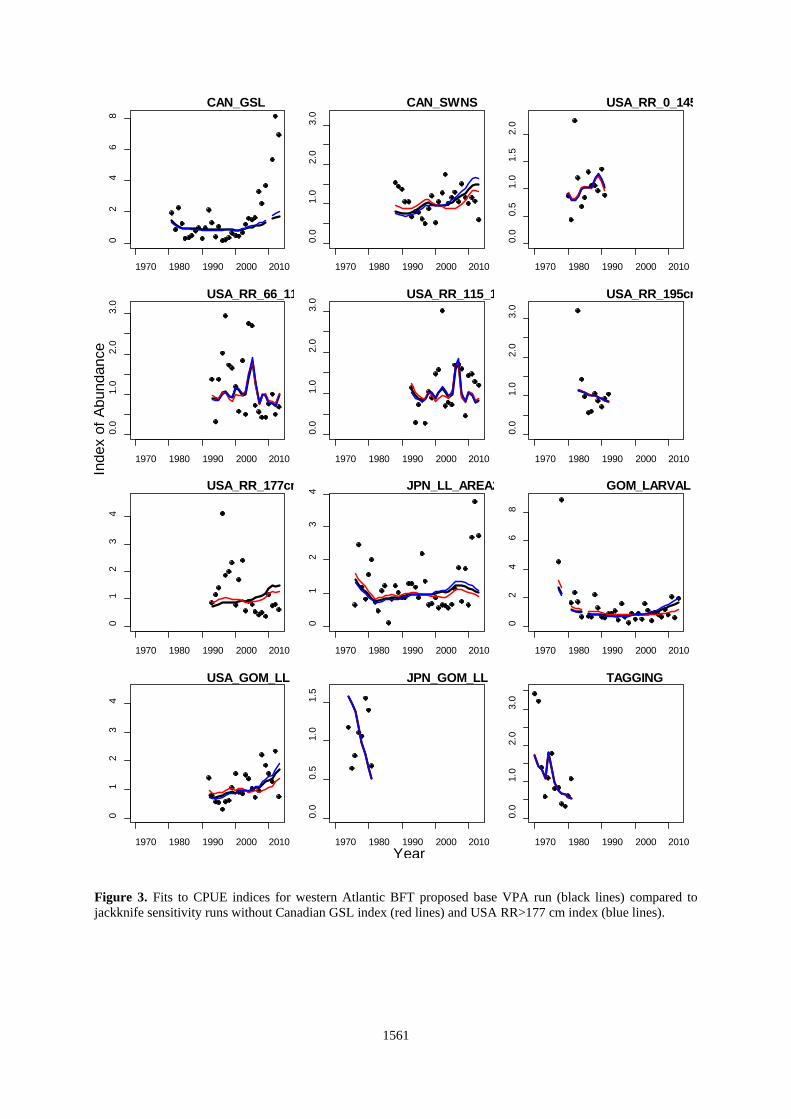
Figure 3. Fits to CPUE indices for western Atlantic BFT proposed base VPA run (black lines) compared to jackknife sensitivity runs without Canadian GSL index (red lines) and USA RR>177 cm index (blue lines).
1970 1980 1990 2000 2010
02
46
8CAN_GSL
1970 1980 1990 2000 2010
0.0
1.0
2.0
3.0
CAN_SWNS
1970 1980 1990 2000 2010
0.0
0.5
1.0
1.5
2.0
USA_RR_0_145
1970 1980 1990 2000 2010
0.0
1.0
2.0
3.0
USA_RR_66_11
1970 1980 1990 2000 2010
0.0
1.0
2.0
3.0 USA_RR_115_1
1970 1980 1990 2000 2010
0.0
1.0
2.0
3.0
USA_RR_195cm
1970 1980 1990 2000 2010
01
23
4
USA_RR_177cm
1970 1980 1990 2000 2010
01
23
4 JPN_LL_AREA2
1970 1980 1990 2000 2010
02
46
8
GOM_LARVAL
1970 1980 1990 2000 2010
01
23
4
USA_GOM_LL
1970 1980 1990 2000 2010
0.0
0.5
1.0
1.5
JPN_GOM_LL
1970 1980 1990 2000 2010
0.0
1.0
2.0
3.0
TAGGING
Year
Inde
x of
Abu
ndan
ce
1561

Figure 4. Histograms of bootstrap estimates of 2013 stock and fishery status. The yellow bar represents the value corresponding to the base-case deterministic point estimate. The cumulative probability is shown as a solid red line.
Stock Status - Low Recruitment Sc
SSB2013/SSBMSY
0.0 0.5 1.0 1.5 2.0 2.5 3.0 3.5
020
4060
80
00.
20.
40.
60.
81
Freq
uenc
y
Cum
ulat
ive
Pr
Fishery Status - Low Recruitment
Fcurrent/FMSY
0.0 0.5 1.0 1.5
050
100
150
00.
20.
40.
60.
81
Freq
uenc
y
Cum
ulat
ive
Pr
Stock Status - High Recruitment Sc
SSB2013/SSBMSY
0.0 0.5 1.0 1.5 2.0 2.5 3.0 3.5
050
100
150
00.
20.
40.
60.
81
Freq
uenc
y
Cum
ulat
ive
Pr
Fishery Status - High Recruitment
Fcurrent/FMSY
0.0 0.5 1.0 1.5
010
2030
4050
6070
00.
20.
40.
60.
81
Freq
uenc
y
Cum
ulat
ive
Pr
1562

Figure 5. Retrospective trends of spawning biomass (ages 9 and older) and recruitment (age 1) from the western BFT proposed base case. The legend indicates the number of years of data removed from the 2014 base VPA.
1970 1980 1990 2000 2010
010
000
3000
050
000
Year
SSB
Base-1-2-3-4-5
1970 1980 1990 2000 2010
0e+0
01e
+05
2e+0
53e
+05
4e+0
5
Year
Rec
ruitm
ent
Base-1-2-3-4-5
1563

Figure 6. Retrospective patterns of fishing mortality by age from the western BFT proposed base case model. The legend indicates the number of years removed from the 2014 base VPA.
1970 1980 1990 2000 2010 2020
0.00
0.10
0.20
0.30
Age 1Base-1-2-3-4-5
1970 1980 1990 2000 2010 2020
0.0
0.4
0.8
Age 2Base-1-2-3-4-5
1970 1980 1990 2000 2010 2020
0.0
0.4
0.8
Age 3Base-1-2-3-4-5
1970 1980 1990 2000 2010 2020
0.0
0.4
0.8
Age 4Base-1-2-3-4-5
1970 1980 1990 2000 2010 2020
0.00
0.10
0.20
Age 5Base-1-2-3-4-5
1970 1980 1990 2000 2010 2020
0.00
0.10
Age 6Base-1-2-3-4-5
1970 1980 1990 2000 2010 2020
0.00
0.06
0.12
Age 7Base-1-2-3-4-5
1970 1980 1990 2000 2010 2020
0.00
0.10
0.20 Age 8
Base-1-2-3-4-5
1970 1980 1990 2000 2010 2020
0.00
0.10
Age 9Base-1-2-3-4-5
1970 1980 1990 2000 2010 2020
0.00
0.10
Age 10Base-1-2-3-4-5
1970 1980 1990 2000 2010 2020
0.00
0.05
0.10
0.15 Age 11
Base-1-2-3-4-5
1970 1980 1990 2000 2010 2020
0.00
0.10
Age 12Base-1-2-3-4-5
1970 1980 1990 2000 2010 2020
0.00
0.10
0.20 Age 13
Base-1-2-3-4-5
1970 1980 1990 2000 2010 2020
0.00
0.10
0.20
Age 14Base-1-2-3-4-5
1970 1980 1990 2000 2010 2020
0.00
0.10
0.20
0.30
Age 15Base-1-2-3-4-5
1970 1980 1990 2000 2010 2020
0.00
0.10
0.20
0.30 Age 16
Base-1-2-3-4-5
Estim
ated
Fis
hing
Mor
talit
y
1564

Figure 7. Retrospective patterns of numbers-at-age from the western BFT proposed base case model. The legend indicates the number of years removed from the 2014 base VPA.
1970 1980 1990 2000 2010 2020
0e+0
02e
+05
4e+0
5 Age 1Base-1-2-3-4-5
1970 1980 1990 2000 2010 2020
015
0000
3500
00
Age 2Base-1-2-3-4-5
1970 1980 1990 2000 2010 2020
010
0000
2000
00 Age 3Base-1-2-3-4-5
1970 1980 1990 2000 2010 2020
0e+0
06e
+04
Age 4Base-1-2-3-4-5
1970 1980 1990 2000 2010 2020
040
000
8000
0 Age 5Base-1-2-3-4-5
1970 1980 1990 2000 2010 2020
040
000
8000
0
Age 6Base-1-2-3-4-5
1970 1980 1990 2000 2010 2020
020
000
5000
0
Age 7Base-1-2-3-4-5
1970 1980 1990 2000 2010 2020
020
000
5000
0 Age 8Base-1-2-3-4-5
1970 1980 1990 2000 2010 2020
020
000
4000
0
Age 9Base-1-2-3-4-5
1970 1980 1990 2000 2010 2020
020
000
4000
0 Age 10Base-1-2-3-4-5
1970 1980 1990 2000 2010 2020
020
000
4000
0
Age 11Base-1-2-3-4-5
1970 1980 1990 2000 2010 2020
010
000
2500
0
Age 12Base-1-2-3-4-5
1970 1980 1990 2000 2010 2020
010
000
2500
0 Age 13Base-1-2-3-4-5
1970 1980 1990 2000 2010 2020
010
000
2000
0
Age 14Base-1-2-3-4-5
1970 1980 1990 2000 2010 2020
010
000
2000
0 Age 15Base-1-2-3-4-5
1970 1980 1990 2000 2010 2020
020
000
5000
0
Age 16Base-1-2-3-4-5
Estim
ated
Abu
ndan
ce
1565
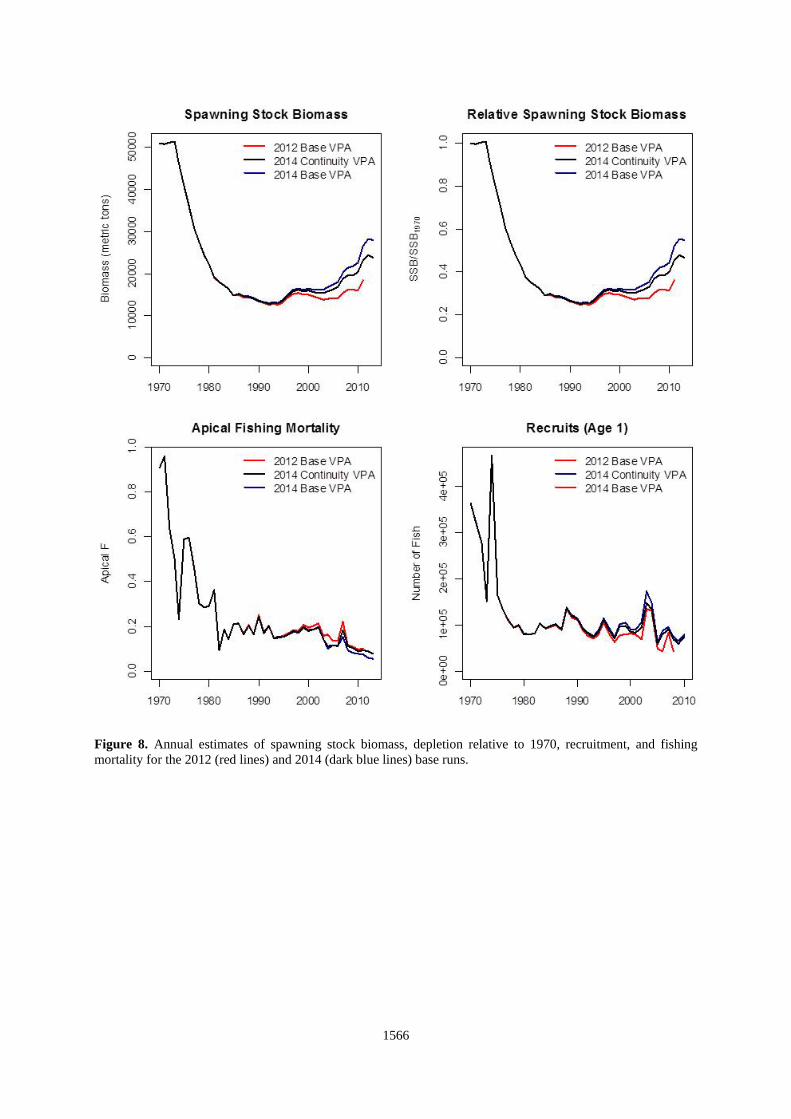
Figure 8. Annual estimates of spawning stock biomass, depletion relative to 1970, recruitment, and fishing mortality for the 2012 (red lines) and 2014 (dark blue lines) base runs.
1566

Figure 9. Median (solid line) estimates of spawning stock biomass, abundance of spawners (Age 9+), apical fishing mortality, and recruitment for the proposed base model. Dashed lines indicate the 80% confidence interval.
1567

Figure 10. Jackknife analysis demonstrating the effects of iteratively removing individual relative abundance indices and associated partial catch-at-age matrices from the western BFT VPA.
1970 1980 1990 2000 2010
010
000
2000
030
000
4000
050
000
Spawning Stock Biomass
Year
Bio
mas
s (m
etric
tons
)BaseCAN_GSLCAN_SWNSJPN_AREA2_LLJPN_GOM_LLLARVALTAGGING
USA_GOM_LLUSA_RR_66_114USA_RR_115_144USA_RR_145lessUSA_RR_177plusUSA_RR_195plus
1970 1980 1990 2000 2010
0e+0
01e
+05
2e+0
53e
+05
4e+0
5
Recruitment
Year
Num
ber o
f Fis
h
BaseCAN_GSLCAN_SWNSJPN_AREA2_LLJPN_GOM_LLLARVALTAGGING
USA_GOM_LLUSA_RR_66_114USA_RR_115_144USA_RR_145lessUSA_RR_177plusUSA_RR_195plus
1568
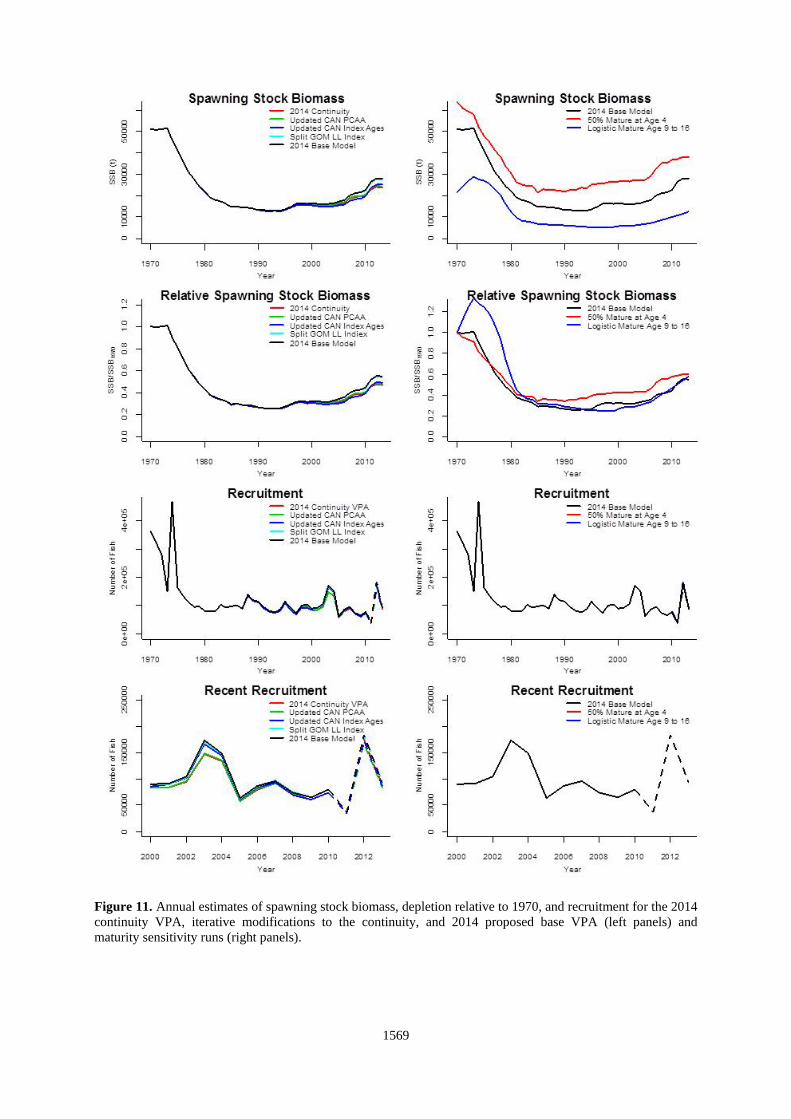
Figure 11. Annual estimates of spawning stock biomass, depletion relative to 1970, and recruitment for the 2014 continuity VPA, iterative modifications to the continuity, and 2014 proposed base VPA (left panels) and maturity sensitivity runs (right panels).
1569

Figure 12. Spawner-recruit relationship fit to the 2014 base VPA (solid lines) compared to the 2012 base model fits (dashed lines). The two-line and Beverton-Holt models were used to calculate management reference points and project the population dynamics through 2019. Points represent the estimates from the 2014 proposed base VPA, with the 2002, 2003, and recent year class estimates (2007-2009) highlighted.
0
50000
100000
150000
200000
250000
300000
350000
400000
450000
500000
0 10000 20000 30000 40000 50000 60000
Recr
uitm
ent
Spawner Biomass
Stock-Recruitment of Western Bluefin Tuna
VPA Estimated Recruitment 2014 Beverton-Holt2002 yearclass 2014 2-Line2003 yearclass 2012 Beverton-Holt2007-2009 yearclasses Linear (2012 2-Line)
1570
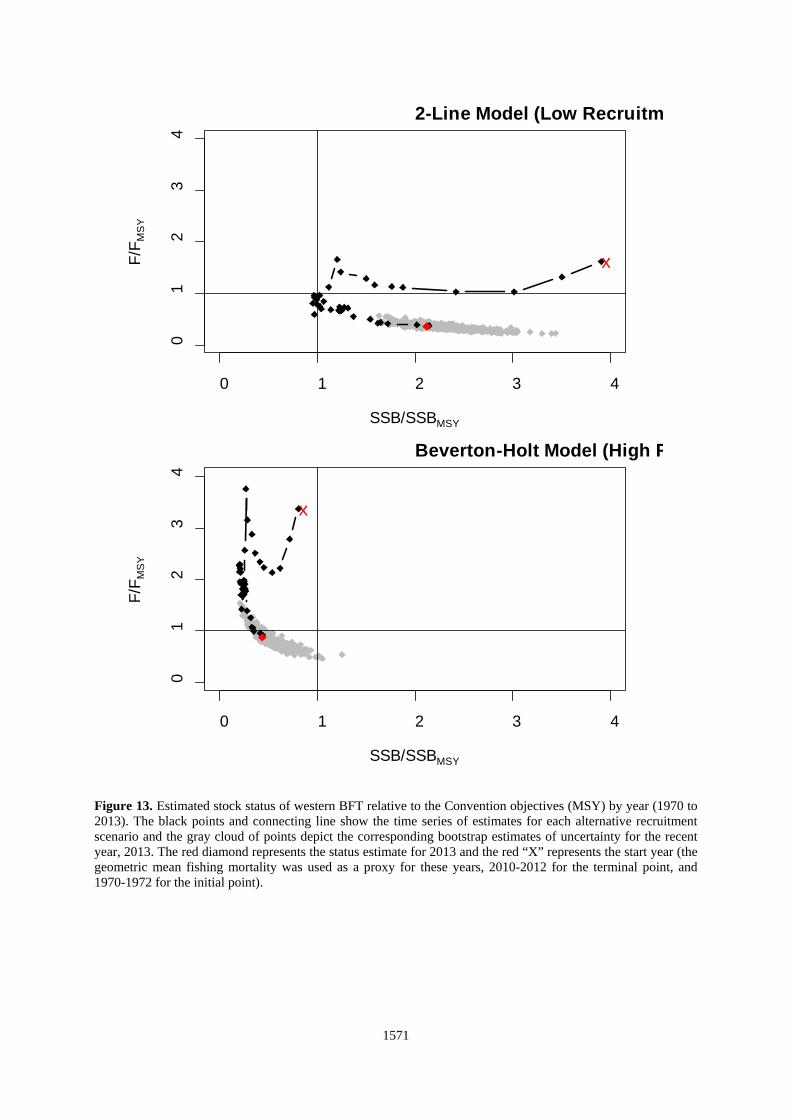
Figure 13. Estimated stock status of western BFT relative to the Convention objectives (MSY) by year (1970 to 2013). The black points and connecting line show the time series of estimates for each alternative recruitment scenario and the gray cloud of points depict the corresponding bootstrap estimates of uncertainty for the recent year, 2013. The red diamond represents the status estimate for 2013 and the red “X” represents the start year (the geometric mean fishing mortality was used as a proxy for these years, 2010-2012 for the terminal point, and 1970-1972 for the initial point).
0 1 2 3 4
01
23
4
2-Line Model (Low Recruitme
SSB/SSBMSY
F/F M
SY
x
0 1 2 3 4
01
23
4
Beverton-Holt Model (High R
SSB/SSBMSY
F/F M
SY
x
1571

Figure 14. Western bluefin tuna stock status in 2013 estimated by the proposed base VPA, and jackknife runs removing the Canadian GSL and USA RR>177 cm indices. Two types of stock-recruitment relationships were examined, a two-line model (low recruitment) and a Beverton-Holt model (high recruitment). F current is defined as the geometric mean fishing mortality during 2010 to 2012. The filled black circle is the median results and the open gray circles are estimates from 500 bootstrap runs. The top set of panels shows the status estimates relative to a MSY reference, whereas the bottom panels used F0.1 as a proxy.
1572

Figure 15. WBFT: Projection results for the low recruitment scenario projected at various levels of constant catch. The middle panels show the trends relative to the MSY-based reference points. The bottom panels use the alternative F0.1-based reference points. These trajectories are the median (50%) result of 500 bootstraps.
0
20000
40000
60000
80000
100000
120000
2010 2012 2014 2016 2018 2020
Recr
uits
(n)
YEAR
Recruits (Age 1)0 mt
250 mt
500 mt
750 mt
1000 mt
1250 mt
1500 mt
1750 mt
2000 mt
2250 mt
2500 mt
2750 mt
3000 mt
3250 mt
3500 mt
0
0.5
1
1.5
2
2.5
3
3.5
2010 2012 2014 2016 2018 2020
SSB
/ SS
B M
SY
YEAR
SSB/SSBMSY
0 mt250 mt500 mt750 mt1000 mt1250 mt1500 mt1750 mt2000 mt2250 mt2500 mt2750 mt3000 mt3250 mt3500 mt
0
0.2
0.4
0.6
0.8
1
1.2
1.4
1.6
1.8
2010 2012 2014 2016 2018 2020
SSB
/ SS
B F0
.1
YEAR
SSB / SSB F0.10 mt250 mt500 mt750 mt1000 mt1250 mt1500 mt1750 mt2000 mt2250 mt2500 mt2750 mt3000 mt3250 mt3500 mt
0
0.02
0.04
0.06
0.08
0.1
0.12
0.14
2010 2012 2014 2016 2018 2020
Apic
al F
YEAR
Apical Fishing Mortality3500 mt3250 mt3000 mt2750 mt2500 mt2250 mt2000 mt1750 mt1500 mt1250 mt1000 mt750 mt500 mt250 mt0 mt
F0.1
0
0.05
0.1
0.15
0.2
0.25
2010 2012 2014 2016 2018 2020
Apic
al F
YEAR
Apical Fishing Mortality3500 mt3250 mt3000 mt2750 mt2500 mt2250 mt2000 mt1750 mt1500 mt1250 mt1000 mt750 mt500 mt250 mt0 mt
Fmsy
1573

Figure 16. WBFT: Projection results for the high recruitment scenario projected at various levels of constant catch. The middle panels show the trends relative to the MSY-based reference points. The bottom panels use the alternative F0.1-based reference points. These trajectories are the median (50%) result of 500 bootstraps.
0
20000
40000
60000
80000
100000
120000
140000
160000
180000
2010 2012 2014 2016 2018 2020
Recr
uits
(n)
YEAR
Recruits (Age 1)0 mt
250 mt
500 mt
750 mt
1000 mt
1250 mt
1500 mt
1750 mt
2000 mt
2250 mt
2500 mt
2750 mt
3000 mt
3250 mt
3500 mt
0
0.2
0.4
0.6
0.8
1
1.2
2010 2012 2014 2016 2018 2020
SSB
/ SS
B M
SY
YEAR
SSB/SSBMSY
0 mt250 mt500 mt750 mt1000 mt1250 mt1500 mt1750 mt2000 mt2250 mt2500 mt2750 mt3000 mt3250 mt3500 mt
0
0.2
0.4
0.6
0.8
1
1.2
2010 2012 2014 2016 2018 2020
SSB
/ SS
B F0
.1
YEAR
SSB / SSB F0.10 mt250 mt500 mt750 mt1000 mt1250 mt1500 mt1750 mt2000 mt2250 mt2500 mt2750 mt3000 mt3250 mt3500 mt
0
0.02
0.04
0.06
0.08
0.1
0.12
0.14
2010 2012 2014 2016 2018 2020
Apic
al F
YEAR
Apical Fishing Mortality3500 mt3250 mt3000 mt2750 mt2500 mt2250 mt2000 mt1750 mt1500 mt1250 mt1000 mt750 mt500 mt250 mt0 mt
F0.1
0
0.02
0.04
0.06
0.08
0.1
0.12
0.14
2010 2012 2014 2016 2018 2020
Apic
al F
YEAR
Apical Fishing Mortality3500 mt3250 mt3000 mt2750 mt2500 mt2250 mt2000 mt1750 mt1500 mt1250 mt1000 mt750 mt500 mt250 mt0 mt
Fmsy
1574

60% Probability – Low Recruitment Potential
60% Probability – High Recruitment Potential
Figure 17. WBFT: The projected SSB/SSBMSY and F/FMSY trajectories at various catch levels for the two recruitment scenarios. These trajectories correspond to a 60% probability of achieving a given level of SSB/SSBMSY or F/FMSY.
0
0.5
1
1.5
2
2.5
3
2010 2012 2014 2016 2018 2020
SSB
/ SS
B M
SY
YEAR
SSB/SSBMSY0 mt
500 mt
1000 mt
1500 mt
1750 mt
2000 mt
2500 mt
3000 mt
3500 mt
0
0.05
0.1
0.15
0.2
0.25
2010 2012 2014 2016 2018 2020
Apic
al F
YEAR
Apical Fishing Mortality
3500 mt
3000 mt
2500 mt
2000 mt
1750 mt
1500 mt
1000 mt
500 mt
0 mt
Fmsy
0
0.2
0.4
0.6
0.8
1
1.2
2010 2012 2014 2016 2018 2020
SSB
/ SS
B M
SY
YEAR
SSB/SSBMSY0 mt
500 mt
1000 mt
1500 mt
1750 mt
2000 mt
2500 mt
3000 mt
3500 mt
0
0.02
0.04
0.06
0.08
0.1
0.12
2010 2012 2014 2016 2018 2020
Apic
al F
YEAR
Apical Fishing Mortality
3500 mt
3000 mt
2500 mt
2000 mt
1750 mt
1500 mt
1000 mt
500 mt
0 mt
Fmsy
1575
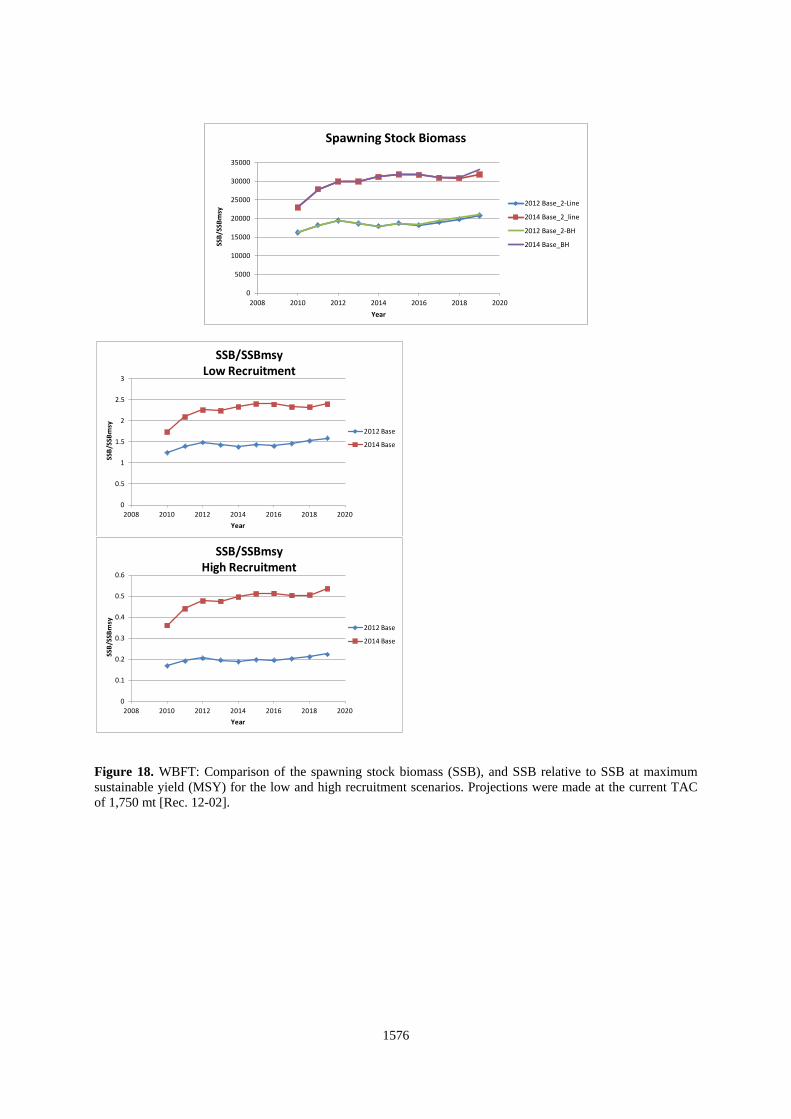
Figure 18. WBFT: Comparison of the spawning stock biomass (SSB), and SSB relative to SSB at maximum sustainable yield (MSY) for the low and high recruitment scenarios. Projections were made at the current TAC of 1,750 mt [Rec. 12-02].
0
5000
10000
15000
20000
25000
30000
35000
2008 2010 2012 2014 2016 2018 2020
SSB/
SSBm
sy
Year
Spawning Stock Biomass
2012 Base_2-Line
2014 Base_2_line
2012 Base_2-BH
2014 Base_BH
0
0.5
1
1.5
2
2.5
3
2008 2010 2012 2014 2016 2018 2020
SSB/
SSBm
sy
Year
SSB/SSBmsy Low Recruitment
2012 Base
2014 Base
0
0.1
0.2
0.3
0.4
0.5
0.6
2008 2010 2012 2014 2016 2018 2020
SSB/
SSBm
sy
Year
SSB/SSBmsy High Recruitment
2012 Base
2014 Base
1576

Appendix 1
Western Bluefin Tuna 2014 Base VPA Program Files
A. VPA-2Box Control File #---------------------------------------------------------------------------- #-- CONTROL FILE FOR PROGRAM VPA-2BOX, Version 3.0 --- #----------------------------------------------------------------------------- # INSTRUCTIONS: the control options are entered in the order specified. # Additional comment lines may be inserted anywhere in this # file provided they are preceded by a # symbol in the FIRST # column, otherwise the line is perceived as free-format data. #----------------------------------------------------------------------------- # #----------------------------------------------------------------------------- # TITLES AND FILE NAMES (MUST BE PLACED WITHIN SINGLE QUOTES) #----------------------------------------------------------------------------- #|--------must be 50 characters or less----------| 'BFT West 1970 to 2013 Continuity 16+ ' TITLE OF RUN 'BFTW2014.D01' DATA FILE NAME (INPUT) 'BFTW2014.P01' PARAMETER SPECIFICATION FILE (INPUT) 'BFTW2014.R01' RESULTS FILE NAME (OUTPUT) 'BFTW2014.E01' PARAMETER ESTIMATE FILE NAME (OUTPUT) 'BFTW2014.SPD' SPREADSHEET FRIENDLY RESULTS (OUTPUT) 'none' TAGGING DATA FILE (INPUT) #----------------------------------------------------------------------------- # MODEL TYPE OPTIONS #----------------------------------------------------------------------------- 1 NUMBER OF ZONES (1 OR 2) 1 MODEL_TYPE (1=DIFFUSION, 2=OVERLAP) #----------------------------------------------------------------------------- # TAGGING DATA SWITCH #----------------------------------------------------------------------------- # tagging data switch (0=do not use tagging data, 1=use tagging data) # | weighting factor for modifying importance of tagging data in objective function # | | tag timing factors # | | | 0 1.0 0 0 TAGGING MODEL CONTROLS #----------------------------------------------------------------------------- # SEARCH ALGORITHM CONTROLS #----------------------------------------------------------------------------- -677 RANDOM NUMBER SEED 50 MAXIMUM NUMBER OF AMOEBA SIMPLEX SEARCH RESTARTS 10 NUMBER OF CONSECUTIVE RESTARTS THAT MUST VARY BY LESS THAN 1% TO STOP SEARCH 0.4 PDEV (standard deviation controlling vertices for Initial simplex of each restart) #----------------------------------------------------------------------------- # INDEX WEIGHTING CONTROLS #----------------------------------------------------------------------------- 1 SCALE (DIVIDE INDEX VALUES BY THEIR MEAN)- ANY VALUE > 0 = YES 1.0 INDEX WEIGHTING:(0)INPUT CV's, (+)DEFAULT CV, (-)DEFAULT STD. DEV., (999)MLE 0 (0) MULTIPLICATIVE VARIANCE SCALING FACTOR or (1) ADDITIVE VARIANCE SCALING FACTOR #----------------------------------------------------------------------------- # CONSTRAINT ON VulnerabilitY (PARTIAL RECRUITMENT) #----------------------------------------------------------------------------- # apply this penalty to the last N years (SET N = 0 TO IGNORE) # | standard deviation controlling the severity of the penalty # | | first age affected # | | | last age affected # | | | | 3 .5 1 15 LINKS THE VULNERABILITIES IN THE LAST N YEARS #----------------------------------------------------------------------------- # CONSTRAINTS ON RECRUITMENT #----------------------------------------------------------------------------- # apply this penalty to the last N years (SET N = 0 TO IGNORE) # | standard deviation controlling the severity of the penalty 0 .1 LINKS THE RECRUITMENTS IN THE LAST N YEARS 0 .1 1 LINKS THE RECRUITMENTS OF THE TWO STOCKS # | # ratio of stock (sex) 1 to stock (sex) 2 {a value of 1 means a 1:1 ratio} #----------------------------------------------------------------------------- # CONSTRAINT ON SPAWNER-RECRUIT RELATIONSHIP #----------------------------------------------------------------------------- # PDF of spawner-recruit penalty: 0=none, 1=lognormal, 2=normal (-)=estimate sigma by MLE # | first and last years to use in fitting (in terms of recruits) # | | 0 1971 1998 PENALIZES DEPARTURES FROM BEVERTON AND HOLT STOCK-RECRUIT CURVE # (note: check the parameter file to make sure you are estimating the S/R # parameters when pdf not 0, or not estimating them when pdf=0)) #----------------------------------------------------------------------------- # PARAMETER ESTIMATION OPTIONS #----------------------------------------------------------------------------- 2 OPTION TO USE (1) F'S OR (2) N'S AS TERMINAL YEAR PARAMETERS -1 ESTIMATE Q IN (+) SEARCH or (<0) by concentrated MLE's #----------------------------------------------------------------------------- # BOOTSTRAP ANALYSES #----------------------------------------------------------------------------- # Number of bootstraps to run (negative value = do a parametric bootstrap) # | Use Stine correction to inflate bootstrap residuals (0=NO) # | | File Output Toggle (- number ASCII, + number BIN) # | | | 0 1 1 BOOTSTRAP OPTION #----------------------------------------------------------------------------- # RETROSPECTIVE ANALYSES (CANNOT DO RETROSPECTIVE ANALYSES AND BOOTSTRAPS AT SAME TIME) #----------------------------------------------------------------------------- 0 NUMBER OF YEARS TO GO BACK FOR RETROSPECTIVE ANALYSES @@EOF@@@@@@@@@@@@@@@@@@@@@@@@@@@@@@@@@@@@@@@@@@@@@@@@@@@@@@@@@@@@
1577

B. VPA 2-Box Data File
############################################################################## # DATA FILE FOR PROGRAM VPA-2BOX, Version 3.0 # The data and specifications are entered in the order indicated # by the existing comments. Additional comments must be preceded by a # symbol # in the first column, otherwise the line is perceived as free format input. ############################################################################## 1970 2013 FIRST AND LAST YEAR 1 16 16 16 FIRST AGE, LAST AGE, PLUSGROUP AGE, Expanded plusgroup ############################################################################### # BEGIN INPUT FOR ZONE/STOCK 1 ############################################################################### 16 6 SPAWNING SEASON (elapsed months, 0 is beginning of year) # Age 1 Age 2 Age 3 Age 4 Age 5 Age 6 Age 7 Age 8 Age 9 Age 10 Age 11 Age 12 Age 13 Age 14 Age 15 Age 16 0 0 0 0 0 0 0 0 1 1 1 1 1 1 1 1 FECUNDITY MODIFIER (MATURITY) AT AGE # 50 CHARACTER TITLE WITHIN SINGLE QUOTES ‘ ’ ----->] PDF OF CATCH # | | SIGMA CATCH 'Western Bluefin Tuna Assessment' 0 .1 #============================================================================== # NOW ENTER THE CATCH-AT-AGE DATA. ROW=YEAR, COLUMN=AGE #============================================================================== #YEAR 1 2 3 4 5 6 7 8 9 10 11 12 13 14 15 16 1970 58920 104298 127233 17510 6528 1430 463 161 43 259 435 436 655 732 593 1299 1971 62033 152003 37948 46241 456 865 1357 1661 1180 758 805 797 1030 1090 968 2078 1972 45351 98312 33605 2514 3963 1222 92 470 465 292 185 403 730 1053 929 2372 1973 5065 73591 29957 5877 2254 2443 387 652 1270 829 265 506 643 696 587 2103 1974 55806 19939 20430 5639 2972 1448 640 739 595 609 869 516 600 2027 1425 7855 1975 43303 147653 6554 13155 907 709 283 253 419 775 1290 1058 1080 1202 1395 4813 1976 5532 19427 71850 2576 2743 1062 200 117 702 679 480 844 1802 2179 2176 6992 1977 1508 22182 9014 28496 7931 2699 2592 546 309 607 947 971 830 1157 1619 8751 1978 5564 10530 18969 4889 8281 7341 1392 447 405 252 208 348 536 588 1181 9324 1979 2828 10585 15537 8581 9754 1861 2843 1946 554 349 359 458 771 1137 1525 8423 1980 3246 16081 9991 8124 4129 1552 2327 4658 3447 973 599 584 620 685 1088 9286 1981 6290 9814 16530 3729 5692 3462 2613 2191 2271 2470 1392 1101 833 737 611 7370 1982 3608 3652 1517 523 245 460 490 391 297 500 662 600 458 239 176 1603 1983 3474 2463 3091 771 615 860 705 1102 953 773 682 585 739 705 463 2717 1984 1126 7240 1691 1493 2005 1577 927 451 521 642 702 743 676 858 551 1775 1985 776 5395 12162 2131 3523 3880 1957 728 480 436 457 612 834 794 1066 2194 1986 967 5898 6478 2914 1437 1177 1136 657 436 381 303 366 607 670 863 2701 1987 2326 12579 8766 4517 3830 3741 1240 1316 985 1037 507 414 441 492 501 1578 1988 4935 9303 11087 3821 3362 3299 3132 1575 1064 926 902 619 546 523 526 1765 1989 842 12925 1542 3104 2519 1480 1621 2160 1615 1090 835 900 716 641 575 1921 1990 2993 3583 17800 1798 2207 2135 1141 1308 1646 1534 885 681 611 522 531 1789 1991 4111 14055 10072 3081 1944 1484 1836 1727 1536 1457 1110 902 628 583 544 1514 1992 589 6088 1922 1053 1187 1332 871 1639 1723 935 932 980 849 663 481 1577 1993 416 1066 4385 3482 2276 1429 1644 1232 1749 1641 831 569 472 360 286 1326 1994 2052 720 1235 2140 2516 1828 1154 1519 2232 1082 937 793 469 399 257 1076 1995 933 1347 3242 2979 2860 4258 1310 609 883 1584 1015 637 505 402 366 1549 1996 526 9349 1676 4657 3341 1122 1385 2318 806 636 1015 909 671 502 429 1522 1997 249 1103 6392 928 1338 1502 1357 1816 1851 1138 605 609 736 672 537 1548 1998 341 889 3486 3483 652 1136 756 1436 2321 2586 1353 725 681 731 486 1437 1999 102 560 1946 1849 1760 799 743 1817 1402 1803 1879 1677 1096 735 577 1583 2000 98 287 1053 1174 3599 3127 1661 1321 1275 1204 1051 1140 1093 824 489 1497 2001 1430 361 2402 4352 987 1303 1748 2227 735 960 1193 1319 1282 1068 753 1481 2002 847 5559 4081 4528 4581 1305 990 2962 2542 1576 1124 949 1124 1056 957 1632 2003 283 2704 4521 3661 1874 1466 327 1314 2155 1633 853 444 585 570 648 1424 2004 814 2674 6944 2586 2752 2907 1454 1522 999 1018 769 582 492 336 331 1139
1578

2005 721 4890 2470 2561 1083 840 688 977 840 703 992 1041 653 424 405 1146 2006 211 630 1245 1746 2452 2004 1063 1073 1373 1253 914 775 572 397 520 1380 2007 65 258 6687 9284 2119 1794 1214 664 575 353 469 402 341 270 253 856 2008 85 788 2292 2102 6401 1614 1797 1829 1190 850 677 415 376 272 364 1059 2009 72 222 2192 1194 987 4540 1559 713 986 876 705 476 337 387 409 1217 2010 66 1097 840 1830 635 632 691 1901 730 995 1094 629 439 438 471 1262 2011 3 560 1617 1592 2055 1261 556 2789 2172 643 624 614 540 431 343 1178 2012 110 404 1854 1212 466 606 692 718 1231 1614 1144 476 489 388 419 1143 2013 48 268 557 1254 196 555 588 957 601 599 923 792 509 352 354 999 -1 end of catch data #============================================================================== # NOW ENTER IN THE ABUNDANCE INDEX SPECIFICATIONS #============================================================================== #INDEX PDF (0= do not use,1=lognormal, 2=normal) #| | UNITS (1 = numbers, 2 = biomass) #| | | VULNERABILITY (1=fixed, 2=frac.catches, 3=part. catches, 4=Butt. & Gero. #| | | | TIMING (-1=average, +integer = number of months elapased} #| | | | | FIRST TO LAST AGE INDEX TITLE (IN SINGLE QUOTES) 1 1 1 4 -1 8 16 'CAN_GSL' 2 1 1 4 -1 5 16 'CAN_SWNS' 3 1 1 4 -1 1 5 'US_RR<145' 4 1 1 4 -1 2 3 'US_RR_66_114' 5 1 1 4 -1 4 5 'US_RR_115_144' 6 0 1 4 -1 6 8 'US_RR_145_177' 7 1 1 4 -1 10 16 'US_RR>195' 8 0 1 4 -1 10 16 'US_RR>195_COMB' 9 1 1 4 -1 8 16 'US_RR>177' 10 1 1 4 0 2 16 'JLL_AREA_2_(WEST)' 11 0 1 4 0 2 16 'JLL_AREA_3_(31+32)' 12 0 1 4 0 2 16 'JLL_AREAS_17+18' 13 1 2 4 -1 9 16 'LARVAL_ZERO_INFLATED' 14 1 1 4 0 9 16 'GOM_PLL_1-6' 15 1 1 4 0 9 16 'JLL_GOM' 16 1 1 1 -1 1 3 'TAGGING' -1 end index specifications #============================================================================== # NOW ENTER IN THE INDICES OF ABUNDANCE #============================================================================== #ID YEAR INDEX CV INDEX_NAME 1 1970 -999 -999 'CAN_GSL' 1 1971 -999 -999 'CAN_GSL' 1 1972 -999 -999 'CAN_GSL' 1 1973 -999 -999 'CAN_GSL' 1 1974 -999 -999 'CAN_GSL' 1 1975 -999 -999 'CAN_GSL' 1 1976 -999 -999 'CAN_GSL' 1 1977 -999 -999 'CAN_GSL' 1 1978 -999 -999 'CAN_GSL' 1 1979 -999 -999 'CAN_GSL' 1 1980 -999 -999 'CAN_GSL' 1 1981 1.32 0.16 'CAN_GSL' 1 1982 0.60 0.38 'CAN_GSL' 1 1983 1.54 0.10 'CAN_GSL' 1 1984 0.85 0.09 'CAN_GSL' 1 1985 0.21 0.23 'CAN_GSL' 1 1986 0.24 0.22 'CAN_GSL' 1 1987 0.32 0.32 'CAN_GSL' 1 1988 0.53 0.25 'CAN_GSL' 1 1989 0.65 0.28 'CAN_GSL' 1 1990 0.19 0.27 'CAN_GSL' 1 1991 0.65 0.22 'CAN_GSL' 1 1992 1.45 0.20 'CAN_GSL'
1579

1 1993 0.90 0.13 'CAN_GSL' 1 1994 0.25 0.13 'CAN_GSL' 1 1995 0.72 0.09 'CAN_GSL' 1 1996 0.08 0.20 'CAN_GSL' 1 1997 0.13 0.17 'CAN_GSL' 1 1998 0.24 0.15 'CAN_GSL' 1 1999 0.42 0.12 'CAN_GSL' 1 2000 0.32 0.13 'CAN_GSL' 1 2001 0.29 0.16 'CAN_GSL' 1 2002 0.45 0.13 'CAN_GSL' 1 2003 0.83 0.09 'CAN_GSL' 1 2004 1.08 0.10 'CAN_GSL' 1 2005 1.04 0.08 'CAN_GSL' 1 2006 1.14 0.09 'CAN_GSL' 1 2007 2.28 0.15 'CAN_GSL' 1 2008 1.74 0.11 'CAN_GSL' 1 2009 2.56 0.16 'CAN_GSL' 1 2010 -999 -999 'CAN_GSL' 1 2011 3.70 0.11 'CAN_GSL' 1 2012 5.62 0.11 'CAN_GSL' 1 2013 4.81 0.09 'CAN_GSL' 2 1970 -999 -999 'CAN_SWNS' 2 1971 -999 -999 'CAN_SWNS' 2 1972 -999 -999 'CAN_SWNS' 2 1973 -999 -999 'CAN_SWNS' 2 1974 -999 -999 'CAN_SWNS' 2 1975 -999 -999 'CAN_SWNS' 2 1976 -999 -999 'CAN_SWNS' 2 1977 -999 -999 'CAN_SWNS' 2 1978 -999 -999 'CAN_SWNS' 2 1979 -999 -999 'CAN_SWNS' 2 1980 -999 -999 'CAN_SWNS' 2 1981 -999 -999 'CAN_SWNS' 2 1982 -999 -999 'CAN_SWNS' 2 1983 -999 -999 'CAN_SWNS' 2 1984 -999 -999 'CAN_SWNS' 2 1985 -999 -999 'CAN_SWNS' 2 1986 -999 -999 'CAN_SWNS' 2 1987 -999 -999 'CAN_SWNS' 2 1988 13.86 0.19 'CAN_SWNS' 2 1989 13.03 0.18 'CAN_SWNS' 2 1990 12.32 0.18 'CAN_SWNS' 2 1991 9.51 0.19 'CAN_SWNS' 2 1992 9.41 0.18 'CAN_SWNS' 2 1993 6.09 0.19 'CAN_SWNS' 2 1994 7.28 0.18 'CAN_SWNS' 2 1995 7.04 0.19 'CAN_SWNS' 2 1996 5.56 0.18 'CAN_SWNS' 2 1997 4.48 0.17 'CAN_SWNS' 2 1998 7.95 0.17 'CAN_SWNS' 2 1999 10.82 0.18 'CAN_SWNS' 2 2000 4.66 0.18 'CAN_SWNS' 2 2001 9.37 0.19 'CAN_SWNS' 2 2002 11.49 0.18 'CAN_SWNS' 2 2003 15.90 0.18 'CAN_SWNS' 2 2004 9.15 0.19 'CAN_SWNS' 2 2005 10.55 0.17 'CAN_SWNS' 2 2006 11.66 0.18 'CAN_SWNS' 2 2007 9.48 0.18 'CAN_SWNS' 2 2008 13.65 0.20 'CAN_SWNS' 2 2009 10.57 0.18 'CAN_SWNS' 2 2010 9.18 0.21 'CAN_SWNS' 2 2011 10.43 0.21 'CAN_SWNS' 2 2012 9.66 0.20 'CAN_SWNS' 2 2013 5.34 0.19 'CAN_SWNS' 3 1970 -999 -999 'US_RR<145' 3 1971 -999 -999 'US_RR<145' 3 1972 -999 -999 'US_RR<145' 3 1973 -999 -999 'US_RR<145' 3 1974 -999 -999 'US_RR<145' 3 1975 -999 -999 'US_RR<145' 3 1976 -999 -999 'US_RR<145' 3 1977 -999 -999 'US_RR<145' 3 1978 -999 -999 'US_RR<145' 3 1979 -999 -999 'US_RR<145' 3 1980 0.80 0.43 'US_RR<145' 3 1981 0.40 0.52 'US_RR<145' 3 1982 2.10 0.33 'US_RR<145' 3 1983 1.11 0.26 'US_RR<145' 3 1984 -999 -999 'US_RR<145' 3 1985 0.63 0.64 'US_RR<145' 3 1986 0.78 0.43 'US_RR<145' 3 1987 1.22 0.40 'US_RR<145' 3 1988 0.99 0.38 'US_RR<145' 3 1989 0.99 0.43 'US_RR<145' 3 1990 0.90 0.34 'US_RR<145' 3 1991 1.26 0.35 'US_RR<145' 3 1992 0.82 0.42 'US_RR<145' 3 1993 -999 -999 'US_RR<145' 3 1994 -999 -999 'US_RR<145' 3 1995 -999 -999 'US_RR<145' 3 1996 -999 -999 'US_RR<145' 3 1997 -999 -999 'US_RR<145' 3 1998 -999 -999 'US_RR<145' 3 1999 -999 -999 'US_RR<145' 3 2000 -999 -999 'US_RR<145' 3 2001 -999 -999 'US_RR<145' 3 2002 -999 -999 'US_RR<145' 3 2003 -999 -999 'US_RR<145' 3 2004 -999 -999 'US_RR<145' 3 2005 -999 -999 'US_RR<145'
1580

3 2006 -999 -999 'US_RR<145' 3 2007 -999 -999 'US_RR<145' 3 2008 -999 -999 'US_RR<145' 3 2009 -999 -999 'US_RR<145' 3 2010 -999 -999 'US_RR<145' 3 2011 -999 -999 'US_RR<145' 3 2012 -999 -999 'US_RR<145' 3 2013 -999 -999 'US_RR<145' 4 1970 -999 -999 'US_RR_66_114' 4 1971 -999 -999 'US_RR_66_114' 4 1972 -999 -999 'US_RR_66_114' 4 1973 -999 -999 'US_RR_66_114' 4 1974 -999 -999 'US_RR_66_114' 4 1975 -999 -999 'US_RR_66_114' 4 1976 -999 -999 'US_RR_66_114' 4 1977 -999 -999 'US_RR_66_114' 4 1978 -999 -999 'US_RR_66_114' 4 1979 -999 -999 'US_RR_66_114' 4 1980 -999 -999 'US_RR_66_114' 4 1981 -999 -999 'US_RR_66_114' 4 1982 -999 -999 'US_RR_66_114' 4 1983 -999 -999 'US_RR_66_114' 4 1984 -999 -999 'US_RR_66_114' 4 1985 -999 -999 'US_RR_66_114' 4 1986 -999 -999 'US_RR_66_114' 4 1987 -999 -999 'US_RR_66_114' 4 1988 -999 -999 'US_RR_66_114' 4 1989 -999 -999 'US_RR_66_114' 4 1990 -999 -999 'US_RR_66_114' 4 1991 -999 -999 'US_RR_66_114' 4 1992 -999 -999 'US_RR_66_114' 4 1993 1.10 0.36 'US_RR_66_114' 4 1994 0.26 0.45 'US_RR_66_114' 4 1995 1.11 0.35 'US_RR_66_114' 4 1996 1.63 0.38 'US_RR_66_114' 4 1997 2.37 0.33 'US_RR_66_114' 4 1998 1.39 0.37 'US_RR_66_114' 4 1999 1.33 0.43 'US_RR_66_114' 4 2000 0.95 0.50 'US_RR_66_114' 4 2001 0.46 0.35 'US_RR_66_114' 4 2002 1.48 0.40 'US_RR_66_114' 4 2003 0.41 0.35 'US_RR_66_114' 4 2004 2.23 0.32 'US_RR_66_114' 4 2005 2.18 0.32 'US_RR_66_114' 4 2006 0.58 0.35 'US_RR_66_114' 4 2007 0.45 0.31 'US_RR_66_114' 4 2008 0.35 0.33 'US_RR_66_114' 4 2009 0.35 0.33 'US_RR_66_114' 4 2010 0.61 0.33 'US_RR_66_114' 4 2011 0.80 0.35 'US_RR_66_114' 4 2012 0.40 0.41 'US_RR_66_114' 4 2013 0.55 0.36 'US_RR_66_114' 5 1970 -999 -999 'US_RR_115_144' 5 1971 -999 -999 'US_RR_115_144' 5 1972 -999 -999 'US_RR_115_144' 5 1973 -999 -999 'US_RR_115_144' 5 1974 -999 -999 'US_RR_115_144' 5 1975 -999 -999 'US_RR_115_144' 5 1976 -999 -999 'US_RR_115_144' 5 1977 -999 -999 'US_RR_115_144' 5 1978 -999 -999 'US_RR_115_144' 5 1979 -999 -999 'US_RR_115_144' 5 1980 -999 -999 'US_RR_115_144' 5 1981 -999 -999 'US_RR_115_144' 5 1982 -999 -999 'US_RR_115_144' 5 1983 -999 -999 'US_RR_115_144' 5 1984 -999 -999 'US_RR_115_144' 5 1985 -999 -999 'US_RR_115_144' 5 1986 -999 -999 'US_RR_115_144' 5 1987 -999 -999 'US_RR_115_144' 5 1988 -999 -999 'US_RR_115_144' 5 1989 -999 -999 'US_RR_115_144' 5 1990 -999 -999 'US_RR_115_144' 5 1991 -999 -999 'US_RR_115_144' 5 1992 -999 -999 'US_RR_115_144' 5 1993 0.99 0.41 'US_RR_115_144' 5 1994 0.26 0.55 'US_RR_115_144' 5 1995 0.63 0.41 'US_RR_115_144' 5 1996 0.73 0.48 'US_RR_115_144' 5 1997 0.24 0.48 'US_RR_115_144' 5 1998 0.90 0.38 'US_RR_115_144' 5 1999 0.77 0.51 'US_RR_115_144' 5 2000 1.27 0.56 'US_RR_115_144' 5 2001 1.36 0.39 'US_RR_115_144' 5 2002 2.60 0.45 'US_RR_115_144' 5 2003 0.59 0.39 'US_RR_115_144' 5 2004 0.67 0.38 'US_RR_115_144' 5 2005 0.63 0.38 'US_RR_115_144' 5 2006 1.46 0.38 'US_RR_115_144' 5 2007 1.48 0.35 'US_RR_115_144' 5 2008 1.38 0.36 'US_RR_115_144' 5 2009 0.39 0.40 'US_RR_115_144' 5 2010 1.24 0.37 'US_RR_115_144' 5 2011 1.27 0.41 'US_RR_115_144' 5 2012 1.11 0.46 'US_RR_115_144' 5 2013 1.04 0.43 'US_RR_115_144' 6 1970 -999 -999 'US_RR_145_177' 6 1971 -999 -999 'US_RR_145_177' 6 1972 -999 -999 'US_RR_145_177' 6 1973 -999 -999 'US_RR_145_177' 6 1974 -999 -999 'US_RR_145_177'
1581

6 1975 -999 -999 'US_RR_145_177' 6 1976 -999 -999 'US_RR_145_177' 6 1977 -999 -999 'US_RR_145_177' 6 1978 -999 -999 'US_RR_145_177' 6 1979 -999 -999 'US_RR_145_177' 6 1980 -999 -999 'US_RR_145_177' 6 1981 -999 -999 'US_RR_145_177' 6 1982 -999 -999 'US_RR_145_177' 6 1983 -999 -999 'US_RR_145_177' 6 1984 -999 -999 'US_RR_145_177' 6 1985 -999 -999 'US_RR_145_177' 6 1986 -999 -999 'US_RR_145_177' 6 1987 -999 -999 'US_RR_145_177' 6 1988 -999 -999 'US_RR_145_177' 6 1989 -999 -999 'US_RR_145_177' 6 1990 -999 -999 'US_RR_145_177' 6 1991 -999 -999 'US_RR_145_177' 6 1992 -999 -999 'US_RR_145_177' 6 1993 0.31 3.74 'US_RR_145_177' 6 1994 0.38 3.12 'US_RR_145_177' 6 1995 1.33 1.78 'US_RR_145_177' 6 1996 0.70 2.72 'US_RR_145_177' 6 1997 0.46 3.05 'US_RR_145_177' 6 1998 0.36 3.46 'US_RR_145_177' 6 1999 1.07 2.06 'US_RR_145_177' 6 2000 0.96 2.06 'US_RR_145_177' 6 2001 3.42 2.57 'US_RR_145_177' 6 2002 -999 -999 'US_RR_145_177' 6 2003 -999 -999 'US_RR_145_177' 6 2004 -999 -999 'US_RR_145_177' 6 2005 -999 -999 'US_RR_145_177' 6 2006 -999 -999 'US_RR_145_177' 6 2007 -999 -999 'US_RR_145_177' 6 2008 -999 -999 'US_RR_145_177' 6 2009 -999 -999 'US_RR_145_177' 6 2010 -999 -999 'US_RR_145_177' 6 2011 -999 -999 'US_RR_145_177' 6 2012 -999 -999 'US_RR_145_177' 6 2013 -999 -999 'US_RR_145_177' 7 1970 -999 -999 'US_RR>195' 7 1971 -999 -999 'US_RR>195' 7 1972 -999 -999 'US_RR>195' 7 1973 -999 -999 'US_RR>195' 7 1974 -999 -999 'US_RR>195' 7 1975 -999 -999 'US_RR>195' 7 1976 -999 -999 'US_RR>195' 7 1977 -999 -999 'US_RR>195' 7 1978 -999 -999 'US_RR>195' 7 1979 -999 -999 'US_RR>195' 7 1980 -999 -999 'US_RR>195' 7 1981 -999 -999 'US_RR>195' 7 1982 -999 -999 'US_RR>195' 7 1983 2.81 0.10 'US_RR>195' 7 1984 1.25 0.19 'US_RR>195' 7 1985 0.86 0.30 'US_RR>195' 7 1986 0.50 1.10 'US_RR>195' 7 1987 0.53 0.48 'US_RR>195' 7 1988 0.94 0.36 'US_RR>195' 7 1989 0.76 0.36 'US_RR>195' 7 1990 0.63 0.34 'US_RR>195' 7 1991 0.82 0.28 'US_RR>195' 7 1992 0.91 0.28 'US_RR>195' 7 1993 -999 -999 'US_RR>195' 7 1994 -999 -999 'US_RR>195' 7 1995 -999 -999 'US_RR>195' 7 1996 -999 -999 'US_RR>195' 7 1997 -999 -999 'US_RR>195' 7 1998 -999 -999 'US_RR>195' 7 1999 -999 -999 'US_RR>195' 7 2000 -999 -999 'US_RR>195' 7 2001 -999 -999 'US_RR>195' 7 2002 -999 -999 'US_RR>195' 7 2003 -999 -999 'US_RR>195' 7 2004 -999 -999 'US_RR>195' 7 2005 -999 -999 'US_RR>195' 7 2006 -999 -999 'US_RR>195' 7 2007 -999 -999 'US_RR>195' 7 2008 -999 -999 'US_RR>195' 7 2009 -999 -999 'US_RR>195' 7 2010 -999 -999 'US_RR>195' 7 2011 -999 -999 'US_RR>195' 7 2012 -999 -999 'US_RR>195' 7 2013 -999 -999 'US_RR>195' 8 1970 -999 -999 'US_RR>195_COMB' 8 1971 -999 -999 'US_RR>195_COMB' 8 1972 -999 -999 'US_RR>195_COMB' 8 1973 -999 -999 'US_RR>195_COMB' 8 1974 -999 -999 'US_RR>195_COMB' 8 1975 -999 -999 'US_RR>195_COMB' 8 1976 -999 -999 'US_RR>195_COMB' 8 1977 -999 -999 'US_RR>195_COMB' 8 1978 -999 -999 'US_RR>195_COMB' 8 1979 -999 -999 'US_RR>195_COMB' 8 1980 -999 -999 'US_RR>195_COMB' 8 1981 -999 -999 'US_RR>195_COMB' 8 1982 -999 -999 'US_RR>195_COMB' 8 1983 -999 -999 'US_RR>195_COMB' 8 1984 -999 -999 'US_RR>195_COMB' 8 1985 -999 -999 'US_RR>195_COMB' 8 1986 -999 -999 'US_RR>195_COMB' 8 1987 -999 -999 'US_RR>195_COMB'
1582

8 1988 -999 -999 'US_RR>195_COMB' 8 1989 -999 -999 'US_RR>195_COMB' 8 1990 -999 -999 'US_RR>195_COMB' 8 1991 -999 -999 'US_RR>195_COMB' 8 1992 -999 -999 'US_RR>195_COMB' 8 1993 -999 -999 'US_RR>195_COMB' 8 1994 -999 -999 'US_RR>195_COMB' 8 1995 -999 -999 'US_RR>195_COMB' 8 1996 -999 -999 'US_RR>195_COMB' 8 1997 -999 -999 'US_RR>195_COMB' 8 1998 -999 -999 'US_RR>195_COMB' 8 1999 -999 -999 'US_RR>195_COMB' 8 2000 -999 -999 'US_RR>195_COMB' 8 2001 -999 -999 'US_RR>195_COMB' 8 2002 -999 -999 'US_RR>195_COMB' 8 2003 -999 -999 'US_RR>195_COMB' 8 2004 -999 -999 'US_RR>195_COMB' 8 2005 -999 -999 'US_RR>195_COMB' 8 2006 -999 -999 'US_RR>195_COMB' 8 2007 -999 -999 'US_RR>195_COMB' 8 2008 -999 -999 'US_RR>195_COMB' 8 2009 -999 -999 'US_RR>195_COMB' 8 2010 -999 -999 'US_RR>195_COMB' 8 2011 -999 -999 'US_RR>195_COMB' 8 2012 -999 -999 'US_RR>195_COMB' 8 2013 -999 -999 'US_RR>195_COMB' 9 1970 -999 -999 'US_RR>177' 9 1971 -999 -999 'US_RR>177' 9 1972 -999 -999 'US_RR>177' 9 1973 -999 -999 'US_RR>177' 9 1974 -999 -999 'US_RR>177' 9 1975 -999 -999 'US_RR>177' 9 1976 -999 -999 'US_RR>177' 9 1977 -999 -999 'US_RR>177' 9 1978 -999 -999 'US_RR>177' 9 1979 -999 -999 'US_RR>177' 9 1980 -999 -999 'US_RR>177' 9 1981 -999 -999 'US_RR>177' 9 1982 -999 -999 'US_RR>177' 9 1983 -999 -999 'US_RR>177' 9 1984 -999 -999 'US_RR>177' 9 1985 -999 -999 'US_RR>177' 9 1986 -999 -999 'US_RR>177' 9 1987 -999 -999 'US_RR>177' 9 1988 -999 -999 'US_RR>177' 9 1989 -999 -999 'US_RR>177' 9 1990 -999 -999 'US_RR>177' 9 1991 -999 -999 'US_RR>177' 9 1992 -999 -999 'US_RR>177' 9 1993 0.69 0.31 'US_RR>177' 9 1994 0.94 0.29 'US_RR>177' 9 1995 1.13 0.27 'US_RR>177' 9 1996 3.33 0.26 'US_RR>177' 9 1997 1.50 0.37 'US_RR>177' 9 1998 1.62 0.26 'US_RR>177' 9 1999 1.88 0.29 'US_RR>177' 9 2000 0.63 0.28 'US_RR>177' 9 2001 1.38 0.30 'US_RR>177' 9 2002 1.94 0.24 'US_RR>177' 9 2003 0.45 0.29 'US_RR>177' 9 2004 0.74 0.28 'US_RR>177' 9 2005 0.65 0.27 'US_RR>177' 9 2006 0.43 0.38 'US_RR>177' 9 2007 0.33 0.37 'US_RR>177' 9 2008 0.40 0.36 'US_RR>177' 9 2009 0.29 0.40 'US_RR>177' 9 2010 0.94 0.27 'US_RR>177' 9 2011 0.59 0.30 'US_RR>177' 9 2012 0.65 0.27 'US_RR>177' 9 2013 0.50 0.29 'US_RR>177' 10 1970 -999 -999 'JLL_AREA_2_(WEST)' 10 1971 -999 -999 'JLL_AREA_2_(WEST)' 10 1972 -999 -999 'JLL_AREA_2_(WEST)' 10 1973 -999 -999 'JLL_AREA_2_(WEST)' 10 1974 -999 -999 'JLL_AREA_2_(WEST)' 10 1975 -999 -999 'JLL_AREA_2_(WEST)' 10 1976 0.61 0.43 'JLL_AREA_2_(WEST)' 10 1977 2.36 0.22 'JLL_AREA_2_(WEST)' 10 1978 1.14 0.29 'JLL_AREA_2_(WEST)' 10 1979 0.78 0.25 'JLL_AREA_2_(WEST)' 10 1980 1.49 0.21 'JLL_AREA_2_(WEST)' 10 1981 1.93 0.16 'JLL_AREA_2_(WEST)' 10 1982 0.71 0.25 'JLL_AREA_2_(WEST)' 10 1983 0.43 0.32 'JLL_AREA_2_(WEST)' 10 1984 1.02 0.22 'JLL_AREA_2_(WEST)' 10 1985 1.18 0.21 'JLL_AREA_2_(WEST)' 10 1986 0.09 0.60 'JLL_AREA_2_(WEST)' 10 1987 0.78 0.26 'JLL_AREA_2_(WEST)' 10 1988 1.18 0.21 'JLL_AREA_2_(WEST)' 10 1989 0.99 0.21 'JLL_AREA_2_(WEST)' 10 1990 0.82 0.24 'JLL_AREA_2_(WEST)' 10 1991 0.82 0.26 'JLL_AREA_2_(WEST)' 10 1992 1.25 0.21 'JLL_AREA_2_(WEST)' 10 1993 1.23 0.23 'JLL_AREA_2_(WEST)' 10 1994 1.14 0.22 'JLL_AREA_2_(WEST)' 10 1995 0.84 0.29 'JLL_AREA_2_(WEST)' 10 1996 2.11 0.20 'JLL_AREA_2_(WEST)' 10 1997 1.30 0.25 'JLL_AREA_2_(WEST)' 10 1998 0.61 0.29 'JLL_AREA_2_(WEST)' 10 1999 0.66 0.31 'JLL_AREA_2_(WEST)' 10 2000 0.82 0.27 'JLL_AREA_2_(WEST)'
1583
10 2001 0.52 0.40 'JLL_AREA_2_(WEST)' 10 2002 0.61 0.31 'JLL_AREA_2_(WEST)' 10 2003 0.60 0.40 'JLL_AREA_2_(WEST)' 10 2004 0.53 0.39 'JLL_AREA_2_(WEST)' 10 2005 0.64 0.23 'JLL_AREA_2_(WEST)' 10 2006 1.10 0.23 'JLL_AREA_2_(WEST)' 10 2007 1.69 0.23 'JLL_AREA_2_(WEST)' 10 2008 0.73 0.35 'JLL_AREA_2_(WEST)' 10 2009 1.68 0.33 'JLL_AREA_2_(WEST)' 10 2010 0.61 0.37 'JLL_AREA_2_(WEST)' 10 2011 2.59 0.24 'JLL_AREA_2_(WEST)' 10 2012 3.61 0.30 'JLL_AREA_2_(WEST)' 10 2013 2.62 0.26 'JLL_AREA_2_(WEST)' 11 1970 -999 -999 'JLL_AREA_3_(31+32)' 11 1971 -999 -999 'JLL_AREA_3_(31+32)' 11 1972 -999 -999 'JLL_AREA_3_(31+32)' 11 1973 -999 -999 'JLL_AREA_3_(31+32)' 11 1974 -999 -999 'JLL_AREA_3_(31+32)' 11 1975 -999 -999 'JLL_AREA_3_(31+32)' 11 1976 -999 -999 'JLL_AREA_3_(31+32)' 11 1977 -999 -999 'JLL_AREA_3_(31+32)' 11 1978 -999 -999 'JLL_AREA_3_(31+32)' 11 1979 -999 -999 'JLL_AREA_3_(31+32)' 11 1980 -999 -999 'JLL_AREA_3_(31+32)' 11 1981 -999 -999 'JLL_AREA_3_(31+32)' 11 1982 -999 -999 'JLL_AREA_3_(31+32)' 11 1983 -999 -999 'JLL_AREA_3_(31+32)' 11 1984 -999 -999 'JLL_AREA_3_(31+32)' 11 1985 -999 -999 'JLL_AREA_3_(31+32)' 11 1986 -999 -999 'JLL_AREA_3_(31+32)' 11 1987 -999 -999 'JLL_AREA_3_(31+32)' 11 1988 -999 -999 'JLL_AREA_3_(31+32)' 11 1989 -999 -999 'JLL_AREA_3_(31+32)' 11 1990 -999 -999 'JLL_AREA_3_(31+32)' 11 1991 -999 -999 'JLL_AREA_3_(31+32)' 11 1992 -999 -999 'JLL_AREA_3_(31+32)' 11 1993 -999 -999 'JLL_AREA_3_(31+32)' 11 1994 -999 -999 'JLL_AREA_3_(31+32)' 11 1995 -999 -999 'JLL_AREA_3_(31+32)' 11 1996 -999 -999 'JLL_AREA_3_(31+32)' 11 1997 -999 -999 'JLL_AREA_3_(31+32)' 11 1998 -999 -999 'JLL_AREA_3_(31+32)' 11 1999 -999 -999 'JLL_AREA_3_(31+32)' 11 2000 -999 -999 'JLL_AREA_3_(31+32)' 11 2001 -999 -999 'JLL_AREA_3_(31+32)' 11 2002 -999 -999 'JLL_AREA_3_(31+32)' 11 2003 -999 -999 'JLL_AREA_3_(31+32)' 11 2004 -999 -999 'JLL_AREA_3_(31+32)' 11 2005 -999 -999 'JLL_AREA_3_(31+32)' 11 2006 -999 -999 'JLL_AREA_3_(31+32)' 11 2007 -999 -999 'JLL_AREA_3_(31+32)' 11 2008 -999 -999 'JLL_AREA_3_(31+32)' 11 2009 -999 -999 'JLL_AREA_3_(31+32)' 11 2010 -999 -999 'JLL_AREA_3_(31+32)' 11 2011 -999 -999 'JLL_AREA_3_(31+32)' 11 2012 -999 -999 'JLL_AREA_3_(31+32)' 11 2013 -999 -999 'JLL_AREA_3_(31+32)' 12 1970 -999 -999 'JLL_AREAS_17+18' 12 1971 -999 -999 'JLL_AREAS_17+18' 12 1972 -999 -999 'JLL_AREAS_17+18' 12 1973 -999 -999 'JLL_AREAS_17+18' 12 1974 -999 -999 'JLL_AREAS_17+18' 12 1975 -999 -999 'JLL_AREAS_17+18' 12 1976 -999 -999 'JLL_AREAS_17+18' 12 1977 -999 -999 'JLL_AREAS_17+18' 12 1978 -999 -999 'JLL_AREAS_17+18' 12 1979 -999 -999 'JLL_AREAS_17+18' 12 1980 -999 -999 'JLL_AREAS_17+18' 12 1981 -999 -999 'JLL_AREAS_17+18' 12 1982 -999 -999 'JLL_AREAS_17+18' 12 1983 -999 -999 'JLL_AREAS_17+18' 12 1984 -999 -999 'JLL_AREAS_17+18' 12 1985 -999 -999 'JLL_AREAS_17+18' 12 1986 -999 -999 'JLL_AREAS_17+18' 12 1987 -999 -999 'JLL_AREAS_17+18' 12 1988 -999 -999 'JLL_AREAS_17+18' 12 1989 -999 -999 'JLL_AREAS_17+18' 12 1990 -999 -999 'JLL_AREAS_17+18' 12 1991 -999 -999 'JLL_AREAS_17+18' 12 1992 -999 -999 'JLL_AREAS_17+18' 12 1993 -999 -999 'JLL_AREAS_17+18' 12 1994 -999 -999 'JLL_AREAS_17+18' 12 1995 -999 -999 'JLL_AREAS_17+18' 12 1996 -999 -999 'JLL_AREAS_17+18' 12 1997 -999 -999 'JLL_AREAS_17+18' 12 1998 -999 -999 'JLL_AREAS_17+18' 12 1999 -999 -999 'JLL_AREAS_17+18' 12 2000 -999 -999 'JLL_AREAS_17+18' 12 2001 -999 -999 'JLL_AREAS_17+18' 12 2002 -999 -999 'JLL_AREAS_17+18' 12 2003 -999 -999 'JLL_AREAS_17+18' 12 2004 -999 -999 'JLL_AREAS_17+18' 12 2005 -999 -999 'JLL_AREAS_17+18' 12 2006 -999 -999 'JLL_AREAS_17+18' 12 2007 -999 -999 'JLL_AREAS_17+18' 12 2008 -999 -999 'JLL_AREAS_17+18' 12 2009 -999 -999 'JLL_AREAS_17+18' 12 2010 -999 -999 'JLL_AREAS_17+18' 12 2011 -999 -999 'JLL_AREAS_17+18' 12 2012 -999 -999 'JLL_AREAS_17+18' 12 2013 -999 -999 'JLL_AREAS_17+18'
1584

13 1970 -999 -999 'LARVAL_ZERO_INFLATED' 13 1971 -999 -999 'LARVAL_ZERO_INFLATED' 13 1972 -999 -999 'LARVAL_ZERO_INFLATED' 13 1973 -999 -999 'LARVAL_ZERO_INFLATED' 13 1974 -999 -999 'LARVAL_ZERO_INFLATED' 13 1975 -999 -999 'LARVAL_ZERO_INFLATED' 13 1976 -999 -999 'LARVAL_ZERO_INFLATED' 13 1977 2.25 0.51 'LARVAL_ZERO_INFLATED' 13 1978 4.39 0.25 'LARVAL_ZERO_INFLATED' 13 1979 -999 -999 'LARVAL_ZERO_INFLATED' 13 1980 -999 -999 'LARVAL_ZERO_INFLATED' 13 1981 0.81 0.49 'LARVAL_ZERO_INFLATED' 13 1982 1.18 0.30 'LARVAL_ZERO_INFLATED' 13 1983 0.84 0.35 'LARVAL_ZERO_INFLATED' 13 1984 0.31 0.57 'LARVAL_ZERO_INFLATED' 13 1985 -999 -999 'LARVAL_ZERO_INFLATED' 13 1986 0.35 0.43 'LARVAL_ZERO_INFLATED' 13 1987 0.31 0.47 'LARVAL_ZERO_INFLATED' 13 1988 1.11 0.35 'LARVAL_ZERO_INFLATED' 13 1989 0.62 0.38 'LARVAL_ZERO_INFLATED' 13 1990 0.33 0.36 'LARVAL_ZERO_INFLATED' 13 1991 0.30 0.61 'LARVAL_ZERO_INFLATED' 13 1992 0.42 0.36 'LARVAL_ZERO_INFLATED' 13 1993 0.44 0.69 'LARVAL_ZERO_INFLATED' 13 1994 0.54 0.35 'LARVAL_ZERO_INFLATED' 13 1995 0.22 0.54 'LARVAL_ZERO_INFLATED' 13 1996 0.79 0.52 'LARVAL_ZERO_INFLATED' 13 1997 0.33 0.39 'LARVAL_ZERO_INFLATED' 13 1998 0.11 0.55 'LARVAL_ZERO_INFLATED' 13 1999 0.46 0.53 'LARVAL_ZERO_INFLATED' 13 2000 0.25 0.54 'LARVAL_ZERO_INFLATED' 13 2001 0.46 0.33 'LARVAL_ZERO_INFLATED' 13 2002 0.24 0.65 'LARVAL_ZERO_INFLATED' 13 2003 0.79 0.40 'LARVAL_ZERO_INFLATED' 13 2004 0.55 0.71 'LARVAL_ZERO_INFLATED' 13 2005 0.18 0.30 'LARVAL_ZERO_INFLATED' 13 2006 0.47 0.35 'LARVAL_ZERO_INFLATED' 13 2007 0.39 0.45 'LARVAL_ZERO_INFLATED' 13 2008 0.31 0.39 'LARVAL_ZERO_INFLATED' 13 2009 0.58 0.34 'LARVAL_ZERO_INFLATED' 13 2010 0.39 0.52 'LARVAL_ZERO_INFLATED' 13 2011 1.02 0.40 'LARVAL_ZERO_INFLATED' 13 2012 0.30 0.49 'LARVAL_ZERO_INFLATED' 13 2013 0.98 0.36 'LARVAL_ZERO_INFLATED' 14 1970 -999 -999 'GOM_PLL_1_6' 14 1971 -999 -999 'GOM_PLL_1_6' 14 1972 -999 -999 'GOM_PLL_1_6' 14 1973 -999 -999 'GOM_PLL_1_6' 14 1974 -999 -999 'GOM_PLL_1_6' 14 1975 -999 -999 'GOM_PLL_1_6' 14 1976 -999 -999 'GOM_PLL_1_6' 14 1977 -999 -999 'GOM_PLL_1_6' 14 1978 -999 -999 'GOM_PLL_1_6' 14 1979 -999 -999 'GOM_PLL_1_6' 14 1980 -999 -999 'GOM_PLL_1_6' 14 1981 -999 -999 'GOM_PLL_1_6' 14 1982 -999 -999 'GOM_PLL_1_6' 14 1983 -999 -999 'GOM_PLL_1_6' 14 1984 -999 -999 'GOM_PLL_1_6' 14 1985 -999 -999 'GOM_PLL_1_6' 14 1986 -999 -999 'GOM_PLL_1_6' 14 1987 -999 -999 'GOM_PLL_1_6' 14 1988 -999 -999 'GOM_PLL_1_6' 14 1989 -999 -999 'GOM_PLL_1_6' 14 1990 -999 -999 'GOM_PLL_1_6' 14 1991 -999 -999 'GOM_PLL_1_6' 14 1992 0.80 0.35 'GOM_PLL_1_6' 14 1993 0.45 0.37 'GOM_PLL_1_6' 14 1994 0.33 0.39 'GOM_PLL_1_6' 14 1995 0.31 0.40 'GOM_PLL_1_6' 14 1996 0.18 0.40 'GOM_PLL_1_6' 14 1997 0.33 0.37 'GOM_PLL_1_6' 14 1998 0.36 0.37 'GOM_PLL_1_6' 14 1999 0.61 0.33 'GOM_PLL_1_6' 14 2000 0.89 0.33 'GOM_PLL_1_6' 14 2001 0.51 0.38 'GOM_PLL_1_6' 14 2002 0.48 0.39 'GOM_PLL_1_6' 14 2003 0.86 0.32 'GOM_PLL_1_6' 14 2004 0.78 0.33 'GOM_PLL_1_6' 14 2005 0.59 0.34 'GOM_PLL_1_6' 14 2006 0.41 0.39 'GOM_PLL_1_6' 14 2007 0.55 0.38 'GOM_PLL_1_6' 14 2008 1.26 0.34 'GOM_PLL_1_6' 14 2009 1.05 0.36 'GOM_PLL_1_6' 14 2010 0.89 0.34 'GOM_PLL_1_6' 14 2011 0.73 0.49 'GOM_PLL_1_6' 14 2012 1.34 0.34 'GOM_PLL_1_6' 14 2013 0.43 0.41 'GOM_PLL_1_6' 15 1970 -999 -999 'JLL_GOM' 15 1971 -999 -999 'JLL_GOM' 15 1972 -999 -999 'JLL_GOM' 15 1973 -999 -999 'JLL_GOM' 15 1974 0.968 0.266 'JLL_GOM' 15 1975 0.534 0.205 'JLL_GOM' 15 1976 0.666 0.207 'JLL_GOM' 15 1977 0.913 0.216 'JLL_GOM' 15 1978 0.876 0.225 'JLL_GOM' 15 1979 1.287 0.283 'JLL_GOM' 15 1980 1.158 0.265 'JLL_GOM' 15 1981 0.553 0.239 'JLL_GOM' 15 1982 -999 -999 'JLL_GOM'
1585

15 1983 -999 -999 'JLL_GOM' 15 1984 -999 -999 'JLL_GOM' 15 1985 -999 -999 'JLL_GOM' 15 1986 -999 -999 'JLL_GOM' 15 1987 -999 -999 'JLL_GOM' 15 1988 -999 -999 'JLL_GOM' 15 1989 -999 -999 'JLL_GOM' 15 1990 -999 -999 'JLL_GOM' 15 1991 -999 -999 'JLL_GOM' 15 1992 -999 -999 'JLL_GOM' 15 1993 -999 -999 'JLL_GOM' 15 1994 -999 -999 'JLL_GOM' 15 1995 -999 -999 'JLL_GOM' 15 1996 -999 -999 'JLL_GOM' 15 1997 -999 -999 'JLL_GOM' 15 1998 -999 -999 'JLL_GOM' 15 1999 -999 -999 'JLL_GOM' 15 2000 -999 -999 'JLL_GOM' 15 2001 -999 -999 'JLL_GOM' 15 2002 -999 -999 'JLL_GOM' 15 2003 -999 -999 'JLL_GOM' 15 2004 -999 -999 'JLL_GOM' 15 2005 -999 -999 'JLL_GOM' 15 2006 -999 -999 'JLL_GOM' 15 2007 -999 -999 'JLL_GOM' 15 2008 -999 -999 'JLL_GOM' 15 2009 -999 -999 'JLL_GOM' 15 2010 -999 -999 'JLL_GOM' 15 2011 -999 -999 'JLL_GOM' 15 2012 -999 -999 'JLL_GOM' 15 2013 -999 -999 'JLL_GOM' 16 1970 1065132 0.2 'TAGGING' 16 1971 1001624 0.2 'TAGGING' 16 1972 431955 0.2 'TAGGING' 16 1973 183616 0.2 'TAGGING' 16 1974 341589 0.2 'TAGGING' 16 1975 554596 0.2 'TAGGING' 16 1976 253265 0.2 'TAGGING' 16 1977 257385 0.2 'TAGGING' 16 1978 121110 0.2 'TAGGING' 16 1979 98815 0.2 'TAGGING' 16 1980 192541 0.2 'TAGGING' 16 1981 337995 0.2 'TAGGING' 16 1982 -999 -999 'TAGGING' 16 1983 -999 -999 'TAGGING' 16 1984 -999 -999 'TAGGING' 16 1985 -999 -999 'TAGGING' 16 1986 -999 -999 'TAGGING' 16 1987 -999 -999 'TAGGING' 16 1988 -999 -999 'TAGGING' 16 1989 -999 -999 'TAGGING' 16 1990 -999 -999 'TAGGING' 16 1991 -999 -999 'TAGGING' 16 1992 -999 -999 'TAGGING' 16 1993 -999 -999 'TAGGING' 16 1994 -999 -999 'TAGGING' 16 1995 -999 -999 'TAGGING' 16 1996 -999 -999 'TAGGING' 16 1997 -999 -999 'TAGGING' 16 1998 -999 -999 'TAGGING' 16 1999 -999 -999 'TAGGING' 16 2000 -999 -999 'TAGGING' 16 2001 -999 -999 'TAGGING' 16 2002 -999 -999 'TAGGING' 16 2003 -999 -999 'TAGGING' 16 2004 -999 -999 'TAGGING' 16 2005 -999 -999 'TAGGING' 16 2006 -999 -999 'TAGGING' 16 2007 -999 -999 'TAGGING' 16 2008 -999 -999 'TAGGING' 16 2009 -999 -999 'TAGGING' 16 2010 -999 -999 'TAGGING' 16 2011 -999 -999 'TAGGING' 16 2012 -999 -999 'TAGGING' 16 2013 -999 -999 'TAGGING' -1 end index data #============================================================================== # NOW ENTER IN THE Vulnerabilities OR PARTIAL CATCHES FOR THE INDICES OF ABUNDANCE #============================================================================== #INDEX Year Age 1 Age 2 Age 3 Age 4 Age 5 Age 6 Age 7 Age 8 Age 9 Age 10 Age 11 Age 12 Age 13 Age 14 Age 15 Age 16 1 1970 0 0 0 0 0 0 0 0 2 1 2 7 39 51 68 170 1 1971 0 0 0 0 0 0 0 0 0 0 1 5 11 35 37 136 1 1972 0 0 0 0 0 0 1 0 0 0 0 1 5 28 46 312 1 1973 0 0 0 0 0 0 0 0 1 0 0 6 3 21 44 489 1 1974 0 0 0 0 0 3 0 0 0 0 0 1 5 15 52 748 1 1975 0 0 0 0 0 0 0 0 0 0 0 0 0 0 5 535
1586

1 1976 0 0 0 0 0 0 0 0 0 0 1 0 0 2 11 842 1 1977 0 0 0 0 0 0 0 0 0 0 1 0 1 5 6 729 1 1978 0 0 0 0 0 0 0 0 0 1 1 0 0 3 6 468 1 1979 0 0 0 0 0 0 0 0 0 0 0 0 0 1 6 476 1 1980 0 0 0 0 0 0 0 0 0 0 0 1 0 4 5 620 1 1981 0 0 0 0 0 0 0 0 0 0 0 0 0 1 1 626 1 1982 0 0 0 0 0 0 0 0 0 0 0 0 0 3 6 506 1 1983 0 0 0 0 0 0 0 0 0 0 0 0 0 28 10 1012 1 1984 0 0 0 0 0 0 0 0 0 0 0 0 0 0 2 546 1 1985 0 0 0 0 0 0 0 0 0 0 0 0 1 1 3 266 1 1986 0 0 0 0 0 0 0 0 0 0 0 0 0 0 1 93 1 1987 0 0 0 0 0 2 1 2 2 0 1 1 1 1 2 41 1 1988 0 1 0 0 1 6 22 64 34 140 331 156 42 29 29 261 1 1989 0 0 0 0 0 1 22 399 508 391 270 210 138 118 76 524 1 1990 0 0 0 0 0 1 49 275 550 385 142 94 63 66 81 348 1 1991 0 0 0 0 0 0 0 0 0 0 2 1 21 27 10 111 1 1992 0 0 0 0 2 0 0 2 1 1 2 4 5 11 9 180 1 1993 0 0 0 0 0 0 0 0 1 1 7 4 7 4 10 339 1 1994 0 0 0 0 0 1 0 2 0 1 3 6 2 6 7 236 1 1995 0 0 0 0 0 0 2 3 1 14 12 12 12 16 16 501 1 1996 0 0 0 0 0 0 1 0 0 0 0 0 1 1 3 247 1 1997 0 0 0 0 0 0 0 0 0 0 0 1 0 2 2 221 1 1998 0 0 0 0 0 0 0 0 0 0 0 0 0 3 3 255 1 1999 0 0 1 0 1 0 0 0 1 0 2 12 6 2 7 375 1 2000 0 0 0 0 1 0 0 1 0 1 2 8 20 28 22 477 1 2001 0 0 0 0 0 0 0 0 0 0 4 1 18 37 34 291 1 2002 0 0 0 0 0 0 0 1 7 0 5 9 25 49 79 413 1 2003 0 0 0 0 0 0 0 1 8 7 14 15 17 39 51 343 1 2004 0 0 0 0 0 0 2 1 2 10 28 40 32 29 63 523 1 2005 0 0 0 0 0 0 0 0 4 6 25 60 57 49 70 521 1 2006 0 0 0 0 0 0 1 0 2 11 19 47 64 80 77 646 1 2007 0 0 0 0 0 0 0 1 2 3 12 22 41 51 58 394 1 2008 0 0 0 0 0 0 0 0 0 5 11 14 42 63 72 488 1 2009 0 0 0 0 0 5 9 6 21 21 27 29 38 62 69 373 1 2010 0 0 0 0 0 0 14 19 5 19 22 11 17 39 43 387 1 2011 0 0 0 0 1 0 1 15 42 16 19 22 44 60 50 363 1 2012 0 0 0 0 0 0 1 7 43 100 82 47 35 47 93 341 1 2013 0 0 0 0 0 0 0 0 8 24 70 86 72 60 53 358 2 1970 0 0 0 0 0 0 0 0 2 1 2 7 39 51 68 170 2 1971 0 0 0 0 0 0 0 0 0 0 1 5 11 35 37 136 2 1972 0 0 0 0 0 0 1 0 0 0 0 1 5 28 46 312 2 1973 0 0 0 0 0 0 0 0 1 0 0 6 3 21 44 489 2 1974 0 0 0 0 0 3 0 0 0 0 0 1 5 15 52 748 2 1975 0 0 0 0 0 0 0 0 0 0 0 0 0 0 5 535 2 1976 0 0 0 0 0 0 0 0 0 0 1 0 0 2 11 842 2 1977 0 0 0 0 0 0 0 0 0 0 1 0 1 5 6 729 2 1978 0 0 0 0 0 0 0 0 0 1 1 0 0 3 6 468 2 1979 0 0 0 0 0 0 0 0 0 0 0 0 0 1 6 476 2 1980 0 0 0 0 0 0 0 0 0 0 0 1 0 4 5 620 2 1981 0 0 0 0 0 0 0 0 0 0 0 0 0 1 1 626
1587

2 1982 0 0 0 0 0 0 0 0 0 0 0 0 0 3 6 506 2 1983 0 0 0 0 0 0 0 0 0 0 0 0 0 28 10 1012 2 1984 0 0 0 0 0 0 0 0 0 0 0 0 0 0 2 546 2 1985 0 0 0 0 0 0 0 0 0 0 0 0 1 1 3 266 2 1986 0 0 0 0 0 0 0 0 0 0 0 0 0 0 1 93 2 1987 0 0 0 0 0 2 1 2 2 0 1 1 1 1 2 41 2 1988 0 1 0 0 1 6 22 64 34 140 331 156 42 29 29 261 2 1989 0 0 0 0 0 1 22 399 508 391 270 210 138 118 76 524 2 1990 0 0 0 0 0 1 49 275 550 385 142 94 63 66 81 348 2 1991 0 0 0 0 0 1 76 288 378 500 299 116 65 45 25 16 2 1992 0 0 0 0 1 2 32 147 187 182 238 237 152 90 78 90 2 1993 0 0 0 0 0 0 15 18 107 216 162 129 127 104 60 105 2 1994 0 0 0 0 0 3 16 102 88 152 186 139 103 74 49 66 2 1995 0 0 0 0 1 12 13 18 83 268 262 183 117 87 63 102 2 1996 0 0 0 0 0 0 14 40 54 70 149 207 145 103 77 258 2 1997 0 0 0 0 1 12 28 85 172 148 109 89 104 91 80 269 2 1998 0 0 0 0 0 10 12 51 226 372 328 166 154 120 93 170 2 1999 0 0 0 0 1 1 31 122 177 372 383 306 155 70 33 71 2 2000 0 0 0 0 0 3 4 20 111 142 141 159 137 99 56 56 2 2001 0 0 0 0 3 19 278 289 103 213 255 181 147 116 63 53 2 2002 0 0 0 0 0 2 42 395 483 133 129 167 130 103 47 36 2 2003 0 0 0 0 0 1 12 231 666 435 109 26 16 16 8 12 2 2004 0 0 0 0 7 21 101 345 357 264 122 99 56 18 18 5 2 2005 0 0 0 2 23 20 23 79 131 200 261 234 123 71 75 107 2 2006 0 0 0 0 12 24 133 138 209 296 283 260 187 91 46 77 2 2007 0 0 0 0 2 28 56 116 156 106 119 120 97 66 32 45 2 2008 0 2 2 63 390 774 495 374 212 67 20 2 2 0 0 0 2 2009 0 0 0 0 0 37 23 67 88 90 50 59 50 66 42 48 2 2010 0 0 0 0 0 3 22 26 38 70 71 60 68 70 54 101 2 2011 0 0 0 0 0 0 38 104 75 56 85 72 49 34 36 85 2 2012 0 0 0 0 0 5 12 52 126 66 47 47 51 41 36 72 2 2013 0 0 0 0 0 1 7 30 37 34 60 79 55 39 28 142 3 1970 0 0 0 0 0 0 0 0 0 0 0 0 0 0 0 0 3 1971 0 0 0 0 0 0 0 0 0 0 0 0 0 0 0 0 3 1972 0 0 0 0 0 0 0 0 0 0 0 0 0 0 0 0 3 1973 0 0 0 0 0 0 0 0 0 0 0 0 0 0 0 0 3 1974 0 0 0 0 0 0 0 0 0 0 0 0 0 0 0 0 3 1975 0 0 0 0 0 0 0 0 0 0 0 0 0 0 0 0 3 1976 0 0 0 0 0 0 0 0 0 0 0 0 0 0 0 0 3 1977 0 0 0 0 0 0 0 0 0 0 0 0 0 0 0 0 3 1978 0 0 0 0 0 0 0 0 0 0 0 0 0 0 0 0 3 1979 0 0 0 0 0 0 0 0 0 0 0 0 0 0 0 0 3 1980 786 4119 290 160 67 1 0 0 0 0 0 0 0 0 0 0 3 1981 2975 1484 422 59 20 0 0 0 0 0 0 0 0 0 0 0 3 1982 2708 3009 619 117 50 0 0 0 0 0 0 0 0 0 0 0 3 1983 1640 2344 813 115 38 0 0 0 0 0 0 0 0 0 0 0 3 1984 922 5543 1085 300 186 0 0 0 0 0 0 0 0 0 0 0 3 1985 741 5267 5482 85 50 0 0 0 0 0 0 0 0 0 0 0 3 1986 963 5764 5250 678 48 0 0 0 0 0 0 0 0 0 0 0 3 1987 2297 12228 7212 2193 669 0 0 0 0 0 0 0 0 0 0 0
1588
3 1988 4783 8903 7322 74 148 0 0 0 0 0 0 0 0 0 0 0 3 1989 779 12589 1186 1943 1596 3 0 0 0 0 0 0 0 0 0 0 3 1990 1953 2066 13030 645 584 0 0 0 0 0 0 0 0 0 0 0 3 1991 3812 11614 8493 1502 418 0 0 0 0 0 0 0 0 0 0 0 3 1992 507 5813 1424 122 256 0 0 0 0 0 0 0 0 0 0 0 3 1993 0 0 0 0 0 0 0 0 0 0 0 0 0 0 0 0 3 1994 0 0 0 0 0 0 0 0 0 0 0 0 0 0 0 0 3 1995 0 0 0 0 0 0 0 0 0 0 0 0 0 0 0 0 3 1996 0 0 0 0 0 0 0 0 0 0 0 0 0 0 0 0 3 1997 0 0 0 0 0 0 0 0 0 0 0 0 0 0 0 0 3 1998 0 0 0 0 0 0 0 0 0 0 0 0 0 0 0 0 3 1999 0 0 0 0 0 0 0 0 0 0 0 0 0 0 0 0 3 2000 0 0 0 0 0 0 0 0 0 0 0 0 0 0 0 0 3 2001 0 0 0 0 0 0 0 0 0 0 0 0 0 0 0 0 3 2002 0 0 0 0 0 0 0 0 0 0 0 0 0 0 0 0 3 2003 0 0 0 0 0 0 0 0 0 0 0 0 0 0 0 0 3 2004 0 0 0 0 0 0 0 0 0 0 0 0 0 0 0 0 3 2005 0 0 0 0 0 0 0 0 0 0 0 0 0 0 0 0 3 2006 0 0 0 0 0 0 0 0 0 0 0 0 0 0 0 0 3 2007 0 0 0 0 0 0 0 0 0 0 0 0 0 0 0 0 3 2008 0 0 0 0 0 0 0 0 0 0 0 0 0 0 0 0 3 2009 0 0 0 0 0 0 0 0 0 0 0 0 0 0 0 0 3 2010 0 0 0 0 0 0 0 0 0 0 0 0 0 0 0 0 3 2011 0 0 0 0 0 0 0 0 0 0 0 0 0 0 0 0 3 2012 0 0 0 0 0 0 0 0 0 0 0 0 0 0 0 0 3 2013 0 0 0 0 0 0 0 0 0 0 0 0 0 0 0 0 4 1970 0 0 0 0 0 0 0 0 0 0 0 0 0 0 0 0 4 1971 0 0 0 0 0 0 0 0 0 0 0 0 0 0 0 0 4 1972 0 0 0 0 0 0 0 0 0 0 0 0 0 0 0 0 4 1973 0 0 0 0 0 0 0 0 0 0 0 0 0 0 0 0 4 1974 0 0 0 0 0 0 0 0 0 0 0 0 0 0 0 0 4 1975 0 0 0 0 0 0 0 0 0 0 0 0 0 0 0 0 4 1976 0 0 0 0 0 0 0 0 0 0 0 0 0 0 0 0 4 1977 0 0 0 0 0 0 0 0 0 0 0 0 0 0 0 0 4 1978 0 0 0 0 0 0 0 0 0 0 0 0 0 0 0 0 4 1979 0 0 0 0 0 0 0 0 0 0 0 0 0 0 0 0 4 1980 161 4119 290 34 0 0 0 0 0 0 0 0 0 0 0 0 4 1981 1702 1484 409 7 0 0 0 0 0 0 0 0 0 0 0 0 4 1982 117 3009 619 50 0 0 0 0 0 0 0 0 0 0 0 0 4 1983 344 2344 813 30 0 0 0 0 0 0 0 0 0 0 0 0 4 1984 192 5543 1085 54 0 0 0 0 0 0 0 0 0 0 0 0 4 1985 198 5267 5482 0 0 0 0 0 0 0 0 0 0 0 0 0 4 1986 383 5764 5250 20 0 0 0 0 0 0 0 0 0 0 0 0 4 1987 889 12228 6631 264 0 0 0 0 0 0 0 0 0 0 0 0 4 1988 0 8903 7322 0 0 0 0 0 0 0 0 0 0 0 0 0 4 1989 66 12589 1186 246 0 0 0 0 0 0 0 0 0 0 0 0 4 1990 919 2066 13030 140 0 0 0 0 0 0 0 0 0 0 0 0 4 1991 1634 11614 8493 153 0 0 0 0 0 0 0 0 0 0 0 0 4 1992 429 5813 1424 0 0 0 0 0 0 0 0 0 0 0 0 0 4 1993 121 1016 3660 650 0 0 0 0 0 0 0 0 0 0 0 0
1589

4 1994 37 645 913 257 0 0 0 0 0 0 0 0 0 0 0 0 4 1995 283 1288 2957 340 0 0 0 0 0 0 0 0 0 0 0 0 4 1996 184 9166 1104 458 0 0 0 0 0 0 0 0 0 0 0 0 4 1997 38 1095 6174 112 0 0 0 0 0 0 0 0 0 0 0 0 4 1998 80 880 3231 674 0 0 0 0 0 0 0 0 0 0 0 0 4 1999 29 507 1805 339 0 0 0 0 0 0 0 0 0 0 0 0 4 2000 0 249 572 47 0 0 0 0 0 0 0 0 0 0 0 0 4 2001 37 327 2345 571 0 0 0 0 0 0 0 0 0 0 0 0 4 2002 549 5477 4026 235 0 0 0 0 0 0 0 0 0 0 0 0 4 2003 121 2085 3481 347 0 0 0 0 0 0 0 0 0 0 0 0 4 2004 518 2631 6704 44 0 0 0 0 0 0 0 0 0 0 0 0 4 2005 372 4819 1866 582 0 0 0 0 0 0 0 0 0 0 0 0 4 2006 129 436 859 105 0 0 0 0 0 0 0 0 0 0 0 0 4 2007 9 210 3958 1755 0 0 0 0 0 0 0 0 0 0 0 0 4 2008 19 684 1994 118 0 0 0 0 0 0 0 0 0 0 0 0 4 2009 26 191 1905 123 0 0 0 0 0 0 0 0 0 0 0 0 4 2010 12 990 734 71 0 0 0 0 0 0 0 0 0 0 0 0 4 2011 0 393 1443 456 0 0 0 0 0 0 0 0 0 0 0 0 4 2012 25 385 1787 401 0 0 0 0 0 0 0 0 0 0 0 0 4 2013 4 265 550 329 0 0 0 0 0 0 0 0 0 0 0 0 5 1970 0 0 0 0 0 0 0 0 0 0 0 0 0 0 0 0 5 1971 0 0 0 0 0 0 0 0 0 0 0 0 0 0 0 0 5 1972 0 0 0 0 0 0 0 0 0 0 0 0 0 0 0 0 5 1973 0 0 0 0 0 0 0 0 0 0 0 0 0 0 0 0 5 1974 0 0 0 0 0 0 0 0 0 0 0 0 0 0 0 0 5 1975 0 0 0 0 0 0 0 0 0 0 0 0 0 0 0 0 5 1976 0 0 0 0 0 0 0 0 0 0 0 0 0 0 0 0 5 1977 0 0 0 0 0 0 0 0 0 0 0 0 0 0 0 0 5 1978 0 0 0 0 0 0 0 0 0 0 0 0 0 0 0 0 5 1979 0 0 0 0 0 0 0 0 0 0 0 0 0 0 0 0 5 1980 0 0 0 126 67 1 0 0 0 0 0 0 0 0 0 0 5 1981 0 0 13 53 20 0 0 0 0 0 0 0 0 0 0 0 5 1982 0 0 0 67 50 0 0 0 0 0 0 0 0 0 0 0 5 1983 0 0 0 85 38 0 0 0 0 0 0 0 0 0 0 0 5 1984 0 0 0 246 186 0 0 0 0 0 0 0 0 0 0 0 5 1985 0 0 0 85 50 0 0 0 0 0 0 0 0 0 0 0 5 1986 0 0 0 659 48 0 0 0 0 0 0 0 0 0 0 0 5 1987 0 0 581 1929 669 0 0 0 0 0 0 0 0 0 0 0 5 1988 0 0 0 74 148 0 0 0 0 0 0 0 0 0 0 0 5 1989 0 0 0 1697 1596 3 0 0 0 0 0 0 0 0 0 0 5 1990 0 0 0 505 584 0 0 0 0 0 0 0 0 0 0 0 5 1991 0 0 0 1349 418 0 0 0 0 0 0 0 0 0 0 0 5 1992 0 0 0 122 256 0 0 0 0 0 0 0 0 0 0 0 5 1993 0 0 0 1333 1005 0 0 0 0 0 0 0 0 0 0 0 5 1994 0 0 0 317 653 0 0 0 0 0 0 0 0 0 0 0 5 1995 0 0 0 1495 2171 0 0 0 0 0 0 0 0 0 0 0 5 1996 0 0 0 2810 2155 0 0 0 0 0 0 0 0 0 0 0 5 1997 0 0 0 213 580 0 0 0 0 0 0 0 0 0 0 0 5 1998 0 0 0 1684 116 0 0 0 0 0 0 0 0 0 0 0 5 1999 0 0 0 664 514 0 0 0 0 0 0 0 0 0 0 0
1590

5 2000 0 0 0 331 256 2 0 0 0 0 0 0 0 0 0 0 5 2001 0 0 0 3660 768 0 0 0 0 0 0 0 0 0 0 0 5 2002 0 0 0 4200 4436 0 0 0 0 0 0 0 0 0 0 0 5 2003 0 0 0 1409 808 1 0 0 0 0 0 0 0 0 0 0 5 2004 0 0 0 1992 1136 0 0 0 0 0 0 0 0 0 0 0 5 2005 0 0 0 1329 302 0 0 0 0 0 0 0 0 0 0 0 5 2006 0 0 0 931 1942 9 0 0 0 0 0 0 0 0 0 0 5 2007 0 0 0 5076 1173 1 0 0 0 0 0 0 0 0 0 0 5 2008 0 0 0 1099 4555 6 0 0 0 0 0 0 0 0 0 0 5 2009 0 0 0 864 722 4 0 0 0 0 0 0 0 0 0 0 5 2010 0 0 0 1393 410 0 0 0 0 0 0 0 0 0 0 0 5 2011 0 0 0 641 600 3 0 0 0 0 0 0 0 0 0 0 5 2012 0 0 0 692 375 0 0 0 0 0 0 0 0 0 0 0 5 2013 0 0 0 920 167 0 0 0 0 0 0 0 0 0 0 0 6 1970 0 0 0 0 0 0 0 0 0 0 0 0 0 0 0 0 6 1971 0 0 0 0 0 0 0 0 0 0 0 0 0 0 0 0 6 1972 0 0 0 0 0 0 0 0 0 0 0 0 0 0 0 0 6 1973 0 0 0 0 0 0 0 0 0 0 0 0 0 0 0 0 6 1974 0 0 0 0 0 0 0 0 0 0 0 0 0 0 0 0 6 1975 0 0 0 0 0 0 0 0 0 0 0 0 0 0 0 0 6 1976 0 0 0 0 0 0 0 0 0 0 0 0 0 0 0 0 6 1977 0 0 0 0 0 0 0 0 0 0 0 0 0 0 0 0 6 1978 0 0 0 0 0 0 0 0 0 0 0 0 0 0 0 0 6 1979 0 0 0 0 0 0 0 0 0 0 0 0 0 0 0 0 6 1980 0 0 0 0 0 0 0 0 0 0 0 0 0 0 0 0 6 1981 0 0 0 0 0 0 0 0 0 0 0 0 0 0 0 0 6 1982 0 0 0 0 0 0 0 0 0 0 0 0 0 0 0 0 6 1983 0 0 0 0 0 0 0 0 0 0 0 0 0 0 0 0 6 1984 0 0 0 0 0 0 0 0 0 0 0 0 0 0 0 0 6 1985 0 0 0 0 0 0 0 0 0 0 0 0 0 0 0 0 6 1986 0 0 0 0 0 0 0 0 0 0 0 0 0 0 0 0 6 1987 0 0 0 0 0 0 0 0 0 0 0 0 0 0 0 0 6 1988 0 0 0 0 0 0 0 0 0 0 0 0 0 0 0 0 6 1989 0 0 0 0 0 0 0 0 0 0 0 0 0 0 0 0 6 1990 0 0 0 0 0 0 0 0 0 0 0 0 0 0 0 0 6 1991 0 0 0 0 0 0 0 0 0 0 0 0 0 0 0 0 6 1992 0 0 0 0 0 0 0 0 0 0 0 0 0 0 0 0 6 1993 0 0 0 0 0 0 0 0 0 0 0 0 0 0 0 0 6 1994 0 0 0 0 0 0 0 0 0 0 0 0 0 0 0 0 6 1995 0 0 0 0 0 0 0 0 0 0 0 0 0 0 0 0 6 1996 0 0 0 0 0 0 0 0 0 0 0 0 0 0 0 0 6 1997 0 0 0 0 0 0 0 0 0 0 0 0 0 0 0 0 6 1998 0 0 0 0 0 0 0 0 0 0 0 0 0 0 0 0 6 1999 0 0 0 0 0 0 0 0 0 0 0 0 0 0 0 0 6 2000 0 0 0 0 0 0 0 0 0 0 0 0 0 0 0 0 6 2001 0 0 0 0 0 0 0 0 0 0 0 0 0 0 0 0 6 2002 0 0 0 0 0 0 0 0 0 0 0 0 0 0 0 0 6 2003 0 0 0 0 0 0 0 0 0 0 0 0 0 0 0 0 6 2004 0 0 0 0 0 0 0 0 0 0 0 0 0 0 0 0 6 2005 0 0 0 0 0 0 0 0 0 0 0 0 0 0 0 0
1591

6 2006 0 0 0 0 0 0 0 0 0 0 0 0 0 0 0 0 6 2007 0 0 0 0 0 0 0 0 0 0 0 0 0 0 0 0 6 2008 0 0 0 0 0 0 0 0 0 0 0 0 0 0 0 0 6 2009 0 0 0 0 0 0 0 0 0 0 0 0 0 0 0 0 6 2010 0 0 0 0 0 0 0 0 0 0 0 0 0 0 0 0 6 2011 0 0 0 0 0 0 0 0 0 0 0 0 0 0 0 0 6 2012 0 0 0 0 0 0 0 0 0 0 0 0 0 0 0 0 6 2013 0 0 0 0 0 0 0 0 0 0 0 0 0 0 0 0 7 1970 0 0 0 0 0 0 0 0 0 0 0 0 0 0 0 0 7 1971 0 0 0 0 0 0 0 0 0 0 0 0 0 0 0 0 7 1972 0 0 0 0 0 0 0 0 0 0 0 0 0 0 0 0 7 1973 0 0 0 0 0 0 0 0 0 0 0 0 0 0 0 0 7 1974 0 0 0 0 0 0 0 0 0 0 0 0 0 0 0 0 7 1975 0 0 0 0 0 0 0 0 0 0 0 0 0 0 0 0 7 1976 0 0 0 0 0 0 0 0 0 0 0 0 0 0 0 0 7 1977 0 0 0 0 0 0 0 0 0 0 0 0 0 0 0 0 7 1978 0 0 0 0 0 0 0 0 0 0 0 0 0 0 0 0 7 1979 0 0 0 0 0 0 0 0 0 0 0 0 0 0 0 0 7 1980 0 0 0 0 0 0 0 0 0 0 0 0 0 0 0 0 7 1981 0 0 0 0 0 0 0 0 0 0 0 0 0 0 0 0 7 1982 0 0 0 0 0 0 0 0 0 0 0 0 0 0 0 0 7 1983 0 0 0 0 0 0 0 0 7 82 110 91 143 185 141 440 7 1984 0 0 0 0 0 0 0 0 14 64 102 130 168 168 143 307 7 1985 0 0 0 0 0 0 0 0 9 54 70 82 145 136 164 288 7 1986 0 0 0 0 0 0 0 0 7 34 32 51 36 55 54 135 7 1987 0 0 0 0 0 0 0 0 5 54 46 43 47 51 43 159 7 1988 0 0 0 0 0 0 0 0 8 57 43 40 33 45 39 181 7 1989 0 0 0 0 0 0 0 0 11 58 42 62 48 46 47 207 7 1990 0 0 0 0 0 0 0 0 20 119 47 58 47 70 85 399 7 1991 0 0 0 0 0 0 0 0 16 63 73 112 76 89 105 251 7 1992 0 0 0 0 0 0 0 0 9 60 72 117 128 119 84 352 7 1993 0 0 0 0 0 0 0 0 0 0 0 0 0 0 0 0 7 1994 0 0 0 0 0 0 0 0 0 0 0 0 0 0 0 0 7 1995 0 0 0 0 0 0 0 0 0 0 0 0 0 0 0 0 7 1996 0 0 0 0 0 0 0 0 0 0 0 0 0 0 0 0 7 1997 0 0 0 0 0 0 0 0 0 0 0 0 0 0 0 0 7 1998 0 0 0 0 0 0 0 0 0 0 0 0 0 0 0 0 7 1999 0 0 0 0 0 0 0 0 0 0 0 0 0 0 0 0 7 2000 0 0 0 0 0 0 0 0 0 0 0 0 0 0 0 0 7 2001 0 0 0 0 0 0 0 0 0 0 0 0 0 0 0 0 7 2002 0 0 0 0 0 0 0 0 0 0 0 0 0 0 0 0 7 2003 0 0 0 0 0 0 0 0 0 0 0 0 0 0 0 0 7 2004 0 0 0 0 0 0 0 0 0 0 0 0 0 0 0 0 7 2005 0 0 0 0 0 0 0 0 0 0 0 0 0 0 0 0 7 2006 0 0 0 0 0 0 0 0 0 0 0 0 0 0 0 0 7 2007 0 0 0 0 0 0 0 0 0 0 0 0 0 0 0 0 7 2008 0 0 0 0 0 0 0 0 0 0 0 0 0 0 0 0 7 2009 0 0 0 0 0 0 0 0 0 0 0 0 0 0 0 0 7 2010 0 0 0 0 0 0 0 0 0 0 0 0 0 0 0 0 7 2011 0 0 0 0 0 0 0 0 0 0 0 0 0 0 0 0
1592
7 2012 0 0 0 0 0 0 0 0 0 0 0 0 0 0 0 0 7 2013 0 0 0 0 0 0 0 0 0 0 0 0 0 0 0 0 8 1970 0 0 0 0 0 0 0 0 0 0 0 0 0 0 0 0 8 1971 0 0 0 0 0 0 0 0 0 0 0 0 0 0 0 0 8 1972 0 0 0 0 0 0 0 0 0 0 0 0 0 0 0 0 8 1973 0 0 0 0 0 0 0 0 0 0 0 0 0 0 0 0 8 1974 0 0 0 0 0 0 0 0 0 0 0 0 0 0 0 0 8 1975 0 0 0 0 0 0 0 0 0 0 0 0 0 0 0 0 8 1976 0 0 0 0 0 0 0 0 0 0 0 0 0 0 0 0 8 1977 0 0 0 0 0 0 0 0 0 0 0 0 0 0 0 0 8 1978 0 0 0 0 0 0 0 0 0 0 0 0 0 0 0 0 8 1979 0 0 0 0 0 0 0 0 0 0 0 0 0 0 0 0 8 1980 0 0 0 0 0 0 0 0 0 0 0 0 0 0 0 0 8 1981 0 0 0 0 0 0 0 0 0 0 0 0 0 0 0 0 8 1982 0 0 0 0 0 0 0 0 0 0 0 0 0 0 0 0 8 1983 0 0 0 0 0 0 0 0 0 0 0 0 0 0 0 0 8 1984 0 0 0 0 0 0 0 0 0 0 0 0 0 0 0 0 8 1985 0 0 0 0 0 0 0 0 0 0 0 0 0 0 0 0 8 1986 0 0 0 0 0 0 0 0 0 0 0 0 0 0 0 0 8 1987 0 0 0 0 0 0 0 0 0 0 0 0 0 0 0 0 8 1988 0 0 0 0 0 0 0 0 0 0 0 0 0 0 0 0 8 1989 0 0 0 0 0 0 0 0 0 0 0 0 0 0 0 0 8 1990 0 0 0 0 0 0 0 0 0 0 0 0 0 0 0 0 8 1991 0 0 0 0 0 0 0 0 0 0 0 0 0 0 0 0 8 1992 0 0 0 0 0 0 0 0 0 0 0 0 0 0 0 0 8 1993 0 0 0 0 0 0 0 0 0 0 0 0 0 0 0 0 8 1994 0 0 0 0 0 0 0 0 0 0 0 0 0 0 0 0 8 1995 0 0 0 0 0 0 0 0 0 0 0 0 0 0 0 0 8 1996 0 0 0 0 0 0 0 0 0 0 0 0 0 0 0 0 8 1997 0 0 0 0 0 0 0 0 0 0 0 0 0 0 0 0 8 1998 0 0 0 0 0 0 0 0 0 0 0 0 0 0 0 0 8 1999 0 0 0 0 0 0 0 0 0 0 0 0 0 0 0 0 8 2000 0 0 0 0 0 0 0 0 0 0 0 0 0 0 0 0 8 2001 0 0 0 0 0 0 0 0 0 0 0 0 0 0 0 0 8 2002 0 0 0 0 0 0 0 0 0 0 0 0 0 0 0 0 8 2003 0 0 0 0 0 0 0 0 0 0 0 0 0 0 0 0 8 2004 0 0 0 0 0 0 0 0 0 0 0 0 0 0 0 0 8 2005 0 0 0 0 0 0 0 0 0 0 0 0 0 0 0 0 8 2006 0 0 0 0 0 0 0 0 0 0 0 0 0 0 0 0 8 2007 0 0 0 0 0 0 0 0 0 0 0 0 0 0 0 0 8 2008 0 0 0 0 0 0 0 0 0 0 0 0 0 0 0 0 8 2009 0 0 0 0 0 0 0 0 0 0 0 0 0 0 0 0 8 2010 0 0 0 0 0 0 0 0 0 0 0 0 0 0 0 0 8 2011 0 0 0 0 0 0 0 0 0 0 0 0 0 0 0 0 8 2012 0 0 0 0 0 0 0 0 0 0 0 0 0 0 0 0 8 2013 0 0 0 0 0 0 0 0 0 0 0 0 0 0 0 0 9 1970 0 0 0 0 0 0 0 0 0 0 0 0 0 0 0 0 9 1971 0 0 0 0 0 0 0 0 0 0 0 0 0 0 0 0 9 1972 0 0 0 0 0 0 0 0 0 0 0 0 0 0 0 0 9 1973 0 0 0 0 0 0 0 0 0 0 0 0 0 0 0 0
1593

9 1974 0 0 0 0 0 0 0 0 0 0 0 0 0 0 0 0 9 1975 0 0 0 0 0 0 0 0 0 0 0 0 0 0 0 0 9 1976 0 0 0 0 0 0 0 0 0 0 0 0 0 0 0 0 9 1977 0 0 0 0 0 0 0 0 0 0 0 0 0 0 0 0 9 1978 0 0 0 0 0 0 0 0 0 0 0 0 0 0 0 0 9 1979 0 0 0 0 0 0 0 0 0 0 0 0 0 0 0 0 9 1980 0 0 0 0 0 0 0 9 72 51 28 26 37 22 21 297 9 1981 0 0 0 0 0 0 0 1 45 139 180 127 67 45 49 249 9 1982 0 0 0 0 0 0 0 11 56 101 210 157 135 42 34 198 9 1983 0 0 0 0 0 0 0 37 127 82 110 91 143 185 141 440 9 1984 0 0 0 0 0 0 0 41 68 64 102 130 168 168 143 307 9 1985 0 0 0 0 0 0 0 55 56 54 70 82 145 136 164 288 9 1986 0 0 0 0 0 0 0 45 44 34 32 51 36 55 54 135 9 1987 0 0 0 0 0 0 0 42 42 54 46 43 47 51 43 159 9 1988 0 0 0 0 0 0 0 26 64 57 43 40 33 45 39 181 9 1989 0 0 0 0 0 0 0 197 148 58 42 62 48 46 47 207 9 1990 0 0 0 0 0 0 0 144 136 119 47 58 47 70 85 399 9 1991 0 0 0 0 0 0 0 26 61 63 73 112 76 89 105 251 9 1992 0 0 0 0 0 0 0 112 209 60 72 117 128 119 84 352 9 1993 0 0 0 0 0 0 0 104 124 200 136 78 70 75 73 252 9 1994 0 0 0 0 0 0 0 296 526 163 122 192 107 115 76 199 9 1995 0 0 0 0 0 0 0 147 232 361 258 163 138 144 157 450 9 1996 0 0 0 0 0 0 0 620 253 121 139 167 127 111 98 262 9 1997 0 0 0 0 0 0 0 448 658 406 190 210 278 277 233 477 9 1998 0 0 0 0 0 0 0 280 787 243 232 155 188 225 198 392 9 1999 0 0 0 0 0 0 0 378 290 289 452 471 276 264 253 475 9 2000 0 0 0 0 0 0 0 37 204 232 345 348 345 366 195 337 9 2001 0 0 0 0 0 0 0 308 122 185 455 435 648 566 401 658 9 2002 0 0 0 0 0 0 0 401 281 131 285 272 415 595 516 681 9 2003 0 0 0 0 0 0 0 184 212 144 156 121 226 266 318 503 9 2004 0 0 0 0 0 0 0 101 73 90 129 88 72 84 85 226 9 2005 0 0 0 0 0 0 0 30 95 69 77 79 80 61 38 123 9 2006 0 0 0 0 0 0 0 61 12 22 27 42 34 34 24 149 9 2007 0 0 0 0 0 0 0 42 60 20 39 35 30 17 19 95 9 2008 0 0 0 0 0 0 0 147 39 26 18 19 15 33 22 106 9 2009 0 0 0 0 0 0 0 68 108 64 59 61 34 43 46 379 9 2010 0 0 0 0 0 0 0 557 220 283 304 140 89 107 127 261 9 2011 0 0 0 0 0 0 0 381 480 194 141 179 169 116 87 244 9 2012 0 0 0 0 0 0 0 128 375 442 232 141 116 71 75 159 9 2013 0 0 0 0 0 0 0 74 56 78 90 61 40 40 40 72 10 1970 0 0 0 0 0 0 0 0 12 43 61 43 55 59 28 14 10 1971 13 244 31 132 89 272 830 1525 1114 699 679 538 393 229 112 240 10 1972 27 49 52 15 131 50 41 94 327 188 46 66 67 60 24 108 10 1973 84 427 543 458 666 250 218 572 1077 670 170 276 301 261 86 237 10 1974 104 2549 2669 1556 494 97 449 599 517 493 439 419 388 247 257 324 10 1975 2 37 54 76 187 20 16 159 335 614 1146 910 855 821 842 1837 10 1976 175 1176 5491 2375 2502 982 173 104 617 570 346 676 1462 1817 1664 4157 10 1977 58 411 5173 9269 2230 1777 1702 394 152 239 208 331 467 929 1351 5898 10 1978 79 187 1392 2719 2454 2611 967 385 309 169 172 316 453 460 906 6193 10 1979 47 332 1410 1209 669 1537 2513 1713 510 299 296 390 650 910 1105 4976
1594
10 1980 134 477 1753 2661 1222 1322 2257 4582 3070 768 484 454 511 594 980 6883 10 1981 354 1453 8404 3335 4345 3033 2514 2043 1679 1005 439 655 578 545 442 5211 10 1982 14 78 156 225 152 352 370 280 136 186 126 97 124 87 40 101 10 1983 6 120 2151 577 550 774 560 922 529 365 223 114 113 47 35 44 10 1984 56 1523 602 1189 1805 1481 767 352 308 277 179 103 61 109 2 110 10 1985 35 128 6653 2013 3463 3695 1740 590 358 245 155 112 180 67 239 332 10 1986 4 133 1222 2210 1340 1043 972 496 326 271 72 39 55 38 28 73 10 1987 7 346 1436 1959 3020 3437 1023 990 720 621 165 108 18 27 30 61 10 1988 56 260 3309 3227 2768 2413 2486 1133 741 332 159 80 84 23 56 134 10 1989 0 177 129 461 633 749 730 764 519 205 90 72 64 42 18 95 10 1990 0 92 698 329 1225 1187 740 574 599 388 211 73 73 9 23 103 10 1991 0 148 461 822 1385 1179 1370 908 421 302 184 165 92 22 7 109 10 1992 10 14 255 284 743 803 525 811 843 201 139 74 80 63 38 87 10 1993 0 10 323 861 1009 1283 1183 490 540 444 188 69 38 29 13 97 10 1994 0 73 240 1221 1811 1555 535 419 439 217 64 62 23 9 0 5 10 1995 54 54 121 390 605 2448 995 50 200 90 0 0 0 0 0 0 10 1996 6 176 408 697 1021 525 886 655 235 44 107 95 70 49 21 63 10 1997 0 0 66 132 635 496 825 464 506 116 34 26 16 32 8 16 10 1998 0 0 143 714 462 841 602 680 837 1134 302 141 24 94 4 106 10 1999 0 25 27 398 1062 533 573 580 294 110 73 57 87 34 12 18 10 2000 0 11 14 232 1909 1285 731 446 271 77 12 28 8 19 9 32 10 2001 24 6 15 29 101 214 812 842 296 269 172 256 103 73 73 88 10 2002 11 21 31 82 35 68 284 1128 968 769 285 140 108 43 9 74 10 2003 0 10 10 158 203 163 88 51 25 15 10 10 0 0 0 0 10 2004 0 0 0 231 1378 2208 1047 488 200 238 70 85 15 46 1 15 10 2005 0 40 590 606 641 396 500 580 304 108 176 116 43 9 28 24 10 2006 0 128 271 542 328 1141 586 549 905 563 271 236 148 85 115 245 10 2007 0 3 2430 1895 666 604 365 214 153 66 70 80 32 29 15 58 10 2008 0 3 4 215 573 345 833 715 561 392 311 238 217 68 73 103 10 2009 2 0 6 0 0 0 0 65 194 169 107 75 34 26 20 38 10 2010 0 0 0 35 78 16 129 224 263 437 359 207 121 63 59 102 10 2011 0 0 0 42 953 414 289 1323 933 192 161 162 159 98 53 111 10 2012 0 0 0 73 50 219 213 44 188 456 226 80 78 51 47 79 10 2013 0 0 0 0 7 5 37 73 48 145 297 328 212 124 76 86 11 1970 0 0 0 0 0 0 0 0 12 43 61 43 55 59 28 14 11 1971 13 244 31 132 89 272 830 1525 1114 699 679 538 393 229 112 240 11 1972 27 49 52 15 131 50 41 94 327 188 46 66 67 60 24 108 11 1973 84 427 543 458 666 250 218 572 1077 670 170 276 301 261 86 237 11 1974 104 2549 2669 1556 494 97 449 599 517 493 439 419 388 247 257 324 11 1975 2 37 54 76 187 20 16 159 335 614 1146 910 855 821 842 1837 11 1976 175 1176 5491 2375 2502 982 173 104 617 570 346 676 1462 1817 1664 4157 11 1977 58 411 5173 9269 2230 1777 1702 394 152 239 208 331 467 929 1351 5898 11 1978 79 187 1392 2719 2454 2611 967 385 309 169 172 316 453 460 906 6193 11 1979 47 332 1410 1209 669 1537 2513 1713 510 299 296 390 650 910 1105 4976 11 1980 134 477 1753 2661 1222 1322 2257 4582 3070 768 484 454 511 594 980 6883 11 1981 354 1453 8404 3335 4345 3033 2514 2043 1679 1005 439 655 578 545 442 5211 11 1982 14 78 156 225 152 352 370 280 136 186 126 97 124 87 40 101 11 1983 6 120 2151 577 550 774 560 922 529 365 223 114 113 47 35 44 11 1984 56 1523 602 1189 1805 1481 767 352 308 277 179 103 61 109 2 110 11 1985 35 128 6653 2013 3463 3695 1740 590 358 245 155 112 180 67 239 332
1595

11 1986 4 133 1222 2210 1340 1043 972 496 326 271 72 39 55 38 28 73 11 1987 7 346 1436 1959 3020 3437 1023 990 720 621 165 108 18 27 30 61 11 1988 56 260 3309 3227 2768 2413 2486 1133 741 332 159 80 84 23 56 134 11 1989 0 177 129 461 633 749 730 764 519 205 90 72 64 42 18 95 11 1990 0 92 698 329 1225 1187 740 574 599 388 211 73 73 9 23 103 11 1991 0 148 461 822 1385 1179 1370 908 421 302 184 165 92 22 7 109 11 1992 10 14 255 284 743 803 525 811 843 201 139 74 80 63 38 87 11 1993 0 10 323 861 1009 1283 1183 490 540 444 188 69 38 29 13 97 11 1994 0 73 240 1221 1811 1555 535 419 439 217 64 62 23 9 0 5 11 1995 54 54 121 390 605 2448 995 50 200 90 0 0 0 0 0 0 11 1996 6 176 408 697 1021 525 886 655 235 44 107 95 70 49 21 63 11 1997 0 0 66 132 635 496 825 464 506 116 34 26 16 32 8 16 11 1998 0 0 143 714 462 841 602 680 837 1134 302 141 24 94 4 106 11 1999 0 25 27 398 1062 533 573 580 294 110 73 57 87 34 12 18 11 2000 0 11 14 232 1909 1285 731 446 271 77 12 28 8 19 9 32 11 2001 24 6 15 29 101 214 812 842 296 269 172 256 103 73 73 88 11 2002 11 21 31 82 35 68 284 1128 968 769 285 140 108 43 9 74 11 2003 0 10 10 158 203 163 88 51 25 15 10 10 0 0 0 0 11 2004 0 0 0 231 1378 2208 1047 488 200 238 70 85 15 46 1 15 11 2005 0 40 590 606 641 396 500 580 304 108 176 116 43 9 28 24 11 2006 0 128 271 542 328 1141 586 549 905 563 271 236 148 85 115 245 11 2007 0 3 2430 1895 666 604 365 214 153 66 70 80 32 29 15 58 11 2008 0 3 4 215 573 345 833 715 561 392 311 238 217 68 73 103 11 2009 2 0 6 0 0 0 0 65 194 169 107 75 34 26 20 38 11 2010 0 0 0 35 78 16 129 224 263 437 359 207 121 63 59 102 11 2011 0 0 0 42 953 414 289 1323 933 192 161 162 159 98 53 111 11 2012 0 0 0 0 0 0 0 0 0 0 0 0 0 0 0 0 11 2013 0 0 0 0 0 0 0 0 0 0 0 0 0 0 0 0 12 1970 0 0 0 0 0 0 0 0 12 43 61 43 55 59 28 14 12 1971 13 244 31 132 89 272 830 1525 1114 699 679 538 393 229 112 240 12 1972 27 49 52 15 131 50 41 94 327 188 46 66 67 60 24 108 12 1973 84 427 543 458 666 250 218 572 1077 670 170 276 301 261 86 237 12 1974 104 2549 2669 1556 494 97 449 599 517 493 439 419 388 247 257 324 12 1975 2 37 54 76 187 20 16 159 335 614 1146 910 855 821 842 1837 12 1976 175 1176 5491 2375 2502 982 173 104 617 570 346 676 1462 1817 1664 4157 12 1977 58 411 5173 9269 2230 1777 1702 394 152 239 208 331 467 929 1351 5898 12 1978 79 187 1392 2719 2454 2611 967 385 309 169 172 316 453 460 906 6193 12 1979 47 332 1410 1209 669 1537 2513 1713 510 299 296 390 650 910 1105 4976 12 1980 134 477 1753 2661 1222 1322 2257 4582 3070 768 484 454 511 594 980 6883 12 1981 354 1453 8404 3335 4345 3033 2514 2043 1679 1005 439 655 578 545 442 5211 12 1982 14 78 156 225 152 352 370 280 136 186 126 97 124 87 40 101 12 1983 6 120 2151 577 550 774 560 922 529 365 223 114 113 47 35 44 12 1984 56 1523 602 1189 1805 1481 767 352 308 277 179 103 61 109 2 110 12 1985 35 128 6653 2013 3463 3695 1740 590 358 245 155 112 180 67 239 332 12 1986 4 133 1222 2210 1340 1043 972 496 326 271 72 39 55 38 28 73 12 1987 7 346 1436 1959 3020 3437 1023 990 720 621 165 108 18 27 30 61 12 1988 56 260 3309 3227 2768 2413 2486 1133 741 332 159 80 84 23 56 134 12 1989 0 177 129 461 633 749 730 764 519 205 90 72 64 42 18 95 12 1990 0 92 698 329 1225 1187 740 574 599 388 211 73 73 9 23 103 12 1991 0 148 461 822 1385 1179 1370 908 421 302 184 165 92 22 7 109
1596
12 1992 10 14 255 284 743 803 525 811 843 201 139 74 80 63 38 87 12 1993 0 10 323 861 1009 1283 1183 490 540 444 188 69 38 29 13 97 12 1994 0 73 240 1221 1811 1555 535 419 439 217 64 62 23 9 0 5 12 1995 54 54 121 390 605 2448 995 50 200 90 0 0 0 0 0 0 12 1996 6 176 408 697 1021 525 886 655 235 44 107 95 70 49 21 63 12 1997 0 0 66 132 635 496 825 464 506 116 34 26 16 32 8 16 12 1998 0 0 143 714 462 841 602 680 837 1134 302 141 24 94 4 106 12 1999 0 25 27 398 1062 533 573 580 294 110 73 57 87 34 12 18 12 2000 0 11 14 232 1909 1285 731 446 271 77 12 28 8 19 9 32 12 2001 24 6 15 29 101 214 812 842 296 269 172 256 103 73 73 88 12 2002 11 21 31 82 35 68 284 1128 968 769 285 140 108 43 9 74 12 2003 0 10 10 158 203 163 88 51 25 15 10 10 0 0 0 0 12 2004 0 0 0 231 1378 2208 1047 488 200 238 70 85 15 46 1 15 12 2005 0 40 590 606 641 396 500 580 304 108 176 116 43 9 28 24 12 2006 0 128 271 542 328 1141 586 549 905 563 271 236 148 85 115 245 12 2007 0 3 2430 1895 666 604 365 214 153 66 70 80 32 29 15 58 12 2008 0 3 4 215 573 345 833 715 561 392 311 238 217 68 73 103 12 2009 2 0 6 0 0 0 0 65 194 169 107 75 34 26 20 38 12 2010 0 0 0 35 78 16 129 224 263 437 359 207 121 63 59 102 12 2011 0 0 0 42 953 414 289 1323 933 192 161 162 159 98 53 111 12 2012 0 0 0 0 0 0 0 0 0 0 0 0 0 0 0 0 12 2013 0 0 0 0 0 0 0 0 0 0 0 0 0 0 0 0 13 1970 0 0 0 0 0 0 0 0 0 0 0 0 0 0 0 0 13 1971 0 0 0 0 0 0 0 0 0 0 0 0 0 0 0 0 13 1972 0 0 0 0 0 0 0 0 0 0 0 0 0 0 0 0 13 1973 0 0 0 0 0 0 0 0 0 0 0 0 0 0 0 0 13 1974 0 0 0 0 0 0 0 0 0 0 0 0 0 0 0 0 13 1975 0 0 1 2 0 0 3 12 45 107 146 159 149 125 125 294 13 1976 0 0 0 0 2 1 5 7 29 34 83 172 387 413 404 1042 13 1977 0 0 0 0 0 3 2 2 10 24 26 84 137 250 338 1607 13 1978 0 0 0 0 0 2 4 2 4 32 50 196 418 368 680 5030 13 1979 0 0 0 1 0 3 0 0 2 6 17 66 178 236 264 1300 13 1980 0 0 0 0 0 0 0 1 3 4 9 36 62 83 252 1711 13 1981 0 0 0 0 1 1 1 2 6 10 7 17 48 49 54 463 13 1982 0 0 0 0 0 0 0 0 0 0 0 0 0 0 0 0 13 1983 0 0 0 0 0 0 0 0 0 0 0 0 0 0 0 0 13 1984 0 0 0 0 0 0 0 0 0 0 0 0 0 0 0 0 13 1985 0 0 0 0 0 0 0 0 0 0 0 0 0 0 0 0 13 1986 0 0 0 0 0 0 0 0 0 0 0 0 0 0 0 0 13 1987 0 0 0 0 0 0 0 0 0 0 0 0 0 0 0 0 13 1988 0 0 0 0 0 0 0 0 0 0 0 0 0 0 0 0 13 1989 0 0 0 0 0 0 0 0 0 0 0 0 0 0 0 0 13 1990 0 0 0 0 0 0 0 0 0 0 0 0 0 0 0 0 13 1991 0 0 0 0 0 0 0 0 0 0 0 0 0 0 0 0 13 1992 0 0 0 0 0 0 0 0 0 0 0 0 0 0 0 0 13 1993 0 0 0 0 0 0 0 0 0 0 0 0 0 0 0 0 13 1994 0 0 0 0 0 0 0 0 0 0 0 0 0 0 0 0 13 1995 0 0 0 0 0 0 0 0 0 0 0 0 0 0 0 0 13 1996 0 0 0 0 0 0 0 0 0 0 0 0 0 0 0 0 13 1997 0 0 0 0 0 0 0 0 0 0 0 0 0 0 0 0
1597

13 1998 0 0 0 0 0 0 0 0 0 0 0 0 0 0 0 0 13 1999 0 0 0 0 0 0 0 0 0 0 0 0 0 0 0 0 13 2000 0 0 0 0 0 0 0 0 0 0 0 0 0 0 0 0 13 2001 0 0 0 0 0 0 0 0 0 0 0 0 0 0 0 0 13 2002 0 0 0 0 0 0 0 0 0 0 0 0 0 0 0 0 13 2003 0 0 0 0 0 0 0 0 0 0 0 0 0 0 0 0 13 2004 0 0 0 0 0 0 0 6 18 12 11 17 53 33 7 46 13 2005 0 0 0 0 0 0 0 0 0 0 0 0 0 0 0 0 13 2006 0 0 0 0 0 0 0 0 0 33 53 6 22 10 140 28 13 2007 0 0 0 1 1 12 0 13 9 16 52 11 41 18 54 55 13 2008 0 0 0 0 1 1 0 23 21 48 77 29 9 12 83 66 13 2009 0 0 0 2 0 3 0 22 2 11 51 30 26 27 64 109 13 2010 0 0 0 0 0 12 0 2 4 0 20 14 21 25 23 80 13 2011 0 0 0 0 0 0 0 1 1 1 7 1 3 3 8 13 13 2012 0 0 0 0 0 1 0 18 17 11 65 8 41 29 60 119 13 2013 0 0 0 0 0 1 0 1 0 0 13 2 16 14 12 41 14 1970 0 0 0 0 0 0 0 0 0 0 0 0 0 0 0 0 14 1971 0 0 0 0 0 0 0 0 0 0 0 0 0 0 0 0 14 1972 0 0 0 0 0 0 0 0 0 0 0 0 0 0 0 0 14 1973 0 0 0 0 0 0 0 0 0 0 0 0 0 0 0 0 14 1974 0 0 0 0 0 0 0 0 0 0 0 0 0 0 0 0 14 1975 0 0 0 0 0 0 0 0 0 0 0 0 0 0 0 0 14 1976 0 0 0 0 0 0 0 0 0 0 0 0 0 0 0 0 14 1977 0 0 0 0 0 0 0 0 0 0 0 0 0 0 0 0 14 1978 0 0 0 0 0 0 0 0 0 0 0 0 0 0 0 0 14 1979 0 0 0 0 0 0 0 0 0 0 0 0 0 0 0 0 14 1980 0 0 0 0 0 0 0 0 0 0 0 0 0 0 0 0 14 1981 0 0 0 0 0 0 0 0 0 0 0 0 0 0 0 0 14 1982 0 0 0 0 0 0 0 0 0 0 0 0 0 0 0 0 14 1983 0 0 0 0 0 0 0 0 0 0 0 0 0 0 0 0 14 1984 0 0 0 0 0 0 0 0 0 0 0 0 0 0 0 0 14 1985 0 0 0 0 0 0 0 0 0 0 0 0 0 0 0 0 14 1986 0 0 0 0 0 0 0 0 0 0 0 0 0 0 0 0 14 1987 0 0 0 0 0 0 0 0 0 0 0 0 0 0 0 0 14 1988 0 0 0 0 0 0 0 0 0 0 0 0 0 0 0 0 14 1989 0 0 0 0 0 0 0 0 0 0 0 0 0 0 0 0 14 1990 0 0 0 0 0 0 0 0 0 0 0 0 0 0 0 0 14 1991 0 0 0 0 0 0 0 0 0 0 0 0 0 0 0 0 14 1992 0 0 0 0 0 0 0 0 0 0 0 0 0 0 0 0 14 1993 0 0 0 0 0 0 0 0 0 0 0 0 0 0 0 0 14 1994 0 0 0 0 0 0 0 0 0 0 0 0 0 0 0 0 14 1995 0 0 0 0 0 0 0 0 0 0 0 0 0 0 0 0 14 1996 0 0 0 0 0 0 0 0 0 0 0 0 0 0 0 0 14 1997 0 0 0 0 0 0 0 0 0 0 0 0 0 0 0 0 14 1998 0 0 0 0 0 0 0 0 0 0 0 0 0 0 0 0 14 1999 0 0 0 0 0 0 0 0 0 0 0 0 0 0 0 0 14 2000 0 0 0 0 0 0 0 0 0 0 0 0 0 0 0 0 14 2001 0 0 0 0 0 0 0 0 0 0 0 0 0 0 0 0 14 2002 0 0 0 0 0 0 0 0 0 0 0 0 0 0 0 0 14 2003 0 0 0 0 0 0 0 0 0 0 0 0 0 0 0 0
1598

14 2004 0 0 0 0 0 0 0 6 18 12 11 17 53 33 7 46 14 2005 0 0 0 0 0 0 0 0 0 0 0 0 0 0 0 0 14 2006 0 0 0 0 0 0 0 0 0 33 53 6 22 10 140 28 14 2007 0 0 0 1 1 12 0 13 9 16 52 11 41 18 54 55 14 2008 0 0 0 0 1 1 0 23 21 48 77 29 9 12 83 66 14 2009 0 0 0 2 0 3 0 22 2 11 51 30 26 27 64 109 14 2010 0 0 0 0 0 12 0 2 4 0 20 14 21 25 23 80 14 2011 0 0 0 0 0 0 0 1 1 1 7 1 3 3 8 13 14 2012 0 0 0 0 0 1 0 18 17 11 65 8 41 29 60 119 14 2013 0 0 0 0 0 1 0 1 0 0 13 2 16 14 12 41 15 1970 0 0 0 0 0 0 0 0 0 0 0 0 0 0 0 0 15 1971 0 0 0 0 0 0 0 0 0 0 0 0 0 0 0 0 15 1972 0 0 0 0 0 0 0 0 0 0 0 0 0 0 0 0 15 1973 0 0 0 0 0 0 0 0 0 0 0 0 0 0 0 0 15 1974 0 0 0 0 0 0 0 0 0 0 0 0 0 0 0 0 15 1975 0 0 1 2 0 0 3 12 45 107 146 159 149 125 125 294 15 1976 0 0 0 0 2 1 5 7 29 34 83 172 387 413 404 1042 15 1977 0 0 0 0 0 3 2 2 10 24 26 84 137 250 338 1607 15 1978 0 0 0 0 0 2 4 2 4 32 50 196 418 368 680 5030 15 1979 0 0 0 1 0 3 0 0 2 6 17 66 178 236 264 1300 15 1980 0 0 0 0 0 0 0 1 3 4 9 36 62 83 252 1711 15 1981 0 0 0 0 1 1 1 2 6 10 7 17 48 49 54 463 15 1982 0 0 0 0 0 0 0 0 0 0 0 0 0 0 0 0 15 1983 0 0 0 0 0 0 0 0 0 0 0 0 0 0 0 0 15 1984 0 0 0 0 0 0 0 0 0 0 0 0 0 0 0 0 15 1985 0 0 0 0 0 0 0 0 0 0 0 0 0 0 0 0 15 1986 0 0 0 0 0 0 0 0 0 0 0 0 0 0 0 0 15 1987 0 0 0 0 0 0 0 0 0 0 0 0 0 0 0 0 15 1988 0 0 0 0 0 0 0 0 0 0 0 0 0 0 0 0 15 1989 0 0 0 0 0 0 0 0 0 0 0 0 0 0 0 0 15 1990 0 0 0 0 0 0 0 0 0 0 0 0 0 0 0 0 15 1991 0 0 0 0 0 0 0 0 0 0 0 0 0 0 0 0 15 1992 0 0 0 0 0 0 0 0 0 0 0 0 0 0 0 0 15 1993 0 0 0 0 0 0 0 0 0 0 0 0 0 0 0 0 15 1994 0 0 0 0 0 0 0 0 0 0 0 0 0 0 0 0 15 1995 0 0 0 0 0 0 0 0 0 0 0 0 0 0 0 0 15 1996 0 0 0 0 0 0 0 0 0 0 0 0 0 0 0 0 15 1997 0 0 0 0 0 0 0 0 0 0 0 0 0 0 0 0 15 1998 0 0 0 0 0 0 0 0 0 0 0 0 0 0 0 0 15 1999 0 0 0 0 0 0 0 0 0 0 0 0 0 0 0 0 15 2000 0 0 0 0 0 0 0 0 0 0 0 0 0 0 0 0 15 2001 0 0 0 0 0 0 0 0 0 0 0 0 0 0 0 0 15 2002 0 0 0 0 0 0 0 0 0 0 0 0 0 0 0 0 15 2003 0 0 0 0 0 0 0 0 0 0 0 0 0 0 0 0 15 2004 0 0 0 0 0 0 0 0 0 0 0 0 0 0 0 0 15 2005 0 0 0 0 0 0 0 0 0 0 0 0 0 0 0 0 15 2006 0 0 0 0 0 0 0 0 0 0 0 0 0 0 0 0 15 2007 0 0 0 0 0 0 0 0 0 0 0 0 0 0 0 0 15 2008 0 0 0 0 0 0 0 0 0 0 0 0 0 0 0 0 15 2009 0 0 0 0 0 0 0 0 0 0 0 0 0 0 0 0
1599

15 2010 0 0 0 0 0 0 0 0 0 0 0 0 0 0 0 0 15 2011 0 0 0 0 0 0 0 0 0 0 0 0 0 0 0 0 15 2012 0 0 0 0 0 0 0 0 0 0 0 0 0 0 0 0 15 2013 0 0 0 0 0 0 0 0 0 0 0 0 0 0 0 0 16 1970 1 1 1 0 0 0 0 0 0 0 0 0 0 0 0 0 16 1971 1 1 1 0 0 0 0 0 0 0 0 0 0 0 0 0 16 1972 1 1 1 0 0 0 0 0 0 0 0 0 0 0 0 0 16 1973 1 1 1 0 0 0 0 0 0 0 0 0 0 0 0 0 16 1974 1 1 1 0 0 0 0 0 0 0 0 0 0 0 0 0 16 1975 1 1 1 0 0 0 0 0 0 0 0 0 0 0 0 0 16 1976 1 1 1 0 0 0 0 0 0 0 0 0 0 0 0 0 16 1977 1 1 1 0 0 0 0 0 0 0 0 0 0 0 0 0 16 1978 1 1 1 0 0 0 0 0 0 0 0 0 0 0 0 0 16 1979 1 1 1 0 0 0 0 0 0 0 0 0 0 0 0 0 16 1980 1 1 1 0 0 0 0 0 0 0 0 0 0 0 0 0 16 1981 1 1 1 0 0 0 0 0 0 0 0 0 0 0 0 0 16 1982 1 1 1 0 0 0 0 0 0 0 0 0 0 0 0 0 16 1983 1 1 1 0 0 0 0 0 0 0 0 0 0 0 0 0 16 1984 1 1 1 0 0 0 0 0 0 0 0 0 0 0 0 0 16 1985 1 1 1 0 0 0 0 0 0 0 0 0 0 0 0 0 16 1986 1 1 1 0 0 0 0 0 0 0 0 0 0 0 0 0 16 1987 1 1 1 0 0 0 0 0 0 0 0 0 0 0 0 0 16 1988 1 1 1 0 0 0 0 0 0 0 0 0 0 0 0 0 16 1989 1 1 1 0 0 0 0 0 0 0 0 0 0 0 0 0 16 1990 1 1 1 0 0 0 0 0 0 0 0 0 0 0 0 0 16 1991 1 1 1 0 0 0 0 0 0 0 0 0 0 0 0 0 16 1992 1 1 1 0 0 0 0 0 0 0 0 0 0 0 0 0 16 1993 1 1 1 0 0 0 0 0 0 0 0 0 0 0 0 0 16 1994 1 1 1 0 0 0 0 0 0 0 0 0 0 0 0 0 16 1995 1 1 1 0 0 0 0 0 0 0 0 0 0 0 0 0 16 1996 1 1 1 0 0 0 0 0 0 0 0 0 0 0 0 0 16 1997 1 1 1 0 0 0 0 0 0 0 0 0 0 0 0 0 16 1998 1 1 1 0 0 0 0 0 0 0 0 0 0 0 0 0 16 1999 1 1 1 0 0 0 0 0 0 0 0 0 0 0 0 0 16 2000 1 1 1 0 0 0 0 0 0 0 0 0 0 0 0 0 16 2001 1 1 1 0 0 0 0 0 0 0 0 0 0 0 0 0 16 2002 1 1 1 0 0 0 0 0 0 0 0 0 0 0 0 0 16 2003 1 1 1 0 0 0 0 0 0 0 0 0 0 0 0 0 16 2004 1 1 1 0 0 0 0 0 0 0 0 0 0 0 0 0 16 2005 1 1 1 0 0 0 0 0 0 0 0 0 0 0 0 0 16 2006 1 1 1 0 0 0 0 0 0 0 0 0 0 0 0 0 16 2007 1 1 1 0 0 0 0 0 0 0 0 0 0 0 0 0 16 2008 1 1 1 0 0 0 0 0 0 0 0 0 0 0 0 0 16 2009 1 1 1 0 0 0 0 0 0 0 0 0 0 0 0 0 16 2010 1 1 1 0 0 0 0 0 0 0 0 0 0 0 0 0 16 2011 1 1 1 0 0 0 0 0 0 0 0 0 0 0 0 0 16 2012 1 1 1 0 0 0 0 0 0 0 0 0 0 0 0 0 16 2013 1 1 1 0 0 0 0 0 0 0 0 0 0 0 0 0 -1 end index selectivities #==============================================================================
1600

# NOW ENTER IN THE WEIGHTS AT AGE FOR THE INDICES OF ABUNDANCE (row=year, col=age) #============================================================================== 13 1970 3.20 8.32 16.89 35.53 47.69 67.01 85.42 113.30 145.53 154.62 173.72 198.66 223.25 247.98 264.63 327.72 13 1971 3.48 8.30 20.89 31.44 51.20 69.88 86.65 106.89 126.82 149.12 172.48 198.50 224.12 248.76 272.98 317.23 13 1972 4.39 9.67 19.16 37.67 51.60 62.39 90.02 112.49 129.30 149.55 176.77 202.21 227.65 246.89 271.55 330.94 13 1973 3.74 8.86 20.70 38.19 47.93 69.19 89.03 115.65 134.10 152.95 179.96 208.23 230.76 249.75 277.68 333.91 13 1974 3.64 10.04 17.09 34.89 49.38 64.21 87.67 101.47 131.83 151.27 169.97 196.81 219.92 247.50 263.25 323.11 13 1975 3.86 8.63 22.42 32.61 47.14 66.90 83.76 110.46 134.72 152.31 168.00 193.83 216.42 243.31 264.63 321.65 13 1976 4.01 10.20 18.75 32.08 45.09 64.23 91.77 113.95 144.21 160.36 176.03 195.67 218.10 236.65 256.84 322.16 13 1977 4.77 10.26 20.48 33.84 45.65 63.04 81.33 102.93 128.31 150.47 172.98 195.58 218.15 241.28 258.37 325.90 13 1978 5.14 10.94 21.48 30.99 47.02 64.38 83.55 108.92 138.73 163.12 185.70 200.09 219.03 242.24 259.19 339.25 13 1979 5.29 11.23 21.63 35.67 44.23 65.72 84.76 108.11 133.88 160.37 183.17 202.12 220.03 239.99 260.03 337.85 13 1980 5.03 12.21 20.70 32.53 46.78 69.48 91.69 112.92 136.22 167.63 191.76 215.43 237.19 255.17 267.43 343.01 13 1981 5.57 11.05 21.53 32.18 45.47 65.46 85.67 108.94 133.87 158.13 183.98 205.00 226.06 240.89 259.84 371.83 13 1982 4.12 10.81 20.79 31.57 52.63 68.14 89.17 113.21 139.44 160.58 186.81 208.75 233.71 250.95 271.81 392.38 13 1983 3.99 10.10 19.59 33.63 50.48 66.93 91.45 115.44 140.46 163.89 188.31 213.90 236.55 257.03 279.26 377.54 13 1984 5.27 11.31 22.88 35.72 50.98 74.31 92.85 114.86 139.74 162.14 186.85 208.02 234.01 262.67 281.77 382.24 13 1985 4.57 10.21 17.17 31.22 43.60 61.94 79.63 101.58 125.71 152.56 178.75 201.84 223.01 246.50 265.01 337.83 13 1986 5.28 10.27 19.68 38.09 50.58 70.12 91.86 114.91 137.95 162.73 182.25 204.62 229.21 253.11 278.64 350.40 13 1987 5.08 9.82 22.26 36.63 49.94 67.19 85.61 109.71 130.38 155.50 180.41 202.51 230.00 258.81 279.73 349.06 13 1988 3.87 11.19 20.06 34.56 49.80 67.74 86.98 110.54 132.99 157.72 182.83 208.51 232.25 251.74 280.53 354.36 13 1989 4.53 11.06 21.45 35.96 47.78 68.37 89.97 111.91 133.99 160.88 182.93 205.20 229.78 254.88 277.00 356.31 13 1990 5.24 12.23 18.84 35.12 47.04 66.41 85.78 112.04 138.01 162.77 185.16 206.44 231.34 253.26 278.50 347.01 13 1991 5.38 13.46 19.63 36.89 53.42 70.16 93.31 114.29 142.16 166.12 184.45 205.67 232.92 255.70 277.58 348.73 13 1992 5.94 12.72 19.04 35.88 50.11 71.08 88.61 110.29 134.87 160.84 183.60 205.63 231.70 252.07 275.39 347.62 13 1993 5.10 11.57 23.82 33.36 51.24 66.94 89.28 110.87 135.71 157.85 182.17 204.81 227.22 250.52 275.46 364.06 13 1994 4.71 12.03 22.14 31.87 45.52 62.76 82.88 109.25 132.38 157.32 183.82 203.76 226.70 249.73 269.64 350.71 13 1995 4.90 13.62 22.44 35.13 48.60 71.02 89.57 109.22 137.50 160.01 182.17 204.74 228.28 251.22 273.36 369.78 13 1996 5.15 11.08 22.82 34.79 48.72 69.94 92.56 113.19 137.70 159.85 187.90 209.75 234.84 257.75 282.53 361.90 13 1997 5.05 12.66 20.26 36.31 51.22 68.43 91.24 112.02 135.70 157.20 183.61 207.67 233.38 257.23 276.85 356.01 13 1998 4.99 11.75 20.51 32.71 52.63 68.77 90.94 116.61 139.29 162.02 182.95 207.52 233.18 254.40 275.06 352.47 13 1999 5.42 11.22 21.77 35.53 53.96 71.60 93.71 113.88 136.24 159.02 184.11 206.73 230.95 254.11 276.93 355.41 13 2000 4.81 11.79 19.09 34.07 46.49 73.15 90.76 110.77 138.97 159.48 188.69 211.82 236.15 264.28 284.54 376.50 13 2001 4.72 12.80 22.48 33.89 49.13 68.23 95.00 116.01 141.83 166.01 190.73 215.14 242.84 265.54 289.89 352.62 13 2002 6.33 10.93 19.91 35.15 48.00 63.66 90.69 114.11 137.95 160.88 186.75 209.61 238.08 265.79 284.83 352.40 13 2003 5.66 11.51 21.60 34.02 50.70 69.17 92.12 115.31 137.43 158.80 184.14 210.24 241.65 265.21 286.90 342.31 13 2004 6.33 11.94 21.93 35.51 46.15 64.95 89.10 111.40 134.73 158.94 184.57 210.08 230.56 259.66 277.51 344.93 13 2005 5.38 9.80 19.79 30.70 47.55 62.27 82.59 105.75 132.23 160.12 183.99 207.86 231.99 254.63 276.59 349.01 13 2006 5.52 12.63 17.81 33.27 46.90 64.04 84.60 109.63 128.02 155.10 182.21 206.80 231.96 255.90 269.42 348.34 13 2007 4.51 11.76 22.41 30.40 49.64 63.54 82.38 111.84 136.63 162.07 186.44 211.78 237.65 262.72 278.79 365.83 13 2008 4.56 11.92 21.83 36.66 49.11 70.13 93.26 114.70 138.27 157.86 179.43 207.84 231.34 259.44 278.87 377.80 13 2009 5.39 13.24 21.76 34.43 51.29 69.43 83.92 112.09 133.36 156.42 180.31 207.54 235.55 260.51 277.31 372.46 13 2010 5.12 11.01 22.02 35.60 49.02 67.91 89.40 112.96 133.56 157.33 182.60 210.61 237.15 264.11 286.54 366.28 13 2011 4.88 10.77 23.04 31.74 48.20 63.95 87.78 110.99 135.13 159.59 184.86 211.25 239.99 263.70 286.75 361.16 13 2012 5.19 13.07 21.96 34.06 47.77 73.65 89.05 114.08 137.19 163.41 185.83 212.36 236.08 262.05 283.80 359.29 13 2013 5.24 12.22 22.48 32.68 47.83 64.47 90.57 111.06 133.01 161.57 188.18 216.72 241.04 266.07 282.79 362.64 -1 #==============================================================================
1601

# NOW ENTER IN THE FECUNDITY AT AGE FOR THE SPAWNING STOCK BIOMASS (row=year, col=age) #============================================================================== # Year Age 1 Age 2 Age 3 Age 4 Age 5 Age 6 Age 7 Age 8 Age 9 Age 10 Age 11 Age 12 Age 13 Age 14 Age 15 Age 16 1970 3.20 8.32 16.89 35.53 47.69 67.01 85.42 113.30 145.53 154.62 173.72 198.66 223.25 247.98 264.63 327.72 1971 3.48 8.30 20.89 31.44 51.20 69.88 86.65 106.89 126.82 149.12 172.48 198.50 224.12 248.76 272.98 317.23 1972 4.39 9.67 19.16 37.67 51.60 62.39 90.02 112.49 129.30 149.55 176.77 202.21 227.65 246.89 271.55 330.94 1973 3.74 8.86 20.70 38.19 47.93 69.19 89.03 115.65 134.10 152.95 179.96 208.23 230.76 249.75 277.68 333.91 1974 3.64 10.04 17.09 34.89 49.38 64.21 87.67 101.47 131.83 151.27 169.97 196.81 219.92 247.50 263.25 323.11 1975 3.86 8.63 22.42 32.61 47.14 66.90 83.76 110.46 134.72 152.31 168.00 193.83 216.42 243.31 264.63 321.65 1976 4.01 10.20 18.75 32.08 45.09 64.23 91.77 113.95 144.21 160.36 176.03 195.67 218.10 236.65 256.84 322.16 1977 4.77 10.26 20.48 33.84 45.65 63.04 81.33 102.93 128.31 150.47 172.98 195.58 218.15 241.28 258.37 325.90 1978 5.14 10.94 21.48 30.99 47.02 64.38 83.55 108.92 138.73 163.12 185.70 200.09 219.03 242.24 259.19 339.25 1979 5.29 11.23 21.63 35.67 44.23 65.72 84.76 108.11 133.88 160.37 183.17 202.12 220.03 239.99 260.03 337.85 1980 5.03 12.21 20.70 32.53 46.78 69.48 91.69 112.92 136.22 167.63 191.76 215.43 237.19 255.17 267.43 343.01 1981 5.57 11.05 21.53 32.18 45.47 65.46 85.67 108.94 133.87 158.13 183.98 205.00 226.06 240.89 259.84 371.83 1982 4.12 10.81 20.79 31.57 52.63 68.14 89.17 113.21 139.44 160.58 186.81 208.75 233.71 250.95 271.81 392.38 1983 3.99 10.10 19.59 33.63 50.48 66.93 91.45 115.44 140.46 163.89 188.31 213.90 236.55 257.03 279.26 377.54 1984 5.27 11.31 22.88 35.72 50.98 74.31 92.85 114.86 139.74 162.14 186.85 208.02 234.01 262.67 281.77 382.24 1985 4.57 10.21 17.17 31.22 43.60 61.94 79.63 101.58 125.71 152.56 178.75 201.84 223.01 246.50 265.01 337.83 1986 5.28 10.27 19.68 38.09 50.58 70.12 91.86 114.91 137.95 162.73 182.25 204.62 229.21 253.11 278.64 350.40 1987 5.08 9.82 22.26 36.63 49.94 67.19 85.61 109.71 130.38 155.50 180.41 202.51 230.00 258.81 279.73 349.06 1988 3.87 11.19 20.06 34.56 49.80 67.74 86.98 110.54 132.99 157.72 182.83 208.51 232.25 251.74 280.53 354.36 1989 4.53 11.06 21.45 35.96 47.78 68.37 89.97 111.91 133.99 160.88 182.93 205.20 229.78 254.88 277.00 356.31 1990 5.24 12.23 18.84 35.12 47.04 66.41 85.78 112.04 138.01 162.77 185.16 206.44 231.34 253.26 278.50 347.01 1991 5.38 13.46 19.63 36.89 53.42 70.16 93.31 114.29 142.16 166.12 184.45 205.67 232.92 255.70 277.58 348.73 1992 5.94 12.72 19.04 35.88 50.11 71.08 88.61 110.29 134.87 160.84 183.60 205.63 231.70 252.07 275.39 347.62 1993 5.10 11.57 23.82 33.36 51.24 66.94 89.28 110.87 135.71 157.85 182.17 204.81 227.22 250.52 275.46 364.06 1994 4.71 12.03 22.14 31.87 45.52 62.76 82.88 109.25 132.38 157.32 183.82 203.76 226.70 249.73 269.64 350.71 1995 4.90 13.62 22.44 35.13 48.60 71.02 89.57 109.22 137.50 160.01 182.17 204.74 228.28 251.22 273.36 369.78 1996 5.15 11.08 22.82 34.79 48.72 69.94 92.56 113.19 137.70 159.85 187.90 209.75 234.84 257.75 282.53 361.90 1997 5.05 12.66 20.26 36.31 51.22 68.43 91.24 112.02 135.70 157.20 183.61 207.67 233.38 257.23 276.85 356.01 1998 4.99 11.75 20.51 32.71 52.63 68.77 90.94 116.61 139.29 162.02 182.95 207.52 233.18 254.40 275.06 352.47 1999 5.42 11.22 21.77 35.53 53.96 71.60 93.71 113.88 136.24 159.02 184.11 206.73 230.95 254.11 276.93 355.41 2000 4.81 11.79 19.09 34.07 46.49 73.15 90.76 110.77 138.97 159.48 188.69 211.82 236.15 264.28 284.54 376.50 2001 4.72 12.80 22.48 33.89 49.13 68.23 95.00 116.01 141.83 166.01 190.73 215.14 242.84 265.54 289.89 352.62 2002 6.33 10.93 19.91 35.15 48.00 63.66 90.69 114.11 137.95 160.88 186.75 209.61 238.08 265.79 284.83 352.40 2003 5.66 11.51 21.60 34.02 50.70 69.17 92.12 115.31 137.43 158.80 184.14 210.24 241.65 265.21 286.90 342.31 2004 6.33 11.94 21.93 35.51 46.15 64.95 89.10 111.40 134.73 158.94 184.57 210.08 230.56 259.66 277.51 344.93 2005 5.38 9.80 19.79 30.70 47.55 62.27 82.59 105.75 132.23 160.12 183.99 207.86 231.99 254.63 276.59 349.01 2006 5.52 12.63 17.81 33.27 46.90 64.04 84.60 109.63 128.02 155.10 182.21 206.80 231.96 255.90 269.42 348.34 2007 4.51 11.76 22.41 30.40 49.64 63.54 82.38 111.84 136.63 162.07 186.44 211.78 237.65 262.72 278.79 365.83 2008 4.56 11.92 21.83 36.66 49.11 70.13 93.26 114.70 138.27 157.86 179.43 207.84 231.34 259.44 278.87 377.80 2009 5.39 13.24 21.76 34.43 51.29 69.43 83.92 112.09 133.36 156.42 180.31 207.54 235.55 260.51 277.31 372.46 2010 5.12 11.01 22.02 35.60 49.02 67.91 89.40 112.96 133.56 157.33 182.60 210.61 237.15 264.11 286.54 366.28 2011 4.88 10.77 23.04 31.74 48.20 63.95 87.78 110.99 135.13 159.59 184.86 211.25 239.99 263.70 286.75 361.16 2012 5.19 13.07 21.96 34.06 47.77 73.65 89.05 114.08 137.19 163.41 185.83 212.36 236.08 262.05 283.80 359.29 2013 5.24 12.22 22.48 32.68 47.83 64.47 90.57 111.06 133.01 161.57 188.18 216.72 241.04 266.07 282.79 362.64 -1 @end of the data input file
1602
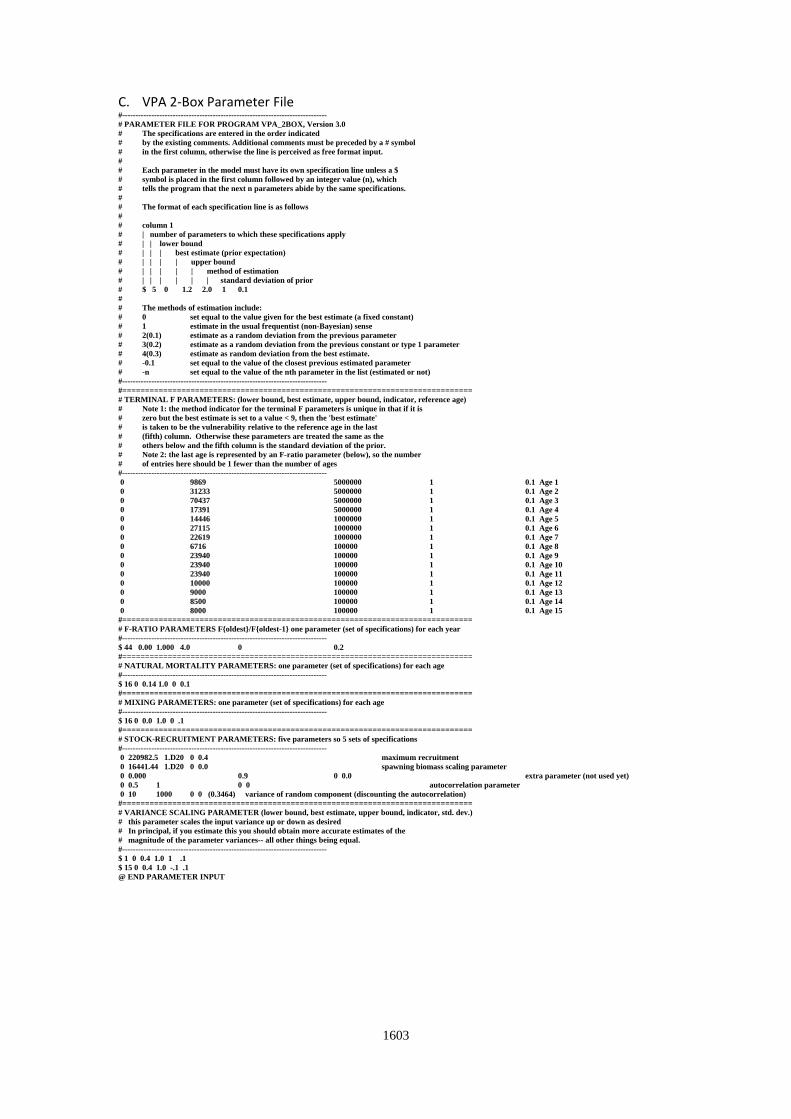
C. VPA 2-Box Parameter File #----------------------------------------------------------------------------- # PARAMETER FILE FOR PROGRAM VPA_2BOX, Version 3.0 # The specifications are entered in the order indicated # by the existing comments. Additional comments must be preceded by a # symbol # in the first column, otherwise the line is perceived as free format input. # # Each parameter in the model must have its own specification line unless a $ # symbol is placed in the first column followed by an integer value (n), which # tells the program that the next n parameters abide by the same specifications. # # The format of each specification line is as follows # # column 1 # | number of parameters to which these specifications apply # | | lower bound # | | | best estimate (prior expectation) # | | | | upper bound # | | | | | method of estimation # | | | | | | standard deviation of prior # $ 5 0 1.2 2.0 1 0.1 # # The methods of estimation include: # 0 set equal to the value given for the best estimate (a fixed constant) # 1 estimate in the usual frequentist (non-Bayesian) sense # 2(0.1) estimate as a random deviation from the previous parameter # 3(0.2) estimate as a random deviation from the previous constant or type 1 parameter # 4(0.3) estimate as random deviation from the best estimate. # -0.1 set equal to the value of the closest previous estimated parameter # -n set equal to the value of the nth parameter in the list (estimated or not) #----------------------------------------------------------------------------- #============================================================================= # TERMINAL F PARAMETERS: (lower bound, best estimate, upper bound, indicator, reference age) # Note 1: the method indicator for the terminal F parameters is unique in that if it is # zero but the best estimate is set to a value < 9, then the 'best estimate' # is taken to be the vulnerability relative to the reference age in the last # (fifth) column. Otherwise these parameters are treated the same as the # others below and the fifth column is the standard deviation of the prior. # Note 2: the last age is represented by an F-ratio parameter (below), so the number # of entries here should be 1 fewer than the number of ages #----------------------------------------------------------------------------- 0 9869 5000000 1 0.1 Age 1 0 31233 5000000 1 0.1 Age 2 0 70437 5000000 1 0.1 Age 3 0 17391 5000000 1 0.1 Age 4 0 14446 1000000 1 0.1 Age 5 0 27115 1000000 1 0.1 Age 6 0 22619 1000000 1 0.1 Age 7 0 6716 100000 1 0.1 Age 8 0 23940 100000 1 0.1 Age 9 0 23940 100000 1 0.1 Age 10 0 23940 100000 1 0.1 Age 11 0 10000 100000 1 0.1 Age 12 0 9000 100000 1 0.1 Age 13 0 8500 100000 1 0.1 Age 14 0 8000 100000 1 0.1 Age 15 #============================================================================= # F-RATIO PARAMETERS F{oldest}/F{oldest-1} one parameter (set of specifications) for each year #----------------------------------------------------------------------------- $ 44 0.00 1.000 4.0 0 0.2 #============================================================================= # NATURAL MORTALITY PARAMETERS: one parameter (set of specifications) for each age #----------------------------------------------------------------------------- $ 16 0 0.14 1.0 0 0.1 #============================================================================= # MIXING PARAMETERS: one parameter (set of specifications) for each age #----------------------------------------------------------------------------- $ 16 0 0.0 1.0 0 .1 #============================================================================= # STOCK-RECRUITMENT PARAMETERS: five parameters so 5 sets of specifications #----------------------------------------------------------------------------- 0 220982.5 1.D20 0 0.4 maximum recruitment 0 16441.44 1.D20 0 0.0 spawning biomass scaling parameter 0 0.000 0.9 0 0.0 extra parameter (not used yet) 0 0.5 1 0 0 autocorrelation parameter 0 10 1000 0 0 (0.3464) variance of random component (discounting the autocorrelation) #============================================================================= # VARIANCE SCALING PARAMETER (lower bound, best estimate, upper bound, indicator, std. dev.) # this parameter scales the input variance up or down as desired # In principal, if you estimate this you should obtain more accurate estimates of the # magnitude of the parameter variances-- all other things being equal. #----------------------------------------------------------------------------- $ 1 0 0.4 1.0 1 .1 $ 15 0 0.4 1.0 -.1 .1 @ END PARAMETER INPUT
1603