a preliminary characterization of applied-field mpd
TRANSCRIPT

NASA Contractor Report 187165
AIAA-91-2339
A Preliminary Characterization ofApplied-Field MPD Thruster Plumes
Roger M. Myers
Sverdrup Technology, Inc.
Lewis Research Center Group
Brook Park, Ohio
David Wehrle
Cleveland State University
Cleveland, Ohio
Mark Vemyi
University of Akron
Akron, Ohio
James Biaglow
University of Cincinnati
Cincinnati, Ohio
Shawn Reese
Ohio University
Athens, Ohio
August 1991
Prepared for
Lewis Research Center
Under Contract NAS3- 25266
ltl/ ANational Aeronautics andSpace Administration
( _'_!A q A- (. :t- ] !_? 1 £ _ ) ttC !,_it{:t AC 'IF _kt L A I .,r.13_'! 0 7.:
T__7t!.J:JT C!7Ik P iot I i_77!:,i
A P i:>t. [ ic D- F 17E I_{) i_4P i)
F i ti{_l i_:_Ti;_C._l" _ ( Sver Jrup
l:) C _ 1_ 2 1H
:(3.Sl ZO
7'491 - 3 0 2 0 1

A Preliminary Characterization of Applied-Field MPD Thruster Plumes
Roger M. Myers l
Sverdrup Technology, Inc.
Lewis Research Center Group
Brook Park, Ohio 44142
David Wehrle 2
Cleveland State University
Cleveland, Ohio 44115
Mark Vernyi 3
University of Akron
Akron, Ohio 44325
James Biaglow 4
University of Cincinnati
Cincinnati, Ohio 45221
Shawn Reese 5
Ohio University
Athens, Ohio 45701
Abstract
Electric probes, quantitative imaging, and emission spectroscopy were used to study
the plume characteristics of applied-field MPD thrusters. The measurements showed that the
applied magnetic field plays the dominant role in establishing the plume structure, followed in
importance by the cathode geometry and propellant. The anode radius had no measureable
impact on the plume characteristics. For all cases studied the plume was highly ionized,
though spectral lines of neutral species were always present. Centerline electron densities and
temperatures ranged from 2 x 10¹⁸ to 8 x 10 is m -3 and from 7500 to 20,000 K, respectively.
The plume was strongly confined by the magnetic field, with radial density gradients
increasing monotonically with applied field strength. Plasma potential measurements show a
strong effect of the magnetic field on the electrical conductivity and indicate the presence of
radial current conduction in the plume.
IPropulsion engineer, member AIAA
2undergraduate student
3undergraduate student, member AIAA
4undergraduate student
5undergraduate student

Aik
Ap
Bz
e
Eu
gi
ieIp
Iik
k
meN
T
v
Vb
Uik
Nomenclaturetransition probability, sec -1
probe surface area, m2
applied field strength at magnet exit plane, T
electron charge, C
energy of upper excited state, J
degeneracy of excited state
electron saturation current, A
probe current, A
intensity, arbitrary units
discharge current, A
Boltzmann's constant, J/K
electron mass, kg
number density, m -3
temperature, K
average particle speed, ln/s
probe bias voltage, V
frequency of light from i - k transition, sec -1
Introduction
Magnetoplasmadynamic (MPD) thrusters have demonstrated performance and power-
handling capabilties which make them attractive for use as the primai), propulsion system on
orbit raising and planetary missions I. Thruster efficiencies over 40% and specific impulses
over 5000 seconds have been demonstrated at power levels ranging from 30 kW to 5 MW,
with the low-power thrusters operating in a steady-state mode and thrusters with powers over
500 kW operating in a pulsed, or quasi-steady mode, with test times of 1 - 2 milliseconds.
While these performance levels might satisfy certain missions, there remain fundamental
questions about the scaling of performance parameters with thruster power level, propellant,
and the relationship between the quasi-steady thruster results and those obtained from steady-
state thrusters. In addition, all of the high-performance data have been obtained from
thrusters utilizing applied axial magnetic fields, and there is presently only a limited under-
standing of the physics of applied field thruster plasma acceleration.
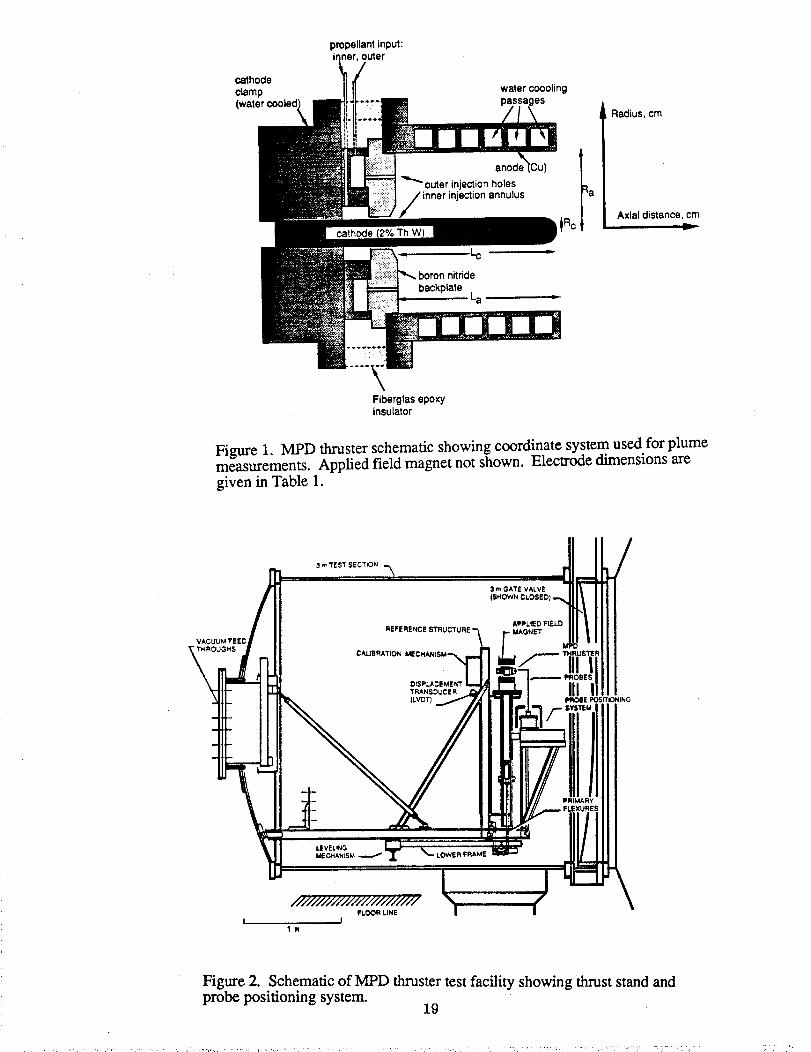
A typical MPD thruster, shown in Fig. 1, consists of a central cathode with a coaxial,
cylindrical anode. Propellant, injected through an insulating backplate, is heated, ionized, and
accelerated via the interaction of the discharge current and the self-induced or applied
magnetic field. This applied field is usually generated using solenoidal coils external to the
anode.
While a substantial body of data exists concerning the plasma of self-field MPD
2

thrusters,little work hasbeendoneto characterizethe impactof an externally applied field on
the plasma properties, This is particularly important in light of recent res_Ults showing
substantially improved performance with applied-field MPD thrusters2-5. Plasma property
measurements can be used not only to study the scaling properties of the thrusters via the
governing non-dimensional parameters, but they are also essential for verification of computer
models. Quasi-steady testing permits insertion of diagnostic probes into the thrust chambers
to make internal property measurements, but this is currently impossible with steady-state
thrusters due to the extremely high heat fluxes experienced in the chamber. For this reason
plasma property measurements in steady-state thrusters are usually confined to the plume
region.
This paper presents the results of an effort to measure the global plasma characteristics
in the plume of several applied-field MPD thrusters. Three diagnostics were used: emission
spectroscopy, quantitative imaging, and electric probes. In Section II the experimental facility
and thruster designs are briefly described, followed by a detailed discussion of the diagnostic
techniques and their implementations. Results of the species identification, global ionic
excited-state distribution, and electron temperature and density distribution measurements are
presented in Section III. Finally, a brief discussion of the implications of the measurements
for the dominant physics is given and the work summarized.
II. Experimental Apparatus and Procedures
Vacuum Facility and Power Supplies
The thruster test stand, shown in Fig. 2, was mounted in a 3 m diameter, 3 m long
spool piece attached to a 7.6 m diameter, 21 m long vacuum chamber via a 3 m diameter gate
valve. The facility was pumped by 19 oil diffusion pumps backed by three roots blowers and
two mechanical pumps. The tank pressure was maintained below 0.07 Pa (5 x 10 -4 Tort)
indicated pressure during all tests. Details of the facility and performance diagnostics are
given in Ref. 4-6.
i
The thrusters were powered using a set of six 66 kW Miller welding supplies
connected in a series-parallel network providing up to 3000 amps at 130 volts. Typical
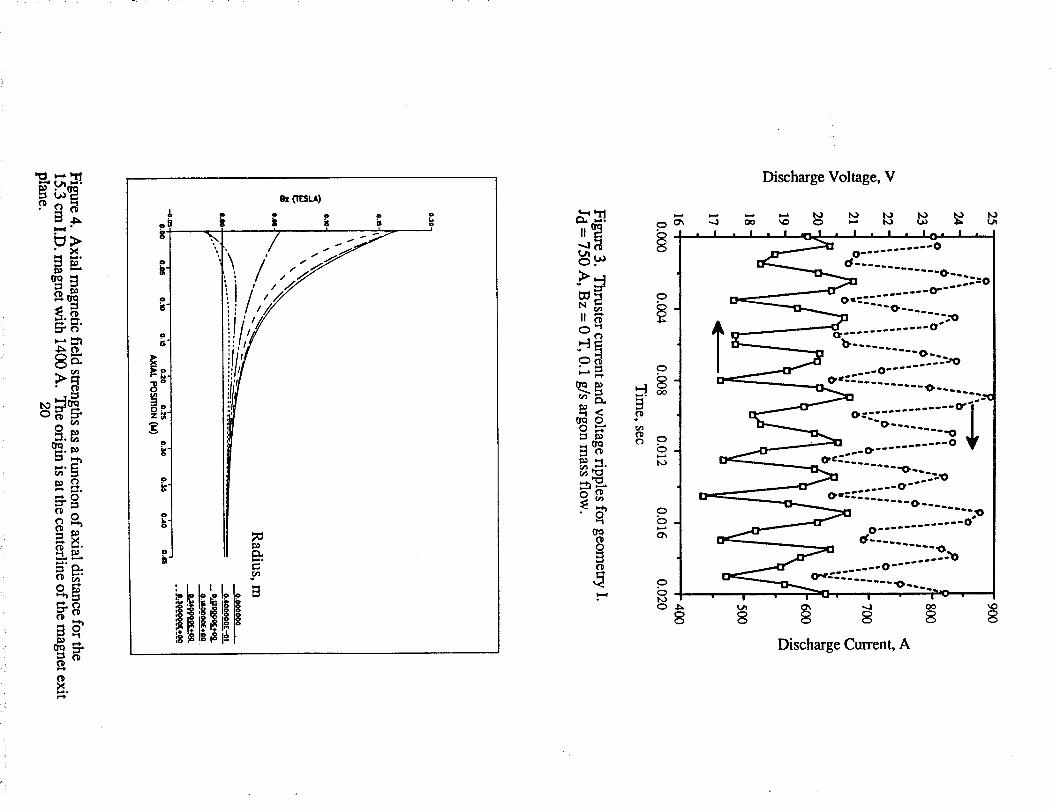
thruster current and voltage ripples are shown in Fig. 3 for a thruster operating at approxi-
mately 15 kW. It is clear that the thruster discharge current and voltage had substantial
ripple. The peak,to-peak amplitude for the case shown was 30%, though the ripple magni-
tude and frequency appeared to depend on both thruster geometry and operating conditions.
The discharge currents and voltages reported in the following sections correspond to the mean
v:alues of these parameters. As discussed below this ripple had a large impac t on the plume
diagnostics. •
Thruster and Applied Field Magnet Designs
A schematic of the MPD thrusters used in this study is shown in Fig. 1. The thrusters
3
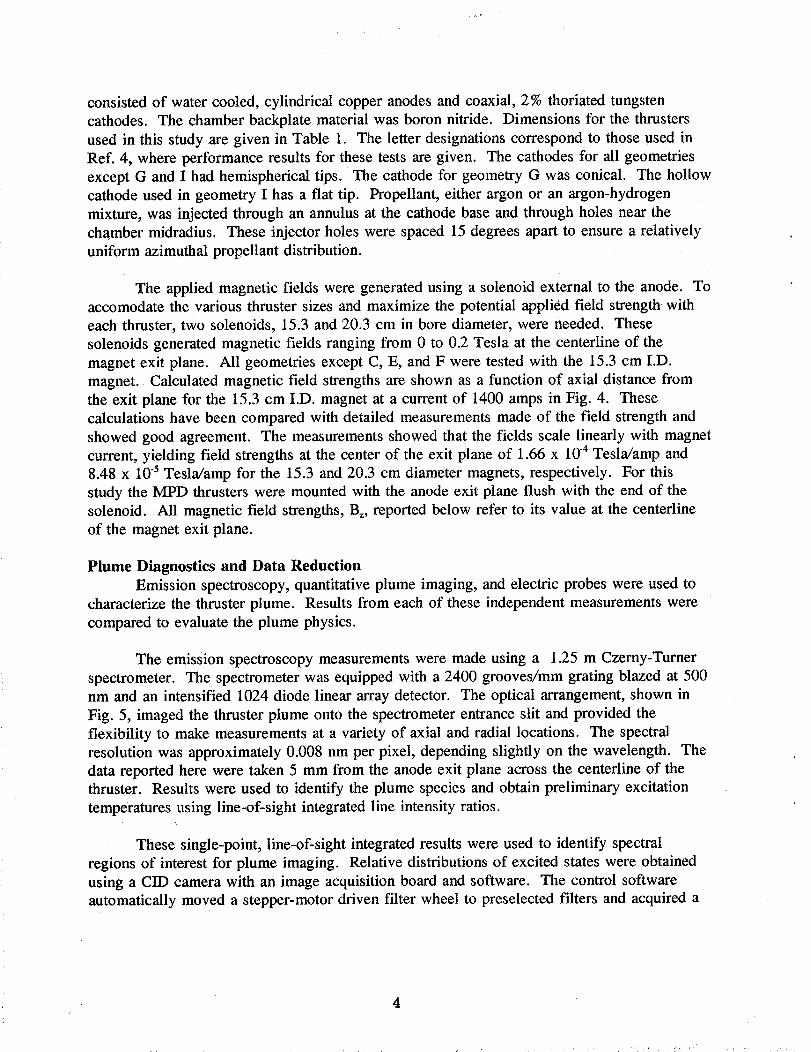
consistedof watercooled,cylindrical copperanodesandcoaxial,2% thoriatedtungstencathodes.The chamberbackplatematerialwasboronnitride. Dimensionsfor the thrustersusedin this study aregiven in Table 1. The letter designationscorrespondto thoseusedinRef. 4, whereperformanceresultsfor thesetestsaregiven. The cathodesfor all geometriesexceptG andI had hemisphericaltips. The cathodefor geometryG wasconical. The hollowcathodeusedin geometryI hasa flat tip. Propellant,eitherargonor an argon-hydrogenmixture,was injectedthroughan annulusat the cathodebaseand throughholesnearthechambermidradius. Theseinjectorholeswerespaced15degreesapartto ensurea relativelyuniform azimuthalpropellantdistribution.
The appliedmagneticfields weregeneratedusinga solenoidexternalto the anode. Toaccomodatethe variousthrustersizesandmaximizethe potentialappliedfield strengthwitheachthruster,two solenoids,15.3and20.3cm in borediameter,were needed.Thesesolenoidsgeneratedmagneticfields rangingfrom 0 to 0.2 Teslaat the centerlineof themagnetexit plane. All geometriesexceptC, E, andF were testedwith the 15.3cm I.D.magnet. Calculatedmagneticfield strengthsareshownasa function of axial distancefromtheexit planefor the 15.3cm I.D. magnetat a currentof 1400ampsin Fig. 4. Thesecalculationshave beencomparedwith detailedmeasurementsmadeof the field strengthandshowedgoodagreement.The measurementsshowedthat the fields scalelinearly with magnetcurrent,yielding field strengthsat the centerof the exit planeof 1.66x 10 4 Tesla/amp and
8.48 x 10 5 Tesla/amp for the 15.3 and 20.3 cm diameter magnets, respectively. For this
study the MPD thrusters were mounted with the anode exit plane flush with the end of the
solenoid. All magnetic field strengths, Bz, reported below refer to its value at the centerline
of the magnet exit plane.
Plume Diagnostics and Data Reduction
Emission spectroscopy, quantitative plume imaging, and electric probes were used to
characterize the thruster plume. Results from each of these independent measurements were
compared to evaluate the plume physics.
The emission spectroscopy measurements were made using a 1.25 m Czerny-Turner
spectrometer. The spectrometer was equipped with a 2400 grooves/mm grating blazed at 500
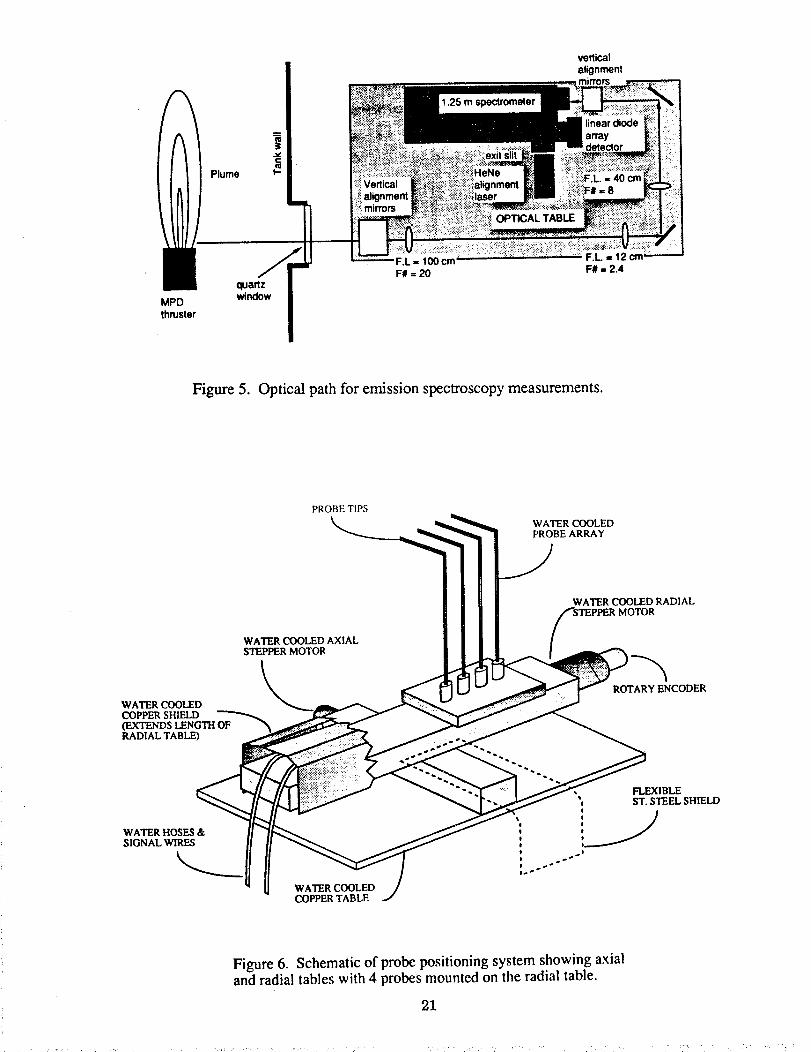
nm and an intensified 1024 diode linear array detector. The optical arrangement, shown in
Fig. 5, imaged the thruster plume onto the spectrometer entrance slit and provided the
flexibility to make measurements at a variety of axial and radial locations. The spectral
resolution was approximately 0.008 nm per pixel, depending slightly on the wavelength. The
data reported here were taken 5 mm from the anode exit plane across the centerline of the
thruster. Results were used to identify the plume species and obtain preliminary excitation
temperatures using line-of-sight integrated line intensity ratios.
These single-point, line-of-sight integrated results were used to identify spectral
regions of interest for plume imaging. Relative distributions of excited states were obtained
using a CID camera with an image acquisition board and software. The control software
automatically moved a stepper-motor driven filter wheel to preselected filters and acquired a

presetnumberof imageswith eachfilter. For this work two filters wereused:onecenteredat 488.0 nm with a 1 nm bandpass,and a secondcenteredat 514.7nm with a 0.8 nmbandpass.Both filters passonly light from argonion transitions. Eachpicture consistedof493 columnsand461 rows of pixels with 8-bit intensity resolution. The line-of-sightintensityintegralsrecordedin theseimageswerereducedto radial emissioncoefficientprofiles usingthe Abel inversiontechniquedevelopedby Sudharsanan7. No intensitycalibrationwasperformedon the optical system,so that only relative valueswere obtained.
The Abel-inversionsoftwareloadedan image,interactively found the thrusterexitplane,automaticallyidentified the plumeregion,and performedthe inversionon the maxi-mum numberof columnspossiblewithin the constraintsof the plotting software. The plumeregionwas identified in orderto maximizethe spatialresolutionwithin the luminousplumeandpreventinversionof dark regions. The plotting packagelimited the numberof columnsto 54, which typically correspondedto a spatialresolutionin the axial direction of 0.1cm.The Abel integralequationwassolvedfor eachcolumnof intensity profiles by a multistepprocess.First, the discreteFourier transform(DFT) of the intensityprofile wascomputedusing a fast-Fouriertransformalgorithm. No attempt was made to reduce signal noise. The
axis of symmetry of the data was determined by minimizing the imaginary component of the
DFF. This component was then set equal to zero to force symmetry for the inversion. The
inverse Hankel transform was then applied to the shifted Fourier transformed input profile to
yield the relative emission coefficient for the observed transition as a function of radius.
Inversion of 54 columns required about 40 minutes on a 386-based personal computer. The
inversion routine was verified with several known test functions 8. However, all of these test
functions had on-axis peaks, while much of the experimental data consisted of profiles with
off-axis peaks. No test functions were found which could be used to verify the validity of the
algorithm under those conditions.
Interpretation of the spectroscopic and plume-imaging results required quantitative
distributions of electron density and temperature. These were obtained using electric probes.
A fast-moving, probe-positioning system was mounted in front of the thrust stand as shown in
Fig. 2. This probe positioning system, shown schematically in Fig. 6, had the capability of
holding four probes and providing 91 cm of radial motion and 30 cm of axial motion with
linear tables, both driven by computer-controlled stepper motors. The tables were covered
with water cooled copper sheet to prevent them from over-heating during thruster operation.
After moving to the preset axial postion, the probes were moved radially through the plume at
a constant velocity of 30 cm/sec with acceleration and deceleration phases near the ends of
the traverse.
A single 0.7 cm long, 0.013 cm diameter, electric probe was used for these measure-
ments. The probe dimensions were selected to minimize end-effects, reduce peak saturation
currents, and permit the use of thin-sheath theory for the data reduction 9,t°. The probe was
mounted in a 0.1 cm diameter, 4 cm long, alumina tube which was glued into the end of an
L-shaped, water-cooled, stainless-steel tube with ceramic adhesive. Triangular braces were
attached to the vertical portion of the steel tube to minimize vibration while the probe was in
5

motion. Water cooling was requiredonly alongthe vertical portion of the probesupporttopreventmelting of the wire insulation. Tungstenwire andceramicinsulationwereusedneartheprobetip, ratherthanwater cooling, in orderto minimize the probecross-section.
A testwasperformedto establishthe impactof surfacecontaminantson the proberesponse.The probeswerecleanedduring the pumpdown of the 3 m diameterspool pieceusingan 800V, 0.5 mA glow dischargebetweenthe probetips and anelectrodeplacedapproximately8 cm awayfrom the tips. The areaaroundthe probeswasflooded with argonin aneffort to preventresidualair from damagingthe surface. During testingwith thecleanedprobesno evidenceof signaldegradationwasobserved,indicatingprobe-surfacecontaminationhadlittle effect on the measurements.The probe-biascircuit, describedbelow,was left on throughoutall tests,so thatsomeprobecleaningwould takeplacebetweenperiodsof dataacquisition.
The probewasbiasedwith respectto facility ground(the vacuumtank wall) usingabipolar amplifierdriven by a function generator.The function generatorprovideda continu-ous triangularwave at 135Hz, which the bipolar supplyamplified to +/- 15 volts. Thecircuit is shownin Fig. 7. The triangle-wavefrequencywaschosento minimize the timeover which the probehadto sustainthe electronsaturationcurrentandto provide onecompletevoltage- currentcharacteristicfor the probeevery 1 mm of radial motion. Severaltestswereperformedto verify the frequencyresponseof the probeelectronics,andnodistortionswere measurablebelow 500Hz.
The softwareusedto control probemotionpermittedautomaticscanningof theplumeproperties. The axial distancesfrom thethrusterat which radial profiles wereto be takenwere preselectedandthe entire data-acquisitionsequencewasperformedautomatically.Probecurrentandvoltagedatawerecollectedcontinuouslyat either76 or 150kHz during the radialtraverseandstoredoncethe traversewascompleted. Either50,000or 100,000datasetsweretakeneachtraverse,correspondingto either500or 1000full voltage- currentcharacteristicsfor probe. The largenumberof points per rampwererequiredto properly curvefit thedataduring datareduction. The resultinglargedatasetsrequiredup to 3 minutesto store,andlimited the numberof radial distributionsobtainedat a given operatingcondition. Inaddition,the very high heatfluxes experiencedbythe probesprecludedregularmeasurementsdoserthan 15cm from the thruster,thoughsomepasseswere madeascloseas 6 cm.
The electric-probedatawere automaticallyreducedusingsoftwarewhich loadedin thecontinuousvoltageand currentsignals,isolatedthe individual Vt, - Ir characteristics,per-formed the requiredcurve fits, and storedthe results. The softwarepermittedselectionof theportion of theradial profile to be reducedand automaticallyplotted the raw dataandthecurve fits to the semi-logplotsusedto calculatethe electrondensity,temperature,andtheplasmapotential. Simpleelectric-probetheory9'1°wasusedto reducethe data,andno attemptwasmadeto accountfor the effect of the applied:magneticfield. Neglectingthe effectsofthe appliedmagneticfield wasjustified by consideringthe ratio of the electrongyro radiustothe proberadius1°. For all datashownexceptthat collectedlessthan 10 cm from the thruster
_
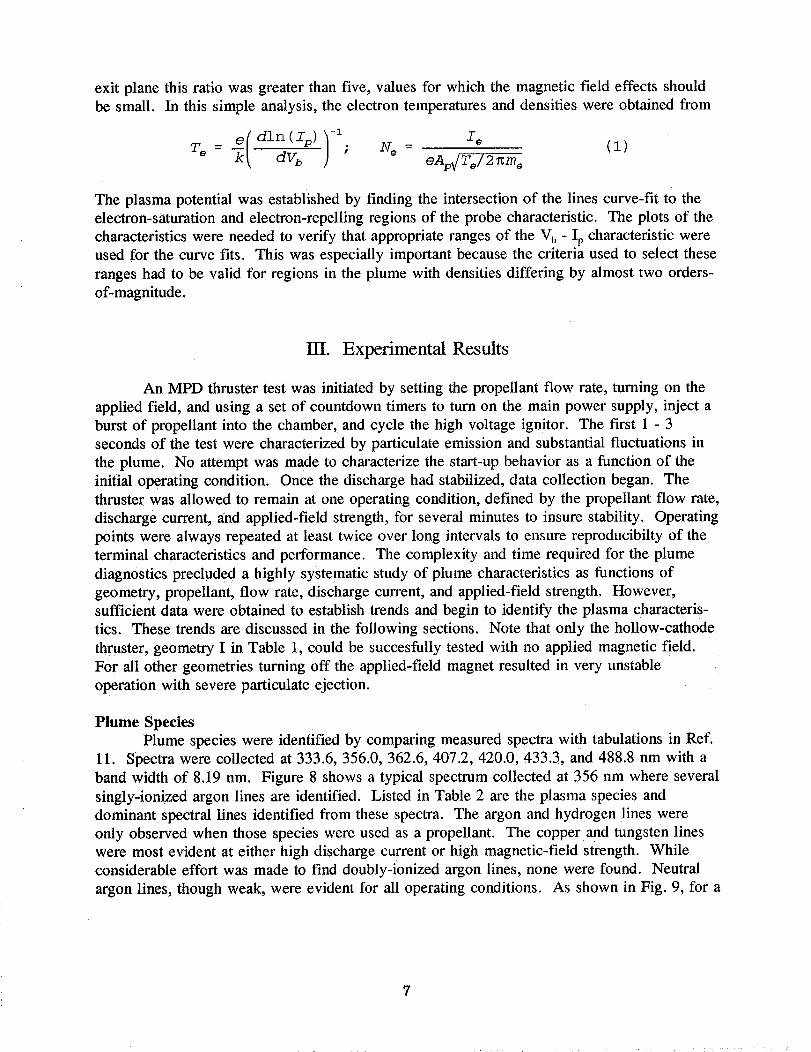
exit plane this ratio was greater than five, values for which the magnetic field effects should
be small. In this simple analysis, the electron temperatures and densities were obtained from
k( dln (Ip)) -I IeTe = dUb ; Ne = eA;_T_/2_m_(I)
The plasma potential was established by finding the intersection of the lines curve-fit to the
electron-saturation and electron-repelling regions of the probe characteristic. The plots of the
characteristics were needed to verify that appropriate ranges of the V_, - Ip characteristic were
used for the curve fits. This was especially important because the criteria used to select these
ranges had to be valid for regions in the plume with densities differing by almost two orders-
of-magnitude.
III. Experimental Results
An MPD thruster test was initiated by setting the propellant flow rate, turning on the
applied field, and using a set of countdown timers to turn on the main power supply, inject a
burst of propellant into the chamber, and cycle the high voltage ignitor. The first 1 - 3
seconds of the test were characterized by particulate emission and substantial fluctuations in
the plume. No attempt was made to characterize the start-up behavior as a function of the
initial operating condition. Once the discharge had stabilized, data collection began. The
thruster was allowed to remain at one operating condition, defined by the propellant flow rate,
discharge current, and applied-field strength, for several minutes to insure stability. Operating
points were always repeated at least twice over long intervals to ensure reproducibilty of the
terminal characteristics and performance. The complexity and time required for the plume
diagnostics precluded a highly systematic study of plume characteristics as functions ofgeometry, propellant, flow rate, discharge current, and applied-field strength. However,
sufficient data were obtained to establish trends and begin to identify the plasma characteris-
tics. These trends are discussed in the following sections. Note that only the hollow-cathode
thruster, geometry I in Table 1, could be succesfully tested with no applied magnetic field.
For all other geometries turning off the applied-field magnet resulted in very unstable
operation with severe particulate ejection.
Plume Species
Plume species were identified by comparing measured spectra with tabulations in Ref.
11. Spectra were collected at 333.6, 356.0, 362.6, 407.2, 420.0, 433.3, and 488.8 nm with a
band width of 8.19 nm. Figure 8 shows a typical spectrum collected at 356 nm where several
singly-ionized argon lines are identified. Listed in Table 2 are the plasma species and
dominant spectral lines identified from these spectra. The argon and hydrogen lines were
only observed when those species were used as a propellant. The copper and tungsten lines
were most evident at either high discharge current or high magnetic-field strength. While
considerable effort was made to find doubly-ionized argon lines, none were found. Neutral
argon lines, though weak, were evident for all operating conditions. As shown in Fig. 9, for a
testwith hydrogenpropellanton geometryA, the peak_ line intensity increasedlinearlywith applied-fieldstrength.It wasnotpossibleto obtainmoredetailedcorrelationsof lineintensitieswith thrusteroperatingconditionsdueto the limited numberof datasets.
Density and Temperature Distributions
Preliminary estimates of the electron temperature near the thruster exit plane were
obtained assuming that the excited-state populations followed a Boltzmann distribution.
Using this assumption, the temperature was obtained from
_ 1 ln(IiggjAjlvJ--i)T. k(Si - Zj) ZjlgiA kv kJ(2)
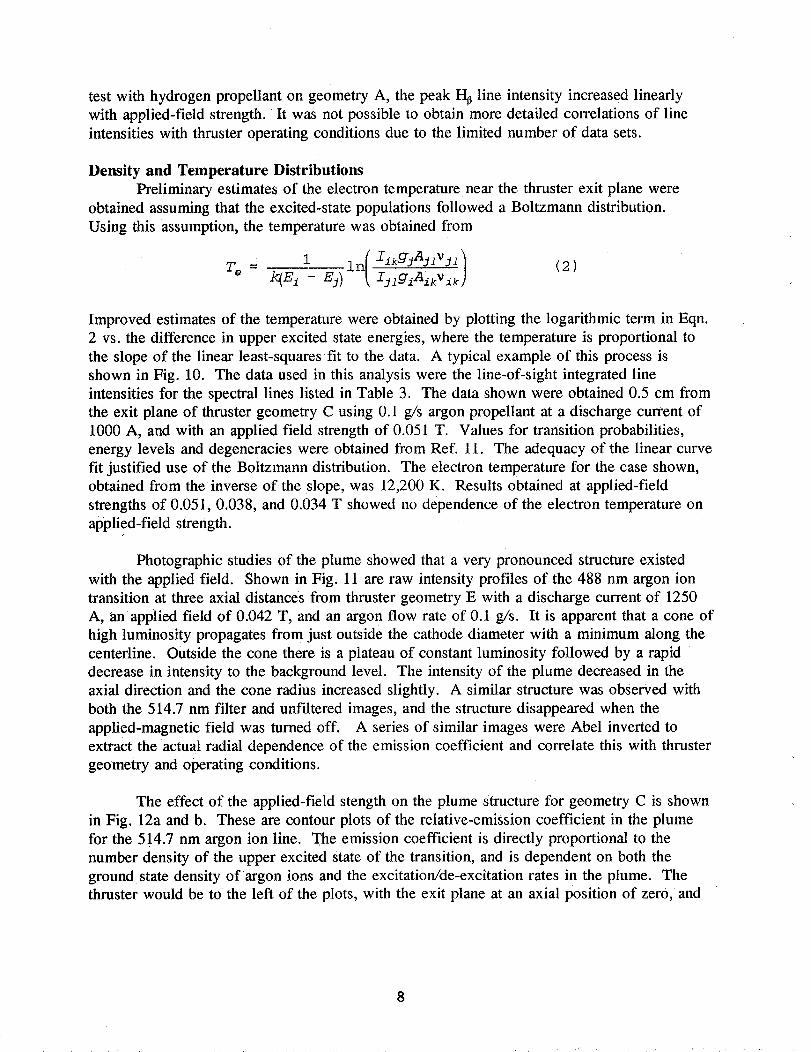
Improved estimates of the temperature were obtained by plotting the logarithmic term in Eqn.
2 vs. the difference in upper excited state energies, where the temperature is proportional to
the slope of the linear least-squares fit to the data. A typical example of this process is
shown in Fig. 10. The data used in this analysis were the line-of-sight integrated line
intensities for the spectral lines listed in Table 3. The data shown were obtained 0.5 cm from
the exit plane of thruster geometry C using 0.1 g/s argon propellant at a discharge current of
1000 A, and with an applied field strength of 0.051 T. Values for transition probabilities,
energy levels and degeneracies were obtained from Ref. l 1. The adequacy of the linear curve
fit justified use of the Boltzmann distribution. The electron temperature for the case shown,
obtained from the inverse of the slope, was 12,200 K. Results obtained at applied-field
strengths of 0.051, 0.038, and 0.034 T showed no dependence of the electron temperature on
applied-field strength.
Photographic studies of the plume showed that a very pronounced structure existed
with the applied field. Shown in Fig. 11 are raw intensity profiles of the 488 nm argon ion
transition at three axial distances from thruster geometry E with a discharge current of 1250
A, an:applied field of 0.042 T, and an argon flow rate of 0.1 g/s. It is apparent that a cone of
high luminosity propagates from just outside the cathode diameter with a minimum along the
centefline. Outside the cone there is a plateau of constant luminosity followed by a rapid
decrease in intensity to the background level. The intensity of the plume decreased in the
axial direction and the cone radius increased slightly. A similar structure was observed with
both the 514.7 nm filter and unfiltered images, and the structure disappeared when the
applied-magnetic field was turned off. A series of similar images were Abel inverted to
extract the actual radial dependence of the emission coefficient and correlate this with thruster
geometry and operating conditions.
The effect of the applied-field stength on the plume structure for geometry C is shown
in Fig. 12a and b. These are contour plots of the relative-emission coefficient in the plume
for the 514.7 nm argon ion line. The emission coefficient is directly proportional to the
number density of the upper excited state of the transition, and is dependent on both the
ground state density of argon ions and the excitation/de-excitation rates in the plume. The
thruster would be to the left of the plots, with the exit plane at an axial position of zero, and
8
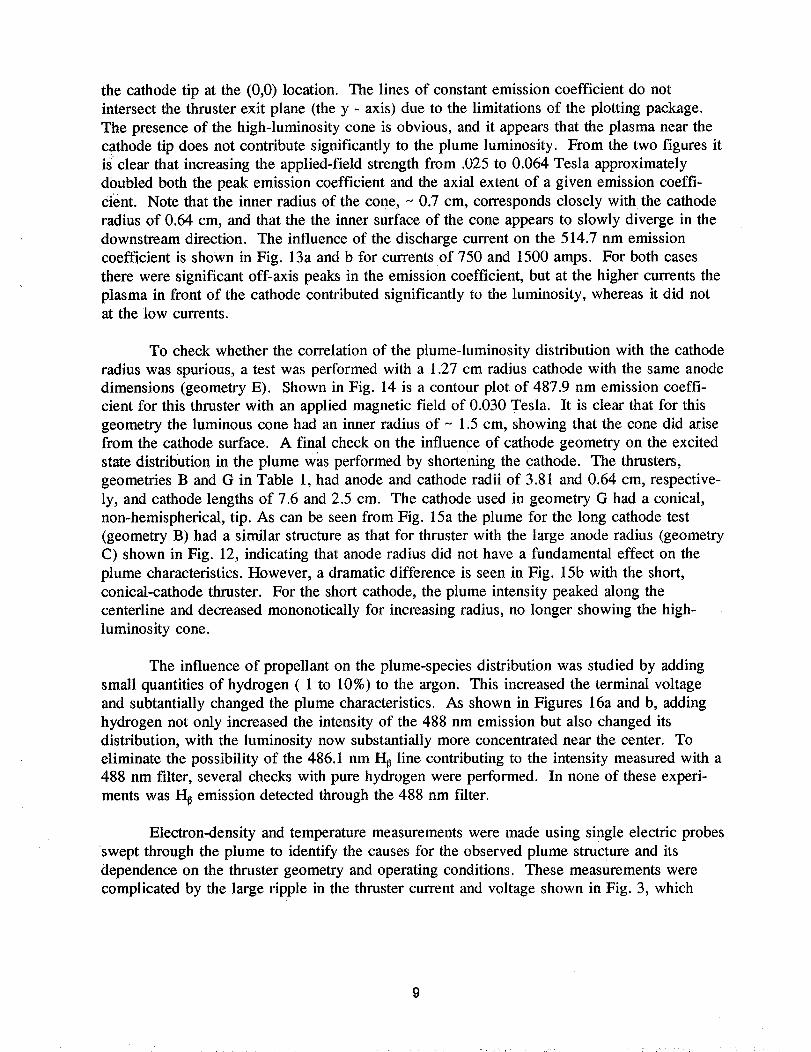
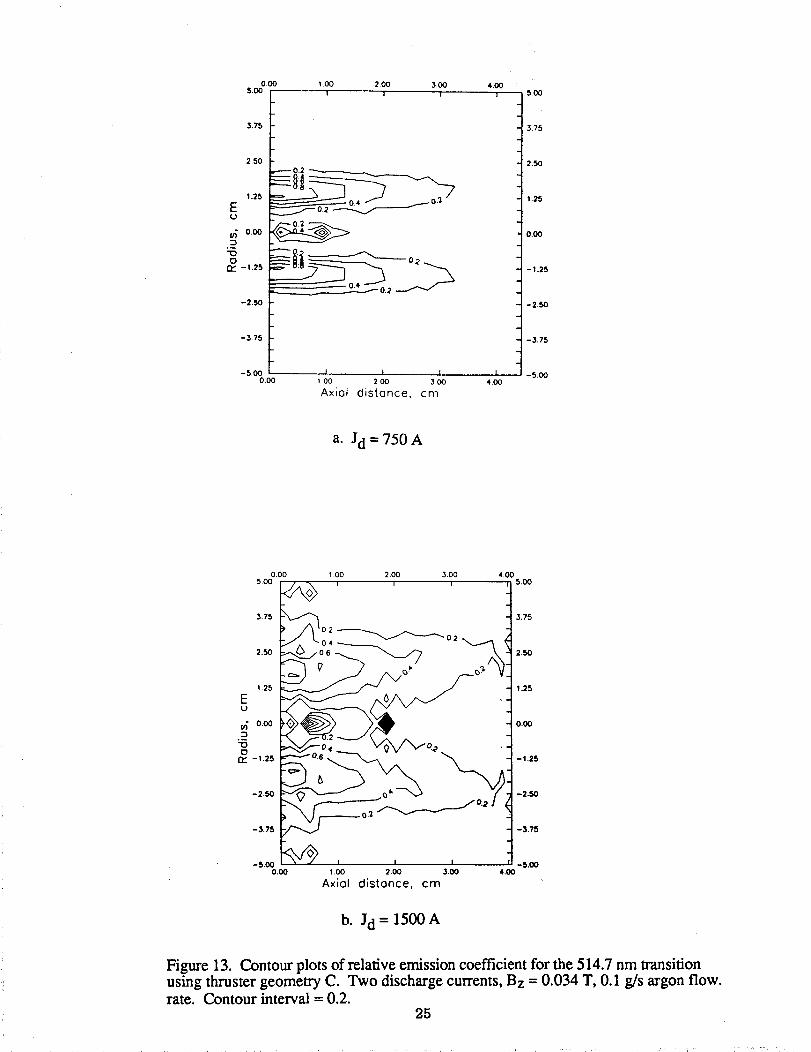
the cathodetip at the (0,0) location. The lines of constantemissioncoefficient do notintersectthe thrusterexit plane (they - axis)dueto the limitations of the plotting package.The presenceof the high-luminositycone is obvious,andit appearsthat the plasmanearthecathodetip doesnot contributesignificantly to the plumeluminosity. From the two figures itis Clearthat increasingthe applied-fieldstrengthfrom .025to 0.064Teslaapproximatelydoubledboth the peak emissioncoefficient andthe axial extentof a given emissioncoeffi-cient. Note that the inner radiusof the cone,~ 0.7 cm, correspondscloselywith the cathoderadiusof 0.64cm, andthat thethe inner surfaceof the coneappearsto slowly diverge in thedownstreamdirection. The influenceof the dischargecurrenton the 514.7nm emissioncoefficient is shownin Fig. 13aandb for currentsof 750 and 1500amps. For both casesthereweresignificantoff-axis peaksin the emissioncoefficient, but at the highercurrentstheplasmain front of the cathodecontributedsignificantly to the luminosity, whereasit did notat the low currents.
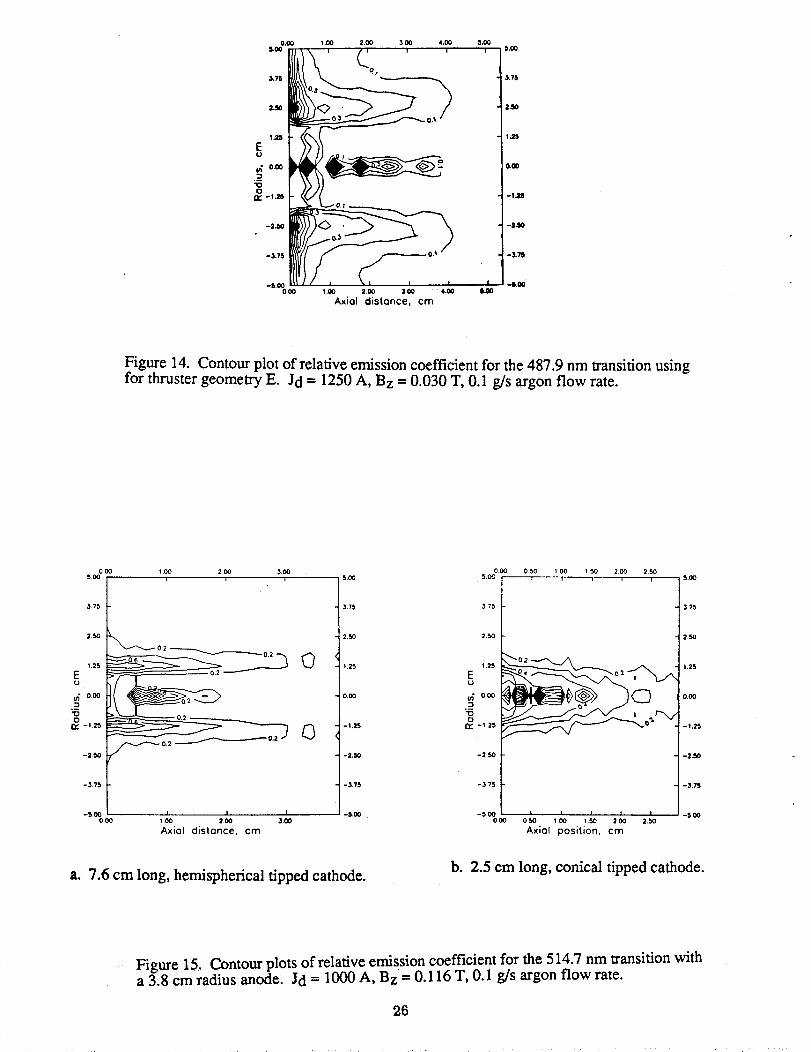
To checkwhetherthe correlationof the plume-luminositydistribution with the cathoderadiuswasspurious,a testwasperformedwith a 1.27cm radiuscathodewith the sameanodedimensions(geometryE). Shownin Fig. 14 is a contourplot of 487.9 nm emissioncoeffi-cient for this thrusterwith an appliedmagneticfield of 0.030Tesla. It is clearthat for thisgeometrythe luminous conehadan innerradiusof - 1.5cm, showing that the conedid arisefrom the cathodesurface. A final checkon the influenceof cathodegeometryon the excitedstatedistribution in the plume wasperformedby shorteningthe cathode. The thrusters,geometriesB and G in Table 1, hadanodeand cathoderadii of 3.81and0.64 cm, respective-ly, andcathodelengthsof 7.6 and2.5 cm. The cathodeusedin geometryG had a conical,non-hemispherical,tip. As can beseenfrom Fig. 15athe plumefor the long cathodetest(geometryB) had a similar structureasthat for thrusterwith the large anoderadius(geometryC) shownin Fig. 12, indicatingthat anoderadiusdid not havea fundamentaleffect on theplumecharacteristics.However,a dramaticdifferenceis seenin Fig. 15b with the short,conical-cathodethruster. For the shortcathode,the plumeintensitypeakedalongthecenterlineanddecreasedmononoticallyfor increasingradius,no longer showingthe high-luminosity cone.
The influenceof propellanton the plume-speciesdistribution wasstudiedby addingsmall quantitiesof hydrogen( 1 to 10%)to the argon. This increasedthe terminalvoltageand subtantiallychangedthe plumecharacteristics.As shownin Figures 16aand b, addinghydrogennot only increasedthe intensityof the 488 nm emissionbut also changeditsdistribution,with the luminosity now substantiallymoreconcentratednearthe center. Toeliminatethe possibility of the 486.1 nm H_line contributingto the intensity measuredwith a488 nm filter, severalcheckswith purehydrogenwereperformed. In noneof theseexperi-mentswas_ emissiondetectedthroughthe 488 nm filter.
Electron-densityandtemperaturemeasurementsweremadeusing singleelectric probes'swept through the plume to identify the causes for the observed plume structure and its
dependence on the thruster geometry and operating conditions. These measurements were
complicated by the large ripple in the thruster current and voltage shown in Fig. 3, which
9

inducedcorrespondingfluctuationsin the electrondensityandtemperature.Raw probecurrentandvoltagesignalstakenat a reducedprobe-biaspower supply frequencyof 13.5Hz(27 V-I characteristics/second)areshownin Fig. 17. Thesedataweretakenwith the hollow-cathodethruster(geometryI) outsidethe mainplumeto reducepowerto the probesresultingfrom maintainingthe electron-saturationcurrentsfor theseextendedperiods (seediscussioninSectionII). The probewasbiasedbetween+/- 17 volts. Theprobecurrentwasnearzero inthe ion-saturationregionand reacheda peakof - 0.013ampsin the electron-saturationregion.As the probecurrentincreased,the largethrustercurrentand voltageripples beganto impactthe signal, Theeffect peakedat ~ 30% ripple of the meanelectron-saturationcurrent. Themagnitudeof the probe-currentripple wascomparableto the 30%dischargecurrentrippleobservedduring the test (Fig. 3). The frequenciesweredifferent, however,with the powersupplyoscillating at ~ 450 Hz andthe electronsaturationcurrentat N360 Hz.
During dataacquisitionthe rampfrequencyof the biasvoltagewas 135Hz, or anorder-of-magnitudehigher thanthat usedin the abovedescribedtest. While this preventedlargefluctuationsfrom appearingin the electronsaturationcurrentof a given V - I character-istic, over a seriesof rampsthe valuesdid fluctuateby the same30% previously measured.Shownin Fig. 18 areraw, probe-voltageandcurrentsignalstakenat onelocation over0.03seconds.It is evidentthat theelectron-saturationcurrentfluctuatedsignificantly over thecourseof the measurements.Thesefluctuationswerethe principal sourceof scatterin theelectrondensity andtemperaturemeasurementspresentednext.
Showhin Fig. 19aandb areradial electrondensityprofiles taken 15and 35 cm awayfrom the hollow-cathodethruster,geometryI, both with and without anapplied-magneticfield. For bothcasesthe propellantflow ratewas0.15g/s argonandthe dischargecurrentwas1000AI The confining effect of the appliedfield is evident. The centerlinedensitieswith Bz -- 0.1 T were significantly higherthan thosefor Bz -- 0, and the radial densityprofilewith the appliedfield had a fiat-toppedcentralregionfollowed by a very rapid decreaseindensity. Specifically, 15 cm from the thruster,thedensityfor the casewithout anappliedfield dropsfrom a peakof ~ 2 x 10¹⁸ m 3 on center to 4 x 10¹⁷ m 3 at a radius of 30 cm, while
with the applied field, the density was approximately constant at 4 x 10 _8 in -3 for the inner 7
cm, but decreased to 1 x 10¹⁷ 111-3by a radius of 12 cm. Comparing the two cases in terms of
the observed radial number density gradients, it appears that the applied field maintained a
gradient of ~ 9 x 10¹⁹ m -a, while without the applied field this dropped by an order-of-
magnitude to 6.6 x 10 _8 m -4. In addition, the rate at which the density decreased with increas-
ing axial distance was much lower with the applied field than without it. At 15 cm from
the thrusters the centerline densities were comparable both with and without the field, but 35
cm away the density with the field was six times greater than for the case with no applied
field. These trends continued when the applied field strength was increased, but the changes
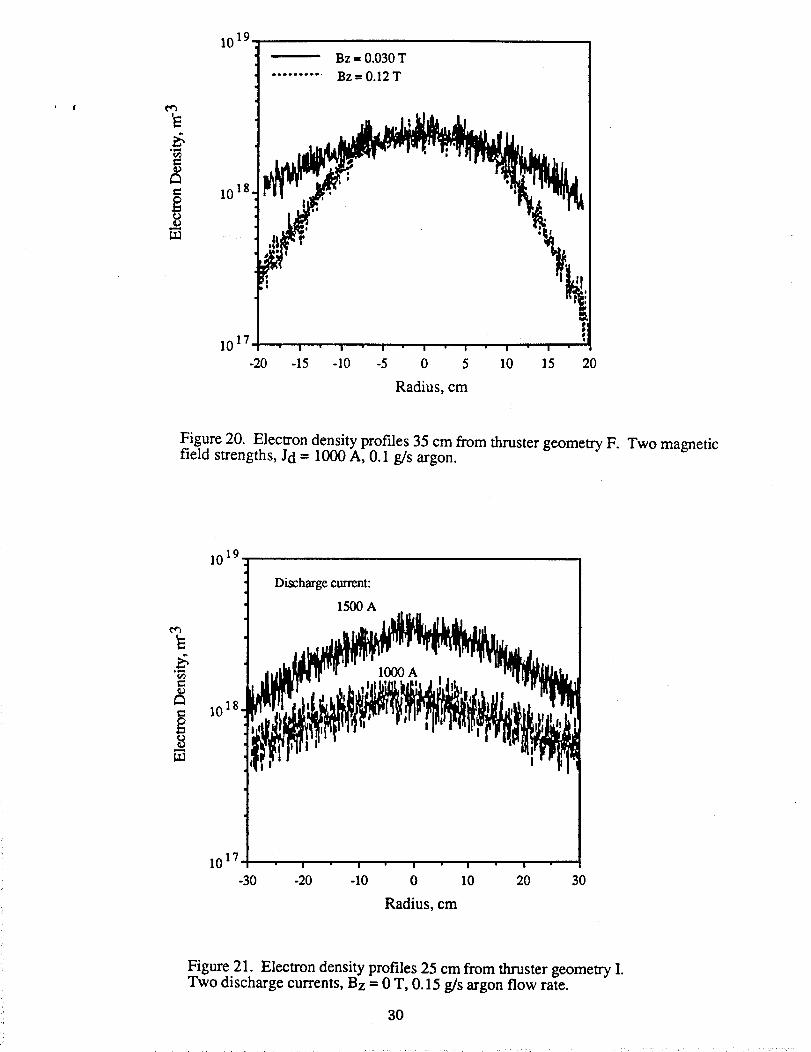
were less dramatic. Shown in Fig. 20 are electron density profiles obtained 35 cm from
thruster geometry F with a discharge current of 1000 A, an argon flow rate of 0.1 g/s, and
with applied fields of 0.030 and 0.12 Tesla. The centerline electron density did not change
significantly.for the two field strengths, though the radial profile was much sharper with the
higher applied field. The electron densities differed by almost an order of magnitude at a
10

radiusof 20 cm, showing that the higher field sustained much steeper radial density gradients.
The effect of the discharge current on the electron density profiles for zero applied
magnetic field is shown in Fig. 21. These data were taken 25 cm from the hollow-cathode
thruster, geometry I, at an argon mass flow rate of 0.15 g/s. The centerline density increasedfrom ~ 1 x 10 t8 m 3 at a current of 1000 A to ~ 4 x 10¹⁸ m -3 at a current of 1500 A.
However, increasing the discharge current did not dramatically change the the radial density
profile, but rather increased the density across the entire profile.
The high luminosity cone observed using the imaging was not reflected in the electron
density profiles shown above, though the profiles for cases with an applied magnetic field did
have relatively broad, fiat-topped peaks. While off-axis peaks corresponding to the luminosi-
ty cone did appear in the radial profiles of the electron saturation currents, they appear to
reflect changes in the electron temperature rather than the density. Shown in Fig. 22 is the
radial temperature profile for geometry B taken 25 cm from the thruster with a discharge
current of 1000 A, an applied field of 0.1 T, and an argon flow rate of 0.1 g/s. The relatively
fiat-topped density profiles are in sharp contrast to the off-axis peaks seen in the temperature
results. The temperature reached a minimum of -10,000 K on centerline, increased to a peak
of ~ 17,000 K at a radius of 5 cm, decreased to N 12,000 K and then rose monotonically at
higher radii. Note that these magnitudes are consistent with the 12,200 K obtained spectro-
scopically. The increase in scatter at the larger radii was due to a decrease in signal-to-noise
ratio as the electron density decreased. The cause for the increase in temperature at higher
radii is not known, though it may have been due to the higher radial diffusion rates of the
higher energy electrons. It is unlikely that the temperature increase was a result of an
increase in probe angle with respect to the flow, as this parameter has been shown not to
affect single probe temperature measurements. While it may have been an error due to the
presence of the Bi. and B z components of applied-magnetic field intersecting the probe tip, no
mechanism has been found which would explain the result. The same increase in tempera-
ture was observed at the lowest applied field strengths at the farthest axial distances from the
thruster, cases for which the electron gyro radius was more than 50 times the probe radius.
In addition, experiments performed using a triple electric-probe technique 12showed the similar
radial electron temperature profiles, indicating that the result was not due to the data
reduction technique.
The effect of the applied field on the electron temperature for the hollow cathode
thruster is illustrated in Fig. 23, which compares the results for Bz --- 0 and Bz -- 0.1 T at an
axial position 15 cm away from the thruster. It is clear that the centerline temperatures of
about 7500 K are unaffected by the applied field while the temperature at increasing radii
rises rapidly for the high applied field and is flat for the case of zero applied-field. The axial
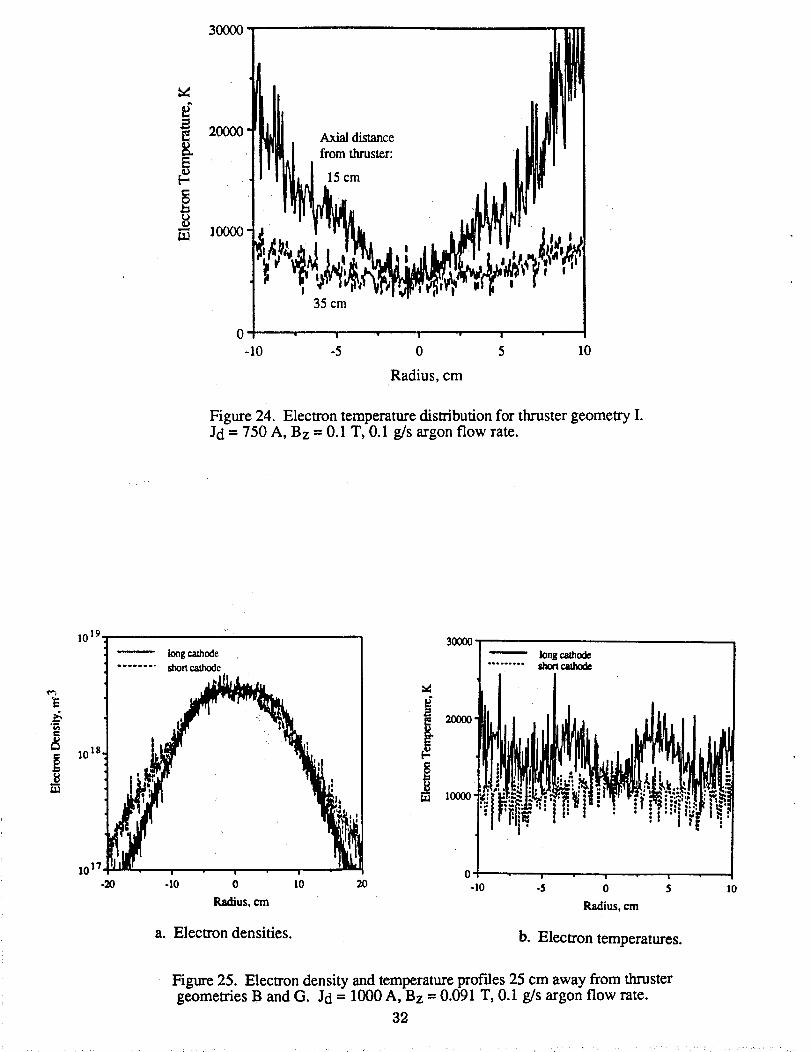
temperature distribution for the case with the applied field is shown in Fig. 24. Much as was
found with the electron density, the centedine temperature did not change significantly from
15 to 35 cm away from the thruster, though the radial distributions showed a substantial drop
in temperature at higher radii. The axial temperature distribution for thruster geometry I with
no applied-field showed no significant changes, and increasing the discharge current from
11

1000 to 2000 A without an applied field had no measurable effect on the electron tempera-
ture.
It was shown earlier using the images (Figures 12 - 16) that the cathode length had a
dramatic effect on the plume luminosity distribution (density distribution of upper excited
states). The corresponding comparisons of electron density and temperature measurements
are shown in Figures 25a and b. The cathode length had little effect on the electron density
distribution at 25 cm, but the temperature distribution with the short cathode is peaked on the
centefline without the off-axis peaks exhibited by the long cathode.
The influence of thruster geometry and operating conditions on the plume is also
evident in the behavior of the plasma potential. As discussed above, the electric probe was
biased relative to the vacuum facility wall, so that all reported potentials are with respect to
facility ground, not the thruster electrodes. However, for all operating conditions for thrusters
with long cathodes (geometries A, B, C, D, E, F, and I), the cathode was between 0 and -1 V
from facility ground. Only with the short-cathode thruster (geometry G) was the cathode not
close to ground potential, reaching a value of-15.5 V with respect to ground.
Figure 26 shows the influence of the applied magnetic field on the plasma potential
distribution. For the zero-field case studied with the hollow-cathode thruster shown in Fig.
26a, the plasma potential was flat and near zero throughout the plume, whereas when a
magnetic field of 0.041 T was applied, the potential increased by 3 to 5 volts and showed a
slight minima near the centerline. This trend continued with higher magnetic fields. Figure
26b shows the potential distributions for geometry F for applied fields of 0.03 and 0.12 Tesla.
For the operating conditions shown, the potential at the lower field was approximately
uniform with a magnitude of ~ 5 V. At the higher fields strengths, there was some structure,
with a minimum on the centerline, and an overall increase of 3 to 5 volts. Increasing the
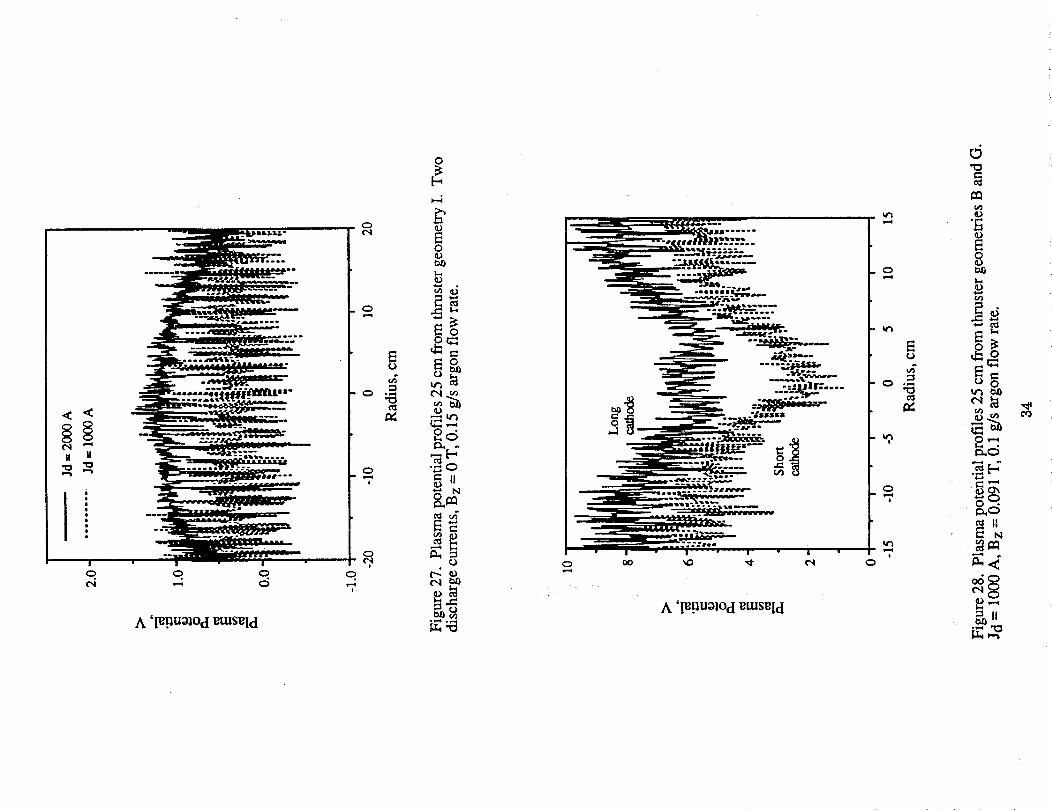
discharge current did not have the same effect as increasing the field. Shown in Fig. 27 is
the radial distribution of plasma potential at an axial distance of 20 cm from thruster
geometry I for discharge currents of 1000 and 2000 A with no applied field. Increasing the
discharge current to 2000 A clearly increased the centerline potential, decreased the data
scatter, and did not affect the potentials measured at large radii. This contrasts to the results
for increasing the applied field strength, which clearly caused a rapid rise in the plasma
potential at large radii, and caused a potential minimum to appear on the thruster centerline.
The decrease in scatter observed at higher discharge currents was due to the increase in
density and associated increase in signal-to-noise ratio.
The anode geometry of the thruster had no measurable effect on the plasma-potential
distribution at the axial distances of these measurements. However, the cathode geometry
played a significant role in determining both the magnitude and behavior of the plasma
potential. Shown in Fig. 28 is a comparison between the potential distributions 25 cm away
from the thruster for geometries B and G, with B z -- 0.09 Tesla. The differences between
them are clear, with the long cathode having a local maxima on the centerline and the short
cathode having a global minima on the centerline. Comparing Fig. 28 with Fig. 25b it is
19.

apparentthat the minima in bothdistributionscorrespondwith the highesttemperaturein thehigh-densityplume. The axial potentialdistributionfor the short cathodegeometryis shownin Fig. 29, where it is seenthat both thedepth of the potentialwell andthe rateof potentialincreaseoff axisdecreasedawayfrom the thruster.
Discussion
These measurements dearly show that the applied field plays a dominant role in
establishing the plume properties. The magnetic field strongly confines the plume, as
evidenced by the great reduction in the rate at which the plasma density decreased in the axial
direction and the steep radial density gradients observed with the applied field. In general,
for the operating conditions and thruster geometries used in this study, the centerline electron
density was between 3 x 10¹⁸ and 8 x 10 _8 m -3 and the temperature between 10,000 and
20,000 K. The centerline properties were relatively insensitive to operating condition so long
as the applied field was on, though the imaging clearly showed an increase in excited ion
state population with increasing applied field and discharge current. Thruster anode geometry
did not have as large an impact on the plume properties as did the cathode length and shape.
Large changes in plume structure were observed when the field was not present. The high-
luminosity cone observed with the applied field appeared to come off the cathode surface and
slowly diverge in the downstream direction. The plasma potential distribution was flat and
only slightly positive without the applied field; however, with the applied-field there was a
pronounced central minimum in the potential.
The effect of the applied field on the plume plasma can be qualitatively examined on
the basis of three parameters: the electron Hall parameter, electron gyro radius, and ratio of
the plasma thermal pressure to the magnetic pressure. These were calculated from
eBz mev _NkT- ; r e - ; _= (3)
mere_ i eBz B_/2_o
where the electron and ion temperatures and densities were assumed equal, and the mean
electron velocity was set equal to the thermal speed based on the electron temperature. The
electron - ion collision frequency was calculated from Spitzer's standard formulation 13. At
this point we have neglected the potential effects of plasma microturbulence, which would
increase the effective collision rate and decrease the calculated Hall parameters. Values were
calculated for the range of magnetic field strengths and electron densities measured in the
plume. The results, presented in parametric form in Table 4, clearly show that the plasma
was strongly confined by the magnetic field. Not only do the electrons gyrate many times
around the field lines before undergoing a collision, but the gyro radii are much smaller than
the observed density gradient length scales. In addition, the fact that the magnetic pressure
was much greater than the plasma thermal pressure supports the observation of strong radial
density gradients.
13

These estimates imply that the electrons in the plume moved predominantly along the
field lines and do not move through regions with different properties. This result explains
how the plume can support the sharply defined structure observed using the imaging. While
this calculation appears to explain the presence of the lumosity cones, note that the electron
density profiles show that the centerline density did not decrease axially, even though the
magnetic-field lines were strongly diverging by an axial distance of 25 cm. This is shown in
Fig. 30, where the vectors B -- B,r + Bzz are plotted, with the vector magnitude corresponding
to the the magnetic-field magnitude. It is apparent that between axial distances of 25 and 35
cm, the field lines between radii of 5 and 10 cm are predominantly radial. While the plume
does diverge in the axial direction, the apparent lack of a drop in centerline density indicates
that the plasma is separating from the applied magnetic field lines. The apparent dichotomy
between the calculated Hall parameters and the experimental evidence remains unresolved,
though several authors have studied the phenomena of plasma/magnetic field separation 14'16.
It appears from the preceding discussion that as a result of applying the magnetic-
field, electrons coming off the cathode surface will be partially confined to the region near
the cathode. The corresponding reduction in radial electron flux would require an increase in
the radial electric field to maintain current conduction at a constant level. Thus, not only
would the plasma density near the cathode surface increase slightly, but the energy imparted
by the fields to the particles would increase. The latter phenomena may be the source of the
electron temperature structure observed with the long-cathode thrusters (Fig. 25b). In addition
to the plume data, this argument is supported by observations made of the cathode surface
during thruster operation with several applied-field strengths. It was found that the surface
temperature of the cathode increased monotonically across the entire surface with applied-
field strength. For a constant discharge current, this observation can only be accounted for by
an increase in the ion-impingement current to the cathode. This result shows that the life and
performance of applied-field thrusters with similar geometries may be fundamentally coupled.Performance measurements show a monotonic increase in efficiency and specific impulse with
increasing applied-field, yet if this applied-field increases the cathode surface temperature it
will certainly increase the material sublimation rate and may limit thruster life. While similar
phenomena may occur in self-field MPD thrusters operated at the very high currents required
to achieve magnetic fields of comparable magnitude to those applied in this study, the
fundamental coupling of the discharge current to the magnetic-field strength in self-field
thrusters will most likely preclude isolation of the physics controlling the phenomena.
The plasma potential measurements also support this proposed mechanism for cathode
heating. It was found, Fig. 29, that increasing the applied field depressed the downstream
centefline potential and increased the magnitude of the radial potential gradient. These
measurements imply that the perpendicular electrical conductivity was strongly affected by the
magnetic field. Generally speaking, the axial applied-field lines behave somewhat like
equipotential lines, so that the centedine plume region is well connected, electrically, to the
cathode tip, while at larger radii magnetic field lines that arise from the anode surface are
well connected to the anode. The observation that the potential gradients decreased in the
axial direction indicates the presence of radial currents in those regions.
14

Conclusions
Measurements of plume species, excited-state, electron-density, and temperature
distributions show that the plumes of the applied-field MPD thrusters studied here were
partially ionized, with centerline electron densities and temperatures ranging from 2 x 10 _s to
8 x 10 _s m 3 and from 7,500 to 20,000 K, respectively. Both these magnitudes and the plume
structure were very sensitive to the presence of the applied field, which was found to strongly
confine the plume plasma. For the operating conditions studied here, the degree of confine-
ment, as indicated by radial density gradients, increased monotonically with applied-field
strength, though the centerline densities did not show a commensurate increase. While
calculations of the electron Hall parameter indicate that the plasma is strongly coupled to the
applied magnetic field lines, the density distributions show that the plasma does not follow
magnetic flux tubes in the downstream region, implying that the plume does separate from the
applied magnetic field.
Measurements of the plasma-potential distributions confirmed the strong influence of
the applied field, which appeared to subtantially reduce the electrical conductivity perpendicu-
lar to the magnetic field. This phenomenon not only resulted in incroased radial potential
gradients, but also increased the cathode surface temperature. The latter phenomenon may
fundamentally couple the performance and Life of applied-field "tluxisters of similar geometry.
AcknowledgememsThe authors wish to thank John Naglowsky, Larry Schultz, John Eckert, Tom Ralys,
David Wotford, John McAlea, Rob Buffer, John Miller, Gerry Schneider and Cliff Schroeder
for their inwduable support on this project. Thanks also go to Dr. Michael LaPointe for use
of his magnetic field calculation code.
References
1. Sovey, J. and Mantenieks, M., "Performance and Lifetime Assessment of MPD Arc
Thruster Technology," Journal of Propulsion and Power, Vol. 7, No. 1, Jan.-Feb. 1991, pp.
71-83.
2. Tahara, H., Yasui, H., Kagaya, Y., and Yoshikawa, T., "Development of a Quasi-Steady
MPD Arcjet Thruster for Near-Earth Missions." AIAA Paper 87-1001, May 1987.
3. Kagaya, Y., Yoshikawa, T., and Tahara. H.. "Quasi-Steady MPD Arcjets with Applied
Magnetic Fields," AIAA Paper 85-2001. Oct. 1985.
4. Myers, RAM., "Applied Field MPD Thruster Geometry Effects," AIAA Paper 91-2342,June 1991.
5. Mantenieks, M.A., Sovey, J.S., Myers, R.M.. Haag, T.W., Raitano, P., and Parkes, J.E.,
"Performance of a 100 kW Class Applied Field MPD Thruster," AIAA Paper 89-2710,
15

July 1989,seealsoNASA TM 102312,July, 1989.6. Haag,T., "Designof a Thrust Standfor High PowerElectricPropulsionDevices," AIAA
Paper89-2829,July 1989,seealsoNASA TM 102372,July, 1989.7. Sudharsanan,S.I., "The Abel Inversionof Noisy DataUsing DiscreteIntegral Trans-
forms," M.S. Thesis,The University of Tennessee,Knoxville, August 1986.8. Cremers,C. andBirkebak, R.C., "Application of the Abel Integral Equation
to SpectrographicData," Applied Optics,Vol. 5, No. 6, June 1966,pp. 1057-1064.9. Chung,P. M., Talbot, L., andTouryan,K.J. "ElectricProbesin StationaryandFlowing
Plasmas:Part 1. CollisionlessandTransitionalProbes,"and, "Part2. ContinuumProbes,"AIAA Journal, Vol. 12, No. 2, Feb. 1974, pp. 133 - 154.
10. Swift, J.D., and Schwar, M.J., "Electric Probes for Plasma Diagnostics," American
Elsevier Publishing Co., Inc., 1970.
11. Wiese, W.L, Smith, M.W. and Miles, B.M., "Atomic Transition Probabilities, Vol. II,
Sodium Through Calcium," National Stand. Ref. Data Series, National Bureau of
Standards, Vol. 22, Oct. 1969.
12. Myers, R.M., "Plume Characteristics of MPD Thrusters: A Preliminary Examination,"
AIAA Paper 89-2832, July 1989, see also NASA CR 185130, Sept. 1989.
13. Spitzer, L., "Physics of Fully Ionized Plasmas," Interscience Publishers, Inc., New York,
1956.
14. Kosmahl, H.G., "Three-Dimensional Plasma Acceleration through Axisymmetric
Diverging Magnetic Fields based on Dipole Moment Approximation," NASA TN D-3782,Jan. 1967.
15. Walker, E. and Seikel, G., "Axisymmetric Expansion of a Plasma in a Magnetic Nozzle
including Thermal Conduction," NASA TN D-6154, Feb. 1971.
16. Hooper, E. B., "Plasma Detachment from a Magnetic Field," AIAA Paper 91-2590, June1991.
16

Geometry
A
C
E
AnodeRadiusRa, cm
2.5
3.81
5.1
5.1
Anode Length
La, cm
7.6
7.6
7.6
7.6
Cathode Radius
Re, , cm
0.64
0.64
0.64
1.27
Cathode Length
Lc, cm
7.6
7.6
7.6
7.6
F 5.1 15.2 1.27 7.6
G 3.81 7.6 0.64 2.5 (conical)
I 3.81 7.6 3.00D, 1.0 ID 6.1
(Hollow)
Table 1: Dimensions of MPD thrusters used in this study
Plasma Species Identified lines, nm
ArI 404.6, 419.8, 433.4, 436.4, 696.5
ArII 355.9, 358.8, 407.2, 433.2, 487.9
HI 486.1
WI 368.2, 368.4, 368.8
Cull 491.8, 490.7
Table 2: Plasma species and the most prominent lines identified
17
Wavelength(nm) Eu(eV) Gu Aik x 108(secq)
410.3 22.76 4 1.3
408.2 19.73
407.2 21.56
405.3 23.86
6 0.027
6 0.57
4 1.50
404_.3 21.55 4 1.40
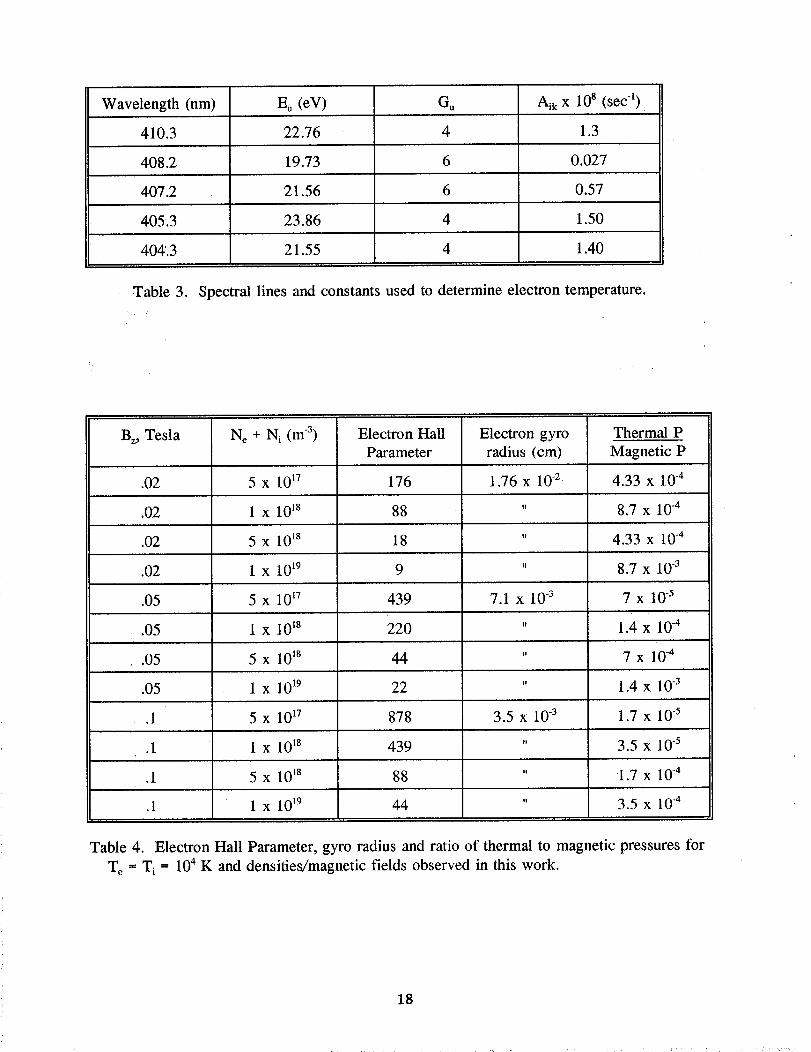
Table 3. Spectrallines andconstantsusedto determineelectrontemperature.
Bz,Tesla N_ + N i (m -3) Electron Hall
Parameter
Electron gyro
radius (cm)
Thermal P
Magnetic P
.02 5 X 10¹⁷ 176 1.76 x 10 -2 4.33 X 10 "4
.02 1 x 10¹⁸ 88 " 8.7 x 10 .4
.02 5 x 10¹⁸ 18 " 4.33 X 10 -4
.05
9 " 8.7 x 10 .3
439 7.1 X 10 -3 7 x 10 .5
220 " 1.4 X 10 "4
44
.02 1 X 10¹⁹
.05 5 X 10¹⁷
1 X 10¹⁸
.O5 5 X 10¹⁸ 7 x 10 -4
.05 1 X 10¹⁹ 22 " 1.4 x 10 .3
.1 5 X 10¹⁷ 878 3.5 X 10 -3 1.7 x 10 -5
.1 1 x 10¹⁸ 439 " 3.5 x 10 .5
.1 5 x 10¹⁸ 88 " 1.7 X 10 -4
.1 1 X 10¹⁹ 44 " 3.5 X 10 "4
Table 4. Electron Hall Parameter, gyro radius and ratio of thermal to magnetic pressures for
T e --- T i -- 10 4 K and densities/magnetic fields observed in this work.
18
cathode
clamp(watercooled'
propellant input:' ner, outer
water cooolingpassages
outer injection holes|nnulus
Radius, cm
ta Axial distance, cm
boron nitridebackplate
Fiberglas epoxyinsulator
Figure 1. MPD thruster schematic showing coordinate system used for plumemeasurements. Applied field magnet not shown. Elecn'ode dimensions are
given in Table 1.
VACUUM FEED
3 reTEST SECTION
3 m GATE VALVE
REFERENCE STRUCTUR
CALIBRATION I_ECHANISM_
DISPLACEMEN3
/////////////////////////FLOOR LINE
Jt_
PRIMARY
Figure 2. Schematic of MPD thruster test facility showing thrust stand andprobe positioning system.
19
).,,i °
_>P<
b-*o:=r'_
o_r._
0_._
_.°._,,'0:=r'_CD 0
,"h
_._.,J.
o_
P
/
II "
.=I_,
m_
(Ira
Discharge Voltage, V
• _ _, - _., _,, _• I • I • I _ I • I , I • I_. I •
_.......... -"0d ............. O-
a_..._......_]._.:: ......... o.- -_:::°......;.o"-o
T_-_______..........°...c,.:::: -o''"
0,: ............. 0"" °
o "'''0
° .........°........"'I_o............. o"- _ ........ "--% I
o _----- °.... ....... , . , . -.
Discharge Current, A
MPD
thruster
,=/
Plume
F.L= 100cm
F# = 20
vertical
alignment
T"
:?i..:
F.L. = 12 cm
F# = 2.4
Figure 5. Optical path for emission spectroscopy measurements.
WATER COOLEDCOPPER SHIELD(EXTENDS LENGTH OFRADIAL TABLE)
WATER HOSES &SIGNAL WIRES
PROBE TIPS
WATER COOLED AXIAL
STEPPER MOTOR
WATER COOLEDCOPPER TABLE
_m imm WATER COOLED_1 _ PROBE ARRAY
JWATER COOLED RADIAL
ROTARY ENCODER
FLEXIBLE_, ST. STEEL SHIELD
!
Figure 6. Schematic of probe positioning system showing axialand radial tables with 4 probes mounted on the radial table.
21

probetip
IM_
l "ir*'""rll °nO'°nI+/- 1 '_ 0 -1 A Generator
135 Hz Triangle
wave
100 k.Q
mVVV' I
_robevoltage
-="Tank Wall(ground)
probecurrent
To c;ata acquistionsystem
Figure 7. Electric probe circuit used for electron temperature and
density measurements.
/7900.0
S4400.0
10900.0
,,J
_ 7_0.0_4a
3900.0
490.00
_''" I .... I'''" I .... I .... I .... I" "'" I .... I .... I'''" 141I
1 lit
| m I|
s;.ti
"''' I .... I'''" I'''" I'''" I'''" I'''" I .... I'''" I'''" I
$00 200 300 400 500 600 700 BOO 90Q lOOO
DIOGE NUi4BER
Figure 8. Spectrum centered at 356 nm with a bandpass of 8.19 nm.
22

e.
o
14000
13000
12000
110o0
10000
o
O
90000.02 0.04 0.06 0.08 0.10 0.12
Applied Bz, T
Figure 9. Peak centerline intensity as a function of applied fieldstrength for geometry A. Jd = 750 A, 0.035 g/s hydrogen propellant.
0o_E"
O
Z -4-
Temperature = 12,200 K
O
O
O
o
• I " I " I " I " !
-4 -2 0 2 4
Energy difference between J x 10 "19upper excited states
Figure 10. Boltzmann plot for line-of-sight intensities 5 mm in front ofthruster geometry C. Jd = 1000 A, Bz = 0.051 T, 0.1 g/s argon flow rate.
23

250
Axial
200 distances, cm
3.8
= 150
100
,°o-15 -10 -5 0 5 10 15
Image height, cm
Figure 11. Raw image intensity profiles taken with the 488 nm filter using thrustergeometry E. Jd = 1250 A, Bz = 0.042 T, 0.1 g/s argon flow rate.
(2O0 _ O0 2 O0 3 O0 • O0
500 50C
3 95
T i i i
375
E o2
-ooo <3._ 02
rY -1 25
-2 50
-3 75
-SO0 I i 1 I -SIX)
000 I00 200 300 400
A_.iol distonce, ¢m
a. B z = 0.026 T
Contour interval = 0.2
2 50
1 25
000
-1.25
-25,O
-3 75
0 00S.O0 _ i I i i I
375 __--_0 2
E 1.25
U
_ 0._
:6 I_-._'_o_ o.2
-2.S0 _02
-3?5
-S.O0 _ i I I I !
O00
1.00 2.00 3 00 4 00 5 O0 600 ?.00 8.00, 500
3.75
2.$0
1.25
0.00
- 1.25
-2.$0
-3 75
-SO0190 200 3 00 4.00 5.00 6.00 ?.00 8.00
Axiol distonee, em
b. Bz = 0.064 T
Contour interval = 0.4
Figure 12. Contour plots of relative emission coefficient for the 514.7 nm transitionusing thruster geometry C. Jd "- 1000 A, 0.1 g/s argon flow rate.
24
4.00I
0.00 1.00 2.00 3.005.00 l l l
2.500.2
1.25
uE _ 0.4 i- j..._. O.I.__2
I/_ 0.00
"100
n- -1.25
-2.50
-3.75
-5.000.0(
_ _'" 0.2
I I I I1.00 2 oo 3 oo 4.00
Axial distance, cm
5.00
3.75
2.50
1.25
0.00
- t.25
-2.50
-3.75
-5.00
a. Jd = 750 A
Et.)
_; o.oo
0fY -1.25
0.00 I oo 2.00 3.00 4.00500 / _x I z I 5.00
2._ _,,_o6
_ 0.6 q# L
-3.7s _o.a J
-5.000._
3.75
2.50
1.25
0.00
-1.25
-2.50
-3.75
1.00 2.00 3.00
Axial distance, cm
-5.004.00
b. Jd = 1500A
Figure 13. Contour plots of relative emission coefficient for the 514.7 nm transitionusing thruster geometry C. Two discharge currents, Bz = 0.034 T, 0.1 g/s argon flow.rate. Contour interval = 0.2.
9.5
0.00 1.00 2.00 300 4.00$.00 _ i i i
g0ty" -1.25
-5.00 Jo._ _._ 2._ _._ 4.oo
Axial distance, cm
S.O0
i , S.O0
3.75
2.50
0.00
-I.26
-¢10
-3.?6
I -SO06.OO
Figure 14. Contour plot of relative emission coefficient for the 487.9 nm transition usingfor thruster geometry E. Jd - 1250 A, Bz = 0.030 T, 0.1 g/s argon flow rate.
0 00 t.00 2 00 3.00
'_00 i i I
3.75
250 _ 02
__ • 0,2
_ 0._
IZ -1.25
-3.75
-S._ I I I I
Axial distance, cm
t3
ooo500 500
3.75 3 75
2.50 2.50
1.25 1.25
Eu
o._ _ o._°_"O
-1.25 ¢_ -t.25
-2.50 -2.50
-3.75 -3 75
-5.00 -500000
a. 7.6 cm long, hemispherical tipped cathode.
I I I I I
0 50 1.00 150 2 O0 2.50
Axial position, cm
b. 2.5 cm long, conical tipped cathode.
Figure 15. Contour plots of relative emission coefficient for the 514.7 nm transition witha 3.8 cm radius anode. Jd = 1000 A, Bz - 0.116 T, 0.1 g/s argon flow rate.
26

Et.)
o00.-a
°_"OO
-1.25
o.00 0.50 1.00 1.50 2.00 2.50 3.00 3.50 400 4.50 5.100 5.50 6.1005.00 I I I I I I I ! I I I I
3.75
.'/0.20.2
z50 _6_ "_ _
1.25 _ _"_ 0. 2
_.......-.._ 0.2
-3.75
-5.00 I I I I I I ! I | I I i000 0.50_.00L50 2.00250 3,003.504.004.50s.oos.50e.00
Axiol position, cm
5.00
3.75
2.50
1.25
0.00
-1,25
-2.50
-3,75
-5.00
a. 5.2 mg/s hydrogen
0.005.00
3.75
2.50
1.25
EU
d o.00o--
O_ -- t.25
--2.50
-3.75
I 500
3.75
2.50
1.25
0.00
-t.25
-2.50
-3.75
1.00 200 3.00 4.00 5.00 600 7.00I I I I I I I I I I I i I I
i l i I ! i i i i i i i i i i
_.00zoo _.004.00s00 6.007.00A×iol position, ¢m
-5.00 -5.000.00
b. 17.0 = mg/s hydrogen
Figure 16. Effect of hydrogen addition on the relative emission coefficients for the 487.9
nm transition using geometry C. Jd " 1000 A, Bz = 0.034 T, 0.1 g/s argon flow rate.Contour interval = 0.2.
27

A 'o_g;IoA °q°Jd
0
V ';u0.tm:) 0qo. M
0¢)
d_D
I:h
°v.4
_[--,_0
"_ N
0Ott'_
,.0 t'_
'1::1O_-.j_0
¢.j b.,
0
0"0
_o
A 'oi_mlOA
V 'lu0.un_)
00
d
0
._ o
00,. _
O_
II
II

1019 ,
15 cm from thruster
........ 35 cm from thruster
1018 '
10 17 I " I " I I " I
-30 -20 -10 0 10 20 30
Radius, cm
a. Bz=0T
t-
10 19,
10 18 ,
1017
-30
15 cm from thruster35 cm from thruster
Ii t
!
-20 -10 0 10 20 30
Radius, cm
b. Bz = 0.10T
Figure 19. Electron density profiles 15 and 35 cm from thruster geometry I withand without an applied field. Jd = 1000 A, 0.15 g/s argon flow rate.
20
1019
I _ Bz;0.030T.......... Bz=0.12T
1018o
•-" 1 .. t_[,_' ;I'.. I" 1_!._," _. I
t1017 _,
-20 -15 -10 -5 0 5 10 15 20
Radius, cm
Figure 20. Electron density prof'tles 35 cm from thruster geometry F.field strengths, Jd = 1000 A, 0.1 g/s argon.
Two magnetic
e-
d_e-
6
10 19,
Discharge current:
1500A
1018_I II
10 17I I " I " I I
-30 -20 -10 0 10 20 30
Radius, cm
Figure 21. Electron density profiles 25 cm from thruster geometry I.Two discharge currents, Bz = 0 T, 0.15 g/s argon flow rate.
30

30000
E
]O] , • I • I • _ " I
-15 -10 -5 0 5 10 15
Radius, cm
Figure 22. Electron temperature profile 25 cm away from thruster geometry B.Jd = 1000 A, Bz = 0.1 T, 0,1 g/s argon flow rate.
30000
20000
10000
Applied field slrength:
0.1T
0-10 -5 0 5 10
Radius, cm
Figure 23. Electron temperature distributions 15 cm away from thruster geometry I.Two values of applied field strength, Jd = 1000 A, 0.15 g/s argon flow rate.
31
30000
20000 Axial distancefrom thruster:
15 cm
-10 -5 0 5 10
Radius, cm
Figure 24. Electron temperature distribution for thruster geometry I.Jd = 750 A, Bz = 0.1 T, 0.1 g/s argon flow rate.
1019
'E
1018
1017
long cathode
........ short c,afl',ode
I
I
'It[. 0
.8t¢UI! I I_h
-I0 0 I0 20 -I0 -5 0
Radius, ern Radius, em
a. Electron densities, b. Electron temperatures.
10
Figure 25. Electron density and temperature profiles 25 cm away from thrustergeometries B and G. Jd = 1000 A, Bz = 0.091 T, 0.1 g/s argon flow rate.
32

>
-d,m
t_
E
8
,
4'
_
Applied fieldstrength:
• iL., " : OT i , .,_, = -, . ,, , I I ]
• • I p
-20 -10 0 10 20
Radius, cm
a. Geometry I, 0.15 g/s argon flow rate.
>.
-d
O
t_Eta_t_
15
10
5
01-20
_fi pliedmagnetic
eld strength:
, I , ' lrr"'P 1, : _d
' :' ' ' 'I" | ''0.03 T
I ! I
-10 0 l0 20
Radius, cm
b. Geometry F, 0.1 g/s argon flow rate.
Figure 26. Plasma potential profiles for thruster geometries I and F for adischarge current of 1000 A and two applied field strengths each.
33
II II
A 'le.tluolod etUSeld
0
[..,
0
e_
cD
c'q u_
_d
= II¢)
o
A 'i-e.tlu01od etUSeld
¢q 0
o
Eo
oi
i
d
ca
¢.,q
*-' o:1
0U'3
eq_
t_
N
N II

>
--d"1:::
=o
E
20
15
10
Axial distance
from thruster:
6 cm
25 cm
-15 -10 -5 0 5 10 15
Radius, cm
Figure 29. Plasma potential distributions 6 and 25 cm from thruster geometry G.Jd = 750 A, Bz = 0.13 T, 0.1 g/s argon flow rate.
0.25-
_E" 0.15-
o /II/
o II///
< //E_ O.lO-< '11p,,
/I/
Ill,,, ..............
Ii, ................
IIs ................
II, ...............
t,, ................
Jt ................
le, ...............
/ I*, ...............
/ #/,, ...............
1111,, ...............
//IJ,, ................
/ //#l,, ................
I/Ill ...................
0.05-- //4S ....................
0.00
o.oo 0.05 o._o O.'lS o._o ' o.;o ' ' '0.40 0.450.350.25
AXIAL POSITION (M)
o._o
Figure 30. Magnetic field vectors for 15.3 cm I.D. magnet with a coil currentof 1400 A. Vector lengths are proportional to field stregths. Origin is at centerlineof magnet exit plane.
35

IJ tSA Report Documentation PageNatlonalAeronauticsandSpaceAdministration
1. Report No. NASA CR-187165 2. Government Accession No. 3. Recipient's Catalog No.
AIAA - 91- 2339
4. Title and Subtitle
A Preliminary Characterization of Applied-FieldMPD Thruster Plumes
7: Author(s)
Roger M. Myers, David Wehrle, Mark Vernyi,James Biaglow, and Shawn Reese
9. Performing Organization Name and Address
Sverdrup Technology, Inc.
Lewis Research Center Group
2001 Aerospace ParkwayBrook Park, Ohio 44142
12. Sponsoring Agency Name and Address
National Aeronautics and Space AdministrationLewis Research Center
Cleveland, Ohio 44135- 3191
15. Supplementary Notes
5. Report Date
August 1991
6. Performing Organization Cede
8. Performing Organization Report No.
None (E- 6426)
10. Work Unit No.
506-42-31
11. Contract or Grant No.
NAS3- 25266
13. Type of Report and Period Covered
Contractor ReportFinal
14. Sponsoring Agency Code
Project Manager, James Sovey, Space Propulsion Technology Division, NASA Lewis Research Center. Preparedfor the 27th Joint Propulsion Conference cosponsored by AIAA, SAE, ASME, and ASEE, Sacramento, California,
June 24-27, 1991. Roger M. Myers, Sverdrup Technology, Inc.; David Wehrle, Cleveland State University,
Cleveland, Ohio 44115; Mark Vernyi, University of Akron, Akron, Ohio 44325; James Biaglow, University ofCincinnati, Cincinnati, Ohio 45221; Shawn Reese, Ohio University, Athens, Ohio 45701. Responsible person,Roger M. Myers, (216) 433 - 8548.
16. Abstract
Electric probes, quantitative imaging, and emission spectroscopy were used to study the plume characteristics of
applied-field MPD thrusters. The measurements showed that the applied magnetic field plays the dominant role in
establishing the plume structure, followed in importance by the cathode geometry and propellant. The anode radius had
no measurable impact on the plume characteristics. For all cases studied the plume was highly ionized, though spectrallines of neutral species were always present. Centerline electron densities and temperatures ranged from 2x 10¹⁸ to
8 x 10¹⁸ m -3 and from 7500 to 20,000 K, respectively. The plume was strongly confined by the magnetic field, withradial density gradients increasing monotonically with applied field strength. Plasma potential measurements show a
strong effect of the magnetic field on the electrical conductivity and indicate the presence of radial current conductionin the plume.
17. Key Words (Suggested by Author(s))
Electric propulsion
Magnetoplasmadynamics
18. Distribution Statement
Unclassified - Unlimited
Subject Category 20
19. Security Classif. (of the report) 20. Security Classif. (of this page) 21. No. of pages 22. Price*
Unclassified Unclassified 36 A03
NASAFORM1626OCT86 *For sale bythe NationalTechnicalInformation Service,Springfield,Virginia 22161