a preventive intervention for rising intraocular pressure
TRANSCRIPT

www.aana.com/aanajournalonline AANA Journal June 2012 Vol. 80, No. 3 213
There is increasing interest in monitoring intraocular pressure (IOP) during surgery in steep Trendelenburg position because of reported incidents of postopera-tive visual loss (POVL). A review of 17 patients with POVLs showed findings of eyelid edema, chemosis, and ecchymosis. The aim of this study was to link IOP tonometry measurement to an observation scale enabling caregivers to determine when to institute preventive measures to optimize ocular perfusion.
The study design was a prospective repeated-measures correlation regression model. Visual assess-ment of presence of eyelid edema or chemosis and baseline IOP values determined the probability of when an IOP greater than 40 mm Hg (critical thresh-old) was reached. Both IOP and Molloy/Bridgeport Anesthesia Associates Observation Scale measures
were recorded at start of surgery, 30-minute intervals, and end of surgery. Associations between IOP and facial observations were analyzed via multiple logistic regression.
Significant predictors of IOP greater than 40 mm Hg were determined to be presence of chemosis and baseline IOP and significantly correlated to increasing IOP. The receiver operating characteristic curve–area under the curve score was 0.86 (standard error ± 0.03). Caregivers can use this observation scale to assess the need and timing for IOP-normalizing interventions and possibly to prevent POVL.
Keywords: Chemosis, intraocular pressure, ischemic optic neuropathy, ocular perfusion pressure, postop-erative visual loss.
A Preventive Intervention for Rising Intraocular Pressure: Development of the Molloy/Bridgeport Anesthesia Associates Observation Scale
Bonnie Molloy, CRNA, PhD, APRN
Postoperative visual loss (POVL) is a cata-strophic event that often results in permanent loss of vision. There is a projected 0.2% inci-dence of POVL in spine procedures and 0.05% of all surgical cases.1 The head-down position
in lengthy general anesthesia cases has been noted as a common factor in POVL events, and rodent model stud-ies have confirmed retinal cell ganglion dysfunction with brief acute increases in intraocular pressure (IOP).2 With robotic surgery and steep Trendelenburg (ST) position-ing in laparoscopic cases on the rise, it is projected that the incidence of POVL in this patient population will increase.
Several studies involving increased IOP and the rela-tion to POVL have been conducted.3,4 One such study was conducted with patients in the ST position for 2 to 3 hours’ duration. Findings document a relationship between laparoscopic surgery under general anesthesia with prolonged ST position as well as rising IOP with resultant decrease in ocular perfusion pressure (OPP).3 Cerebral and ophthalmic circulatory autoregulation are proposed to prevent elevated intraocular compartment pressures and to normalize ocular perfusion during surgery performed in ST position.5 This may not be oc-curring under anesthesia, and the observed periorbital and facial edema can be quite impressive.
The aim of this study was to develop an observation
scale that correlated with statistically significant changes in intraoperative patients’ IOP. The scale is named the Molloy/Bridgeport Anesthesia Observation Scale (MBOS). It could be used with no cost and minimal training to assess the need for treatment interventions to prevent a rise in IOP levels and potentially prevent POVL.
BackgroundA review of 17 patients who experienced POVL follow-ing spine procedures showed findings of eyelid edema, corneal/conjunctival edema, exophthalmia, periorbital ecchymosis, periorbital numbness, and facial edema.6 Eyelid edema and corneal/conjunctival edema (chemo-sis), ecchymosis, and facial and neck edema were ob-served in patients placed in the ST position during lapa-roscopic lower abdominal surgery in a study conducted at a regional medical center in New England.7 The ST position is defined as a greater than 30-degree tilt of the bed below horizontal, with the head in lowest position. A case report of a patient presenting with a medication-induced bilateral visual loss exhibited bilateral chemosis. Elevations in IOP measurements were 49 mm Hg and 51 mm Hg, respectively.8 Definitions and explanations of visual findings are described in the glossary of terms (Table 1).9 Efforts to understand this calamitous issue and the observational findings that are witnessed periop-eratively will be presented.

214 AANA Journal June 2012 Vol. 80, No. 3 www.aana.com/aanajournalonline
The exact cause of POVL is unknown. Contributing medical conditions that have been cited by Baig and as-sociates10 are hypertension (41%) and diabetes (16%). These authors identified other contributing factors as hypotension, blood loss, anemia, excessive fluid re-placement, and prolonged surgery. Edema is known to compromise tissue oxygenation, with resultant in-creases in tissue pressure. A reduced microvascular per-fusion and increases in arterial venous shunting reduces sympathetic drainage.10 Compounding this impediment in drainage is the continued production of aqueous humor by the ciliary body despite increases in IOP. Additionally, it is believed that in head-down position, the gravitational effects of the venous blood column will cause elevation of episcleral venous pressure and consequently IOP.11
The need to intervene and elevate the head above the level of the heart has been recommended and studied.7,12 Consistent throughout all cases reviewed has been the underlying premise that swelling and edema of the optic nerve head (ONH) can be deleteri-ous. A basic understanding of the anatomical variations and physiology can address the current issues of why the incidence and the exact cause of POVL are still unknown. Ischemic optic neuropathy takes place in the retrobulbar region and is divided into 2 distinct clinical entities known as anterior ischemic optic neuropathy and posterior ischemic optic neuropathy.13 Pillunat and colleagues14 described the blood flow variation in the 3 layers of the human ONH. It is noted that only small terminal pial arterial branches supply the critical mid-orbital optic nerve.10,12 The vascular supply is superfi-cial, and only a small number of capillaries penetrate the nerve extending to its central portion. The vascular-ization of the posterior segment is poor compared with its anterior portion. Gilbert12 states that the physiology of the blood supply to the posterior optic nerve makes posterior ischemic optic neuropathy a more common cause of POVL (Figure 1). Dunker and colleagues15 explain that the optic nerve passes through the optic canal, a bony tunnel leading to the brain. Any variable that may compromise retinal flow or IOP may therefore decrease ocular perfusion because blood flow is calcu-lated as perfusion pressure over resistance to flow.
Murgatroyd and Bembridge16 reported that IOP must remain within normal ranges to maintain optimum anatomical conditions for refraction and, thus, vision. The autoregulation of the ONH circulation was studied and was found to vary significantly among subjects.12 A vascular response to increased IOP was identified that decreased blood flow by the time IOP reached 40 mm Hg in one study and 45 to 55 mm Hg in another.14,17 Autoregulation of the ONH was determined to fall below an OPP of 30 mm Hg. It was suggested that individual response to an autoregulatory plateau varied according
to age, history of atherosclerosis, arterial hypotension, and individual anatomical variation.17 It is presumed that the pattern of blood flow is the same in all human eyes. However, on examination of patients with POVL, there is marked interindividual anatomical variation. Ocular vas-cularity and flow distribution may even differ between the right and left eye in the same patient.13
Another theory of POVL cause is addressed by Lee and her colleagues.1 They hypothesized that hypotensive ischemic optic neuropathy may be the result of a “com-partment syndrome of the optic nerve,” suggesting that “high venous pressure and interstitial tissue edema may compromise blood flow.” It is suggested that swelling in the inelastic optic canal causes compression and can exacerbate ischemia, which can perpetuate a cycle of injury.15 It is theorized that as orbital pressure increases, orbital venous drainage may be impeded, diminishing retinal and optic nerve perfusion pressures. Savitsky18 reported that irreversible optic nerve or retinal nerve damage may occur within 90 minutes of vascular insuffi-ciency. Increased IOP associated with periorbital edema, venous hypertension, and abnormal eye fluid mechanics may be a contributing factor to the hypoperfusion in the closed spaces of the orbit by decreasing the pressure gradient below a critical level at vulnerable portions of the optic nerve and retina.19 These findings determine the need for the measurement of IOP under anesthesia in the ST position.
The following research questions were addressed in the study:
1. To what extent do the individual components of the MBOS correlate with IOP readings?
2. What is the interrater reliability of the components of the MBOS?
3. What are the measures of diagnostic efficacy of the individual components?
Aqueous humor: The limpid fluid within the eyeball.
Blindness: Transient or permanent inability to see with 1 or both eyes.
Cornea: Transparent, anterior, dome-shaped portion of the eyeball that covers the iris and pupil, acting like a window that admits light into the eye.
Corneal edema: Infusion of fluid (such as aqueous humor or tears) into the cornea.
Conjunctiva: Clear, transparent, mucous membrane that lines inner surfaces of the eyelid and covers the front of the eye.
Conjunctival edema/chemosis: Swelling around the iris (colored circle that surrounds the pupil) due to swelling of the bulbar conjunctiva; detected as one observes the white outer coating (sclera) rising above and around the iris.
Intraocular pressure (IOP): Pressure in the eyeball that gives it a round, firm shape; regulated by the rate at which aqueous humor enters and leaves the eye. Normal IOP is 10 to 20 mm Hg.
Table 1. Glossary of Terms

www.aana.com/aanajournalonline AANA Journal June 2012 Vol. 80, No. 3 215
4. What is the optimal combination of the components that determined the probability that IOP had reached critical thresholds of 40 mm Hg when predictors (eyelid edema, corneal edema/chemosis, ecchymosis, and neck growth) are present? What is the diagnostic efficacy of that combination?
Materials and Methods• Study Design. The study was an instrument develop-ment study comparing the degree to which the MBOS correlated with the gold standard for IOP measurement, tonometry.20 The study design employed a prospec-tive repeated-measures correlation regression model. Multivariate logistic regression analysis using the gener-alized estimating equations (GEE) method21,22 was used. The MBOS was used perioperatively.
• Sample. All patients involved in prolonged ST cases at a single regional medical center in New England were accepted. The sample size for this study was 111 patients. Patients with a history of eye disease or eye surgery were excluded from the study. Procedures in-cluded were laparoscopic prostatectomy, bowel resec-tions, and pelvic gynecologic procedures performed with the patient in ST position for a minimum of 120 minutes’ surgical time. Researchers obtained 4 to 6 re-peated measurements for each patient. Power analysis was performed using the Cohen/Wahlston chart23 using a medium effect size calculated based on a previous study
by Molloy.7 Additionally, Liang and Zeger, the origina-tors of GEE, determined that greater than 100 clusters of data comprised the appropriate sample size to allow for the assumption that the final model had been effectively analyzed and with less chance of error.24
• Instruments. The following instruments were used.• Molloy/Bridgeport Anesthesia Associates Scale. The
scale consisted of presence or absence of 3 critical areas of observation: (1) eyelid edema, (2) corneal/conjuncti-val edema (chemosis), and (3) ecchymosis (Figure 2). Neck girth equated to facial edema was a continuous measure, in centimeters, from the beginning supine posi-tion and in ST position through the end of the case, when the patient was returned to a supine position.
• Tonometer. An applanation tonometer (Tono-Pen XL, Reichert Technologies, Depew, New York) was used for IOP monitoring. Adequate validity and reliability have been established for the Tono-Pen XL in a study that compared it to 2 other tonometry devices and concluded that the Tono-Pen XL was the most accurate for IOP measurements.20 The coefficient of variance the authors observed for the Tono-Pen XL was 10% compared with 17% for the Perkins tonometer and 19% for the Schiøtz tonometer. The coefficient for determination was r2 = 0.74 for the Tono-Pen XL compared with 0.60 for the Perkins tonometer and 0.68 for the Schiøtz tonometer.20
• Ocular Perfusion Pressure. A noninvasive blood pres-sure cuff and/or arterial line measured mean arterial pres-
Figure 1. Vascularization of Posterior and Anterior Segments of Eye (Illustration by Victoria Skomal Wilchinsky.)

216 AANA Journal June 2012 Vol. 80, No. 3 www.aana.com/aanajournalonline
sure (MAP). Then OPP was determined by calculation using the following formula9: MAP − IOP = OPP. The MAP was continuously measured and observed on the anesthesia monitor.
• Demographics and Surgical Data. The data col-lection sheet was used to document demographic and surgical data. Data included fixed covariates of age, sex, height, weight, body mass index (BMI), ASA physical status and any underlying disease entities, and type of surgical procedure (Table 2). Fluid maintenance, blood loss and vital signs (blood pressure, MAP, heart rate), insufflation pressure, expired carbon dioxide levels, and peak inspiratory pressures were monitored. Timing of IOP was documented at 30-minute intervals.
• Procedures. Institutional review board approval was obtained. Informed consent was obtained from each par-ticipating patient.
Five Certified Registered Nurse Anesthetists were credentialed to monitor IOP in laparoscopic and robotic procedures with patients under anesthesia in ST posi-tion, and they assisted as data collectors. Credentialed individuals took a video course, and their tonometry technique was observed on anesthesia caregivers who volunteered as well as on the patients who gave consent. The principal investigator (PI) then observed each of the 5 data collectors in their observations of eyelid edema, chemosis, and ecchymosis on 10 patients to determine interrater reliability, individually, and on an additional 20 patients collectively as a group. The PI rating was
the determinant of the correct measure. These training sessions entailed 6 observations for each participant. Trochim’s25 interrater reliability correlation method was used for 60 observations. The method involved each data collector taking a piece of paper and assessing observa-tional findings—absent (0) or present (1). The PI then reviewed the papers, and a percentage ratio of accuracy of findings was given to each data collector after all ob-servations were completed. The neck measurements were a defined centimeter change using a cloth tape measure placed at midneck level.
Tonometer preparation was carried out before the patient entered the operating room. A sterile cover was placed on the head of the tonometer before measure-ments were taken, and sterile balanced salt solution eye drops were applied before each measurement.
In the operating room, monitors were placed, in-cluding electrocardiography leads, a noninvasive blood pressure cuff, and a pulse oximeter. The angle of ST was measured by a protractor at bedside. Gender and underlying disease entities were documented. The BMI was calculated after obtaining a height and weight. Fluid replacement and blood loss were also monitored and were minimized as recommended in the literature.18,19 Anesthetic administration followed a specific guideline, with 1 to 2 mg of midazolam given in the preoperative holding area, and fentanyl, 1 to 2 µg/kg; propofol, 2 to 3 mg/kg; and either rocuronium, 0.7 mg/kg; or vecuroni-um, 0.01 to 0.015 mg/kg, given on induction. Inhalation agent was sevoflurane or desflurane at minimum alveolar concentration for maintenance of anesthetic level. All ventilation was monitored by a sidestream infrared gas
Figure 2. Normal and Abnormal Conjunctiva, Cornea, and Eyelid(Illustration by Victoria Skomal Wilchinsky.)
Table 2. Demographics and Frequencies Summarizing Sample Characteristics of 111 PatientsAbbreviation: BMI, body mass index.
Characteristic No. (%)
Gender
Male 46 (41.4)
Female 65 (58.6)
ASA class
1 3 (2.9)
2 62 (55.8)
3 46 (41.3)
BMI range (kg/m2) 17-67
BMI
Mean (31.1)
≤ 30 kg/m2 73 (66.0)
> 30 kg/m2 38 (34.0)
Surgical procedure
Gynecologic 45 (40.5)
Urologic 21 (19.0)
Bowel resection 45 (40.5)
www.aana.com/aanajournalonline AANA Journal June 2012 Vol. 80, No. 3 217
analysis line for agent concentration and by capnography (expired carbon dioxide maintained between 30 and 40 mm Hg and peak airway pressures less than 40 mm Hg). Intraperitoneal insufflation pressures were maintained at 14 mm Hg on all cases.
Upon initiation of the study, an agreed-on intervention included direct jugular central venous pressure (CVP) monitoring and arterial pressure monitoring based on the projected duration of the procedure, ASA status of patient, and ST position. Baseline IOP was measured after induction of anesthesia in the supine position by appla-nation tonometry and every 30 minutes thereafter in the ST position. A final measurement with the patient in the supine position was taken before emergence from anes-thesia, within a mean time of 30 minutes following posi-tion change. Eyes were taped shut between measurements to prevent corneal drying and injury. Visual findings of eyelid edema, chemosis, and ecchymosis were observed continuously and documented. Additionally, IOP and neck size (measured in centimeters) were documented.
In an effort to ensure patient safety, discussions took place with the anesthesia team members as well as the surgeon regarding baseline IOP when the IOP reached 40 mm Hg and the risk of OPP dropping below 30 mm Hg was assessed. At that time point, an intervention was to be introduced to protect the patient from potential ocular perfusion decreases. Timing of supine interven-tion during laparoscopic cases was based on each in-dividual patient’s MAP, baseline IOP, and evidence of reaching critical threshold values. At that time point, the patient was removed from the study because duration of ST positioning was limited. The rise in IOP was then altered, and observational findings could not be analyzed because time in ST position was considered to be a con-stant determinant of rising IOP and the progression of the observation findings.
• Statistical Analysis. Statistical analysis was per-formed using software (SPSS version 17, SPSS Inc, Chicago, Illinois). Sample characteristics were analyzed with means and standard deviations (SDs) for the con-tinuous variables, including age, BMI, peak inspiratory ranges, carbon dioxide ranges, estimated blood loss, he-matocrit, fluid administration, and length of surgical time. Frequencies were used to summarize nominal variables, including gender, ASA classification, choice of sevoflurane or desflurane, and type of surgery.
The focus was on yielding a definitively predictive model identifying clinically observed signs that were asso-ciated with intraoperative IOP reaching the critical thresh-old, 40 mm Hg. Initially, logistic regression modeling using a backward selection strategy was chosen to evaluate the predictive value of each clinical sign. The predictive value of the signs was analyzed at the 30-, 60-, 90-, and 120-minute time points. At each time point, the predictive value of each variable as well as the Hosmer-Lemeshow
goodness-of-fit test statistic were examined based on P < .05 criterion for statistical analysis. The 3 clinical signs—eyelid edema, corneal/conjunctival edema (chemosis), and ecchymosis —were treated as dichotomous variables. For each clinical sign, the rating scale was 0 indicating absence and 1 indicating presence. Neck edema was a continuous measure of change in centimeters.26
Results of the logistic regression modeling strategy indicated that neck edema was not a significant predictor of IOP exceeding the critical threshold. Consequently, neck change was not used in any further modeling of the dependent variable. Intraocular pressure greater than 40 mm Hg was the dependent variable over time and was measured at all time points. The independent variables included the 3 clinical signs as well as baseline IOP. The 4 independent variables were analyzed as potential pre-dictors of whether IOP would increase above 40 mm Hg.
A GEE model that implemented a repeated-measures logistic regression analysis with data evaluating IOP greater than 40 mm Hg from all 4 time points was then developed using eyelid edema, chemosis, ecchymosis, and the baseline IOP as independent variables. The ob-jective of GEE modeling is to define the optimum model. The GEE modeling was applied using SPSS software that provided estimated parameters: β-coefficients, standard errors (SEs), confidence intervals, Wald χ2 test statistics, and P values assessing the quasi-log-likelihood (QIC) values and determine the best-fitting model as the lowest score.21 The odds ratio of each variable was also calcu-lated so as to define the likelihood of reaching the critical threshold. For each unit of increase in the independent variable, the likelihood of reaching the critical threshold was then determined. Colinearity was assessed by exam-ining the tolerance of all predictor variables.22 The vari-ables were chosen while performing backward stepwise selection based on the Wald tests. Upon determination of the final model, examination of the ratio of Pearson χ2 statistic to degrees of freedom provided additional evidence needed to assess the predictive value of the final model.21,26 This determined how well the model fit the observed data at P < .05.
A receiver operating characteristic curve (ROC) was created to investigate sensitivity and specificity of the scale implied by the GEE final model. The overall predic-tive value of the scale was then determined.27 The area under the curve (AUC) provides a statistic that repre-sents the overall predictive value of the scale. The AUC score represents how well patients who reached IOP values greater than 40 mm Hg were discriminated against those who did not have elevated IOP values. An AUC of 1.0 would represent a perfect discrimination. An AUC of 0.5 represents complete lack of discrimination.
ResultsThere were 111 patients and 377 observation time points
218 AANA Journal June 2012 Vol. 80, No. 3 www.aana.com/aanajournalonline
that defined, via a multivariate logistic regression analysis using the GEE method, which observations and findings were predictive of reaching an IOP greater than 40 mm Hg. The sample demographics and frequencies of patient parameters are given in Table 2. The mean age was 54 years (SD, 12.1), and the range was 21 to 71 years old. No eye disease, including glaucoma, or previous eye surgery was present in the medical history of any patient. The 46 ASA class 3 patients had stable cardiac or respira-tory disease. The anesthetic regimen and intraoperative carbon dioxide levels (30 to 40 mm Hg), peak inspiratory pressure levels (less than 40 mm Hg), and insufflation pressures (14 mm Hg) were all maintained within normal ranges in the anesthesia protocol. The average time spent in the ST position was 2.2 hours (SD, 2.10 hours). Blood loss averaged 290 mL (SD, 175 mL), with a range from 50 to 600 mL, and intraoperative hematocrits were normal, with the mean being 39.9% (SD, 4.5%). Mean crystalloid infusion (lactated Ringer’s solution) was 2,890 mL (SD, 729 mL), with an initial fluid load of approximately 10 mL/kg and 300 mL/h on average thereafter.
The PI and data collectors assessed tonometry mea-surements with a 95% degree of internally calibrated accu-racy as read on the tonometer. The 20 group observation sessions confirmed that all data collectors were equivalent in their observation of eyelid edema, corneal/conjunctival edema (chemosis), and ecchymosis. The interrater reli-ability score using the Trochim25 method confirmed that raters agreed on 97% of the 60 observation time points.
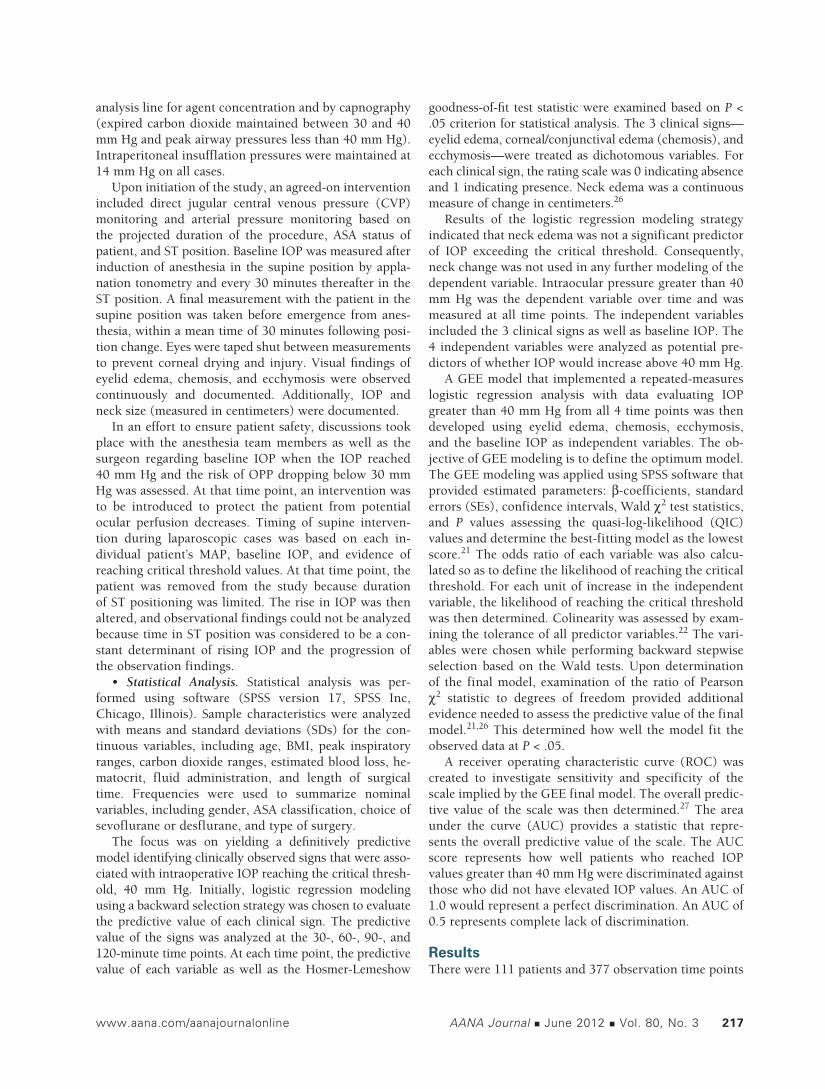
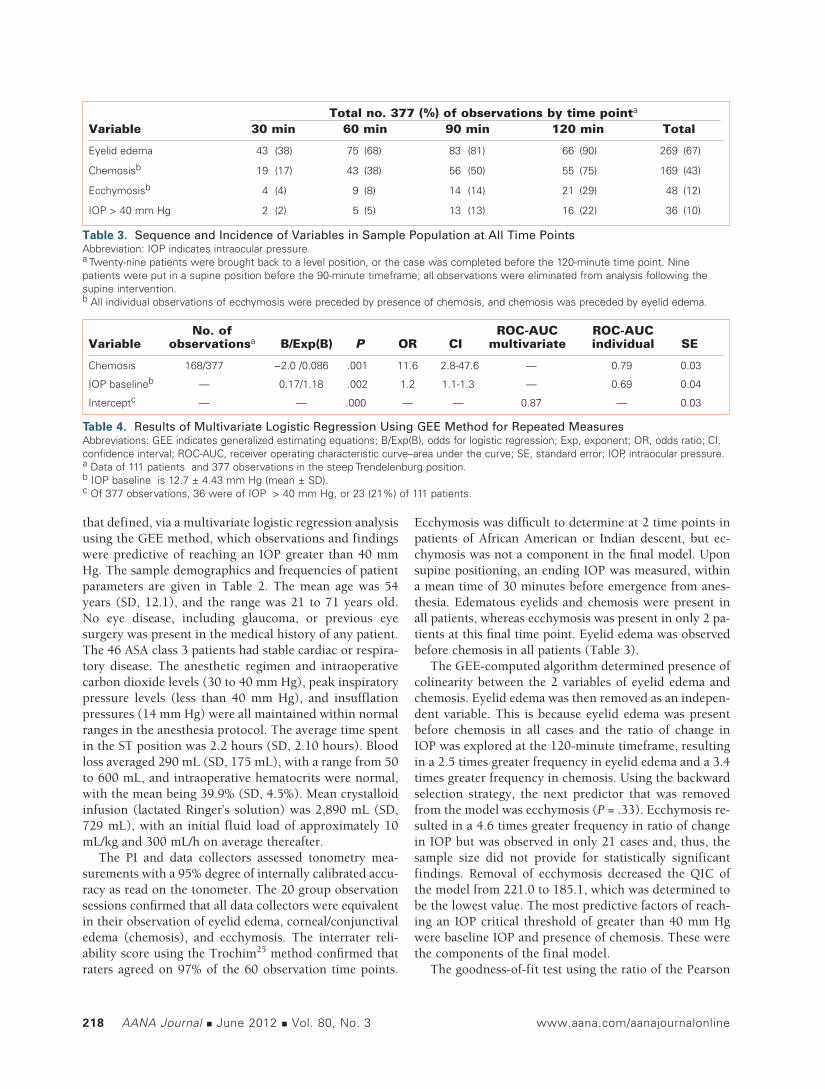
Ecchymosis was difficult to determine at 2 time points in patients of African American or Indian descent, but ec-chymosis was not a component in the final model. Upon supine positioning, an ending IOP was measured, within a mean time of 30 minutes before emergence from anes-thesia. Edematous eyelids and chemosis were present in all patients, whereas ecchymosis was present in only 2 pa-tients at this final time point. Eyelid edema was observed before chemosis in all patients (Table 3).
The GEE-computed algorithm determined presence of colinearity between the 2 variables of eyelid edema and chemosis. Eyelid edema was then removed as an indepen-dent variable. This is because eyelid edema was present before chemosis in all cases and the ratio of change in IOP was explored at the 120-minute timeframe, resulting in a 2.5 times greater frequency in eyelid edema and a 3.4 times greater frequency in chemosis. Using the backward selection strategy, the next predictor that was removed from the model was ecchymosis (P = .33). Ecchymosis re-sulted in a 4.6 times greater frequency in ratio of change in IOP but was observed in only 21 cases and, thus, the sample size did not provide for statistically significant findings. Removal of ecchymosis decreased the QIC of the model from 221.0 to 185.1, which was determined to be the lowest value. The most predictive factors of reach-ing an IOP critical threshold of greater than 40 mm Hg were baseline IOP and presence of chemosis. These were the components of the final model.
The goodness-of-fit test using the ratio of the Pearson
Table 3. Sequence and Incidence of Variables in Sample Population at All Time PointsAbbreviation: IOP indicates intraocular pressure.a Twenty-nine patients were brought back to a level position, or the case was completed before the 120-minute time point. Nine patients were put in a supine position before the 90-minute timeframe; all observations were eliminated from analysis following the supine intervention.b All individual observations of ecchymosis were preceded by presence of chemosis, and chemosis was preceded by eyelid edema.
Total no. 377 (%) of observations by time pointa
Variable 30 min 60 min 90 min 120 min Total
Eyelid edema 43 (38) 75 (68) 83 (81) 66 (90) 269 (67)
Chemosisb 19 (17) 43 (38) 56 (50) 55 (75) 169 (43)
Ecchymosisb 4 (4) 9 (8) 14 (14) 21 (29) 48 (12)
IOP > 40 mm Hg 2 (2) 5 (5) 13 (13) 16 (22) 36 (10)
Table 4. Results of Multivariate Logistic Regression Using GEE Method for Repeated MeasuresAbbreviations: GEE indicates generalized estimating equations; B/Exp(B), odds for logistic regression; Exp, exponent; OR, odds ratio; CI, confidence interval; ROC-AUC, receiver operating characteristic curve–area under the curve; SE, standard error; IOP, intraocular pressure. a Data of 111 patients and 377 observations in the steep Trendelenburg position.b IOP baseline is 12.7 ± 4.43 mm Hg (mean ± SD).c Of 377 observations, 36 were of IOP > 40 mm Hg, or 23 (21%) of 111 patients.
No. of ROC-AUC ROC-AUC Variable observationsa B/Exp(B) P OR CI multivariate individual SE
Chemosis 168/377 −2.0 /0.086 .001 11.6 2.8-47.6 — 0.79 0.03
IOP baselineb — 0.17/1.18 .002 1.2 1.1-1.3 — 0.69 0.04
Interceptc — — .000 — — 0.87 — 0.03

www.aana.com/aanajournalonline AANA Journal June 2012 Vol. 80, No. 3 219
χ2 statistic to the degrees of freedom was: 151.3/37 = 4.1. The parameter estimates from the final model provided evidence of significance (P < .005) of the well-fitting model and yielded an odds ratio of 11.6 for presence of chemosis and 1.2 for baseline IOP (Table 4). The signifi-cance of the components was presented: chemosis (P = .001) and IOP baseline (P = .002). The confidence inter-vals are illustrated in Table 4.
A total of 21% of the sample (23 of 111) reached an IOP greater than 40 mm Hg during surgery (see Table 4). The ROC-AUC score for the final model was 0.87 (SE, 0.03). Presence of chemosis alone, without a baseline IOP, was predictive of greater than 40 mm Hg and resulted in an ROC curve with an individual AUC score of 0.79 (SE, 0.03). A probability scale based on the percentages of estimated log odds from the final model components of the baseline IOP with and without observation of chemo-sis was constructed (Table 5).22 The screening scale was devised based on an objective of maintaining 75% sensi-tivity in the clinical population in which the study was conducted. The reference table was calculated estimating the probability of the IOP reaching a greater than 40 mm Hg value. The scale calculations determined that as the baseline IOP increased, the probability of reaching the critical threshold increased without presence of chemosis (see Table 5). For example, with a baseline IOP of 15 mm Hg or higher, the probability of reaching greater than 40 mm Hg at some time point during surgery in the ST position was 78%. Presence of chemosis with all baseline levels increased the probability of reaching the critical threshold, as seen in Table 5. When chemosis was present with a baseline IOP of 15 mm Hg or above, the probabil-
ity of reaching the critical threshold at some time point during a 2-hour surgery in the ST position was 100%.
DiscussionBaseline IOP and chemosis combined to provide the strongest predictors of IOP greater than 40 mm Hg during surgery in the ST position. Critical thresholds had been determined to be IOP greater than 40 mm Hg via literature review.14,17 This is an estimate of when ocular perfusion may be impaired, but Doppler flow studies are needed to assess this measure. Because flow studies and tonometry measurements are costly and require experi-enced and credentialed personnel, the MBOS is an ob-servation scale that can assist the anesthesia team in de-termining if and when the IOP may increase. The direct relation of IOP to POVL incidence has not been proved. However, the relation of an increased IOP potentially creating a low perfusion state has been acknowledged and the potential that this low flow state may be a cause of POVL has been cited.4,10,13 Because of the serious, life-changing effect of permanent blindness, it might be in the best interest of the patient that caregivers use preven-tive interactions both in assessment and prevention of increasing IOP.6,11
The diagnostic efficacy of the components of the MBOS was determined as significant predictors using the ROC curve AUC score. This score is illustrated in various risk stratification publications; an AUC above 0.76 was deter-mined to be a significant predictor of postoperative nausea and vomiting in one such study.28 Therefore, with an AUC score of 0.86 the final model appears to have a significant predictive value, and patients who had elevated IOPs were discriminated from patients who did not have elevated IOPs. The log odds scale adds greater probability deter-mination of when a critical threshold will be approached so as to time interventions. This additionally allows for a preoperative discussion between the anesthesia and surgical teams so as to determine when critical thresholds may be reached and when an intervention could be intro-duced. Individual patient response to anesthesia, position change, and drug intervention varies markedly. Just as a baseline blood pressure is obtained before anesthesia, it may be recommended that a baseline IOP should be as-certained and individual flow determined.
As is cited in the literature, a marked individual ana-tomical variation has been noted in cases of POVL.11,12
This suggests that baseline values can assist the caregiver in determining the likelihood of reaching critical thresh-old levels within a predetermined time. As noted in the example of when a baseline IOP of 15 mm Hg is provided, the probability of reaching the critical threshold is 78% and should alert the caregivers of the need to be preven-tive. Once the observation of chemosis is present with the same baseline value, the probability is 100% that an IOP greater than 40 mm Hg will be reached.
Table 5. MBOS: Baseline IOP Probabilities of Reaching IOP > 40 mm Hg (Critical Threshold) in Steep Trendelenburg PositionAbbreviation: MBOS, Molloy/Bridgeport Anesthesia Associates Observation Scale; IOP, intraocular pressure.a Preoperative baseline value in a high-risk population.
Conjunctival Baseline edema IOP Probability (chemosis) (mm Hg)a (%)
0 5 14.6
0 10 33.8
0 15 78.3
0 20 100.0
0 25 100.0
1 5 100.0
1 10 100.0
1 15 100.0
1 20 100.0
1 25 100.0

220 AANA Journal June 2012 Vol. 80, No. 3 www.aana.com/aanajournalonline
No significant findings regarding age, gender, BMI, and type of surgery were found to have a causal impact on potential of reaching a critical threshold IOP value. Duration of time in the ST position was determined to be predictive of the increase in IOP, as noted in previous studies,4,7 and the observations were noted to increase at the 60-, 90-, and 120-minute timeframes. It was noted that on observation of chemosis, eyelid edema was also present at those time points. The value in assessing pres-ence of eyelid edema should be noted because this sign was present 100% of the time as a precursor to corneal edema/chemosis. The literature acknowledges the fact that edema and swelling of the ONH can be deleterious via a decrease in tissue oxygenation and a reduced mi-crovascular perfusion.10 The early signs of edema may alert the caregiver to the potential for chemosis because one precedes the other. The degree of chemosis may bear a relation to subclinical tissue damage. The progression in observations of eyelid edema and chemosis can be im-pressive, and this may well be an area for future research that could result in a more precise scale of measure to determine when critical thresholds of 40 to 45 mm Hg IOP are reached.
The fact that the MBOS is based on observation and measurements that are absent of verbal or motor response should be acknowledged. Three examples of observation scales used when patient’s verbal ability may be impaired are the Glasgow Coma Scale recording conscious state via eye movement and verbal and motor response29; the postanesthesia recovery score (PARS) recording anesthe-sia recovery via verbal, respiratory, and motor response30; and the Apgar score for neonates recording appearance, grimace, activity, respiration, and pulse.31 These scales predict underlying, important physiologic events and guide practitioners in assessing degrees of awareness and levels of activity, at which point appropriate safety interventions can be introduced. It is important to note that use of the MBOS involves observing patients who are under general anesthesia. Observation skills of the anesthesia provider are key because anesthetized patients are unresponsive. It should be noted that baseline eyelid and conjunctival condition must be identified to clearly define the level of edema, and that chemosis is detected as one observes the white outer coating (sclera) rising above and around the iris. What may be observed as scleral edema is primarily chemosis.
ConclusionA baseline IOP can provide a probability of when IOP may increase to 40 mm Hg. The presence of chemosis at any time was also predictive of the same critical threshold being reached. When caregivers are provided with base-line IOP, the ability to predict the probability of reaching critical thresholds can be predetermined. Because base-line IOP measurements are not required for most patients
undergoing ST surgery, it may be a recommended change in practice. This may be especially important in high-risk patients who have a history of glaucoma, diabetes, or advanced vascular disease.1,10 Without the baseline IOP, chemosis has proved to be a valuable predictor of reach-ing an IOP greater than 40 mm Hg, which is the critical threshold at which an intervention should be attempted. Observation of chemosis has correlated to 3.4 times greater than baseline value and is readily assessed using the pronounced appearances illustrated in Figure 2 and by observing changes in baseline parameters. Chemosis should alert the caregiver as to the critical time point.
A 5-minute supine rest intervention is recommended at intervals during prone- and ST-position surgery, and the literature supports the value of this intervention in re-ducing IOP and preventing a reduced OPP.1,10,13 A simple reverse Trendelenburg positioning of the operating room table has reduced the IOP. In one such study of 66 sub-jects, with a mean IOP of 31.1 mm Hg at the 60-minute ST position time point, one 5-minute supine intervention resulted in an IOP decrease of 15 to 20 mm Hg within a 30-minute timeframe.7 During robotic surgery this has added an additional 5 to 10 minutes to case time for un-docking and redocking of the robot. Prior to undocking the robot, our research team has been trialing the admin-istration of Cosopt (dorzolamide and timolol) eye drops (1 drop in each eye) and analyzing the effect on IOP. This has prevented the need for undocking in several cases and will be the subject of future studies.
• Limitations and Areas for Future Research. The fact that the study was conducted in only 1 hospital is a limitation. Generalization to other facilities may not produce the same results. Varied surgical experience and anesthesia technique may provide different outcomes. Studies assessing generalization by cross-validation in other facilities are noted in the literature as in the study by Apfel.28 This technique can validate use of both obser-vation interrater reliability as well as study findings.
Patients were brought to a level position when found to progress in IOP to greater than 40 mm Hg, in order to ensure patient safety. As a result, the findings have a ceiling effect for IOP during surgery in the ST position. Once data provided evidence that supine positioning decreased the rising IOP, an ethical choice was made to intervene whenever IOP approached 40 mm Hg. This range was found when IOP was taken at 30-minute in-tervals, and the literature cites this as a range when indi-vidual OPP has been noted to be critically impaired.14,17 This limited the effects of the IOP because repositioning decreased the likelihood that an IOP would be greater than 40 mm Hg and the progression of findings was di-minished. Additionally, if patients had not been placed in a level position, the relative risk to the patient might even be higher and the odds ratio and probability scale calcula-tions might well be increased. This, therefore, should be

www.aana.com/aanajournalonline AANA Journal June 2012 Vol. 80, No. 3 221
presented as a bias in the review of the probability scale and must be considered as a limitation.
Lack of continued measurement between 30-minute timeframes may also be a limiting factor. This was an ethical consideration in prevention of eye irritation secondary to continuous measurements. Acuity of the probability scale may be increased with continued mea-surements so as to determine an exact time when the crit-ical threshold is reached rather than an estimated time. Future studies may also quantify the degree of change in chemosis over time and correlate the change with IOP to provide a more precise determinant of the IOP value.
It must be noted that the change from baseline normal findings was an interpretation of the data collector and the PI, thus introducing a subjective component to the MBOS. Interrater reliability scores were tabulated using the PI as the cross-reference, which is an additional limi-tation in the study findings. The demand effect has been noted in the literature. This occurs when the research-ers’ results are contrived as an outcome effect of data collectors wishing to please the main experimenter (the PI).32 This may not be completely alleviated with cross-validation practice; however, additional facilities and cross-referencing with other investigators will provide an increased reliability and validity of the MBOS measures.
Additionally, because baseline IOP is a statistically significant predictor of reaching the critical threshold IOP level, it would seem imperative to obtain an ac-curate baseline value. The problem lies in the fact that a study recently published in the American Academy of Ophthalmology’s journal states that diurnal IOP patterns are not always repeatable.33 Forty healthy subjects were reviewed over a 12-hour period on 2 separate visits, and their IOP levels fluctuated over the course of the day and varied from visit to visit. Additionally, the pattern of IOP values from morning to evening did not coincide on the 2 separate visits. Although the correlation coefficients varied only from −0.16 to 0.35, it should be noted that 1 base-line IOP may not be sufficient in determining a patient’s baseline IOP. This concern with stability of baseline IOP measurement was also discussed in a study involving mea-surement of the IOPs of 115 airplane pilots over a 3-day period; the study found IOP variation from 0 to 14 mm Hg, with a mean of 3.5 mm Hg.34 The conclusions drawn from both these studies were that underlying mild disease entities, dietary habits, and timing of medications for treatment of mild hypertension and hypercholesterolemia might have been a cause for significant fluctuation in the subjects’ baseline IOP. It should be noted that there was an attempt to control for this with a steady regimen of diet and timing of medication during the study interim.34 On review, many of the patients with ASA physical status 2 and 3 who were included in the current observation study were noted to be receiving medications for treatment of mild hypertension and high cholesterol. However, no lab-
oratory values were considered to be outside the normal ranges, and vital signs and hemodynamic parameters were monitored and were within normal ranges. Medication timing and dietary restrictions were not controlled for in the MBOS study, and therefore the potential for interac-tion cannot be ruled out.
• Significance and Recommendations for Practice. The MBOS is an observation and probability scale that anes-thesia professionals can use in all intraoperative settings when there is a question of increased IOP secondary to position or underlying disease entities. There is no con-sistent underlying mechanism known to all POVL cases that have been reviewed in the literature. Therefore, to-nometry measurement has not been a required standard of care. There is no direct correlation made between increased IOP and POVL, although retinal cell gan-glion dysfunction has been noted.2 Therefore, tonometry measurement has not been a required standard of care. Delattre et al6 concluded that POVL seems to be a multi-factorial problem. When IOP is significantly elevated by conditions such as glaucoma or sustained ST position, it may be important to maintain stable ocular perfusion by elevating MAP or decreasing IOP. Therefore, there is a need for a valid, reliable, brief, and easy-to-use clinical observation scale to determine probabilities of critical in-creased IOP, so as to alert the anesthesia caregiver before surgery and to measure significant increases in IOP. With use of the MBOS, a baseline IOP can determine the probability of a patient reaching the critical threshold of IOP, eyelid edema can alert the caregiver of an impending rise in IOP, and presence of chemosis assists anesthesia caregivers in identifying IOP greater than 40 mm Hg. At that time point, the need to initiate interventions might prevent POVL incidents.
REFERENCES 1. Lee LA, Roth S, Posner KL, et al. The American Society of Anesthesi-
ologists Postoperative Visual Loss Registry: analysis of 93 spine sur-gery cases with postoperative visual loss. Anesthesiology. 2006;105(4): 652-669.
2. Bui BV, Edmunds B, Cioffi GA, Fortune B. The gradient of retinal functional changes during acute intraocular pressure elevation. Invest Ophthalmol Vis Sci. 2005;46(1):202-213.
3. Awad H, Santilli S, Ohr M, et al. The effects of steep Trendelenburg positioning on intraocular pressure during robotic radical prostatec-tomy. Anesth Analg. 2009;109(2):473-478.
4. Molloy BL. Implications for postoperative visual loss: steep Tren-delenburg position and effects on intraocular pressure. AANA J. 2011;79(2):115-121.
5. Riva CE, Hero M, Titze P, Petrig B. Autoregulation of human optic nerve head blood flow in response to acute changes in ocular perfusion pressure. Graefes Arch Clin Exp Ophthalmol. 1997;235(10):618-626.
6. Delattre O, Thoreux P, Liverneaux P, et al. Spinal surgery and oph-thalmic complications: a French survey with review of 17 cases. J Spinal Disord Tech. 2007;20(4):302-307.
7. Molloy BL. A comparative assessment of intraocular pressure in pro-longed steep Trendelenburg position vs. supine position intervention. Poster presented at the PostGraduate Assembly in Anesthesiology; December 11, 2010; New York, NY.
8. Chalam KV, Tillis T, Syed F, Agarwal S, Brar VS. Acute bilateral

222 AANA Journal June 2012 Vol. 80, No. 3 www.aana.com/aanajournalonline
simultaneous angle closure glaucoma after topiramate administration: a case report. J Med Case Reports. 2008;2:1.
9. Montgomery TM. Anatomy, physiology and pathology of the human eye. http://www.tedmontgomery.com/the_eye/index.html. Accessed May 1, 2010.
10. Baig MN, Lubow M, Immesoete P, Bergese SD, Hamdy EA, Mendel E. Vision loss after spine surgery: review of the literature and recom-mendations. Neurosurg Focus. 2007;23(5):15-21.
11. Porciatti V, Nagaraju M. Head-up tilt lowers IOP and improves RGC dysfunction in glaucomatous DBA/2J mice. Exp Eye Res. 2010;90(3):452-460.
12. Gilbert ME. Postoperative visual loss: a review of the current litera-ture. Neuro-Ophthalmology. 2008;32(4):194-199.
13. Hayreh SS. Ischemic optic neuropathy. Retinal Eye Res. 2009;28(1): 34-62.
14. Pillunat LE, Anderson DR, Knighton RW, Joos KM, Feuer WJ. Autoregulation of human optic nerve head circulation in response to increased intraocular pressure. Exp Eye Res. 1997;64(5):737-744.
15. Dunker S, Hsu HY, Sebag J, Sadun AA. Perioperative risk factors for posterior ischemic optic neuropathy. J Am Coll Surg. 2002;194(6): 705-710.
16. Murgatroyd H, Bembridge J. Intraocular pressure. Contin Educ Anesth Crit Care Pain. 2008;8(3):100-103. doi: 10.1093/bjaceaccp/mkn015.
17. Harris A, Ciulla TA, Chung HS, Martin B. Regulation of retinal and optic nerve blood flow. Arch Ophthalmol. 1998;116(11):1491-1495.
18. Savitsky E. Acute orbital compartment syndrome (retrobulbar hem-orrhage) management. In: Reichman E, Simon R, eds. Emergency Medicine Procedures. 4th ed. New York, NY: McGraw-Hill; 2004:1248-1252.
19. Cheng M, Todorov A, Templehoff R, McHugh T, Crowder CM, Lauryssen C. The effect of prone positioning on intraocular pressure in anesthetized patients. Anesthesiology. 2001;95(6):1351-1355.
20. Lasseck J, Jehle T, Feltgen N, Lagreze WA. Comparison of intraocular tonometry using three different non-invasive tonometers in children. Graefes Arch Clin Exp Ophthalmol. 2008;246(10):1463-1466.
21. Hanley JA, Negassa A, Edwardes MD, Forrester JE. Statistical analysis of correlated data using generalized estimating equations. Am J Epide-miol. 2003;157(4):364-375.
22. Ballinger GA. Using generalized estimating equations for longitudinal data analysis. Organ Res Methods. 2004;7:127-150.
23. Polit DF, Tatano Beck C. Nursing Research: Generating and Assessing Evidence for Nursing Practice. 8th ed. Philadelphia, PA: Lippincott Williams & Wilkins; 2008:604-605.
24. Liang, K-Y, Zeger SL. Longitudinal data analysis using generalized linear models. Biometrika. 1986;73:13-22. Cited in Zorn CJW. Gen-eralized estimating equation models for correlated data: a review with applications. Am J Polit Sci. 2001;45:470-490.
25. Trochim MK. Nonprobability sampling. In: The Research Methods
Knowledge Base. 2nd ed. http://www.socialresearchmethods.net/kb/sampnon.php. Updated October 20, 2006.
26. Munro BH. Statistical Methods for Health Care Research. Philadel-phia, PA: Lippincott; 2005:301-320.
27. Fletcher RH, Fletcher SW. Clinical Epidemiology: The Essentials. 4th ed. Philadelphia, PA: Lippincott Williams & Wilkins; 2005:38-50.
28. Apfel CC, Läärä E, Koivuranta M, Greim CA, Roewer N. A simpli-fied risk stratification score for predicting postoperative nausea and vomiting: conclusions from cross-validations between two centers. Anesthesiology. 1998;91(3):693-700.
29. Teasdale G, Jennett B. Assessment of coma and impaired conscious-ness: a practical scale. Lancet. 1974;2(7872):81-84.
30. Aldrete JA. The post-anesthesia recovery score revisited. J Clin Anesth. 1995;7(1):89-91.
31. Apgar V. A proposal for a new method of evaluation of the newborn infant. Curr Res Anesth Analg. 1953;32(4):260-267.
32. Shi L. Health Services Research Methods. Clifton Park, NY: Delmar Learning; 2009:173-184.
33. Realini T, Weinreb RN, Wisniewski SR. Diurnal intraocular pressure patterns are not replicable in the short term in healthy individuals. Ophthalmology. 2010;117(9):1700-1704.
34. Daubs JG. Patterns of diurnal variation in the intraocular pressure of airline pilots. Aerosp Med. 1973;44(8):914-917.
AUTHOR Bonnie Molloy, CRNA, PhD, APRN, is chief nurse anesthetist, quality and risk manager, and research director of the Anesthesia Department at Bridgeport Hospital/Yale-New Haven Network in Bridgeport, Connecticut. She also is a clinical faculty and research faculty member of the Fairfield University Doctorate of Nurse Practitioner/Nurse Anesthesia Program, Fairfield, Connecticut. Email address: [email protected].
ACKNOWLEDGMENTSI thank these mentors and advisors: Deborah McDonald, PhD, University of Connecticut (UConn) research advisor; Stephen Walsh, PhD, UConn statistical advisor; Regina Cusson, PhD, UConn dean of school of nursing, associate advisor; Charles Watson, MD, chairman, Anesthesia Depart-ment, Bridgeport Anesthesia Associates, Bridgeport, Connecticut; Anthony Peluso, MD, Bridgeport Anesthesia Associates, advisor; Bruce Shields, MD, past chairman, Department of Ophthalmology, Yale-New Haven Health System, New Haven, Connecticut, mentor; and Robert K. Gable, EdD, instrument development advisor. Research assistants included Esra Anson, CRNA; Keisha Johnson, CRNA; Kathryn Sapiente, CRNA; Michele Kiezerweerd, CRNA; and Jason Westra, CRNA. Surgical associates were Scott Thornton, MD, colorectal surgeon, Bridgeport Hospital, Bridgeport, Connecticut; Jonathan Bernie, MD, urologic surgeon, Bridgeport Hospital, Norwalk, Connecticut; Anthony Musto, MD, chairman of ophthalmology, Bridgeport Hospital. Medical illustrator was Victoria Skomal Wilchinsky.