a primer on conservation-oriented water pricing
DESCRIPTION
How to use price as a tool to improve water service provider financial performance and community water use efficiency By the Polis Project on Ecological Governance --- This primer provides an overview of conservation-oriented water pricing for decision makers, water utilities and service providers in Canada.TRANSCRIPT

Water Susta inability Project
Worth Every Penny:Worth Every Penny: A Primer on Conservation-Oriented Water Pricing
Oliver M. Brandes, Steven Renzetti and Kirk Stinchcombe
University of Victoria
MAY 2010
How to use price as a tool to improve water service providerfi nancial performance and community water use effi ciency

Worth Every Penny: A Primer Water Susta inability Project
AUTHORS:Oliver M Brandes (University of Victoria), Steven Renze t ti (Brock University), K irk Stinchcombe (Econnics)
PROJECT TITLE:Wor th Every Penny: A Primer on Conserva t ion-Oriented Wa ter Pric ing
ISBN 978 -1-55058 -417-2
Acknowledgements:To ensure Worth Every Penny: A Primer on Conservation-Oriented Water Pric ing is as re levant and useful as possible to municipa l leaders, staf f and wa ter policy makers, an exhaustive practitioner and expert review process was employed. Wa ter managers, economists and various recognized wa ter experts provided de ta iled review and input during deve lopment of the publica tion. In particular, we would like to thank Eric Bonham, David Brooks, Joshua Cra ig, Al Die temann, Mike Donne lly, Diane Dupont , Duncan Ellison, James Etienne , Daphne Ferguson, John F innie , Ray Fung, Wayne Ga lliher, Elizabe th Hendriks, Edward Henley, Deborah Humphrey, Ne lson Ja te l, Debby Leonard, Carol Maas, Ka thy McAlpine -Sims, Jon O’Riordan, Ra lph Pentland, Glen Pleasance , Susanne Porter-Bopp, Lee la Ramachandran, Kevin Re illy, Ta litha Soldera , Ted van der Gulik , Barbara Vea le and Mike Zbarsky for de ta iled comments on draf ts of this document . All errors and omissions are the responsibility of the authors a lone .
Thanks a lso go to Liz Lefrançois from Environment Canada , Zita Bothe lo from the British Columbia Ministry of Environment , Duncan Ellison of the Canadian Wa ter and Wastewa ter Associa tion and the Canadian Wa ter Ne twork for assistance and support with outreach and distribution. A specia l thank you goes to Liam Ed-wards and Glen Brown a t the British Columbia Ministry of Community and Rura l Deve lopment for ca ta lyzing this research and providing initia l support for this project . Brad Hornick is the crea tive spark providing layout and design. Tracey Hooper edited and got us ready for publica tion. We would a lso like to thank everyone a t the University of Victoria’s POLIS Project for ongoing support and encouragement , especia lly Elizabe th Hen-driks for her coordina tion, perspectives and input throughout the project , and Ann Zurbrigg for administra tive support .
We would like to thank the Wa lter & Duncan Gordon Founda tion, the University of Victoria and the Eco-Research Cha ir for the ir ongoing core support of the Wa ter Susta inability Project a t POLIS.
KEY MESSAGES Conservation-oriented pricing makes solid sense fromboth fi nancial and environmental perspectives.
• On average, Canadian utilities are currently not recovering enough money from their customers to cover the costs of the services they provide.
• At the same time, Canadians are among the biggest users of water on the planet, which could result in signifi cant regionalized environmental impacts.
Potential negative consequences of conserva-tion-oriented pricing on communities can be mitigated. For example, mechanisms to stabi-lize revenue can be implemented, and volume-based pricing does not have to mean harmful impacts on low income families.
One of the greatest benefi ts of conservation-oriented pricing is that it allows individuals much greater control over their water costs. Depending on how it is implemented, those who choose to conserve may actually see a decline in the amount that they pay.
It’s a question of fairness. Why should prolifi c water users pay the same amount as those who do their best to conserve?
Remember that the objective of conservation-oriented pricing is to cover the full costs of pro-viding water services and no more. Someone ultimately has to pay these costs. It just makes sense to do so directly through the water bill.
Revenue generated by conservation-oriented pricing can be reinvested in the water supply system to repair aging infrastructure, develop and enhance conservation programs and protect water sources. Ultimately, this is an investment in the future of communities.
Improved pricing provides a strong incentive to innovate.
Many other places are successfully doing it.
eriririrriringngngngngngng e e e e e enononononononononougugugugugugugugugh mos s ss ththhtheyeyeyey p ppproroororovivivivviviv de.
money mo
A 10-STEP PLAN FOR DEVELOPING A CONSERVATION-ORIENTED PRICINGSYSTEM:1 . Have a plan.2 . Get buy in and
authority from senior management and e lected offi cials.
3 . Get metered and start charging by volume.
4 . Get the water bill right.5 . Improve accounting
of water use in the community.
6 . Account for expenditure and understand costs.
7. Consider starting with a seasonal surcharge.
8 . Make it a part of a complete program.
9. Recruit the a id of senior government.
10. Take the long-term view.
i

Worth Every Penny: A Primer Water Susta inability Projectii
Although the principal focus of the primer relates to the use of water service pricing as a tool to promote water use effi ciency and conservation in house-holds, much of the discussion has general applicability to the commercial and institutional sectors as well. Agricultural and industrial water pricing, in contrast, have many dif ferent issues and considerations. They require separate attention and are beyond the purview of this primer.
Our hope is that this primer will assist in entrenching a community-wide commitment to water conservation, fi nancial stability and innovation. We believe that a successful, comprehensive water conservation program starts by understanding how to use price as a signal to both manage water demand and sustain water infrastructure for the future. The best water conservation programs will use a variety of techniques and approaches, of which pricing is only one component. Additional resources and some tools to start down the path and help develop a comprehensive, integrated and long-term approach to sustainable water management are listed at the end of the document.
This primer provides an overview of conservation–oriented water pricing. It explains how it works, what the benefi ts are, and how water utilities can implement and transition to this system over time. The primer also offers advice on how to address some implementation challenges, including how to avoid negative effects on low-income families and how to maintain revenue stability for water utilities.
Engaging in the process of water pricing reform is a diffi cult and complex task. It requires not only sophis-ticated economic knowledge but also the involvement of a range of key players beyond just water managers, including municipal or regional senior staff and fi nancial offi cers, local politicians and senior government. To successfully move pricing towards a conservation-oriented pricing system requires all of these decision makers to be engaged and supportive.
This primer focuses on promoting conservation-oriented water pricing as a key tool in the water manager’s toolkit. It is written specifi cally to assist those seeking to lead change, particularly those who may not have an extensive background in fi nance or economics. More technical concepts—such as marginal cost and price elasticity—are explained in “tech boxes” throughout the document. To demon-strate what is possible and happening on the ground today, a number of case studies from around North America are also provided.
ABOUT THE PRIMER
People of ten use the term “water price” interchangeably to mean dif ferent things. The range of meanings includes se lling and pricing water itse lf (the substance, for example in bottles or other containers) and se lling and pricing water rights (the legal right to use, divert, or control water). In this document, when we refer to water price, we mean se lling and pricing treated water servic-es—the price associated with the provision of physical infrastructure and services required to treat and de liver water to homes, businesses and institutions. We certa inly recognize that water is much more than just a commodity and that it has signifi cant ecologica l, spiritua l and other va lues. We a lso recognize that pricing is but one of many possible tools that can be used to achieve greater water use effi ciency, conservation and stewardship. For us, pricing is most certa inly not an end in itse lf but rather an instrument that can he lp society achieve its goa l of water susta inability.
TABLE OF CONTENTS FIGURES
of ten uuuuuussseseeeseesesesee ttttttthehhhehhhhhhhh ttteeeeeeeeeee of tennnnnnnnnnnn uu uuuuuu uuseseseseeessesseseseseseseseeese tttttttttttheheheheehehehheheheehehehe ttttttt t tttttt ttt eeeeeeeeeee“water pricccecececeececeececeececececece” ”””””” ” i t h g bl t
People oPeople “
ole o“w
iii
Section 1: Pricing Water Services - Sustaining Infrastructure
Section 2: The Case for Improving Water Pricing in Canada
Section 3: Setting Up a Conservation-Oriented Pricing System
Section 4: Addressing the Challenges to Conservation-Oriented Pricing
Section 5: From Concept to Action - a Step-By-Step Plan to Reform Your Pricing Regime
01
05
13
23
31
F igure 1: Internationa l Comparison of Municipa l Water Prices and Consumption
F igure 2: Percent of Canadian Single Dwe lling Residentia l Customers That Are Metered
F igure 3: Comparison of Unit Prices of Water Services and Waste -water Services to Households, Including Taxes
F igure 4: Revenues and Expenditures of Canadian Water Agencies: 1988 to 2007
F igure 5: Types of Water Rates Illustrated
iv
06
08
11
20
Case Study 1: Ha lifax Water, Nova Scotia
Case Study 2: Seat tle Public Utilities, Washington
Case Study 3: San Antonio Water System, Texas
Case Study 4: City of Gue lph, Ontario
Case Study 5: Vancouver Island Communities
04
15
26
30
35
CASE STUDIESTech Box 1: Water, Wastewater, or Both?
Tech Box 2: The Numbers Say It All…
Tech Box 3: The Price Elasticity of Demand for Water
Tech Box 4: Margina l Cost vs. Average Cost Pricing
Tech Box 5: Types of Rates
Tech Box 6: The Great Rate Debate: Uniform vs. Inclining Block
TECH BOXES03
07
12
17
19
21

Worth Every Penny: A Primer Water Susta inability Project 01
1 . Expansion of infrastructure in a lmost a ll municipa lities is pa id for by deve lopment charges levied on the deve loper and pa id for by the home owner as part of the price of the new home . However, future ma inte -nance of this infrastructure is usua lly intended to be pa id for through wa ter bills. 2 . It is important to note the cha llenges associa ted with interna tiona l comparisons due to dif ferent da ta ga thering approaches and varying leve ls of comparability and changes across da ta se ts both be tween countries (and even be tween provinces in Canada) and across time . None the less, we use this comparison to illustra te a point: even tak ing potentia l da ta defi ciencies into account , Canadians use a signifi cant amount of wa ter compared to other places, with pricing be ing one of the e lements tha t accounts for this dif ference .
SECTION I: PRICING WATER SERVICES - SUSTAININGINFRASTRUCTURE
Inevitably, society has to pay for the infrastructure and services that store, treat and distribute water to our homes and businesses.1 Yet, Canadians typically pay only a portion of these costs through regular water bills. The remaining costs must be postponed, leading to deteriorating infrastructure. Alternatively, they must be subsidized from other sources, including infra-structure grants from provincial and federal govern-ments or municipal government general revenue (usually generated from property taxes). This keeps the retail price of water artifi cially low.
In addition to water being relatively cheap, Canada’s water consumption is high compared to other countries. In fact, Canadians are among the biggest water users in the world.2 Figure 1 compares municipal water service prices and consumption among various Western European and North American countries—and Canada comes out fi rmly last in both respects. The message is clear: Canadians pay relatively little for their water, and their consumption is comparably high.
When it comes to water conservation planning, pricing reform is a bit like the proverbial “elephant in the room” in the boardrooms and council chambers of
Figure 1:INTERNATIONAL COMPARISON OF MUNICIPAL WATER PRICES AND CONSUMPTION
Germany
Belgium
France
Netherlands
United Kingdom
Finland
Italy
Sweden
Ireland
Spain
United States
Canada
100 150 200 250 300 350
$0.00 $0.50 $1.00 $1.50 $2.00 $2.50
Consumption
Price
Water Pricing (purchasing power parity)
Water Consumption (litres per day per person)
G
Source: Council of Canadian Academies. (2009). The Susta inable Management of Groundwater in Canada: Report of the Expert Pane l on Groundwater. Ot tawa , ON. p 115 .
Worth Every Penny: A Primeriv

Worth Every Penny: A Primer Water Susta inability Project02 03
IS CONSERVATION-ORIENTED PRICING THE ELEPHANT IN THE BOARDROOM?
Conservation-Oriented Water Pricing is a rate structure adopted by a water service provider where the costs of providing services are recovered, individua l customers are metered and pay for the volume of water they use, and the price signa l is suffi cient to af fect individua l decisions and encourage conser-vation and effi ciency.
TECH BOX 1: WATER, WASTEWATER, OR BOTH?
We might be tempted to think that volumetric charging applies only to water coming out of the tap. But when both water and wastewater services are be ing provided, volumetric charging can a lso be used to price wastewater. This can be done even when the sewer is not metered (as is a lmost a lways the case). Typically, this involves setting a volume-based wastewater charge based on a discharge factor—essentially an assumption about how much of the water that comes into a home or business is subsequently discharged to the sewer (i.e., the percent of water that goes down toilets and dra ins as opposed to water that goes onto lawns or cars or into swimming pools).
Provided that pricing information is clearly communicated, having a volume-based wastewater charge can magnify the ef fect of conservation-based pricing, simply because customers will rea lize that they will save on both their water and wastewater bills if they use less. That is, they will rea lize that the combined price that they pay for their water and wastewater services increases as they consume more.
Halifax Water in Nova Scotia, explored in Case Study 1, is an example of a water service provider that has had success with moving to volumetric wastewater charges, and is all the more interesting because they also include costs of stormwater infrastructure in their bill.
03
3 . In this document we use the term “wa ter service provider” generica lly to refer to a ll types of organiza tions, regardless of the ir institutiona l form: legisla ted wa ter utilities, municipa l wa ter departments, corpora tized public entities, public works divisions, etc.
Canadian water service providers and municipalities.3 Too often the potential to use price as a signal to curtail water over-use and a way to improve long-term fi nancial performance is simply overlooked.
CONSERVATION-ORIENTED PRICING: CHANGING CHOICES THROUGH THE WATER BILLFundamentally, the price charged for water services should: 1 . provide enough revenue to water utilities and sup-pliers to cover the full costs of providing the service, including maintaining and replacing infrastructure;2. signal the actual cost of supplying water and pro-
vide a fi nancial incentive for customers to use it more effi ciently;3 . promote innovation by encouraging inventors, engineers and scientists to
develop water-saving devices, practices and technologies.
The basic concept of conservation-oriented pricing is that we should set community water rates suffi ciently high to refl ect the full costs of providing services, and to affect individuals’ choices about how they use water. This includes behavioural choices about the quantity they consume and their purchase selections when they buy water-using technologies and services. The majority of people and organiza-tions will change their behaviour because they recognize that conserving will lead to fi nancial savings. In short, by setting a more appropriate price, people will change the value they place on water and modify their actions accordingly.
The water service provider is interested in achieving these greater effi ciencies because it will mean better use of scarce operational capital, deferred future expansion costs and reduced environmental impacts.
A number of preconditions must exist to implement such a progressive pricing system:
1 . individually metered water connections; 2. volumetric charging (where users are charged for the amount of water
they use); and 3 . a water rate that is suffi ciently high to af fect a user’s decision making.

Worth Every Penny: A Primer Water Susta inability Project04 05
Case Study 1: HALIFAX WATER, NOVA SCOTIA
Halifax Water provides utility services to more than 79,000 metered connec-tions and a population of approximately 350,000 in the Halifax Regional Municipality. Halifax Water is an autonomous and self-fi nanced utility. It also
has a history of demonstrating Canadian leadership in other areas related to water demand management, most notably in pressure and leakage management.i
In 2007, utility services were merged, making Halifax Water the fi rst regulated water, wastewater and stormwater utility in Canada . This created a unique opportunity to provide integrated, cost-ef fective and environmentally sound services across the full urban water cycle.
Halifax Water’s billing structure consists of a fi xed charge and three separate variable components, a ll of which are based on the customer’s water consumption volume:
• a water consumption charge that refl ects the cost of pumping and treating water and ma intaining the distribution system;
• a wastewater and stormwater management charge that refl ects the cost of oper-ating both the stormwater and sanitary sewer systems; and
• an “environmenta l protection charge” that refl ects infrastructure, operating and capital upgrade costs associated with the wastewater collection and treatment system.
While the total cost for a typical residential water bill is not particularly high in Halifax, even by Canadian standards, the organization’s approach is still interesting for a couple of reasons. First, Halifax Water is tasked with integrated management of a ll aspects of the urban water cycle, including stormwater, and is working towards full cost accounting and recovery across a ll components. Second, by having separate volumetric billing components for water, wastewater and stormwater, they provide direct information to customers about the costs of managing each of these sub-systems, and thereby indirectly inform customers about the environmental linkages between them.
Halifax Water has committed to continuously improving their approach to cost recovery as part of their integrated urban water management mandate.
For more information, see www.ha lifax.ca /hrwc /RatesAndFees.html
While Canada has signifi cantly improved metering and billing practices in recent years, we still have some way to go to meet the basic requirements of a conservation-oriented pricing system.
1. MeteringAs of 2006 (the most recent year for which data are available), only 63 .1% of customers living in single-family dwellings in Canada were metered.ii In other words, over one-third of Canadian homes still do not have a water meter. This is puzzling when you consider that universal metering is commonplace and expected in other utility sectors, such as electricity or natural gas. In these sectors, we would be very surprised indeed if usage were not metered.
The extent of metering is also highly variable from province to province (see Figure 2). In British Columbia, only 32.6% of residential customers are metered. In Quebec, only 16.5% of residential customers are metered. In Newfoundland, only a fraction of one percent of residential customers have a meter.iii
Some municipalities continue to resist meter installation, typically citing costs to homeowners or the belief that demand management goals can be met by other means, such as education. But based on the adage that “what gets measured gets managed,” it is diffi cult to expect that Canadians will seriously embrace urban water sustainability objectives without adopting metering as a basic planning tool. As demonstrated by leading practices from around the world, metering is a foundational element of any comprehensive pricing program, not to mention crucial to any ef forts to seriously address unaccounted for water, including system leakage.
SECTION II:THE CASE FOR IMPROVING WATERPRICING IN CANADA
Worth Every Penny: A Primer

Worth Every Penny: A Primer Water Susta inability Project
Two-thirds of Organisation for Economic Co-operation and Development (OECD) member countries already meter more than 90% of single-family houses.iv Without meeting this basic requirement, it is impossible to charge based on the volume consumed and is diffi cult to manage community consumption.
2. Volumetric ChargingAbout one-quarter of customers living in single-family dwellings in Canada still receive a fl at rate water bill. This means that they are charged a pre-set monthly fee that provides for a virtually unlimited amount of water. Like an all-you-can-eat buffet, fl at rate billing is a problem because it creates an incentive to over-consume
09
(see Tech Box 2). Almost a quarter (23.4%) of Canadian homes were still on this kind of system as of 2004.v The good news is that the numbers for businesses are much better, and the number of residential customers on fl at rates has also been steadily declining in recent decades. But we do still have some way to go.5
The remaining three-quarters of Canadians do face volumetric-based charging, so are billed for the volume of water they use. However, even when the structure is right, the per unit rate they pay may not be high enough to signifi cantly affect their behaviour.
3. Suffi ciently High Water RatesWhat exactly defi nes a “suffi ciently high” price for water? The question is certainly open to debate and of ten depends on context.
One way to assess whether Canadian water rates are “high enough” is to compare both our prices and our water consumption to other developed countries. As shown in Figure 1 , above, Canada’s municipal water service prices are the lowest among a number of similar European and North American countries, and our per capita use is among the highest.
Similar but more recent data come from a 2010 study by the OECD. This compared average per unit prices for water and wastewater services, including taxes, for households across 20 OECD and non-OECD countries (see Figure 3). Again, Canada’s prices were the lowest of the responding countries, which included places such as South Korea, Poland and Hungary. Countries such as
Figure 2: PERCENT OF CANADIAN SINGLE DWELLING RESIDENTIAL CUSTOMERS THAT ARE METERED
Responding Population = 27 927 531; based on single-family residential dwe llings4 Source: Based on data from Environment Canada . (2009). Municipa l Water and Wastewater Survey: Municipa l Water Use 2006 Summary Tables. Ottawa , ON.
4 . Because these da ta are based on stand-a lone houses, these ra tes like ly oversta te me ter coverage in Canada . Many people live in apartment buildings tha t have a single master me ter ra ther than individua l unit me ters. These types of customers are not captured in the sta tistics.5 . Note: upda ted (2006) da ta on the ra te of me tering were ava ilable a t the time of writing, but only 2004 da ta were ava ilable on wa ter pricing. Also, the number of residentia l customers facing non-volume tric charging is higher (29 .9%) if you include customers who are not billed separa te ly for wa ter but instead pay for wa ter services through the ir loca l taxes based on property condition or some other assessment .
TECH BOX 2: THE NUMBERS SAY IT ALL…
The evidence is striking that volumetric pricing is far more ef fective than fl at rate pricing in reducing water consumption. The typical Canadian household on a fl at rate system uses an average of 467 litres per person per day (L /p/day). The average for a household on a volumetric charging system is only 266 L /p/day or 43% lower, a sizeable dif ference by any standard.vi
A number of factors may expla in this gap, including dif ferences in housing stock, average family size and income, the accuracy of water use accounting practices and better system leak detection in metered areas. In some cases, past water-related cha llenges have driven utilities to use more ef fective pricing systems. However, these explanations account for only some of the discrepancy. There is no avoiding the fact that when a municipality introduces variable pricing, people respond by reducing their water use. In most cases, consumption drops over the next few years.
Perc
ent
Sask
atch
ewan
N.W
.T.
Man
itoba
Nov
a Sc
otia
Ont
ario
Albe
rta
Nun
avut
New
Bru
nsw
ick
Briti
sh C
olum
bia
Que
bec
Yuko
n
P.E.I.
New
foun
dlan
d &
Labr
ador
Tota
l Can
ada
Percent Metered
Province
120
100
80
60
40
20
0
0706

Worth Every Penny: A Primer Water Susta inability Project08
Australia, New Zealand, Great Britain and others in Western Europe all seem to charge much more for water, yet they enjoy a very comparable quality of life.vii
It is a bit perplexing that Canada is such a cheap supplier of water, but some likely explanations exist. Part of it is rooted in an historic “frontier” belief that we enjoy an endless supply. This “myth of abundance”—the popular miscon-ception among many Canadians that we have an unlimited availability of fresh water—leads to a deep-seated overconfi dence that we can afford to waste. This kind of thinking creates substantial political barriers to pricing reform.
In reality, our situation is really not so different from many other places. The technology we use to capture, treat and distribute water is similar to that used in other countries. The proximity of water supplies to major settlements is comparable to, for example, much of northern Europe. And fi nally, potable water supplies in the southern part of Canada are not really much more abundant than in many other parts of the world.viii Indeed, if anything, our low population densities and variable climate should mean higher average prices for water services than many developed countries.ix
WHY WATER UNDER-PRICING AND OVER-CONSUMPTION ARE PROBLEMSIf over-consumption and under-pricing are linked, why should we care? The answer is that there are a number of sound fi nancial, social and environ-mental reasons to change water pricing models, including:
• water service providers experience higher oper-ating costs due to the need to pump and treat water that is not always used effi ciently;
• excess water treatment, pumping and heating re-quires signifi cant energy inputs, which in turn can mean unnecessary greenhouse gas emissions;
• sewer fl ows are higher than need be, which results in unnecessary treatment and disposal costs and environmental impacts on receiving water quality and fi sh populations;
• because water demand is generally higher than it needs to be, new bulk supplies such as dams or new groundwater wells may need to be constructed sooner or larger than necessary, resulting in higher than necessary capital and overhead costs as well as environmental impacts;
• peaking factors—the point at which water use is greatest during the year (usually on hot summer days)—are very high because people have little incentive to moderate their consumption. This means that pipes, pumps, treatment plants and reservoirs must be constructed and oversized to meet excess demand on these very few days of the year, which infl ates the price tag of our infra-structure;
• in order to curb demand, water utilities of ten have to rely on less ef fective and relatively more costly tools, such as outdoor watering restrictions or product rebates;
Figure 3: COMPARISON OF UNIT PRICES OF WATER SERVICES AND WASTEWATER SERVICES TO HOUSEHOLDS, INCLUDING TAXES (USD/M3)
Source: Organisa tion for Economic Co-opera tion and Deve lopment (OECD). (2010). Pricing Wa ter Resources and Wa ter and Sanita tion Services. OECD Environment Directora te , ENV/ EPOC/GSP(2009)17/ FINAL, 18 January 2010 .
WHAT DO WE ACTUALLY SPEND?
As part of its 2010 study, the OECD assessed the share of net disposable income that households in dif ferent countries spend on water and wastewater services. For Canada , the fi gure is 0.3%, among the lowest of the 20 responding countries in the study (tied with Japan and Ita ly and ahead of South Korea).
Similarly, according to Environment Canada, the median expenditure per household for water services in 2004 was $37.93 per month for 25 cubic metres and $50.46 per month for 35 cubic metres. Compare this to the 2005 median expenditure per household per month for basic utility costs of water, fuel and electricity for principal accommodation, which was $192.30—rep-resenting 3.2% of total household expenditures. In other words, water bills account for about 20–26% of our already low basic utility costs.x
3.5
3.0
2.5
2.0
1.5
1.0
0.5
0.0
CAN
KOR
NZL ITA
ESP
POL
GRC AU
T
LUX
HU
N
AUS
CHE
PRT
CZE
BEL-
Fla.
FIN
GBR
-E&W FR
A
ND
L
BEL-
Wal
l.
BEL-
Brus
.
DEU
GBR
-SCO
WATER WASTEWATER
USD
/M3
09Worth Every Penny: A Primer08
Worth Every Penny: A Primer Water Susta inability Project10
• equity and fairness: those who waste water and place excess demand on the system pay about the same as those who conserve; and
• under-pricing stifl es innovation: consumers have little fi nancial incentive to invest their scarce dollars in water effi cient goods and services be-cause it takes so long to recover their investment. As a result, scientists, inventors, engineers and investors also have little incentive to improve water using technologies.
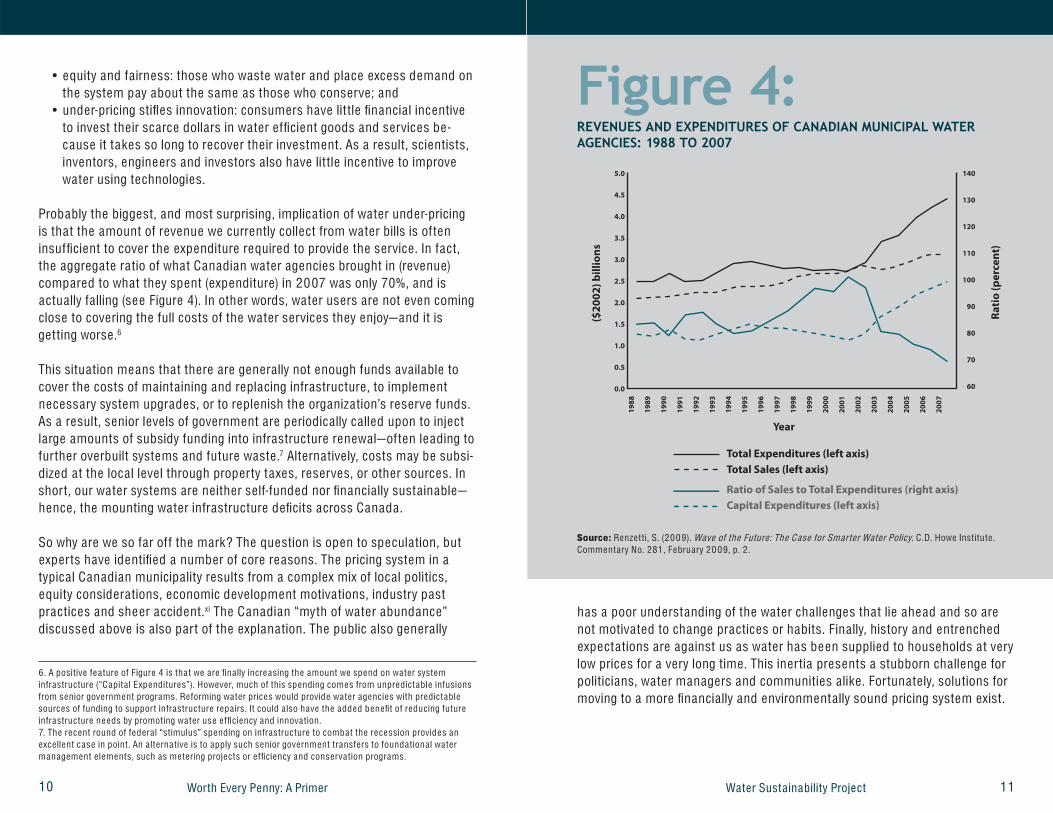
Probably the biggest, and most surprising, implication of water under-pricing is that the amount of revenue we currently collect from water bills is of ten insuffi cient to cover the expenditure required to provide the service. In fact, the aggregate ratio of what Canadian water agencies brought in (revenue) compared to what they spent (expenditure) in 2007 was only 70%, and is actually falling (see Figure 4). In other words, water users are not even coming close to covering the full costs of the water services they enjoy—and it is getting worse.6
This situation means that there are generally not enough funds available to cover the costs of maintaining and replacing infrastructure, to implement necessary system upgrades, or to replenish the organization’s reserve funds. As a result, senior levels of government are periodically called upon to inject large amounts of subsidy funding into infrastructure renewal—of ten leading to further overbuilt systems and future waste.7 Alternatively, costs may be subsi-dized at the local level through property taxes, reserves, or other sources. In short, our water systems are neither self-funded nor fi nancially sustainable—hence, the mounting water infrastructure defi cits across Canada.
So why are we so far of f the mark? The question is open to speculation, but experts have identifi ed a number of core reasons. The pricing system in a typical Canadian municipality results from a complex mix of local politics, equity considerations, economic development motivations, industry past practices and sheer accident.xi The Canadian “myth of water abundance” discussed above is also part of the explanation. The public also generally
11
has a poor understanding of the water challenges that lie ahead and so are not motivated to change practices or habits. Finally, history and entrenched expectations are against us as water has been supplied to households at very low prices for a very long time. This inertia presents a stubborn challenge for politicians, water managers and communities alike. Fortunately, solutions for moving to a more fi nancially and environmentally sound pricing system exist.
Figure 4: REVENUES AND EXPENDITURES OF CANADIAN MUNICIPAL WATER AGENCIES: 1988 TO 2007
Source: Renze t ti, S. (2009). Wave of the Future: The Case for Smarter Water Policy. C.D. Howe Institute . Commentary No. 281 , February 2009, p. 2 .
6 . A positive fea ture of F igure 4 is tha t we are fi na lly increasing the amount we spend on wa ter system infrastructure (“Capita l Expenditures”). However, much of this spending comes from unpredictable infusions from senior government programs. Reforming wa ter prices would provide wa ter agencies with predictable sources of funding to support infrastructure repa irs. It could a lso have the added benefi t of reducing future infrastructure needs by promoting wa ter use effi ciency and innova tion.7. The recent round of federa l “stimulus” spending on infrastructure to comba t the recession provides an exce llent case in point . An a lterna tive is to apply such senior government transfers to founda tiona l wa ter management e lements, such as me tering projects or effi ciency and conserva tion programs.
5.0
4.5
4.0
3.5
3.0
2.5
2.0
1.5
1.0
0.5
0.0
140
130
120
110
100
90
80
70
60
($20
02) b
illio
ns
Ratio
(per
cent
)
1988
1989
1990
1991
1992
1993
1994
1995
1996
1997
1998
1999
2000
2001
2002
2003
2004
2005
2006
2007
Total Expenditures (left axis)Total Sales (left axis)
Ratio of Sales to Total Expenditures (right axis)Capital Expenditures (left axis)
Year

Worth Every Penny: A Primer Water Susta inability Project14 13
SECTION III: SETTING UP A CONSERVATION-ORIENTEDPRICING SYSTEM
At the most basic level, conservation-oriented pricing is based on the economic premise that if price goes up, the quantity demanded will go down. The more the cost of water increases, the more consumption will drop.
This price relationship is, of course, more complicated. When establishing a new pricing regime, a water service provider and its governing body needs to carefully consider the actual sensitivity of water demand to price, which means considering the price elasticity of demand (see Tech Box 3). However, in general, this basic principle does hold up, and we can expect consumption to drop over time as price increases and people gradually change their fi xtures, appliances and behaviour. It then becomes a subtle question of the extent or rate of change relative to the amount of the price increase.
With these concepts in mind, two main tasks need to be undertaken:
1 . determine how much revenue is needed in order to cover the full costs of operating, both now and in the future; and
2. select from a number of different pricing approaches and billing structures to determine how you are going to set the rate in order to fully recover the costs.
HOW MUCH REVENUE DO YOU NEED TO COLLECT?The key to ef fectively establishing conservation-oriented pricing is having a full cost accounting system in place. As the name suggests, this means all the costs that an agency incurs, including its capital costs, are recorded and then refl ected in the price.xiii Full cost accounting includes a range of items, such as operations and maintenance, administration, overhead, reserves, costs of
TECH BOX 3: THE PRICE ELASTICITY OF DEMAND FOR WATER
In basic economic theory, the key principle to explain why conservation-oriented pricing works is price elasticity of demand. In simple terms, people respond differently to changes in price for different goods and services. Some goods and services are very inelastic, meaning that people’s consumption does not change much when the price goes up, so the seller’s revenue will likely increase. Inelastic goods are typically ones that have few substitutes or where having them is a necessity. For example, the price of insulin is very inelastic for people who need to use it every day.
As it turns out, water is indeed generally an inelastic good, but less so than you might think.8 This is not surprising considering that many uses are not really “essential” (like car washing or lawn watering). Economists have conducted many studies into this issue over the last 30 years. Many home technologies and simple behaviour changes can reduce consumption without signifi cant diffi culty or cost. Furthermore, the available evidence suggests that the higher prices get, the higher water’s price elasticity becomes. Thus, as water service prices rise, we can expect households to increasingly (by proportion) reduce their demand for water.An important but subtle point is that household demand for water responds more to higher prices in the long run than in the short run. Changing consumer behaviour and retrofi tting appliances takes time. So, it might take a while for a conservation-oriented rate structure to impact demand. Not surprisingly, studies also show that outdoor water use is much more sensitive (elastic) to price changes than indoor water use. Finally, the research indicates that industrial and commercial fi rms also respond to changes in price in much the same way that households do—by changing practices and replacing technologies.
It should be noted that studies often fi nd widely different price elasticities depending on the context. Factors such as location, season, and the presence of other demand management programs all affect the responsiveness of price to demand.xii This can have a major impact on the results of any price modifi cations, so analysis of the predicted price elasticity in your area should be undertaken and carefully considered. Any effort to increase price requires anticipation of households’ (and other water users’) responses to the proposed rate changes in order to accurately predict the impacts on the water supply system and revenues.
8. Espey et al. (1997) reviewed 162 estimates of the price elasticity of water that were made between 1963 and 1993. They found an average price elasticity of -0.51. This is a measure of the expected change in demand when price increases by 1. Similarly, Dalhuisen et al. (2003) analyzed 300 studies conducted over the past 20 years and found an average price elasticity of -0.41.Sources: Espey, M., J. Espey and W.D. Shaw. (1997). Price Elasticity of Residential Demand for Water: A Meta-analysis. Water Resource Research, 33(6), pp. 1369-1374, and Dalhuisen, J. M., R.J.G.M. Florax, H.L.F. de Groot and P. Nijkamp. (2003). Price and Income Elasticities of Residential Water Demand: A Meta-analysis. Land Economics, 79 (2), pp. 292-308.
12

Worth Every Penny: A Primer Water Susta inability Project14 17
complying with regulations, fi nancial costs (depreciation, debt servicing, etc.) and capital costs.9
Beyond these obvious items, full cost accounting should also cover “sof t costs”, including environmental externalities. These include, for example, the cost of environmental management and source water protection. An agency might also want to set aside funds for projects to mitigate impacts on the environment from operations —for example, greenhouse gas abatement projects or restoration work to compensate for impacts on aquatic ecosystems from wastewater disposal.10
By having a full cost accounting system in place, the water service provider can accurately report all of its costs of operating. With this information in hand, costs passed on to customers through water bills can be explained. Without this, it can be diffi cult to justify the sometimes signifi cant per unit rate increases to customers and elected offi cials.
Various utilities both in Canada and other countries have a long track record of full cost accounting; much can be learned from them. Seattle Public Utilities in Washington State, explored in Case Study 2, bases its retail prices on “cost of service studies”, which are completed every two years. Charges applied are designed to achieve fi nancial targets set out in these studies.
Many Canadian utilities are also making great strides in improving asset management systems. When tied to full cost accounting methods, this provides the information and planning foundation for creating infrastructure replacement funds.
HOW DO YOU SET THE RATE?Once you know your costs, you need to set your rate, which is both a technical and political exercise. Some of the many issues that must be considered include:
• revenue needs;
9. Historically, utilities have used other accounting methods that did not always fully account for all the costs of operating. These older methods do not always account for the costs of depreciating assets such as aging pipes, which partly explains why most Canadian water service providers do not fully recover the ir costs. Analysts sometime refer to this as an “infrastructure defi cit”—the dif ference between the funding needed for mainte-nance, repair, rehabilitation, retrofi tting and replacement of existing deteriorated infrastructure and the funding available from all sources, including taxes, government subsidies, grants and private sector contributions. 10. Although not always easy to calculate, these environmental considerations and the ecological goods and services that fl ow from our watersheds and aquifers are critical to the long-term fi nancial and ecological sustainability of the operation and are increasingly be ing taken into account in planning and decision making.
Case Study 2: SEATTLE PUBLIC UTILITIES, WASHINGTON
Seattle Public Utilities (SPU) provides water services to 1.4 million people, mostly in King County, Washington. Seattle is known for having plenty of water in the winter, but there is far less precipitation during the summer when demand is highest. Residents
depend on water stored in mountain reservoirs to meet demand and to provide enough water to release into rivers to maintain watershed function and populations of fi sh and other aquatic species.
SPU has a long history with conservation-oriented pricing, having fi rst introduced volumetric charging decades ago. In 1989, they were among the fi rst in North America to introduce a seasonal surcharge, wherein all customers pay more for water in the summer when demand is at its highest and availability is lowest. A drought surcharge was also added to bills for the fi rst time in 1992, and included a strong rate penalty for excessive water use. SPU has also had volumetric wastewater charges for over 20 years. This charge is calculated on a household by household basis based on the amount of water each household uses in the winter months, when most water is discharged to the sewer system.
In 2001, SPU permanently introduced increasing block rate tiers for single-family residential customers. Three rate tiers are used. Tier three kicks in when a customer exceeds a water use of approximately 51 cubic metres. Around 10% of single-family residential customers fall into this category during the summer, and as a result face a much higher charge for that portion of their water demand. In 2010, the potable water charge at the third tier will be about US$4.04 per cubic metre. Of particular interest is that retail charges are based on “cost of service studies”, which are completed every two years. Charges are set to achieve full cost recovery while components of the rate structures are also based on marginal costs. In any given year, rates and fees charged must be suffi cient to pay the total costs of the water system and meet adopted fi nancial targets. SPU refers to this as the “water system revenue requirement”, defi ned as the minimum amount of operating revenue required to fund the water system operating budget and meet fi nancial policy targets. This includes targets for net income, cash balances, fi nancing of the capital improvement program, revenue stabilization fund balances and debt service coverage.
Since introducing peak usage charges and other demand management measures, SPU has seen signifi cant and sustained reductions in their customers’ water use. While water rates have continued to increase, the average customer bill has not increased as quickly because the average customer is using less water than in the past.
For more information, see:
• www.seattle.gov/util /Services/Billing /Rates_Summary/SPU_001469.asp• www.seattle.gov/util /Services/Water/Rates/ THIRDTIER_200312020910308 .asp
15

Worth Every Penny: A Primer Water Susta inability Project
TECH BOX 4: MARGINAL COST VS. AVERAGE COST PRICING
Economic literature generally recognizes long-term margina l cost pricing as the best pricing option for water utilities—at least in theory. Margina l cost essentially means the cost of producing one more unit of a good—for example, one more cubic metre of water. Margina l cost pricing therefore involves linking the volumetric component of a water bill to not only historic costs but environmental and future costs, such as costs of system ma intenance and regulatory requirements.
Economists prefer margina l cost pricing because it tells consumers about the costs they are creating today, rather than just historic costs. This is especia lly preferable in situations where agencies’ costs are rising. Margina l cost pricing a lso refl ects the way that total costs rise with each user’s consumption. In other words, it sends the right signa l to consumers: if you use more water, here’s what it will cost the agency and the community to supply it.
Margina l cost pricing is used in other regulated utilities, such as telecommunica-tions, natural gas and electricity. It is a lso used in the water services sector in a few countries, but is not generally be ing used in Canada . Many reasons for this exist, but it is partly because determining margina l cost is complex, depending on weather, distance, how total use compares to system capacity, and many other factors. The existing empirical evidence, though limited, a lso indicates that the gap between our current water price and long-term margina l costs is signifi cant.xiv It may not be practical or rea listic to switch over without a signifi cant transition period.
Most Canadian utilities use some form of average cost pricing, which involves setting prices so that average costs are just covered, a llowing the producer to break even— usually as per a requirement of senior government. A number of variations are used, but in general, these approaches limit the water service provider to recover its costs on a full cost accounting basis. These models of ten do not a llow a water service provider to accumulate reserves to meet future expansion or technology needs. These are a lways based on historic (or “sunk”) costs, and so prevent achieving true economic effi ciency.
16 17
• likely impact of the price change on the community; • how to communicate the change to residents;• strengths and weaknesses of the price structure that is currently in place; • impacts on the organization’s existing business systems;• “buy in” and coordination of fi nance, human resources, IT, marketing and
other parts of a water agency and across the whole municipal administra-tion; and
• some pricing model changes may require regulatory approval from senior levels of government.
From a technical point of view, two key considerations need to be addressed. First, an economic methodology for setting the price should be developed. The technical theory in this area becomes fairly dense, and a number of dif ferent approaches can be employed, as outlined in Tech Box 4 .
Whichever approach to price setting is selected, the fi rst objective of the organization should be to fully recover all its costs without relying on grants or general tax revenue, consistent with the concept of full cost accounting discussed above. Ideally, the price structure adopted will also be forward looking, meaning that it will include not just costs for things that happened in the past but will also seek to capture future costs, such as possible system expansion, future upgrades and infrastructure renewal. Ideally, the pricing approach should also inform individuals about the fi nancial and environ-mental impacts of their decisions. In other words, the rate should allocate costs to customers in such a way that they are well informed about the full costs of the services they receive and want to receive into the future.
Second, a rate structure, or a way to compute and communicate the customer’s bill must be established. As Tech Box 5 demonstrates, a number of dif ferent rate structures exist, each with its own advantages and disadvantages.
COMPONENTS OF A RATE STRUCTUREIn general, a conservation-oriented structure will of ten have two components. First, there is a fi xed charge (sometimes called a connection fee or meter fee), which is the portion of the bill that does not change when consumption increases. Second, there is a volumetric charge that goes up as one uses more water.

Worth Every Penny: A Primer Water Susta inability Project18
For the volumetric component, customers pay relative to use. Two types of rates are most common:
• a uniform rate (sometimes called a constant unit charge or single block rate): the per unit price does not change no matter how much you consume; and
• inclining block rates: the price per unit in-creases in incremental steps as consumption increases.
A third type of volume tric structure is the dec lining block , where the per unit price decreases as consumpt ion increases. Dec lining block ra tes are typica lly of fered only to very high volume users, such as industria l or inst itut iona l customers, but are st ill of fered to resident ia l customers in some places. Use of this structure is based on an oversimplifi ed argument tha t when quant ity purchased goes up, price should go down—the “volume discount” idea—which is usua lly suppor ted by the argument tha t the fi xed cost por t ion has a lready been pa id and the higher consumpt ion fees should be based on margina l opera t ions costs only. This approach has very obvious drawbacks in terms of encouraging wa ter use e f fi c iency.11 F igure 5 graphica lly compares the dif ferent k inds of ra te structures.
There are pros and cons to uniform and inclining block systems, and both have their proponents (see Tech Box 6). Regardless of what approach
2118
SENIOR GOVERNMENTS’ CRUCIAL ROLE
Senior governments play an important role in facilitating or inhibiting positive change. For example, Ontario has made efforts to bring in legislation that requires water and wastewater agencies to revise their accounting practices to record all costs and refl ect them in their prices—see Ontario’s yet-to-be-pro-claimed Sustainable Water and Sewage Systems Act and the Financial Plans Regulation under the Safe Drinking Water Act. Alberta Environment has also developed a full cost accounting program to promote better fi scal planning for municipal waterworks systems, although on a voluntary basis. Other jurisdictions are slowly following suit. Many resources are now available to help with moving to this accounting method.
Existing senior government legislation a lso may create signifi cant barriers to change by limiting which fi nancial structures are a llowed. This can constra in progressive municipal governments and water managers from imple-menting full cost pricing.
TYPE DESCRIPTION COMMENT
F la t Ra te Fee is independent of actua l water use The least ef fective pricing structure for reducing demand; most common in utilities tha t are unme tered
One Part Ra te Includes a volume tric charge only Less common a t the re ta il leve l but of ten found a t the wholesa le leve l
Two Part Ra te Includes both a fi xed and a variable rate Recommended as best practice by the Canadian Wa ter and Wastewa ter Associa tion
Components of a Two Part Rate
F ixed Charge The portion of the bill tha t does not vary by volume of wa ter consumed (though it may increase with increase in me ter size)
Provides increased revenue stability; some loca l governments use parce l taxes in a way similar to fi xed charges
Variable Charge The portion of the bill tha t increases with the amount of wa ter consumed
The most ef fective ra te structure for reducing demand; requires full me tering
Variable Charge Formats
Uniform Ra te Constant Unit Charge Single B lock Ra te
Price per unit is constant as consumption increases
Targe ts a ll users equa lly; simple to ca lcula te bill
Inclining B lock Ra tes Price increases in steps as consumption increases
Targe ts high volume users; requires more complex ca lcula ting for billing
Declining B lock Ra tes Price decreases in steps as consumption increases
Charges low volume users the highest ra te; typica lly used where utilities want to provide large industry with a lower cost of service
Excess Use Ra te Price is signifi cantly higher for any consumption above an established threshold
Can be used to target high consumption during peak periods; more ef fective with frequent (e.g., bi-monthly) meter reading
Seasona l Surcharges Price is higher during peak periods (i.e ., summer)
Targe ts seasona l peak demand; tied to the higher margina l costs of wa ter experienced during peak periods
Distance Ra tes Loca tion-based Ra tesSpa tia l Ra tesZona l Ra tes
Users pay for the actua l cost of supplying wa ter to the ir connection
Discourages dif fi cult-to-serve , spa tia lly dif fused connect ions
Scarcity Ra tes Price per unit increases as ava ilable wa ter supply decreases (e .g., during drought)
Sends strong price signal during periods of low water availability; an alternative to outdoor watering restrictions
Life line B lock A fi rst block of wa ter is provided a t low or no cost beyond the fi xed charge in order to ensure everyone has a minimum amount of wa ter to mee t basic wa ter needs
Used to address equity issues and ensure tha t a ll consumers’ basic wa ter needs are me t
Source: Based on Wang, Y.-D., W.J. Smith, Jr. and J. Byrne . (2005). Water Conservation-Oriented Rates: Strategies to Extend Supply, Promote Equity and Meet Minimum F low Leve ls. Denver, CO., American Wa ter Works Associa tion, p. 7, and Federa tion of Canadian Municipa lities and the Na tiona l Research Council. (2006). Water and Sewer Rates: Full Cost Recovery. In InfraGuide: Na tiona l Guide to Susta inable Municipa l Infrastructure . March 2006 .
TECH BOX 5: TYPES OF RATES
19
11 . The declining block approach also ignores factors such as timing of use. Perhaps price could go down when time of de livery is not an issue, but when it all has to be supplied at once (for example, on hot summer days), price should go up because cost of de livery goes up. For these reasons and others, use of declining block structures has declined steadily in Canada for the past 20 years, from covering 24 .0% of residential ratepayers in 1991 to only 7.9% in 2004 (see Endnote v).

Worth Every Penny: A Primer Water Susta inability Project20 23
Figure 5: TYPES OF WATER RATES ILLUSTRATED
Source: Based on Wang, Y.-D., W.J. Smith, Jr. and J. Byrne . (2005). Water Conservation-Oriented Rates: Strategies to Extend Supply, Promote Equity and Meet Minimum F low Leve ls. Denver, CO., American Wa ter Works Associa tion, p. 7.
Inclining Block Rates
Uniform Rate
Declining Block Rates
Flat Rate
Quantity
Price
TECH BOX 6:THE GREAT RATE DEBATE: UNIFORM VS. INCLINING BLOCK
Which is the better approach: uniform or inclining block rates? Academics and practitioners continue to debate this question. Each approach has its supporters. From a conceptual point of view, the challenge really comes down to the need to balance equity among users with the relative ease of administration for the organization— including real practical challenges faced in the billing process and fi nancial administration. Those who favour the inclining block approach argue that it can be more effective in addressing equity objectives. They point out that this approach targets those who are using above average amounts of water, which is likely to include a lot of discretionary use. They also argue that an inclining block approach will be more effective in reducing peak demand, again because it goes after high volume users (often people watering gardens) more aggressively.
Those who favour uniform rates argue that introducing differing rates for different volumes is ineffi cient because it creates artifi cial differences in price (referred to as price distor-tions). That is, it moves us away from the goal of effectively linking the price of water to the marginal cost of supplying it. They also argue that, in practice, when utilities use inclining blocks, the highest blocks tend to affect only those using extremely large volumes of water; most users pay only a low basic per unit amount for all or most of their consumption. Thus, in practice, these systems do not always work very effectively in creating an incentive for most people to conserve. They also contend that inclining block systems are unfair because they discriminate against households with larger numbers of people. They argue instead that there are other ways to more effectively address equity concerns. Finally, they point out that a uniform rate system is much simpler for residents and businesses to understand and react to, provided that the basic per unit price is suffi ciently high to affect decision making.
A compromise solution that captures many of the best elements of both approaches is to have a very simple inclining block system with two or at most three tiers. The lowest tier would be based on a lifeline block equal to roughly the amount of water required to meet a typical family’s basic needs.12 Alternatively, the lifeline amount could be included at no additional cost as part of the fi xed portion of the bill. The next tier of pricing would be a signifi cantly elevated charge that is suffi ciently high to affect general decision making. Finally, a third tier could be added which includes a very high charge for those who continue to consume excessive amounts.
21
12 . Some go further and argue tha t if you have a life line ra te or low price initia l block , the price per unit for the next block should not be margina l but should be pa id on every thing consumed, including the life line amount . Otherwise , the subsidy goes to everyone , not just to the poorest or the lowest consuming part of the public. This does, however, crea te some billing and communica tion cha llenges (See Endnote v).
is employed, the most important considerations are whether the price set accurately informs consumers about the costs of their water use and whether it provides a signal that is suffi cient to affect their decisions (i.e., is the price high enough?).

Worth Every Penny: A Primer Water Susta inability Project22
Doesn’t Increasing Volumetric Price Mean Unstable Revenue for the Water Service Provider?
One of the biggest challenges in moving to a conservation-oriented pricing system stems from the fact that most of the costs that a water service provider faces are fi xed: items including payroll, debt payments, and plant costs. In fact, fi xed costs can account for 75–80% of spending, and sometimes even more.
When an organization increases its reliance on volumetric pricing, revenue will inevitably fl uctuate. Customers will use more water when it is hot and dry, less when it is raining, and much less if they are faced with watering restrictions during a drought.
Some water managers and elected offi cials believe that increasing per unit costs will create the so-called “pricing death spiral”, which goes something like this: the price increases, demand drops, revenue drops correspondingly, the agency is faced with a budget shortfall and must raise prices again, the cycle repeats.
Fortunately, there are options to avoid this vicious cycle, avoid budget shortfalls and alleviate the impacts of revenue variability.
SECTION IV:ADDRESSING THE CHALLENGES TOCONSERVATION-ORIENTED PRICING
FIXED VS. VARIABLE COSTS
F ixed costs are expenses that do not change or cannot be changed with a change in short-term production or sales. An example from the water industry is that a water service provider must make its debt payments in any given month, regardless of how much water is used by customers.
Variable costs are expenses that do change with a change in production or sales. For example chemica ls and energy required for treatment—which changes with the volume of water used.
23
Worth Every Penny: A Primer Water Susta inability Project
First and foremost, careful planning goes a long way. The organization needs to ensure that it carefully and conservatively forecasts the impact that price change and other water use effi ciency measures and trends will have on future consumption. It should then set its rates accordingly at a level that will allow it to fully recover costs.
As discussed above, volumes of academic research exist on the price elasticity of water. There is also plenty of experience with conservation-ori-ented pricing from around the world to draw upon. This, combined with local information, can be used to model predicted future water demand with suffi -cient accuracy, taking into account the impacts of pricing model changes and other demand management measures. All else being equal, the per unit price can then be set at the right amount needed to ensure that the water service provider can meet its budget requirements over the long term.
The water service provider can also use various pricing mechanisms to mitigate the impacts of revenue variability. For example, rolling average price can be set for a number of years. This will be designed to conservatively account for projected short-term fl uctuations in water demand. This way, in some years there will be excess revenue that can be channelled into a reserve fund that can be tapped during lower demand years when there may be a shortfall in revenue.13 Similarly, as noted above, most conservation-oriented rate struc-tures will use a two-part system that includes both a fi xed and variable compo-nent.14 By including a fi xed component, the worst impacts of revenue variability can at least be blunted. The fi xed component can provide a signifi cant degree of revenue certainty. Other options include support by senior governments to create revenue stabilization funding mechanisms for unexpected or severe revenue impacts (as is sometimes done in the energy sector).xv
Doesn’t Conservation-Oriented Pricing Burden Low Income Families?Some fear that a move to conservation-oriented pricing will hurt low income families who spend a disproportionate amount of their income on water. This is a particular concern for larger families who must use more water for basic needs like bathing.
25
This is an extremely important consideration. However we also have to question whether the best way to address this is to have a system that under-prices water for everyone and leads to waste and environmental impacts, especially when there are other, more effi cient options available to help those in need.
As discussed in Tech Box 6 , one of the best options to address equity issues is to of fer a lifeline block. This is a volume of water that is roughly equal to the amount a typical family requires to meet basic needs. It is provided at a low per unit cost on the fi rst tier of an inclining block system. Alternatively, it can be included at no extra cost as part of the fi xed charge on the water bill.
Another good option is to provide giveaways or generous rebates to low income families for high effi ciency toilets or other water saving technologies. Where a water service provider already has a rebate program in place, it can be redirected to more effectively target disadvantaged groups. For example, eligibility can be based on income, as is done with many other social programs. These options are best combined with non-fi nancial tools, including education programs.
It is also worth noting that, depending on the extent of the rate increase, low income families who use less water than the average may actually experience a decrease in their water bills. This is simply because they may choose to use less water for discretionary activities, such as outdoor use. In any case, like all families, they will be given more control over their costs of water.
Other jurisdictions around the world have implemented pricing reforms quite ef fectively without causing undue hardship in the community. For example, the San Antonio Water System in Texas, a continental leader in water demand management, began improving their pricing system many years ago. Over time, they have introduced a whole range of measures to help low income people (see Case Study 3).
In 2010, the OECD compared the proportion of income that the poorest 10% of the population spend on water and sanitation bills across 20 member and non-member countries. The study found that the poorest 10% of Canadian house-holds spend 1 .2% of net disposable income on these services. Of the countries surveyed, only South Korea was lower at 1 .0%.xvi
13 . In utilities tha t are regula ted to a “zero profi t” objective , some regula tory reform may be required to enable this k ind of system.14 . This is the approach recommended by the Canadian Wa ter and Wastewa ter Associa tion (1992), but it should be recognized tha t many utilities have successfully moved forward with pricing reform by using a “100% volume tric” billing system tha t has no fi xed fee component , so both me thods are certa inly possible .
24

Worth Every Penny: A Primer Water Susta inability Project26
Case Study 3:SAN ANTONIO WATER SYSTEM, TEXAS
The San Antonio Water System in Texas was an early leader in conservation-ori-ented pricing and has continued to innovate in the area over several decades.
San Antonio’s bill calculation is fairly complex from the residents’ point of view, but it has a number of interesting features. The organization employs an inclining block system that includes a sma ll fi xed monthly service charge. For the volumetric charge, customers pay a basic rate for every 100 gallons used until consumption exceeds 5236 gallons (9.7 cubic metres) per month. Af ter that, the rate increases considerably over four dif ferent blocks. Customers also face a sewer charge component, with volumetric charging kicking in af ter 1496 gallons (5 .66 cubic metres) per month.
San Antonio also provides a good example of how a seasonal surcharge can be used success-fully. For their second, third and fourth price blocks, the cost per unit goes up during the period between July 1 and October 31 each year. This means customers will face signifi cantly higher bills if their consumption jumps up during the summer due to discretionary outdoor water use.
Probably one of the most interesting facets of San Antonio Water System’s approach is their af fordability programs:
• They offer an affordability discount to low income residential customers who meet income eligibility requirements. The amount of discount received is based on tests that include household size, household income and type of service provided.
• In 1994 , they initiated the “Plumbers to People” program to provide plumbing assistance to low income residential customers. The types of problems that can be repaired include leaking faucets and toilets or broken pipes—problems that cause consumption —and water bills—to go up.
• In 2000, they established “Project Agua” to provide further assistance to customers who are having diffi culty making water bill payments. Available funds are used to help low income residential ratepayers who are elderly, disabled, or have young children.
• In 2007, they launched the “K ick the Can” toilet giveaway, which of fers eligible customers up to two high effi ciency toilets per household, absolutely free. Through this program, 30,000 toilets were insta lled in homes in 2007 a lone. Of particular interest is that this work is funded through conservation-oriented pric-ing. A percentage of the revenue generated from the highest tier in the inclining block system goes into a fund that supports the program.
For more information, see www.saws.org /service /rates/
27
What about the Impacts on the Water Service Provider’s Business Systems?Changes to price structures will almost certainly have some impacts on existing business systems. This might include accounting, billing, asset management and demand forecasting systems, to name a few. Both business processes and computer-based information technology might be af fected. As discussed further below, attention to billing systems is particularly important.
How signifi cant the impacts will be varies depending on the organization’s current situation. For example, a water service provider that is not universally metered and has fl at rate pricing may face more challenges than one that already uses volumetric pricing.
Fortunately, most of the impacts on business systems are reasonably predictable and can be resolved with “of f-the-shelf” technologies and practices. But again, careful planning is called for. We provide some further advice in the next section about how to smoothly make the transition.
Does Volumetric Pricing Lead to Privatization?No evidence exists to support the claim that moving to conservation-oriented pricing leads to privatization of water resources. Indeed, a more compelling argument is that moving to full cost pricing strengthens rather than weakens public systems. Critics of water infrastructure privatization can actually be valuable supporters of price reform, but support requires that:
1 . water must continue to be considered a common good owned by the Crown on behalf of the people, not a private good that can be bought and sold for profi t;
2. fees for providing water services must be collected by a not-for-profi t, publicly-owned, democratically accountable agency;
3 . fees collected should be put back into infrastructure, source water protection, demand management programs, etc. and not into corporate profi ts; and
4 . pricing systems must ensure that no one is denied water because of in-ability to pay.xvii
Indeed, places that have moved to conservation-oriented pricing of ten have strong support from citizens groups and social advocates. To build this kind of support, careful consultation and communication with key stakeholder groups
Worth Every Penny: A Primer

Worth Every Penny: A Primer Water Susta inability Project
at the outset is strongly recommended to ensure that the objectives of pricing reform are fully understood by all.
I’m Sold on the Idea of Conservation-Oriented Pricing, but How Do I Convince Others?Many politicians and senior managers worry, with very good reason, that they will be criticized by the community for trying to change water prices because there may be winners and losers.
When water rates go up, some residents will be angered and understandably feel frustrated. Some will view it as nothing more than a “tax grab.” Others may feel that their past ef forts to save water are being “punished” by the price increase. They might argue that water use effi ciency results in lower revenue for the water service provider, which will then simply raise rates to make up the shortfall.
The problem is exacerbated by the fact that Canadians have enjoyed artifi -cially under-priced water for decades—a kind of ecological and infrastructure subsidy resulting from historic policies governing the pricing of municipal services. As a result, unintentionally wasteful practices based on the use of widely available water consuming devices and appliances and socio-cultural practices (like lush green lawns) are quite fi rmly established in many house-holds and have become the norm.
Treatment costs, pumping costs, labour costs, construction costs, etc., will almost certainly continue to go up over time. Inevitably, water bills will also have to rise, whether calculated on a fl at or volume-based rate. With conservation-oriented pricing, the benefi t to the consumer is that they get to exercise some control over the amount of the increase by modifying their consumption habits.
Tackling this problem takes courage, leadership, a long-term view and support from others. There is no substitute for building support through an ef fective consultation and public education campaign. No reforms, no matter how benefi cial, will be well received unless they are clearly understood.
It may be helpful to continually remind residents about the environmental benefi ts of reducing water use so that they do not feel they are being asked to conserve for the sake of conservation itself. You might remind them that
28 29
saving water will result in reduced greenhouse gas emissions because, for example, less water has to be pumped around systems and heated in homes. Environmental water quality may also improve because less sewage is produced, meaning that less treated water needs to be discharged. You can also take the opportunity to underscore the importance of healthy water-sheds in terms of ecological goods and services that we all depend on. This can help the public understand the broader non-commodity values of water. Finally, by using less water, we will generally be more resilient to uncertainty and the impacts climate change will have on water supplies.
Another helpful approach is to highlight successes already happening around North America. The City of Guelph, Ontario, for example, has been able to justify signifi cant pricing reform in recent years. When combined with their compre-hensive approach to demand management planning and delivery, Guelph has become a Canadian leader in this fi eld (see Case Study 4).
Worth Every Penny: A Primer Water Susta inability Project30
Case Study 4:CITY OF GUELPH, ONTARIO
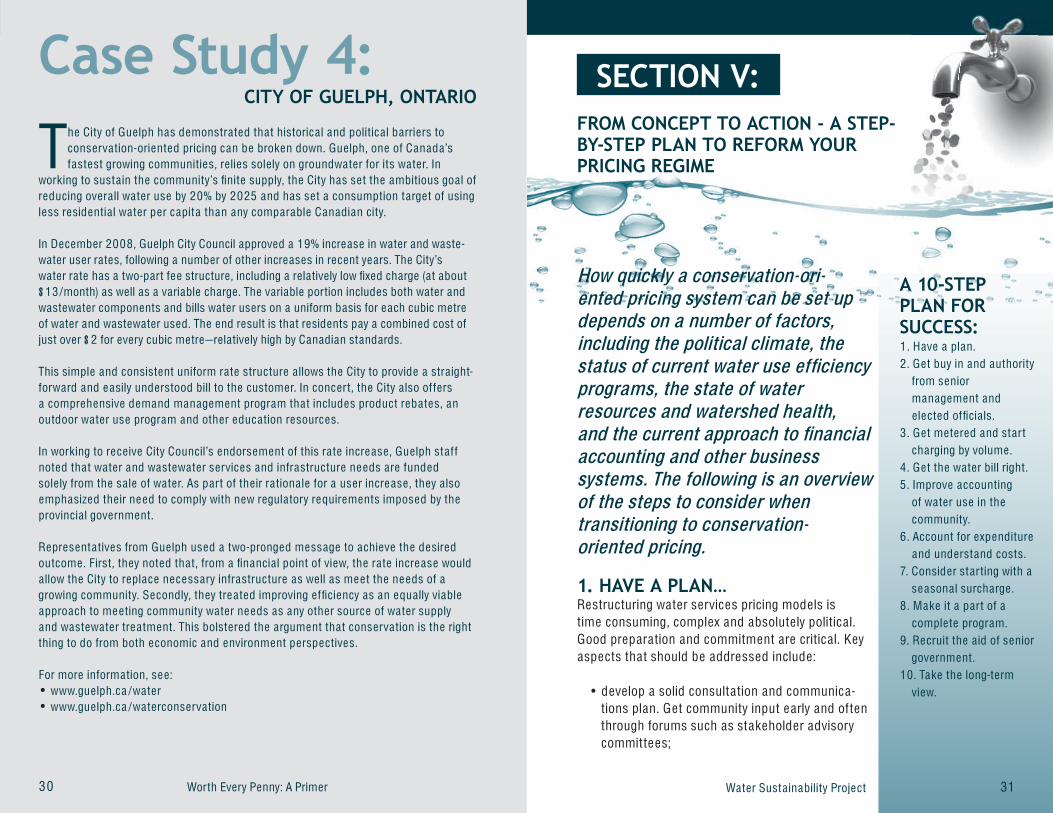
The City of Guelph has demonstrated that historica l and political barriers to conservation-oriented pricing can be broken down. Gue lph, one of Canada’s fastest growing communities, relies solely on groundwater for its water. In
working to susta in the community’s fi nite supply, the City has set the ambitious goa l of reducing overa ll water use by 20% by 2025 and has set a consumption target of using less residential water per capita than any comparable Canadian city.
In December 2008 , Guelph City Council approved a 19% increase in water and waste-water user rates, following a number of other increases in recent years. The City’s water rate has a two-part fee structure, including a relatively low fi xed charge (at about $13/month) as well as a variable charge. The variable portion includes both water and wastewater components and bills water users on a uniform basis for each cubic metre of water and wastewater used. The end result is that residents pay a combined cost of just over $2 for every cubic metre—relatively high by Canadian standards.
This simple and consistent uniform rate structure a llows the City to provide a straight-forward and easily understood bill to the customer. In concert, the City a lso of fers a comprehensive demand management program that includes product rebates, an outdoor water use program and other education resources.
In working to rece ive City Council’s endorsement of this rate increase, Guelph staf f noted that water and wastewater services and infrastructure needs are funded sole ly from the sale of water. As part of their rationa le for a user increase, they a lso emphasized their need to comply with new regulatory requirements imposed by the provincial government.
Representatives from Guelph used a two-pronged message to achieve the desired outcome. First, they noted that, from a fi nancial point of view, the rate increase would a llow the City to replace necessary infrastructure as well as meet the needs of a growing community. Secondly, they treated improving effi ciency as an equally viable approach to meeting community water needs as any other source of water supply and wastewater treatment. This bolstered the argument that conservation is the right thing to do from both economic and environment perspectives.
For more information, see:• www.gue lph.ca /water• www.gue lph.ca /waterconservation
How quickly a conservation-ori-ented pricing system can be set up depends on a number of factors, including the political climate, the status of current water use effi ciency programs, the state of water resources and watershed health, and the current approach to fi nancial accounting and other business systems. The following is an overview of the steps to consider when transitioning to conservation-oriented pricing.
1. HAVE A PLAN…Restructuring water services pricing models is time consuming, complex and absolutely political. Good preparation and commitment are critical. Key aspects that should be addressed include:
• develop a solid consultation and communica-tions plan. Get community input early and of ten through forums such as stakeholder advisory committees;
SECTION V: FROM CONCEPT TO ACTION - A STEP-BY-STEP PLAN TO REFORM YOURPRICING REGIME
Worth Every Penny: A Primer
A 10-STEP PLAN FOR SUCCESS:1 . Have a plan.2 . Get buy in and authority from senior management and elected offi cials. 3 . Get metered and start charging by volume.4 . Get the water bill right.5 . Improve accounting of water use in the community.6 . Account for expenditure and understand costs.7. Consider starting with a seasona l surcharge.8 . Make it a part of a complete program.9. Recruit the a id of senior government.10. Take the long-term view.
31

Worth Every Penny: A Primer Water Susta inability Project
• systematically assess dif ferent rate structures and rank them objectively to determine the one that will be most appropriate for your location. This is one area where you may want some expert outside assistance; and
• build institutional capacity for the future: undertake cost analysis, includ-ing consideration of future capital costs; improve asset management systems; prepare customer service staf f.
2. GET BUY IN AND AUTHORITY FROM SENIOR MANAGEMENT AND ELECTED OFFICIALS… Securing senior management and political input and support early in the process is critical to success because it involves senior people who will champion the cause and allocate authority and resources to ef fect the change. Pricing reform will necessarily involve political and administrative decisions in other parts of the municipal organization. Unless there is broad commitment at all levels of the organization, progress will be slow.
3. GET METERED AND START CHARGING BY VOLUME…As an obvious fi rst step, water service providers that do not have universal metering will want to look at the benefi ts and costs of putting this in place, even if the organization has done so already at some point in the past. Simply put, metering is a critical starting point for understanding and managing water demand and for pricing water services appropriately—and senior governments are increasingly willing to support such infrastructure programs.
As mentioned, about a third of Canadian municipalities are not metered. So if you are in this situation, you are not alone. Moving to universal metering (and ultimately sub-metering of multi-residential buildings), then volumetric pricing, then to a truly conservation-oriented rate structure will take time—likely a number of years—and perseverance. On the plus side, you will be able to learn from the experiences of many other communities that are already moving down this path.
4. GET THE WATER BILL RIGHT…For customers to respond to price changes, they need clear information about the link between the ir consumption and what it costs. This a llows them to make decisions about behaviour changes or technology upgrades. The water bill is one of the most ef fective tools ava ilable to communicate this information.
32 33
Ideally, the bill that the customer receives will compare their home’s consumption over time and to others in their neighbourhood and across the municipality. The more easily the information is understood, the better. Bar graphs and other illustrations of ten work well.
Moving to conservation-oriented pricing can sometimes prove challenging when dealing with older “legacy” billing systems. If there are no upgrades planned, and current billing systems do not have the functionality you want, you may need to be creative and use other approaches—for example, using generic bill inserts to communicate about price changes and how customers can control their costs.
5. IMPROVE ACCOUNTING OF WATER USE IN THE COMMUNITY…Collectively, Canadians have some way to go in terms of truly under-standing the factors that infl uence water demand in communities—climate, demographics, industrial and commercial demand, unaccounted for water (including system leakage), consumer end use, changing technology and so on. Prior to introducing pricing reform, municipalities should use the best information they have to account for current water use and to forecast future consumption. This will include looking at dif ferent situations with dif ferent conservation and demand management scenarios. This information, combined with improved accounting practices, will provide a solid foundation for establishing new rates.
6. ACCOUNT FOR EXPENDITURE AND UNDERSTAND COSTS…Shif ting to full cost accounting is another prerequisite of ef fective conserva-tion-oriented pricing. With this type of accounting method, the water service provider can accurately report all of its costs of operating.
From there, you have a basis for understanding the cost of supplying water, which in turn gives you a sound basis for rationalizing the costs passed on to customers. Without this, it can be very diffi cult to justify the per unit rate increases involved in pricing reform.

Worth Every Penny: A Primer Water Susta inability Project34
7. CONSIDER STARTING WITH A SEASONAL SURCHARGE… Moving to a full-fl edged conservation-oriented pricing system that is ef fec-tively linked to the long-term marginal cost of water will probably not happen overnight in most places. However, one reasonably simple fi rst step is to introduce seasonal surcharges—charging more for the volumetric component of the water bill during the summer when more water use is discretionary.15 If combined with ef fective communication, this can be one way to employ price at a time when consumers have the most capacity to modify their water use.
If the water service provider already has a volumetric pricing system in place, introducing a seasonal surcharge can be relatively simple since it will not require major changes to administrative and billing systems. A prime example of this is the District of Tofi no (Case Study 5), which has made good use of seasonal surcharges to bring down high summer water consumption in order to address signifi cant supply constraints.
8. MAKE IT A PART OF A COMPLETE PROGRAM…Conservation-oriented pricing reform will be more successful if it is part of a concerted, multi-faceted, conservation and demand management ef fort. A good place to start is by building on existing local water use effi ciency initia-tives. These may include rebates and retrofi t programs, community-based social marketing ef forts, rainwater harvesting, water reuse, water conserving urban designs, and outdoor watering restrictions, all of which can reinforce the impact of the price change.
9. RECRUIT THE AID OF SENIOR GOVERNMENT…Federal and provincial governments can play an important role in the transition towards conservation-oriented pricing. They provide guidelines, best practices manuals and advice on matters such as asset management, full cost accounting and pricing systems. They can also set consistent pricing and metering policies (including incentives for universal metering), and create a conducive and supportive regulatory environment. Alberta and Ontario have already begun to do this by encouraging full cost accounting. Finally, senior governments can support broader ef forts to reduce water demand by
35
Case Study 5:VANCOUVER ISLAND COMMUNITIES
British Columbia lags behind the national average for metering and volumetric pricing. But things are changing.
The District of Tofi no, on the west coast of Vancouver Island, has a winter population of less than 2000 and a peak summer population upwards of 20,000. Tofi no received notoriety not only for being a premier vacation destination but also for its dramatic water shortage crisis in late summer 2006. Over the past several years, the village’s water provider introduced a series of price reforms aimed at achieving demand management goals and addressing its municipal infrastructure defi cit. The rate structure starts with a small fi xed meter reading levy, fi ve different consumption tiers on an inclining block scale, and different rates applied to residential and business categories. It has a number of appealing features from a conservation perspective. First, it includes a seasonal surcharge, which effectively doubles rates in the summer months when consumption is high (due to tourists and outdoor use) and water avail-ability is very low. Second, in 2009, the District tacked an additional $1 .50 levy onto every cubic metre at every level of consumption. Finally, the highest tiers in their inclining block system are charged at a very high rate by national standards. At the time of writing, consumption at the top tier was effectively charged $3 per cubic metre in the winter and $4.60 per cubic metre in the summer when the new levy is included, placing it among the highest in the country. Even consumption at the lowest tier is charged a substantial $3.30 per cubic metre in the summer with inclusion of the levy. Although seen as controversial, Tofi no’s leaders agreed that the changes were required in order to cover the cost of needed capital improvements (i.e., their infrastructure defi cit) and to encourage necessary water conservation.
The Regional District of Nanaimo, on the east coast of Vancouver Island, operates seven small water utilities, referred to as Water Local Service Areas. All seven are fully metered, and customers are billed on an inclining block system with six different consumption tiers designed to encourage effi ciency. A customer would have to use a hefty volume of water to make it into the top tier (over 3.5 cubic metre/day). However, those who do, pay a premium at $3/cublic metre.
The Capital Regional District, at the southern tip of Vancouver Island, is the bulk water supplier to municipalities in and around Victoria, and has been a leader in the fi eld of full cost accounting for some time. Since at least 1995, the Capital Regional District has used full cost accounting to allocate the capital component of costs over the life of the assets. Its representatives have successfully argued that full cost accounting ensures sustainability of the water system, facilitates rate stability, leads to effi cient resource allocation, creates the right fi scal environment for encouraging conservation and discourages overbuilding of infra-structure. In summary, they have demonstrated that it represents sound business practice.
15 . More accura te ly, the objective might be to link the of f peak season price of wa ter to the short-term margina l cost of supply and the peak season price to the long-term margina l cost . The fi xed component of the bill may a lso have to be adjusted by an amount necessary to avoid budge t defi cits or excessive surplus (Renze t ti (2009), p. 14).
Water Susta inability Project

Worth Every Penny: A Primer Water Susta inability Project36
reforming water allocation systems, modifying building codes to mandate the use of fi xtures such as high effi ciency toilets, or requiring commitments to conservation as a condition of infrastructure funding.
10. TAKE THE LONG-TERM VIEW…Canadian water providers, policy makers and researchers still have much to learn about water use in our communities and about how people will respond to dif ferent pricing approaches. As our knowledge and understanding grows and communities become more familiar with conservation-oriented pricing, the sophistication of rate structures can increase. Demand for innovative and ef fective approaches to water use effi ciency and conservation will also grow as communities adapt to the realities of climate change and its impact on our water supplies.
In the future, price, rather than outdoor watering restrictions, may well become the main tool to ration water during drought (known as scarcity pricing). Utilities might begin to use distance pricing, where users pay for the actual cost of supplying water to their individual connection. Non-linear price schedules and other more esoteric economic tools, where the mapping from quantity purchased to total price is not a strictly linear function, may become the norm.16 Non-linear pricing is already commonly used in the mobile phone industry and even in the energy sector. Over time, this may become more common with water, particularly as “smart meter” technology proliferates.
Much of this is probably in the distant future for most Canadians. However it illustrates the idea that conservation-oriented pricing will be an evolving tool that can continue to help us manage water demand in our communities for many years to come.
WHERE TO GO FROM HERE?Regardless of where water service providers are today, developing an ef fective conservation-oriented pricing structure will take time, courage and resources. Numerous political and historical barriers stand in the way—with many of these outside the sphere of infl uence of municipal water managers. Moving forward requires careful planning, communication and consensus building within the organization and the broader community.
37
16 . For a brief discussion of non-linear pricing, see Renze t ti (2009), p. 281 .
One powerful motivator may help build consensus and perseverance—conser-vation-oriented pricing makes sound sense from both economic and environ-mental points of view. The objective is simply to cover the costs of supplying water and maintain the assets required to do so over the long term. It is also perhaps the most powerful instrument available to impact short-term water demand and thereby improve environmental performance. Wasting water and not being able to fund the operation of water systems are in nobody’s best interest. It is not really a question of if, but when: when will Canadian communities begin to move to a 21st century approach to water infrastructure planning and pricing?

Worth Every Penny: A Primer Water Susta inability Project38 39
Detailed Water Pricing GuidanceAmerican Water Works Association. (1996). Managing the Revenue and Cash Flow Effects of Conservation. Denver, CO.
American Water Works Association. (2000). Principles of Water Rates, Fees and Charges: Manual of Water Supply Practices M1, 5th ed. Denver, CO.
Australian Government. (2008). Approaches to Urban Water Pricing. Prepared by Frontier Economics for the National Water Commission. Waterlines Occasional Paper, No. 7, July 2008 .
Canadian Water and Wastewater Association. (1992). Municipal Water and Wastewater Rate Manual: A New Approach to Rate Setting. Ottawa, ON.: Canadian Water and Wastewater Association in co-operation with Environment Canada and the Rawson Academy of Aquatic Science. Available at: www.cwwa.ca /publicationorder_e.asp.
Wang, Y.-D., W.J. Smith, Jr. and J. Byrn. (2005.) Water Conservation-Oriented Rates: Strategies to Extend Supply, Promote Equity and Meet Minimum Flow Levels. Denver, CO: American Water Works Association.
Full Cost AccountingCanadian Institute of Chartered Accountants. (1997). Full Cost Accounting from an Environ-mental Perspective Research Report. Toronto, ON. Available at: www.cica.ca /research-and-guidance/research-activities/other-publica-tions/ item13274.aspx.
Federation of Canadian Municipalities and the National Research Council. (2006). Water and Sewer Rates: Full Cost Recovery. In InfraGuide: National Guide to Sustainable Municipal Infrastructure. March 2006. Available at: www.infraguide.ca / lib/db2fi le.asp?fi leid=4903.
Government of Alberta. (2008). A Guide to Alberta Environment’s Full Cost Accounting Program. March 2008 . Available at: www.environment.alberta.ca /2275.html.
San Antonio Water System. (2004). Compre-hensive Cost of Service and Rate Design Study. Prepared by Raftelis Financial Consulting. November 2009. Available at: http: //www.saws.org /who_we_are/community/RAC/Docs/2003 2004_RateStudyReport_FINAL.pdf.
U.S. Environmental Protection Agency. (2009). Full Cost Accounting, Online Resources. Available at: www.epa.gov/waste/conserve/tools/ fca / index.htm.
Price Elasticity EstimatesDalhuisen, J.M., R.J.G.M. Florax, H.L.F. de Groot and P. Nijkamp. (2003). Price and Income Elasticities of Residential Water Demand: A Meta-analysis. Land Economics, 79 (2), pp. 292-308 .
Espey, M., J. Espey and W.D. Shaw. (1997). Price Elasticity of Residential Demand for Water: A Meta-analysis, Water Resource Research, 33(6), pp. 1369-1374.
Municipal Water Infrastructure and Policy ReformRenzetti, S. (2009). Wave of the Future: The Case for Smarter Water Policy. C.D. Howe Institute. Commentary No. 281, February 2009. Available at: www.cdhowe.org /pdf/commentary_281 .pdf.
Water Strategy Expert Panel. (2005). Water-tight: The Case for Change in Ontario’s Water and Wastewater Sector. Report prepared for the Ontario Ministry of Public Infrastructure Renewal, Toronto, ON. Available at: www.water-panel.ontario.ca.
Resources for Comprehensive ProgramsThinking Beyond Pipes and Pumps (2006) Victoria, BC: University of Victoria, POLIS Project on Ecological Governance.http: //poliswaterproject.org /publication/22.
M52 Water Conservation Programs—A Planning Manual. (2006). Denver, Colorado, American Water and Wastewater Association.http: //www.normas.com/AWWA /pages/30052.html.
Resources from Waste: A Guide to Integrated Resource Recovery (2009) Victoria, BC: Ministry of Community and Rural Developmenthttp: //www.cd.gov.bc.ca / lgd/ infra /resources_from_waste.html.
Good Governance for Water Conservation: A Primer. (2008). Vancouver, BC: UBC Program on Water Governancehttp: //www.watergovernance.ca /publications/Primer.pdf.
POLIS Water Sustainability Toolkit http: //poliswaterproject.org / toolkit.
Alliance for Water Effi ciency Resource Libraryhttp: //www.allianceforwatereffi ciency.org /Water_Resources_Content_Listing.aspx.
APPENDIX A: ADDITIONAL RESOURCESi. Brandes, O., T. Maas and E . Reynolds. 2006 . Think ing Beyond Pipes and Pumps. Victoria , BC: University of Victoria , POLIS Project on Ecologica l Governance . pg 8 .
ii. Environment Canada . (2009). Municipa l Water and Wastewater Survey: Municipa l Wa-ter Use 2006 Summary Tables. Ot tawa , ON.
iii. Environment Canada . (2009). Municipa l Water and Wastewater Survey: Municipa l Wa-ter Use 2006 Summary Tables. Ot tawa , ON.
iv. Organisation for Economic Co-operation and Deve lopment (OECD). (2003). Improving Water Management: Recent OECD Experi-ence . OECD Observer Policy Brief, March 2003 .
v. Environment Canada . (2008). Municipa l Water Pricing Report (2004 Statistics). Ava il-able at: www.ec.gc.ca /eau-water/default.asp?lang=En&n=AE97B7F3 -1
vi. Environment Canada . (2008). Municipa l Water Pricing Report (2004 Statistics). Ava il-able at: www.ec.gc.ca /eau-water/default.asp?lang=En&n=AE97B7F3 -1
vii. Organisation for Economic Co-operation and Deve lopment (OECD). (2010). Pricing Water Resources and Water and Sanitation Services. OECD Environment Directorate, ENV/EPOC/GSP(2009)17/FINAL, 18 January 2010.
viii. Environment Canada . (2008). 2004 Mu-nicipa l Water and Wastewater Survey Pricing Summary Database – Summary Tables. Ot-tawa , ON. Statistics Canada . (2006). Spend-ing Pat terns in Canada 2005 . Cata logue no. 62-202-XIE . Ava ilable at: ht tp: //dsp-psd.pwgsc.gc.ca /Collection-R/Statcan/62-202-XIE /62-202-XIE2004000.pdf
ix. Sprague , J.(2007). Great Wet North? Canada’s My th of Water Abundance. In Eau Canada: The Future of Canada’s Water (K . Bakker, Ed.). UBC Press, Vancouver, BC
x. Renzet ti, S. (2009). Wave of the Future: The Case for Smarter Water Policy. C.D. Howe Institute. Commentary No. 281 , February 2009. Ava ilable at: www.cdhowe.org /pdf /commentary_281 .pdf
xi. Renzet ti, S. (2009). Wave of the Future: The Case for Smarter Water Policy. C.D. Howe Institute. Commentary No. 281 , February 2009. Ava ilable at: www.cdhowe.org /pdf /commentary_281 .pdf
xii. Howe, C. (2005). The Functions, Impacts and Ef fectiveness of Water Pricing: Evidence from the United States and Canada . Interna-tiona l Journa l of Water Resources Deve lop-ment, 21(1), pp. 43 -53 , March 2005 .
xiii. Water Strategy Expert Pane l. (2005). Watertight: The Case for Change in On-tario’s Water and Wastewater Sector. Report prepared for the Ontario Ministry of Public Infrastructure Renewa l. Toronto, ON. Ava ilable at: ht tp: //www.waterpane l.ontario.ca /
xiv. Renzet ti, S. (1999). Municipa l Water Sup-ply and Sewage Treatment: Costs, Prices and Distortions. Canadian Journa l of Economics, 32(2), pp. 688 -704 .
xv. See for example, Pollution Probe (2004). Mak ing Everyone a Winner: Mak ing Energy Conservation Profi table for Ontario’s Electric Utilities. Ava ilable at: www.pollutionprobe .org /Publications/Energy.htm
xvi. Organisation for Economic Co-operation and Deve lopment (OECD). (2010). Price Water Resources and Water and Sanitation Ser-vices. OECD Environment Directorate, ENV/EPOC/GSP(2009)17. FINAL, 18 January 2010.
xvii. Barlow, M. (2008). The Council Replies: Letters to the Editor. Maude Barlow’s Re -sponse to John Langford. The Council of Ca-nadians. Ava ilable at: ht tp: //www.canadians.org /media /council /2008 /15 -Aug-08 .html
ENDNOTES

Worth Every Penny: A Primer
THE POLIS PROJECTCreated in 2000, the POLIS Project on Ecological Governance is a research-based organization housed at the University of Victoria in British Columbia. Researchers who are also community activists work together at POLIS to dismantle the notion of the environment as merely another sector, and to make ecological thinking and practice a core value in all aspects of society. Among the many research centres investigating and promoting sustainability worldwide, POLIS represents a unique blend of multidisciplinary academic research and community action.
Visit www.polisproject.org to learn more.
The Water Sustainability Project (WSP) is an action-based research group that recognizes that water scarcity is a social dilemma that cannot be addressed by technical solutions alone. The project focuses on three themes crucial to a sustainable water future: • Water Conservation and the Sof t Path • Water-Energy Nexus • Water Law, Policy and Governance
WSP works with industry, government, civil society and individua ls to develop and embed water conservation strategies to benefi t the economy, communities and the environment. WSP is an initiative of the POLIS Project on Ecologica l Governance at the University of Victoria .
Visit www.poliswaterproject.org to learn more.
The POLIS ProjectPO Box 3060University of VictoriaVictoria , BC V8W 3R4Ema il: [email protected] lephone: 250 472-4487
watersustainabilityproject POLIS Project on Ecological Governance