a principled technologies test report
TRANSCRIPT
A PRINCIPLED TECHNOLOGIES TEST REPORT
Commissioned by Lenovo; November 2012
POWER MANAGEMENT: LENOVO THINKSERVER SMART GRID TECHNOLOGY
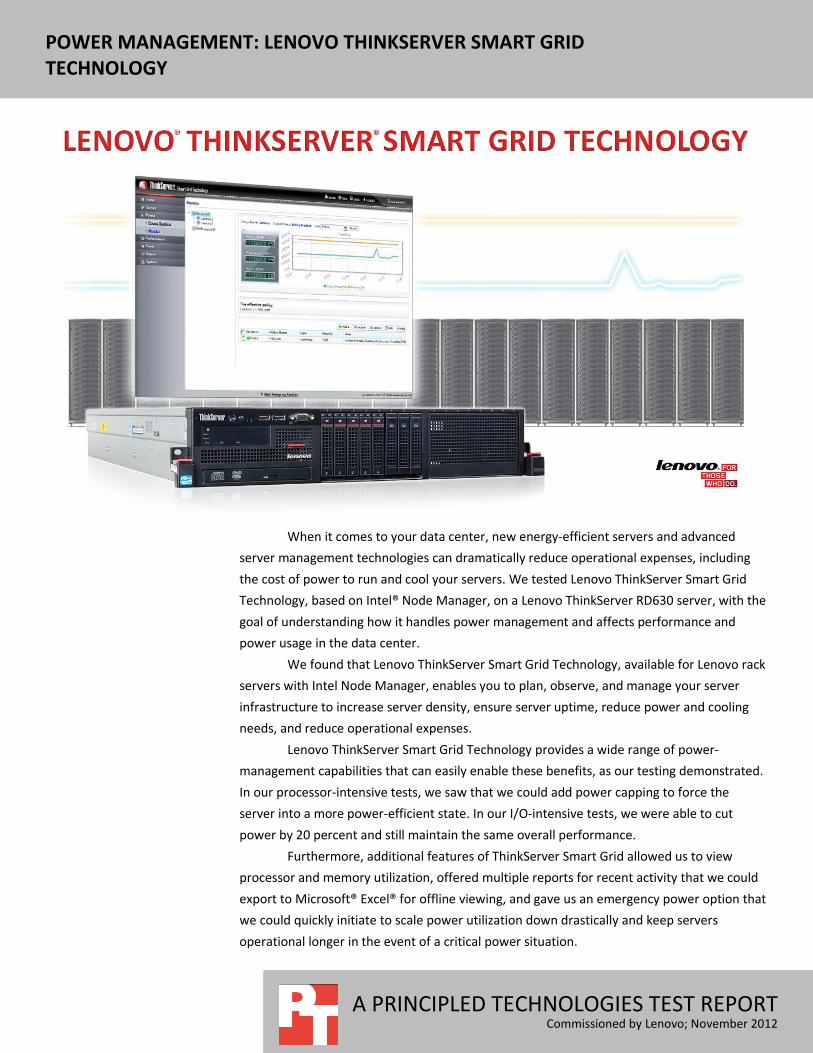
When it comes to your data center, new energy-efficient servers and advanced
server management technologies can dramatically reduce operational expenses, including
the cost of power to run and cool your servers. We tested Lenovo ThinkServer Smart Grid
Technology, based on Intel® Node Manager, on a Lenovo ThinkServer RD630 server, with the
goal of understanding how it handles power management and affects performance and
power usage in the data center.
We found that Lenovo ThinkServer Smart Grid Technology, available for Lenovo rack
servers with Intel Node Manager, enables you to plan, observe, and manage your server
infrastructure to increase server density, ensure server uptime, reduce power and cooling
needs, and reduce operational expenses.
Lenovo ThinkServer Smart Grid Technology provides a wide range of power-
management capabilities that can easily enable these benefits, as our testing demonstrated.
In our processor-intensive tests, we saw that we could add power capping to force the
server into a more power-efficient state. In our I/O-intensive tests, we were able to cut
power by 20 percent and still maintain the same overall performance.
Furthermore, additional features of ThinkServer Smart Grid allowed us to view
processor and memory utilization, offered multiple reports for recent activity that we could
export to Microsoft® Excel® for offline viewing, and gave us an emergency power option that
we could quickly initiate to scale power utilization down drastically and keep servers
operational longer in the event of a critical power situation.

A Principled Technologies test report 2
Power management: Lenovo ThinkServer Smart Grid Technology
HOW POWER CAPPING CAN HELP YOU New server management technologies, coupled with new servers with power-
saving technologies, can save businesses money through power capping, the ability to
set maximum levels of power usage for particular servers or groups of servers at
particular times. In processor-intensive workloads, you can use less power and yield
greater performance per watt by forcing the CPU into a more power-efficient state. In
I/O-intensive workloads, where you have unused processor cycles, you can increase
server rack density, recouping unused power capacity without significantly affecting
overall performance. When you can know that a given server will not exceed a certain
level of power usage, you can allocate the total amount of power you have available to
your data center without worrying about overloading your circuits during times of heavy
server load. These power management technologies can offer new levels of flexibility in
how you allocate power amongst servers and how you lay out your data center. This can
increase server density, reduce power and cooling needs, ensure server uptime, and
reduce TCO.
THE LENOVO APPROACH TO POWER MANAGEMENT Lenovo ThinkServer Smart Grid Technology lets the latest servers, including the
Lenovo ThinkServer RD630, offer customers a new view into data center power usage.
ThinkServer Smart Grid Technology is a power management application that uses
industry-standard protocols to read power usage information from Lenovo ThinkServer
servers and then distribute power limits to them, all through a single easy-to-use
interface.
To learn more about Lenovo ThinkServer Smart Grid Technology, visit
http://support.lenovo.com/en_US/downloads/detail.page?DocID=DS029844.
POWER CAPPING IN ACTION To evaluate the capabilities and advantages of power capping with Lenovo
ThinkServer Smart Grid Technology managing a Lenovo ThinkServer RD630 server, we
first ran a heavy OLTP database workload using nearly 100 percent processor utilization
on the server. We used STEC Mach16 MLC SSD drives to maximize storage subsystem
IOPS and prevent an I/O bottleneck. We capped the power at 90%, 80% and 70% of the
peak power and recorded the performance per watt at each level in order to see where
we achieved the best power/performance ratio.
As Figure 1 and Figure 2 show, Smart Grid enabled us to lower the power
available to the server, which lowered the overall database performance. That said,
performance per watt increased as we lowered the power, as the processor moved into
a more power-efficient state. This increased efficiency has far-reaching ramifications for
reducing power and cooling issues in the data center. One practical application of this
A Principled Technologies test report 3
Power management: Lenovo ThinkServer Smart Grid Technology
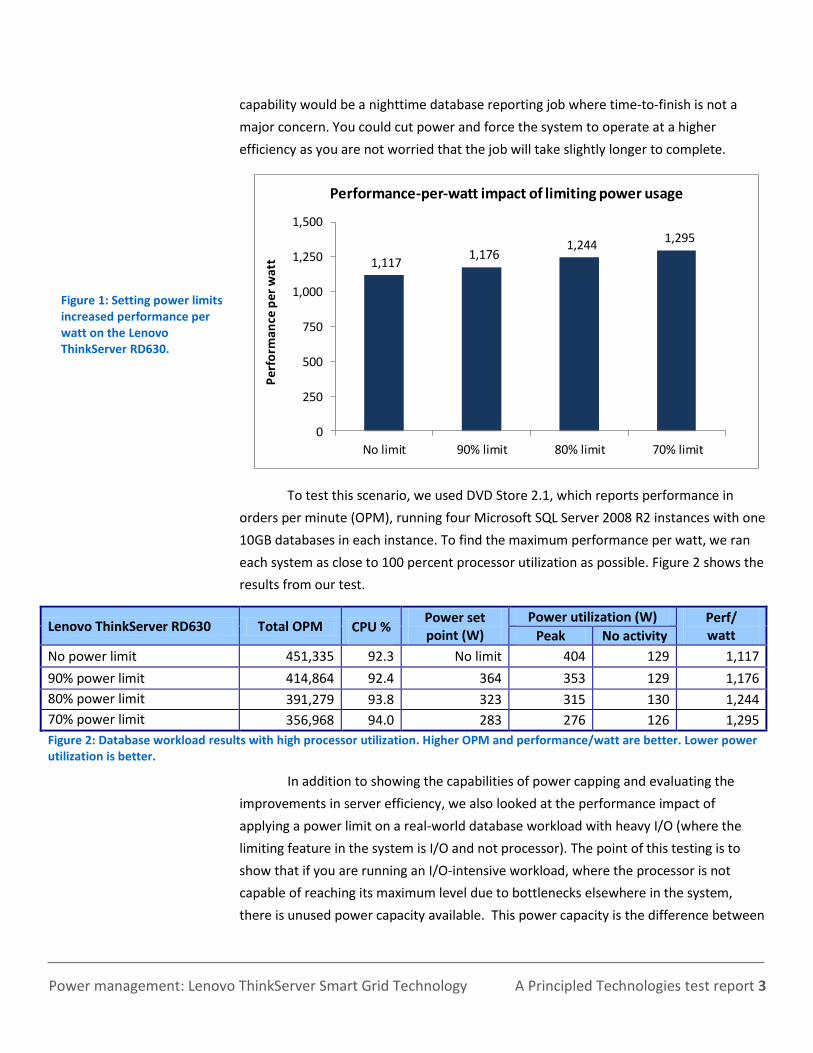
capability would be a nighttime database reporting job where time-to-finish is not a
major concern. You could cut power and force the system to operate at a higher
efficiency as you are not worried that the job will take slightly longer to complete.
Figure 1: Setting power limits increased performance per watt on the Lenovo ThinkServer RD630.
1,117 1,176
1,244 1,295
0
250
500
750
1,000
1,250
1,500
No limit 90% limit 80% limit 70% limit
Pe
rfo
rma
nce
pe
r w
att
Performance-per-watt impact of limiting power usage
To test this scenario, we used DVD Store 2.1, which reports performance in
orders per minute (OPM), running four Microsoft SQL Server 2008 R2 instances with one
10GB databases in each instance. To find the maximum performance per watt, we ran
each system as close to 100 percent processor utilization as possible. Figure 2 shows the
results from our test.
Lenovo ThinkServer RD630 Total OPM CPU % Power set point (W)
Power utilization (W) Perf/ watt Peak No activity
No power limit 451,335 92.3 No limit 404 129 1,117
90% power limit 414,864 92.4 364 353 129 1,176
80% power limit 391,279 93.8 323 315 130 1,244
70% power limit 356,968 94.0 283 276 126 1,295
Figure 2: Database workload results with high processor utilization. Higher OPM and performance/watt are better. Lower power utilization is better.
In addition to showing the capabilities of power capping and evaluating the
improvements in server efficiency, we also looked at the performance impact of
applying a power limit on a real-world database workload with heavy I/O (where the
limiting feature in the system is I/O and not processor). The point of this testing is to
show that if you are running an I/O-intensive workload, where the processor is not
capable of reaching its maximum level due to bottlenecks elsewhere in the system,
there is unused power capacity available. This power capacity is the difference between
A Principled Technologies test report 4
Power management: Lenovo ThinkServer Smart Grid Technology
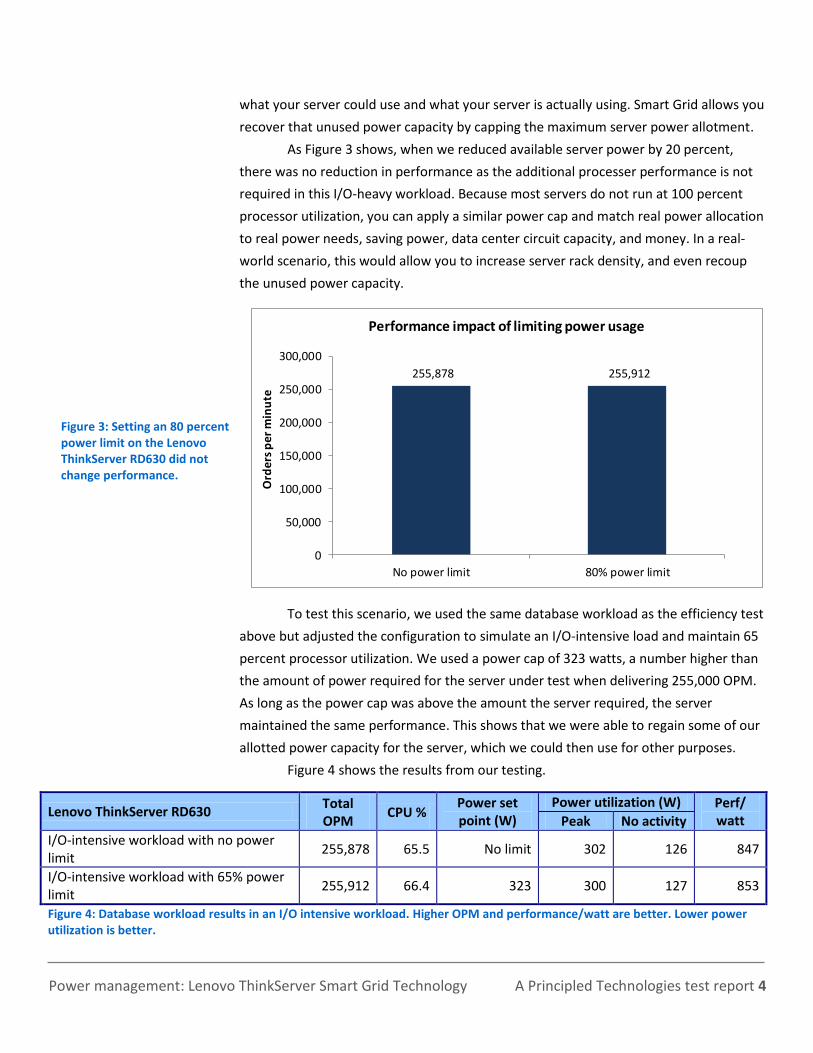
what your server could use and what your server is actually using. Smart Grid allows you
recover that unused power capacity by capping the maximum server power allotment.
As Figure 3 shows, when we reduced available server power by 20 percent,
there was no reduction in performance as the additional processer performance is not
required in this I/O-heavy workload. Because most servers do not run at 100 percent
processor utilization, you can apply a similar power cap and match real power allocation
to real power needs, saving power, data center circuit capacity, and money. In a real-
world scenario, this would allow you to increase server rack density, and even recoup
the unused power capacity.
Figure 3: Setting an 80 percent power limit on the Lenovo ThinkServer RD630 did not change performance.
255,878 255,912
0
50,000
100,000
150,000
200,000
250,000
300,000
No power limit 80% power limit
Ord
ers
pe
r m
inu
te
Performance impact of limiting power usage
To test this scenario, we used the same database workload as the efficiency test
above but adjusted the configuration to simulate an I/O-intensive load and maintain 65
percent processor utilization. We used a power cap of 323 watts, a number higher than
the amount of power required for the server under test when delivering 255,000 OPM.
As long as the power cap was above the amount the server required, the server
maintained the same performance. This shows that we were able to regain some of our
allotted power capacity for the server, which we could then use for other purposes.
Figure 4 shows the results from our testing.
Lenovo ThinkServer RD630 Total OPM
CPU % Power set point (W)
Power utilization (W) Perf/ watt Peak No activity
I/O-intensive workload with no power limit
255,878 65.5 No limit 302 126 847
I/O-intensive workload with 65% power limit
255,912 66.4 323 300 127 853
Figure 4: Database workload results in an I/O intensive workload. Higher OPM and performance/watt are better. Lower power utilization is better.
A Principled Technologies test report 5
Power management: Lenovo ThinkServer Smart Grid Technology
KEY FEATURES OF LENOVO THINKSERVER SMART GRID Lenovo ThinkServer Smart Grid Technology offers several other key features to
manage power polices, extend operational time in the event of a power outage,
implement server priorities, monitor server performance and provide alerts during a
critical event. We explain these features in the section below.
Defining power caps with management policy
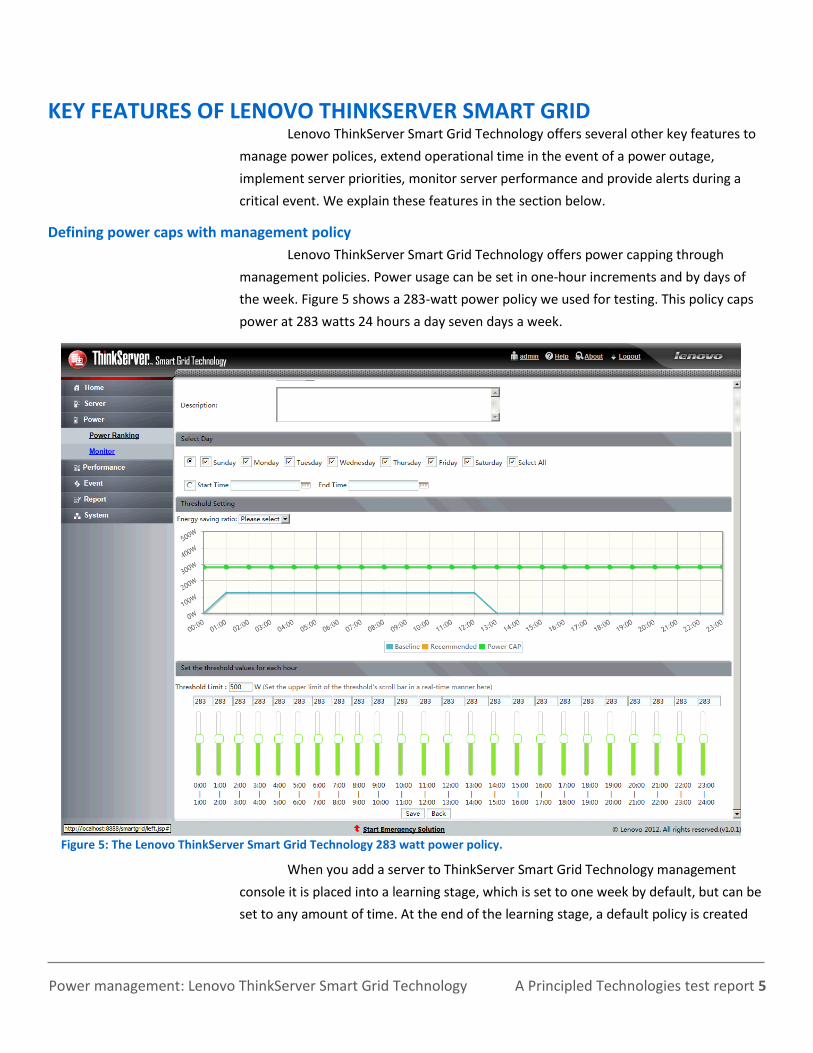
Lenovo ThinkServer Smart Grid Technology offers power capping through
management policies. Power usage can be set in one-hour increments and by days of
the week. Figure 5 shows a 283-watt power policy we used for testing. This policy caps
power at 283 watts 24 hours a day seven days a week.
Figure 5: The Lenovo ThinkServer Smart Grid Technology 283 watt power policy.
When you add a server to ThinkServer Smart Grid Technology management
console it is placed into a learning stage, which is set to one week by default, but can be
set to any amount of time. At the end of the learning stage, a default policy is created
A Principled Technologies test report 6
Power management: Lenovo ThinkServer Smart Grid Technology
that reflects actual power consumption. Applying this default policy restricts power for
best savings without affecting performance.
In addition to the default policies, you can add a customized, database, or Web
server policy. The customized policy allows you to specify the power cap, the time of
day and days of the week you would like to restrict power.
The database and Web server policies can adjust power based on the response
time for server request. To configure these policies, you enter your database or Web
server information and give a response time in milliseconds that you want the server to
maintain. Smart Grid adjusts power based on that response time. When the response
time is less than the value you set in the policy then it will adjust the power downwards.
The power will increase if the response time goes up and needs more performance.
Maintaining business continuity - Reliability during power outage
One capability a data center server must offer is maximum availability. Lenovo
ThinkServer Smart Grid Technology helps by offering a feature called Emergency
Solution, which reduces server power draw on a group of servers in the event of an
emergency such as drop in data center power or cooling capacity. Although the server is
not performing at peak output, you get the benefits of protecting critical workloads or
extending the server uptime when running on a UPS source or putting less demand on a
backup generator. All this and your end-users can keep working.
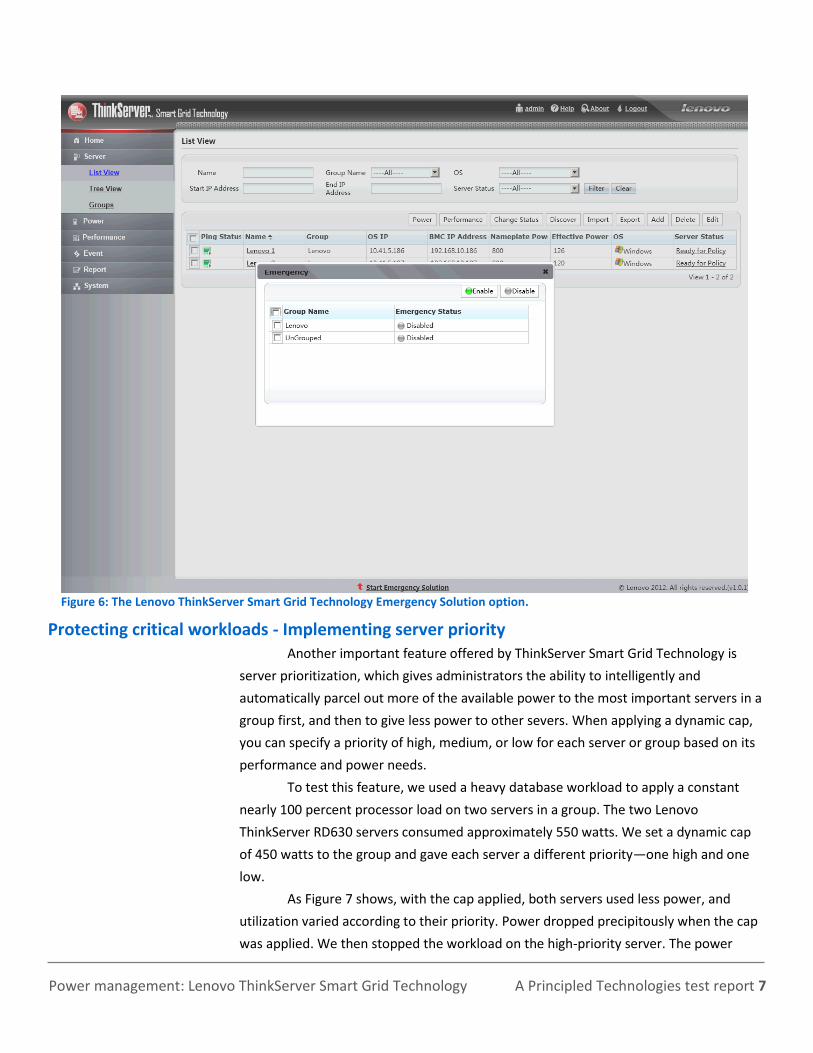
The administrator can initiate Emergency Solution by simply clicking a button in
the management console. Figure 6 shows the Emergency Solution option and how to
enable it. At the bottom of the ThinkServer Smart Grid Technology management screen
is a Start Emergency Solution link. Clicking this link opens the Emergency window, where
you can select the group on which you want to enable the Emergency Solution. To
disable the Emergency Solution, you follow the same procedures, but uncheck the group
to disable it.
A Principled Technologies test report 7
Power management: Lenovo ThinkServer Smart Grid Technology
Figure 6: The Lenovo ThinkServer Smart Grid Technology Emergency Solution option.
Protecting critical workloads - Implementing server priority Another important feature offered by ThinkServer Smart Grid Technology is
server prioritization, which gives administrators the ability to intelligently and
automatically parcel out more of the available power to the most important servers in a
group first, and then to give less power to other severs. When applying a dynamic cap,
you can specify a priority of high, medium, or low for each server or group based on its
performance and power needs.
To test this feature, we used a heavy database workload to apply a constant
nearly 100 percent processor load on two servers in a group. The two Lenovo
ThinkServer RD630 servers consumed approximately 550 watts. We set a dynamic cap
of 450 watts to the group and gave each server a different priority—one high and one
low.
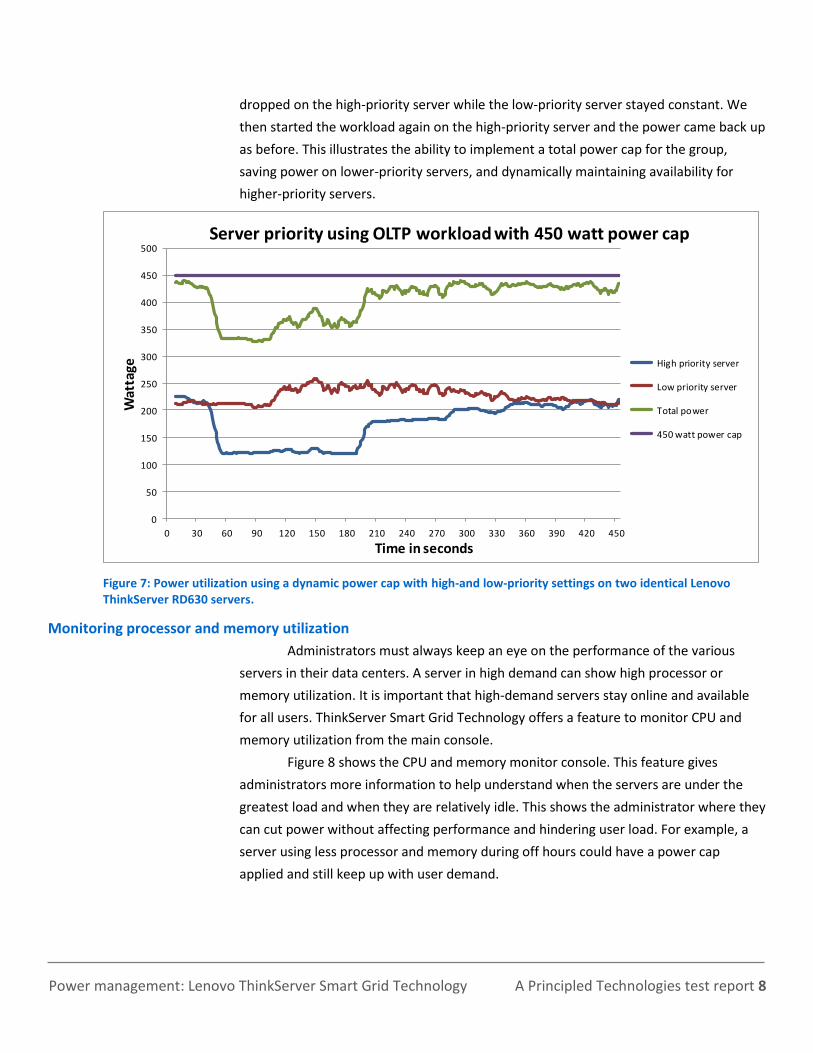
As Figure 7 shows, with the cap applied, both servers used less power, and
utilization varied according to their priority. Power dropped precipitously when the cap
was applied. We then stopped the workload on the high-priority server. The power
A Principled Technologies test report 8
Power management: Lenovo ThinkServer Smart Grid Technology
dropped on the high-priority server while the low-priority server stayed constant. We
then started the workload again on the high-priority server and the power came back up
as before. This illustrates the ability to implement a total power cap for the group,
saving power on lower-priority servers, and dynamically maintaining availability for
higher-priority servers.
0
50
100
150
200
250
300
350
400
450
500
0 30 60 90 120 150 180 210 240 270 300 330 360 390 420 450
Wat
tage
Time in seconds
Server priority using OLTP workload with 450 watt power cap
High priority server
Low priority server
Total power
450 watt power cap
Figure 7: Power utilization using a dynamic power cap with high-and low-priority settings on two identical Lenovo ThinkServer RD630 servers.
Monitoring processor and memory utilization
Administrators must always keep an eye on the performance of the various
servers in their data centers. A server in high demand can show high processor or
memory utilization. It is important that high-demand servers stay online and available
for all users. ThinkServer Smart Grid Technology offers a feature to monitor CPU and
memory utilization from the main console.
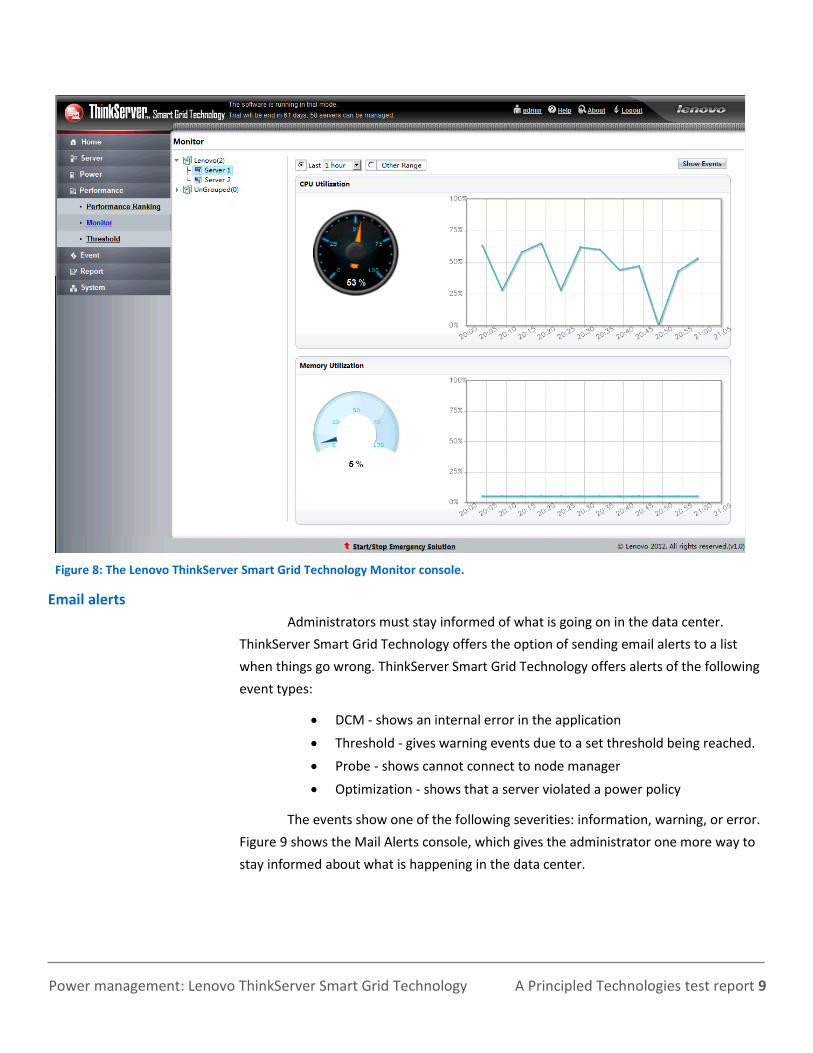
Figure 8 shows the CPU and memory monitor console. This feature gives
administrators more information to help understand when the servers are under the
greatest load and when they are relatively idle. This shows the administrator where they
can cut power without affecting performance and hindering user load. For example, a
server using less processor and memory during off hours could have a power cap
applied and still keep up with user demand.
A Principled Technologies test report 9
Power management: Lenovo ThinkServer Smart Grid Technology
Figure 8: The Lenovo ThinkServer Smart Grid Technology Monitor console.
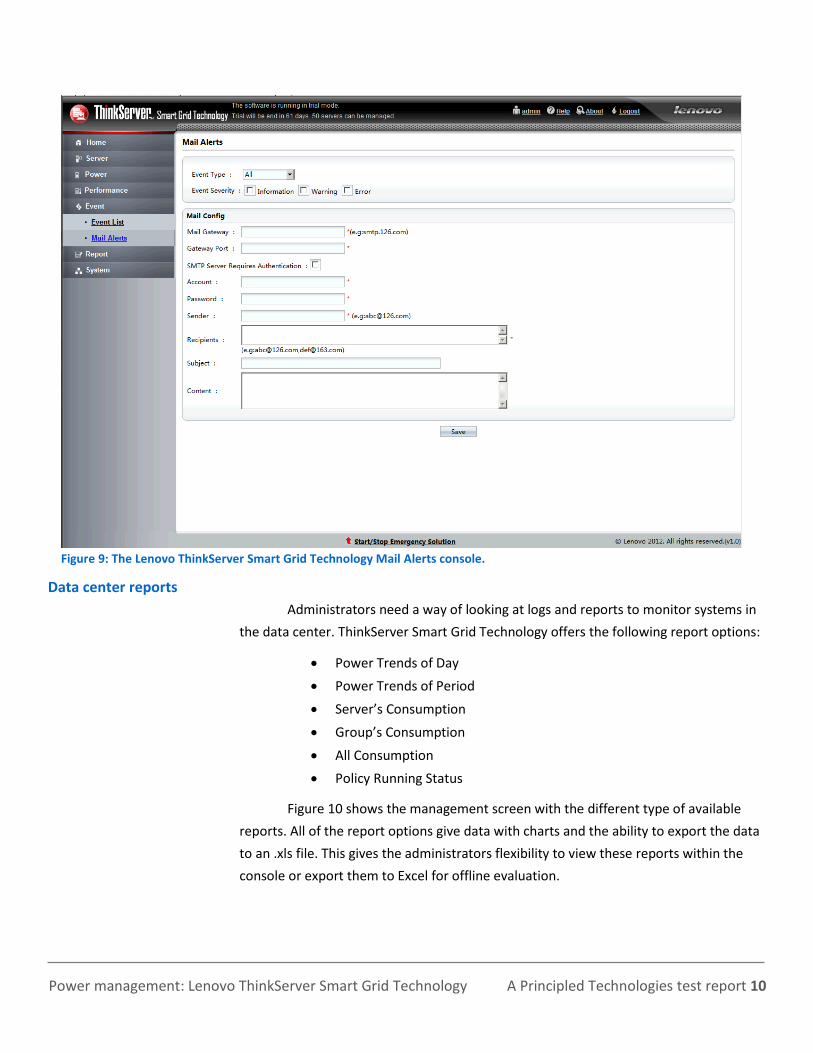
Email alerts
Administrators must stay informed of what is going on in the data center.
ThinkServer Smart Grid Technology offers the option of sending email alerts to a list
when things go wrong. ThinkServer Smart Grid Technology offers alerts of the following
event types:
DCM - shows an internal error in the application
Threshold - gives warning events due to a set threshold being reached.
Probe - shows cannot connect to node manager
Optimization - shows that a server violated a power policy
The events show one of the following severities: information, warning, or error.
Figure 9 shows the Mail Alerts console, which gives the administrator one more way to
stay informed about what is happening in the data center.
A Principled Technologies test report 10
Power management: Lenovo ThinkServer Smart Grid Technology
Figure 9: The Lenovo ThinkServer Smart Grid Technology Mail Alerts console.
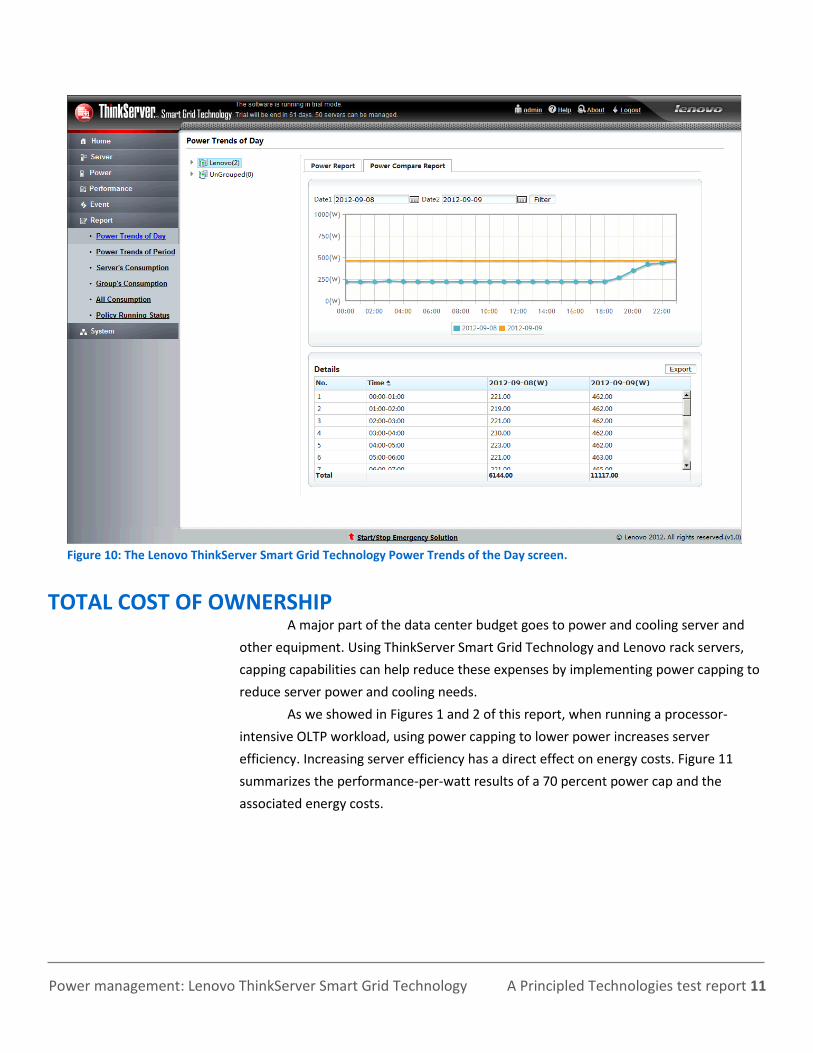
Data center reports
Administrators need a way of looking at logs and reports to monitor systems in
the data center. ThinkServer Smart Grid Technology offers the following report options:
Power Trends of Day
Power Trends of Period
Server’s Consumption
Group’s Consumption
All Consumption
Policy Running Status
Figure 10 shows the management screen with the different type of available
reports. All of the report options give data with charts and the ability to export the data
to an .xls file. This gives the administrators flexibility to view these reports within the
console or export them to Excel for offline evaluation.
A Principled Technologies test report 11
Power management: Lenovo ThinkServer Smart Grid Technology
Figure 10: The Lenovo ThinkServer Smart Grid Technology Power Trends of the Day screen.
TOTAL COST OF OWNERSHIP A major part of the data center budget goes to power and cooling server and
other equipment. Using ThinkServer Smart Grid Technology and Lenovo rack servers,
capping capabilities can help reduce these expenses by implementing power capping to
reduce server power and cooling needs.
As we showed in Figures 1 and 2 of this report, when running a processor-
intensive OLTP workload, using power capping to lower power increases server
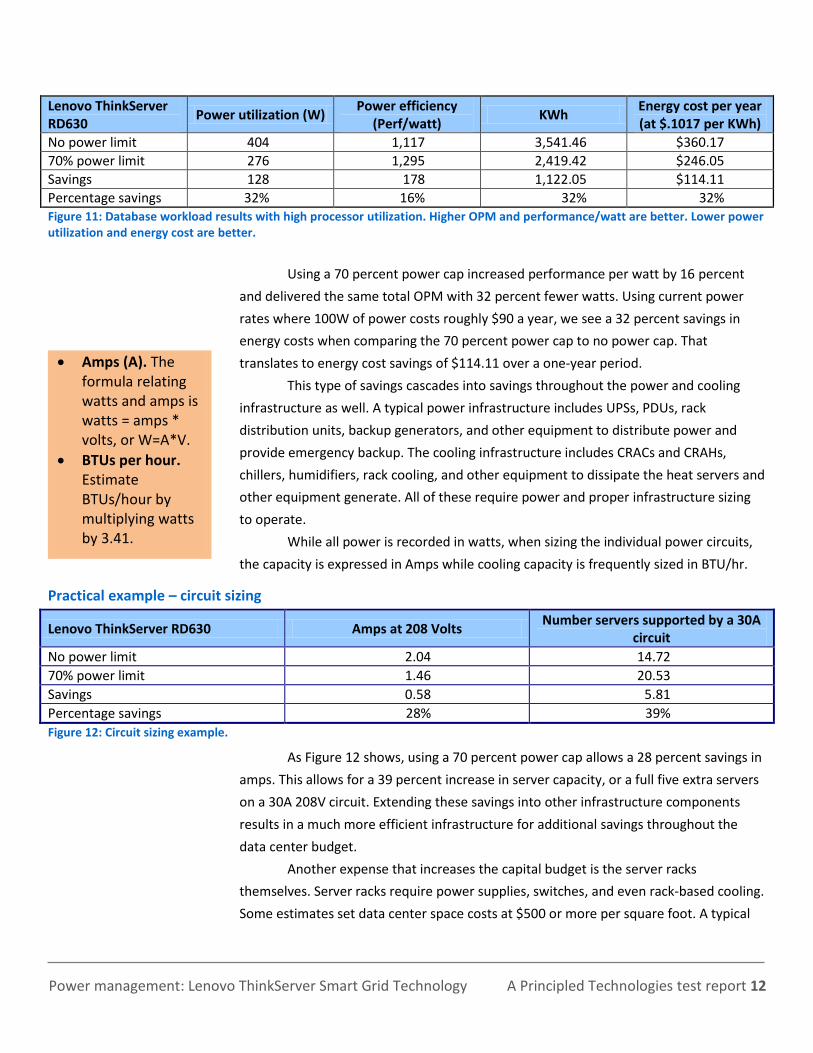
efficiency. Increasing server efficiency has a direct effect on energy costs. Figure 11
summarizes the performance-per-watt results of a 70 percent power cap and the
associated energy costs.
A Principled Technologies test report 12
Power management: Lenovo ThinkServer Smart Grid Technology
Lenovo ThinkServer RD630
Power utilization (W) Power efficiency
(Perf/watt) KWh
Energy cost per year (at $.1017 per KWh)
No power limit 404 1,117 3,541.46 $360.17
70% power limit 276 1,295 2,419.42 $246.05
Savings 128 178 1,122.05 $114.11
Percentage savings 32% 16% 32% 32% Figure 11: Database workload results with high processor utilization. Higher OPM and performance/watt are better. Lower power utilization and energy cost are better.
Using a 70 percent power cap increased performance per watt by 16 percent
and delivered the same total OPM with 32 percent fewer watts. Using current power
rates where 100W of power costs roughly $90 a year, we see a 32 percent savings in
energy costs when comparing the 70 percent power cap to no power cap. That
translates to energy cost savings of $114.11 over a one-year period.
This type of savings cascades into savings throughout the power and cooling
infrastructure as well. A typical power infrastructure includes UPSs, PDUs, rack
distribution units, backup generators, and other equipment to distribute power and
provide emergency backup. The cooling infrastructure includes CRACs and CRAHs,
chillers, humidifiers, rack cooling, and other equipment to dissipate the heat servers and
other equipment generate. All of these require power and proper infrastructure sizing
to operate.
While all power is recorded in watts, when sizing the individual power circuits,
the capacity is expressed in Amps while cooling capacity is frequently sized in BTU/hr.
Practical example – circuit sizing
Lenovo ThinkServer RD630 Amps at 208 Volts Number servers supported by a 30A
circuit
No power limit 2.04 14.72
70% power limit 1.46 20.53
Savings 0.58 5.81
Percentage savings 28% 39%
Figure 12: Circuit sizing example.
As Figure 12 shows, using a 70 percent power cap allows a 28 percent savings in
amps. This allows for a 39 percent increase in server capacity, or a full five extra servers
on a 30A 208V circuit. Extending these savings into other infrastructure components
results in a much more efficient infrastructure for additional savings throughout the
data center budget.
Another expense that increases the capital budget is the server racks
themselves. Server racks require power supplies, switches, and even rack-based cooling.
Some estimates set data center space costs at $500 or more per square foot. A typical
Amps (A). The formula relating watts and amps is watts = amps * volts, or W=A*V.
BTUs per hour. Estimate BTUs/hour by multiplying watts by 3.41.

A Principled Technologies test report 13
Power management: Lenovo ThinkServer Smart Grid Technology
server rack can require 14 or more square feet, including surrounding clearances, which
puts space costs alone at $7,000 or higher per rack.
Using Lenovo ThinkServer Smart Grid Technology to implement power capping
can allow for many infrastructure savings. These savings include the following:
A lower up front cost, or capital expenditure (CAPEX)
Savings on expansion capacity if your data center is at or nearing maximum
capacity due to getting more servers into your same space
Energy saving costs. Typically, each watt of server power typically requires
another watt or more to power the cooling and power infrastructure.
Requiring fewer server racks and rack-based components as well as less
required datacenter square footage.
Trim underutilized infrastructure by sizing with power caps and save on CAPEX and OPEX Over-configured power components hurt your CAPEX budget. Some traditional
methods suggest sizing based off the server nameplate power. These methods can lead
to improperly sized power capacity that goes unused, increasing both upfront and
operational cost.
Using our test servers as an example, the Lenovo ThinkServer RD630 server has
a nameplate power of 800 watts. However, our 100 percent workload testing with no
power cap used an average of 404 watts. In this instance, using the nameplate estimate
would create an infrastructure almost double the capacity you need to run our tested
workload without a power cap. With an underutilized infrastructure, you pay more for
underutilized circuits, cooling and equipment. Because the Lenovo ThinkServer Smart
Grid Technology holds maximum power consumption near any applied power cap, we
can use the power cap rather than the much higher nameplate power to size the
infrastructure and save on cost.
Balance power during power events It is important to consider how your data center can respond to an unplanned
power or thermal event. Using a power management program like Lenovo ThinkServer
Smart Grid Technology allows emergency power features. These features allow the data
center administrator to implement an emergency power cap that keeps the servers up
and operating –at a lower performance level– while requiring less power to do so. This
can reduce end-user downtime and lead to significant operational savings.
A Principled Technologies test report 14
Power management: Lenovo ThinkServer Smart Grid Technology
CONCLUSION Using Lenovo ThinkServer Smart Grid Technology with Intel Node Manager
Technology allows you to plan, observe, and manage your power utilization on Lenovo
servers. In processor-intensive workloads, you can lower power and achieve increased
performance per watt for maximum efficiency. In IO-intensive workloads, where unused
processor utilization exists, you can increase server density per rack (per unit power)
and recoup unused power without significantly affecting overall performance. These
and the other features of Lenovo ThinkServer Smart Grid Technology offer new flexible
and powerful ways for administrators to manage data center power usage and control
costs.
A Principled Technologies test report 15
Power management: Lenovo ThinkServer Smart Grid Technology
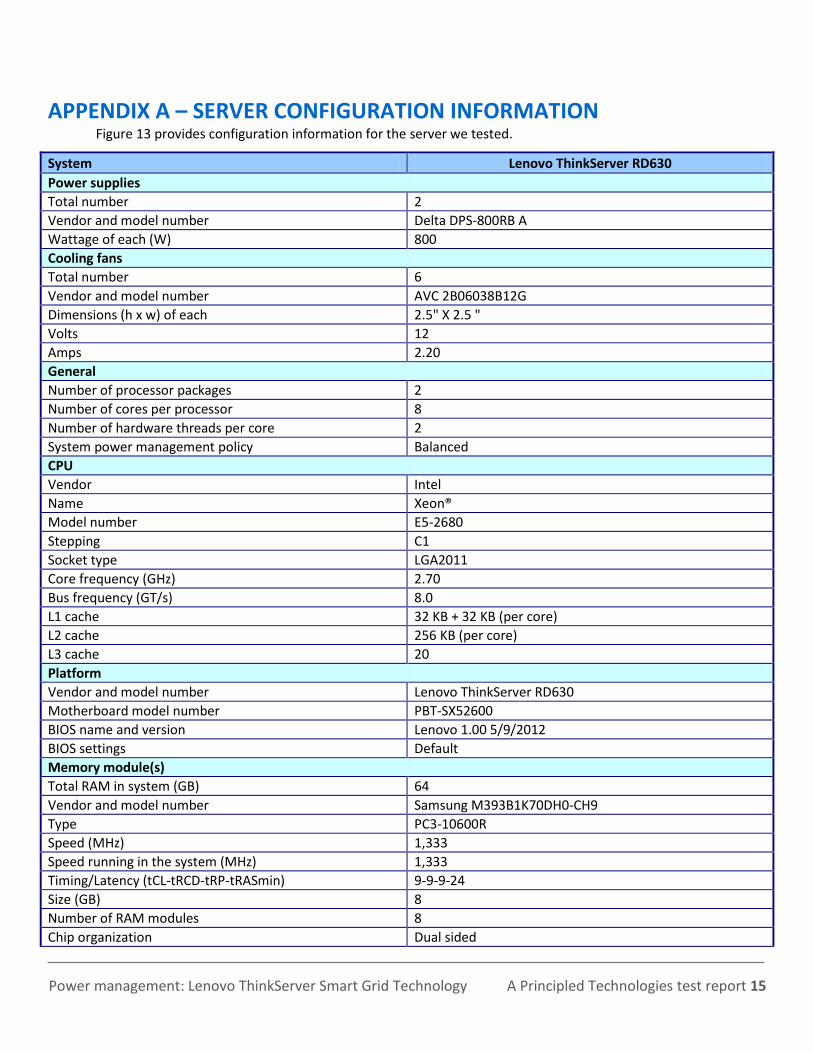
APPENDIX A – SERVER CONFIGURATION INFORMATION
Figure 13 provides configuration information for the server we tested.
System Lenovo ThinkServer RD630
Power supplies
Total number 2
Vendor and model number Delta DPS-800RB A
Wattage of each (W) 800
Cooling fans
Total number 6
Vendor and model number AVC 2B06038B12G
Dimensions (h x w) of each 2.5" X 2.5 "
Volts 12
Amps 2.20
General
Number of processor packages 2
Number of cores per processor 8
Number of hardware threads per core 2
System power management policy Balanced
CPU
Vendor Intel
Name Xeon®
Model number E5-2680
Stepping C1
Socket type LGA2011
Core frequency (GHz) 2.70
Bus frequency (GT/s) 8.0
L1 cache 32 KB + 32 KB (per core)
L2 cache 256 KB (per core)
L3 cache 20
Platform
Vendor and model number Lenovo ThinkServer RD630
Motherboard model number PBT-SX52600
BIOS name and version Lenovo 1.00 5/9/2012
BIOS settings Default
Memory module(s)
Total RAM in system (GB) 64
Vendor and model number Samsung M393B1K70DH0-CH9
Type PC3-10600R
Speed (MHz) 1,333
Speed running in the system (MHz) 1,333
Timing/Latency (tCL-tRCD-tRP-tRASmin) 9-9-9-24
Size (GB) 8
Number of RAM modules 8
Chip organization Dual sided
A Principled Technologies test report 16
Power management: Lenovo ThinkServer Smart Grid Technology
System Lenovo ThinkServer RD630
Rank Dual
Operating system
Name Microsoft Windows Server® 2008 R2
Build number 7601
File system NTFS
Language English
RAID controller
Vendor and model number LSI® MegaRAID™ SAS 9260-8i
Driver version LSI 4.5.0.64
Cache size 512 MB
Hard drive # 1
Vendor and model number Lenovo 67Y2621
Number of disks in system 2
Size (GB) 600
Buffer size (MB) 32
RPM 10,000
Type SAS
Hard drive # 2
Vendor and model number STEC M16ISD2-200UCP
Number of disks in system 3
Size (GB) 200
Buffer size (MB) N/A
RPM N/A
Type SATA SSD
Ethernet adapters
Vendor and model number Intel I350 Gigabit Network Adapter
Type Integrated
Driver Intel 11.14.43.0
Optical drive(s)
Vendor and model number DS8D4SH
Type DVD-ROM
USB ports
Number 6
Type USB 2.0
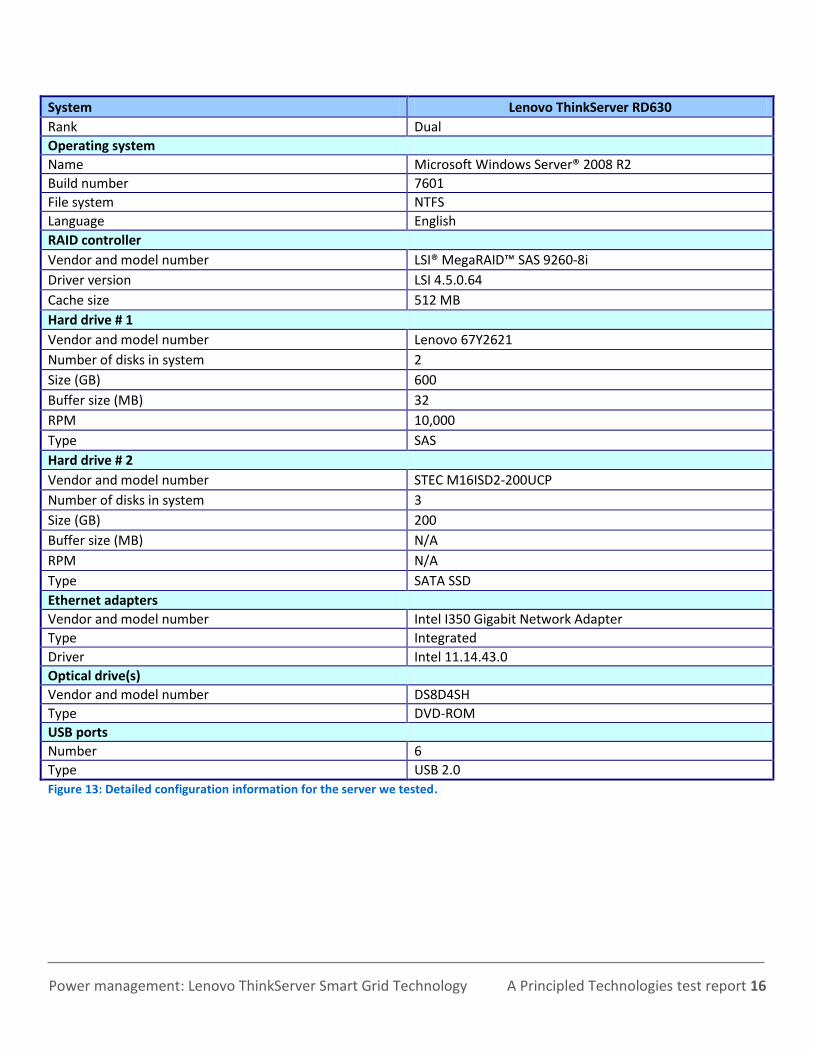
Figure 13: Detailed configuration information for the server we tested.
A Principled Technologies test report 17
Power management: Lenovo ThinkServer Smart Grid Technology
APPENDIX B – DATABASE WORKLOAD We used a Lenovo ThinkServer RD630 as the system under test. We configured it with two 600GB SAS drives in a
RAID 1 for the Windows Server 2008 R2 operating system and installed three SSD drives for all database traffic.
The steps below show how we configured the two Lenovo ThinkServer RD630 server for testing.
Installing Windows Server 2008 R2 Enterprise Edition We installed a fresh copy of Windows Server 2008 R2 Enterprise Edition on both servers. We used the same
network setup steps and ran Windows updates on both.
1. Boot the server, and insert the Windows Server 2008 R2 installation DVD in the DVD-ROM drive. 2. At the Language Selection screen, click Next. 3. Click Install Now. 4. Select Windows Server 2008 R2 Enterprise (Full Installation), and click Next. 5. Click the I accept the license terms check box, and click Next. 6. Click Custom. 7. At the Where to Install Windows screen, click Drive options (advanced). 8. Ensure you select the proper drive, and click New. 9. Enter the partition size, and click Apply. (We used the entire disk.) 10. At the pop-up informing you Windows will create additional partitions, click OK. 11. At the Where to Install Windows screen, click Next. 12. At the User’s password must be changed before logging on warning screen, click OK. 13. Enter a password as the new password in both fields, and click the arrow to continue. 14. At the Your password has been changed screen, click OK.
Setting up the network configuration on the server
1. Click StartControl PanelNetwork and InternetNetwork and Sharing Center, and click Change Adapter Settings.
2. Right-click on the network adapter, and select Properties from the drop-down menu. 3. Select Internet Protocol Version 4 (TCP/IPv4), and click Properties. 4. At the Internet Protocol Version 4 (TCP/IPv4) Properties screen, select the Use the following IP address radio
button. 5. Enter a valid static IP address, subnet mask, and default gateway. 6. Click OK to close the window. 7. At the Local Area Connection Properties window, click Close. 8. Close the Network Connection window.
Installing system updates in Windows Server 2008 R2
We installed all critical updates on the server using the Windows Update feature.
Installing SQL Server 2012 We used the following steps to install four instances of SQL Server 2012 on the Lenovo ThinkServer RD630.
1. Insert the installation DVD. 2. Click Run SETUP.EXE. If Autoplay does not begin the installation, navigate to the SQL Server 2012 DVD, and
double-click. 3. If the installer prompts you with a .NET installation prompt, click Yes to enable the .NET Framework Core role. 4. In the left pane, click Installation.
A Principled Technologies test report 18
Power management: Lenovo ThinkServer Smart Grid Technology
5. Click New SQL Server stand-alone installation or add features to an existing installation. 6. At the Setup Support Rules screen, wait for the rule check to complete. If there are no failures or relevant
warnings, click OK. 7. Select the Specify a free edition and select Evaluation from the drop-down menu. Click Next. 8. Click the checkbox to accept the license terms, and click Next. 9. If no failures are displayed after the setup support files are installed, click Next. 10. At the Setup Role screen, choose SQL Server Feature Installation. 11. At the Feature Selection screen, select Database Engine Services, Full-Text and Semantic Extractions for Search,
Client Tools Connectivity, Client Tools Backwards Compatibility, Management Tools – Basic, and Management Tools – Complete. Click Next.
12. At the Installation Rules screen, click Next after the check completes. 13. At the Instance configuration screen, choose a named instance, specify an instance name, and click Next. 14. At the Disk Space Requirements screen, click Next. 15. At the Server Configuration screen, choose system accounts, such as NT Service\MSSQLSERVER, for SQL Server
services. Click Next. 16. At the next error-checking screen, click Next. 17. At the Database Engine Configuration screen, select Mixed Mode. 18. Enter and confirm a password for the system administrator account. 19. Click Add Current user. This may take several seconds. 20. Click Next. 21. At the Error-and usage-reporting screen, click Next. 22. At the Installation Configuration Rules screen, check that there are no failures or relevant warnings, and click
Next. 23. At the Ready to Install screen, click Install. 24. After installation completes, click Close. 25. Repeat steps 5-24 to install second SQL Server instance using MSSQLSERVER2 as the instance name. Continue
this process for SQL Server instance three and four. 26. Close the installation window.
Setting up the storage on the server
We used the steps below to configure the three SSD drives. We configured the drives in the RAID controller
properties prior to following these steps. We configured the drives into drive volumes. One two-disk RAID 0 and one
single disk.
1. In the taskbar, click the Server Manager icon. 2. In the left pane, expand Storage, and click Disk Management. 3. Right-click the first volume, and choose Initialize Disk. 4. In the right pane, right-click the volume, and choose New Simple Volume… 5. At the welcome window, click Next. 6. At the Specify Volume Size window, leave the default selection, and click Next. 7. At the Assign Drive Letter or Path window, choose a drive letter, and click Next. 8. At the Format Partition window, choose NTFS and 64K allocation unit size, and click Next. 9. At the Completing the New Simple Volume Wizard window, click Finish. 10. Repeat steps 3 - 9 for the additional volume.
A Principled Technologies test report 19
Power management: Lenovo ThinkServer Smart Grid Technology
Installing and configuring the database clients For the DS2 scripts, we used a dual-socket server with two Intel Xeon E5-2680 2.7GHz processors and 64GB of
system memory as clients to simulate a number of users putting a load on the server. We installed Windows Server 2008
R2 Enterprise Edition on the server as outlined in the steps above. We installed the .NET 4.0 framework on the server as
the DS2 test executable requires. After the installation, we created four folders on the server with a DS2 executable in
each. We opened four command prompts and running one of the four executable in each command prompt window.
Creating scripts on the database clients To simplify testing, we created batch files named test.bat in all four folders to start the DVD Store executable
with the correct parameters. We put the batch files in a folder on the clients in the following directory: c:\clientshare1 -
c:\clientshare4. The batch files contained the following text:
Note: we changed the folder path and client output file name for each of the four executable. Client share 2 - 4
had the server instance after the IP address. For example, clientshare2 target was 192.168.30.186\MSSQLSERVER2
c:\Lenovo_1\clientshare1\ds2sqlserverdriver.exe --target=192.168.30.186 --
ramp_rate=10 --run_time=10 --n_threads=32 --db_size=10GB --think_time=0 --
detailed_view=Y --warmup_time=5 --pct_newcustomers=20 >NUL
2>c:\Lenovo_1\clientshare1\client1.csv
Setting up DVD Store version 2.1
Data generation overview
We generated the data using the Install.pl script included with DVD Store version 2.1, providing the parameters
for our 10GB database size and the database platform on which we ran - Microsoft SQL Server 2012. We ran the
Install.pl script on a utility system running Linux. The Install.pl script also generated the database schema.
After processing the data generation, we transferred the data files and schema creation files to a Windows-
based system running SQL Server 2012. We built the 10GB database in SQL Server 2012, and then performed a full
backup, storing the backup file on the C: drive for quick access. We used that backup file to restore on the server
between test runs.
The only modification we made to the schema creation scripts were the specified file sizes for our database. We
deliberately set the file sizes higher than necessary to ensure that no file-growth activity would affect the outputs of the
test. Besides this file size modification, we created and loaded the database schema according to the DVD Store
documentation. Specifically, we followed the steps below:
1. We generated the data and created the database and file structure using database creation scripts in the DS2 download. We made size modifications specific to our 10GB database and the appropriate changes to drive letters.
2. We transferred the files from our Linux data generation system to a Windows system running SQL Server. 3. We created database tables, stored procedures, and objects using the provided DVD Store scripts. 4. We set the database recovery model to bulk-logged to prevent excess logging. 5. We loaded the data we generated into the database. For data loading, we used the import wizard in SQL Server
Management Studio. Where necessary, we retained options from the original scripts, such as Enable Identity Insert.
A Principled Technologies test report 20
Power management: Lenovo ThinkServer Smart Grid Technology
6. We created indices, full-text catalogs, primary keys, and foreign keys using the database-creation scripts. 7. We updated statistics on each table according to database-creation scripts, which sample 18 percent of the
table data. 8. On the SQL Server instance, we created a ds2user SQL Server login using the following Transact SQL (TSQL)
script: USE [master]
GO
CREATE LOGIN [ds2user] WITH PASSWORD=N’’,
DEFAULT_DATABASE=[master],
DEFAULT_LANGUAGE=[us_english],
CHECK_EXPIRATION=OFF,
CHECK_POLICY=OFF
GO
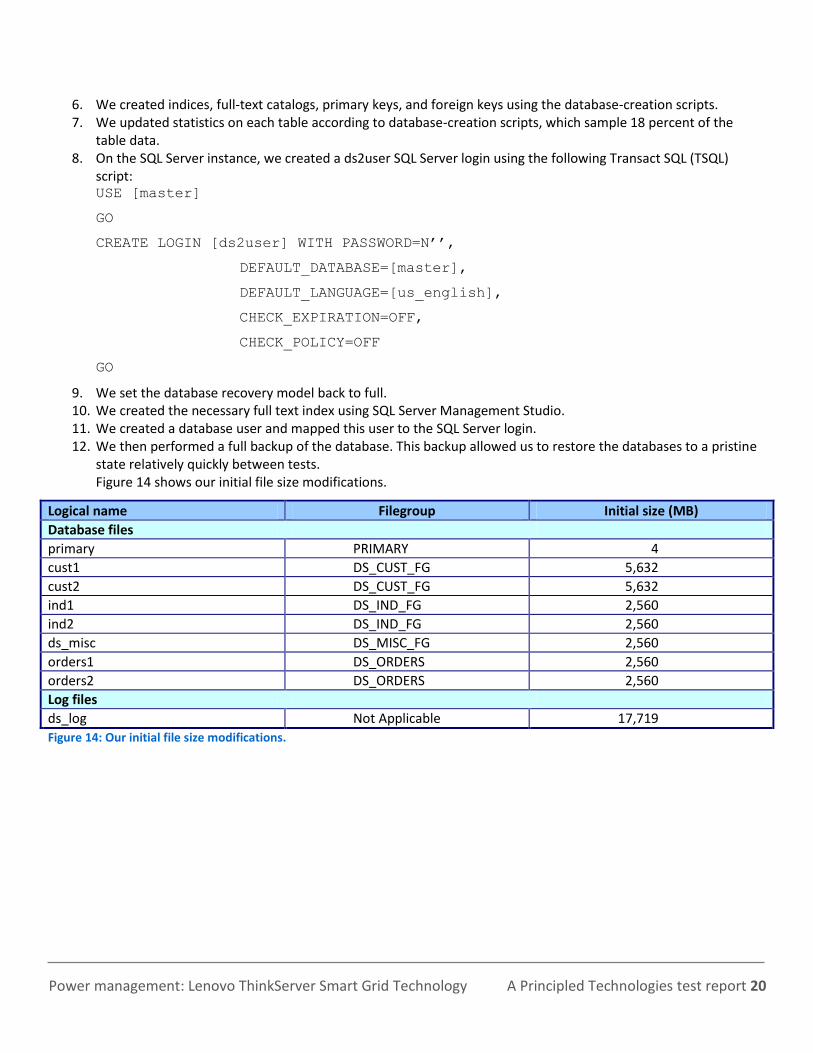
9. We set the database recovery model back to full. 10. We created the necessary full text index using SQL Server Management Studio. 11. We created a database user and mapped this user to the SQL Server login. 12. We then performed a full backup of the database. This backup allowed us to restore the databases to a pristine
state relatively quickly between tests. Figure 14 shows our initial file size modifications.
Logical name Filegroup Initial size (MB)
Database files
primary PRIMARY 4
cust1 DS_CUST_FG 5,632
cust2 DS_CUST_FG 5,632
ind1 DS_IND_FG 2,560
ind2 DS_IND_FG 2,560
ds_misc DS_MISC_FG 2,560
orders1 DS_ORDERS 2,560
orders2 DS_ORDERS 2,560
Log files
ds_log Not Applicable 17,719
Figure 14: Our initial file size modifications.

A Principled Technologies test report 21
Power management: Lenovo ThinkServer Smart Grid Technology
APPENDIX C – MEASURING POWER Measuring workload power
To record each server’s power consumption during the workload test, we used an Extech Instruments®
(www.extech.com) 380803 Power Analyzer/Datalogger. We connected the power cord from the server under test to the
Power Analyzer’s output load power outlet. We then plugged the power cord from the Power Analyzer’s input voltage
connection into a 120-volt power outlet.
We used the Power Analyzer’s Data Acquisition Software (version 2.11) to capture all recordings. We installed
the software on a separate Intel processor-based PC, which we connected to the Power Analyzer via an RS-232 cable.
We captured power consumption at one-second intervals.
To gauge the power usage with no OS activity, we recorded the power usage for 2 minutes while each server
was running the operating system but no applications running.
We then recorded the power usage (in watts) for each server during the testing at one-second intervals. To
compute the average power usage, we averaged the power usage during the time the server was producing its peak
performance results. We call this time the power measurement interval.
A Principled Technologies test report 22
Power management: Lenovo ThinkServer Smart Grid Technology
ABOUT PRINCIPLED TECHNOLOGIES
Principled Technologies, Inc. 1007 Slater Road, Suite 300 Durham, NC, 27703 www.principledtechnologies.com
We provide industry-leading technology assessment and fact-based marketing services. We bring to every assignment extensive experience with and expertise in all aspects of technology testing and analysis, from researching new technologies, to developing new methodologies, to testing with existing and new tools. When the assessment is complete, we know how to present the results to a broad range of target audiences. We provide our clients with the materials they need, from market-focused data to use in their own collateral to custom sales aids, such as test reports, performance assessments, and white papers. Every document reflects the results of our trusted independent analysis. We provide customized services that focus on our clients’ individual requirements. Whether the technology involves hardware, software, Web sites, or services, we offer the experience, expertise, and tools to help our clients assess how it will fare against its competition, its performance, its market readiness, and its quality and reliability. Our founders, Mark L. Van Name and Bill Catchings, have worked together in technology assessment for over 20 years. As journalists, they published over a thousand articles on a wide array of technology subjects. They created and led the Ziff-Davis Benchmark Operation, which developed such industry-standard benchmarks as Ziff Davis Media’s Winstone and WebBench. They founded and led eTesting Labs, and after the acquisition of that company by Lionbridge Technologies were the head and CTO of VeriTest.
Principled Technologies is a registered trademark of Principled Technologies, Inc. All other product names are the trademarks of their respective owners.
Disclaimer of Warranties; Limitation of Liability: PRINCIPLED TECHNOLOGIES, INC. HAS MADE REASONABLE EFFORTS TO ENSURE THE ACCURACY AND VALIDITY OF ITS TESTING, HOWEVER, PRINCIPLED TECHNOLOGIES, INC. SPECIFICALLY DISCLAIMS ANY WARRANTY, EXPRESSED OR IMPLIED, RELATING TO THE TEST RESULTS AND ANALYSIS, THEIR ACCURACY, COMPLETENESS OR QUALITY, INCLUDING ANY IMPLIED WARRANTY OF FITNESS FOR ANY PARTICULAR PURPOSE. ALL PERSONS OR ENTITIES RELYING ON THE RESULTS OF ANY TESTING DO SO AT THEIR OWN RISK, AND AGREE THAT PRINCIPLED TECHNOLOGIES, INC., ITS EMPLOYEES AND ITS SUBCONTRACTORS SHALL HAVE NO LIABILITY WHATSOEVER FROM ANY CLAIM OF LOSS OR DAMAGE ON ACCOUNT OF ANY ALLEGED ERROR OR DEFECT IN ANY TESTING PROCEDURE OR RESULT. IN NO EVENT SHALL PRINCIPLED TECHNOLOGIES, INC. BE LIABLE FOR INDIRECT, SPECIAL, INCIDENTAL, OR CONSEQUENTIAL DAMAGES IN CONNECTION WITH ITS TESTING, EVEN IF ADVISED OF THE POSSIBILITY OF SUCH DAMAGES. IN NO EVENT SHALL PRINCIPLED TECHNOLOGIES, INC.’S LIABILITY, INCLUDING FOR DIRECT DAMAGES, EXCEED THE AMOUNTS PAID IN CONNECTION WITH PRINCIPLED TECHNOLOGIES, INC.’S TESTING. CUSTOMER’S SOLE AND EXCLUSIVE REMEDIES ARE AS SET FORTH HEREIN.