a profile of human resource management in multinational · pdf filemanagement in multinational...
TRANSCRIPT
i
_____________________________________________________________________
A Profile of Human Resource Management in Multinational
Enterprises Operating in Australia
Anthony McDonnell, Helen Russell, Gitika Sablok, John
Burgess, Pauline Stanton, Timothy Bartram, Brendan
Boyle & Karen Manning

ii
TABLE OF CONTENTS
Acknowledgements .......................................................................................................... iii
Abbreviations .................................................................................................................... iv
List of tables ....................................................................................................................... v
List of figures .................................................................................................................... vi
Contributors ...................................................................................................................... ix
Executive summary ........................................................................................................... 1
Section 1: Introduction and methodology ....................................................................... 9
Section 2: The characteristics of MNEs in Australia ....................................................... 14
Section 3: The HR function ............................................................................................. 29
Section 4: Pay and performance management .............................................................. 41
Section 5: Training, development and talent management .......................................... 54
Section 6: Global staffing and organisational learning................................................... 66
Section 7: Employee involvement and communications ............................................... 73
Section 8: Employee representation and consultation .................................................. 82
Section 9: Conclusion...................................................................................................... 91
References ...................................................................................................................... 93

iii
Acknowledgements This study of human resource management (HRM) practices in multinational enterprises (MNEs) in Australia was only made possible through the cooperation of a large number of people and institutions.
First and foremost, we acknowledge the senior HR executives in over 210 MNEs. We thank each of you for your time and insights on HRM practice in your respective organisations.
To complete the fieldwork phase of this study we had the assistance of a number of excellent research assistants. In particular, we wish to acknowledge the contribution of Parth Patel, Rhea Thrift, Susan Ward, Jessica Rubenstein and Marjorie O’Neill. We also thank Tina Morganella for her assistance in bringing this report together.
A research project of this capacity requires adequate finance. We thank the Faculty of Business and Law and Centre for Institutional and Organisational Studies (CIOS), University of Newcastle. In particular, we wish to thank Professor Stephen Nicholas, Professor Gordon Boyce and Associate Professor Jim Jose. We thank the School of Management and Information Systems and the Faculty of Business and Law, Victoria University for their support in this regard. We also thank Dr. Anne Vo, University of Wollongong and Dr. Zeenie Hannif, University of Technology Sydney for their assistance.
We acknowledge the assistance of the Australian Human Resource Institute (AHRI), and particularly Peter Wilson and Anne Marie Dolan, in promoting the relevance of this study to the Australian HR community and for highlighting the importance of academic enquiry of this nature.
Finally, we wish to thank our international partners in the study for their assistance at various junctures of the project.
iv
Abbreviations
ESOS = Employee Share Ownership Scheme
FD = Forced Distribution
FDI = Foreign Direct Investment
GDP = Gross Domestic Product
HR = Human Resources
HRIS = Human Resource Information System
HRM = Human Resource Management
IR = Industrial Relations
IT = Information Technology
JCC = Joint Consultative Committee
KG = Key Group
LOG = Largest Occupational Group
MNE = Multinational Enterprise
OECD = Organisation for Economic Trade and Development
OHS = Occupational, Health and Safety
PCN = Parent Country National
PPM = Pay and Performance Management
PRP = Performance Related Pay
ROE = Rest of Europe
ROW = Rest of World
R&D = Research and Development
T&D = Training and Development
TCN = Third Country National
UK = United Kingdom
UNCTAD = United Nations Commission for Trade and Development
US = United States of America

v
List of tables
Table 1.1 Sources used to develop the population of MNEs in Australia ...................... 11
Table 1.2 The Australian MNE population...................................................................... 12
Table 2.1 Employment in MNEs ..................................................................................... 18
Table 2.2 Employment numbers for the key group, managers, LOG ............................. 19
Table 2.3 Strategy by which the worldwide company competes .................................. 25
Table 7.1 Pattern of employee involvement across Australian locations ...................... 74
Table 7.2 Forms of communications with the LOG ........................................................ 75
Table 7.3 Communications mechanism by country of origin ......................................... 76
Table 7.4 Extent to which information is reported to the LOG ...................................... 78
Table 8.1 Services utilised from employer/industry associations .................................. 89
Table 8.2 Percentage of MNEs that have had direct dealings with the following groups over employment issues ................................................................................................. 89

vi
List of figures
Figure 2.1 MNE respondents by country of origin ......................................................... 15
Figure 2.2 Sectors which MNEs in Australia operate ..................................................... 16
Figure 2.3 Dominant sector of operation of the Australian subsidiaries ....................... 17
Figure 2.4 Recognition of a key group according to country of origin ........................... 19
Figure 2.5 Date the current ultimate controlling company first established in Australia (foreign MNEs only) ........................................................................................................ 20
Figure 2.6 Date of internationalisation of indigenous MNEs ......................................... 21
Figure 2.7 Number of sites MNEs have in Australia ....................................................... 22
Figure 2.8 MNEs that have invested in a new site/expanded existing sites in Australia in the previous five years by sector .................................................................................... 22
Figure 2.9 Types of international business structures ................................................... 23
Figure 2.10 Most important business structures in the worldwide company ............... 24
Figure 2.11 Integration between Australian and non-Australian operations by country of origin ........................................................................................................................... 25
Figure 2.12 Factors impacting new investments or mandates for Australia (mean values) ............................................................................................................................. 27
Figure 2.13 Changes in the Australian operations since 2007 as a result of the GFC .... 28
Figure 3.1 The number of people employed in the HR function of the Australian operations ....................................................................................................................... 30
Figure 3.2 Use of an HRIS among MNEs in Australia ...................................................... 31
Figure 3.3 Use of an HRIS among MNEs in Australia by country of origin ..................... 31
Figure 3.4 Use of an HRIS among MNEs in Australia by sector ...................................... 32
Figure 3.5 Use of HR shared services centres by MNEs in Australia .............................. 32
Figure 3.6 Use of HR shared services centres by country of origin ................................ 33
Figure 3.7 Use of HR shared services centres by sector ................................................. 33
Figure 3.8 Geographical coverage of HR shared services centres ................................. 34
vii
Figure 3.9 Existence of an international HR policy formulation committee .................. 34
Figure 3.10 Existence of an international hr policy formation committee by country of origin ............................................................................................................................... 35
Figure 3.11 Existence of international networks between HR managers from different country operations ......................................................................................................... 35
Figure 3.12 International networking between HR managers in different country operations ....................................................................................................................... 36
Figure 3.13 Monitoring by higher organisational levels (foreign MNEs) ....................... 37
Figure 3.14 Monitoring by Australian HQ over foreign operations (indigenous MNEs) 37
Figure 3.15 Approaches to workforce management (agree/strongly agree answers) .. 38
Figure 3.16 Extent to which traditions in the country of origin have an overriding influence on the approach to the management of employees ..................................... 39
Figure 3.17 HR strategic approach in MNEs ................................................................... 39
Figure 4.1 Pay policy of MNEs ........................................................................................ 42
Figure 4.2 Pay policy by country of origin ...................................................................... 43
Figure 4.3 Pay policy by the dominant sector of the MNE in Australia ......................... 43
Figure 4.4 Use of a formal performance appraisal by country of origin ........................ 44
Figure 4.5 Presence of a single integrated appraisal system by country of origin ........ 45
Figure 4.6 Forced distribution for the LOG, key group and managers by country of origin ............................................................................................................................... 46
Figure 4.7 360-degree appraisal by country of origin .................................................... 46
Figure 4.8 Methods of performance evaluation by country of origin (mean values) .... 47
Figure 4.9 Performance related pay for the LOG, key group and managers by country of origin ............................................................................................................................... 48
Figure 4.10 Financial participation for LOG, key group and managers .......................... 49
Figure 4.11 Employee share ownership schemes by country of origin ......................... 49
Figure 4.12 Profit sharing by country of origin ............................................................... 50
Figure 4.13 Share options by country of origin .............................................................. 50
Figure 4.14 Discretion over pay and performance policy in Australian operations (foreign MNEs) ................................................................................................................ 51
Figure 4.15 Discretion over pay and performance management policy in overseas operations (indigenous MNEs) ....................................................................................... 52
Figure 5.1 Training and development expenditure in MNEs ......................................... 55
Figure 5.2 MNEs in Australia undertaking talent management by country of origin .... 57
Figure 5.3 Elements of talent management system ...................................................... 58
Figure 5.4 Elements of talent management system by country of origin ...................... 58
Figure 5.5 Focus of talent management system by country of origin (means) ............. 59

viii
Figure 5.6 Formal succession planning in the Australian operations by country of origin ........................................................................................................................................ 60
Figure 5.7 Formal management development in the Australian operations by sector . 61
Figure 5.8 Formal management development in the Australian operations by country of origin ........................................................................................................................... 61
Figure 5.9 High potential development mechanism use by country of origin (means) . 62
Figure 5.10 Discretion over T&D policy in Australian operations (foreign MNEs) ......... 63
Figure 5.11 Discretion over T&D policy in overseas operations (indigenous MNEs) ..... 64
Figure 6.1 Percentages of MNEs with PCNs and TCNs ................................................... 67
Figure 6.2 Percentages of expatriates from Australian operations in parent country HQ and third-country Operations......................................................................................... 69
Figure 6.3 Percentages of MNE utilising each organisational learning mechanisms ..... 70
Figure 6.4 Importance of the learning outcome associated with learning mechanism 71
Figure 7.1 Employee involvement practices .................................................................. 74
Figure 7.2 What is the most important communication mechanism? .......................... 77
Figure 7.3 How often management act on employee suggestions? .............................. 78
Figure 7.4 Discretion of the Australian operations over the determination of employee involvement and communication policy ........................................................................ 79
Figure 7.5 Discretion afforded to the foreign operations of Australian owned MNEs over the determination of employee involvement and communication’s policy ......... 80
Figure 8.1 Trade union recognition in Australian operations ........................................ 83
Figure 8.2 Trade union recognition by country of origin ............................................... 84
Figure 8.3 Trade union recognition in new Australian sites in the past five years ........ 84
Figure 8.4 Changes have taken place in trade union recognition since acquisition(s) over the past five years .................................................................................................. 85
Figure 8.5 The role of trade unions in managing organisational change ....................... 86
Figure 8.6 Percentage of the log in the Australian operations covered by union and non-union collective bargaining, award only and individual level bargaining ............... 87
Figure 8.7 Membership of employer/industry associations .......................................... 88
Figure 8.8 Discretion of the Australian operations over the determination of employee representation and consultation policy ......................................................................... 90

ix
Contributors
Dr. Anthony McDonnell, School of Management, University of South Australia received his PhD from the University of Limerick, Ireland. His primary research interests include talent management, global staffing and more generally, HRM in multinationals. His work has been published in journals such as, Human Resource Management (US), Human Relations, Journal of Business and Psychology, Journal of World Business and Human Resource Management Journal [[email protected]].
Ms. Helen Russell, PhD candidate, School of Management and Information Systems, Victoria University. Ms. Russell is currently investigating how multinational enterprises undertake talent management in Australia. Her other research interest is in the area of strategic human resource management. Helen holds a Bachelor of Education and Training, Graduate Certificate in Educational Studies and a Master of Education awarded from the University of Melbourne [[email protected]].
Ms. Gitika Sablok, PhD candidate, School of Management and Information Systems, Victoria University. Her research interests include human resource management, international Management and more specifically, employee involvement in MNEs. She holds a DipBus and BBus Honors from La Trobe University [[email protected]].
Professor John Burgess, School of Management, Curtin University of Technology has an extensive research record on employment developments, HRM, the labour market, gender and work, and labour regulation. John has published extensively in outlets including the International Journal of Human Resource Management, Personnel Review and Journal of Industrial Relations and has co-edited 14 Special Journal Issues [[email protected]].
Professor Pauline Stanton, School of Management and Information Systems, Victoria University has over eighty peer reviewed publications in a wide range of international and domestic journals and books including the British Journal of Industrial Relations, International Journal of Human Resource Management and Human Resource Management Journal. Professor Stanton’s research focuses on high performance work systems, performance management and employee involvement/employee voice [[email protected]].

x
Associate Professor Timothy Bartram, School of Management, La Trobe University has an extensive research record in the area of HRM and employment relations. He has published in the Journal of Management Studies, British Journal of Industrial Relations, Human Resource Management Journal and International Journal of Human Resource Management. He is currently the co-editor of the Asia Pacific Journal of Human Resources and co-author of Human Resource Management: Strategy, People, Performance textbook, 4th Edition [[email protected]].
Dr Brendan Boyle, Newcastle Business School, University of Newcastle, Australia received his PhD from the Discipline of International Business, University of Sydney. His primary research interests include international assignments, knowledge flows in MNEs, restructuring of MNEs activities and HRM in MNEs. He has published research papers on knowledge creation and knowledge sharing in MNEs in number of international journals [[email protected]].
Dr Karen Manning, School of Management and Information Systems, Victoria University has researched and published in the area of internationalisation. This work has focused on particular industries and management strategies for internationalisation including publications in International Journal of Knowledge, Culture and Change Management and Journal of International Development. She has also worked internationally with organisations in developing individualised strategies that assist in delivering improved HRM services [[email protected]].

1
Executive summary
Section 1: Introduction and Methodology
The study had four objectives:
- to carry out an innovative and comprehensive survey of HRM practice in organisational context based on a representative sample of MNEs in Australia;
- to analyse HRM practice across the main substantive areas in relation to three distinct categories of employees and relate variations in practice to organisational structure and strategy;
- to provide an accurate picture of the organisation and management practice in MNEs;
- to contribute to policy debates on the extent to which MNEs are pursuing common agendas and are able to impose these agendas on the countries in which they operate.
A total of 211 structured interviews were held with the most senior HR representative of MNEs in Australia, an overall response rate of 40 per cent.
40 were Australian owned-MNEs with the remaining 171 foreign-owned.
Section 2: The characteristics of multinational enterprises in Australia
By country of origin the US, Australia and Japan were the most prevalent MNEs. Despite discussion in the media, representation from China and India is quite low.
MNEs typically have multi-sector operations. The survey found that the top three sectors for MNEs were retail and wholesale trade; financial and business services; and ICT services.
More than one quarter of the MNEs have worldwide operations of more than 60,000 and could be classified as large. Foreign-owned MNEs tend to be the larger in worldwide terms with 50 per cent of foreign MNEs employing more than 30,000 compared to 25 per cent of indigenous MNEs.

2
Some 60 per cent of MNEs identified a key group in the Australian operations of MNEs. This group varied across the MNEs with engineers, business development employees, sales personnel and R&D staff typically the most common categories identified.
The data shows that the majority of foreign MNEs are quite new to Australia. The method of establishing operations in Australia was evenly shared between acquisition of any existing business and establishing a new (greenfield) operation. Australian owned MNEs were more likely to have first internationalised through a merger or acquisition.
The overwhelming majority of MNEs in Australia, both foreign and indigenous owned, are multi-site operations. Not surprisingly, Australian MNEs tend to have the greatest number of sites in Australia. More than three quarters of the MNEs operate in excess of ten countries.
One quarter of MNEs were privately owned and three quarters were a publicly listed company. German MNEs were the most likely to report private ownership and MNEs in the engineering/consultancy sector were the most likely to be privately owned.
In terms of the business structures of MNEs, multiple structures were common while the dominant form was that of a regional structure.
There was evidence of integration between the Australian operations and other worldwide operations of the MNE. Around three quarters of MNEs reported that other operations of the worldwide company supply components, products or services to the Australian operations. Over one half of Australian MNEs supplied components, products or services for some or all of the worldwide company’s non-Australian operations.
In terms of the positioning of Australian MNEs in the international value chain the evidence suggests that the majority of Australian operations do not possess key strategic functions, such as R&D, in the international operations.
In terms of factors inhibiting or enhancing investment decisions in Australia, labour costs and operating costs were the most negatively viewed factors amongst the respondents. The quality of infrastructure, availability of skilled labour, financial incentives, environmental regulations and access to raw materials were all more positively viewed.
In response to the GFC the main response of MNEs was to adjust short term expenditures rather than embark on long term structural change. The main responses were reduced international travel, training and recruitment.
Chapter 3: The HR function and control
More than six in ten MNEs employ between 1-9 people in their HR function.
Forty-two per cent of all foreign-owned MNEs in Australia make use of an HRIS that keeps data on the global workforce. The equivalent figure for Australian-owned MNEs was 47.5 per cent.

3
HR shared services centres are utilised in 72.5 per cent of Australian MNEs but only 37 per cent of foreign-owned MNEs. Amongst foreign-owned firms, shared services centres were more common in UK MNEs. The majority of firms with HR shared services centres reported that they serve operations other than those in Australia.
Seven in ten MNEs in Australia report the presence of a body with a mandate to develop HR policies on an international basis. These international HR policy-making bodies were most prevalent in US MNEs.
Significant networking occurs between HR managers from different country operations in MNEs. Face-to-face meetings were common as were annual conferences.
In respect to what areas were monitored by higher organisational levels, managerial pay, career progression, selection of the top management team, labour costs and headcount were the most commonly cited by respondents.
The majority of respondents reported the country of origin of the firm had an overriding effect on how employees were managed.
Section 4: Pay and performance management
The majority of MNEs aim to pay their employees at the median/midpoint (compared to market comparators). Almost 65 per cent of MNEs for managers and the LOG and 55 per cent of MNEs that recognise a key group reported that they pay at the median/midpoint
Asian owned MNEs are the most likely to have a pay policy in the first or second quartile.
A greater proportion of MNEs in the services sector aim to be in the first or second quartile compared to firms which operate across sectors or those in the manufacturing sector.
The use of a formal performance appraisal for staff is now almost a given in MNEs and the majority reported that they utilise a single integrated appraisal scheme across the different employee categories
US MNEs and Asian MNEs were the most likely to indicate the use of forced distribution to the results of performance appraisals. Asian MNEs along with US and UK MNEs were also the most likely to report the use of 360-degree feedback.
The findings showed that MNEs in Australia use a range of individual and group, as well as qualitative and quantitative performance measures when evaluating managers’ performance.
Financial participation schemes are most commonly available to managers, followed by the key group but less likely to be provided to the LOG.
Australian owned MNEs were particularly prominent in the use of employee share ownership schemes whereas no Japanese MNE indicated they offer such a scheme or share options to any of its employees in Australia.

4
Section 5: Training, development and talent management
The majority of MNEs in Australia spent between one and four per cent of their pay bill on training and development (T&D) for their workforce in the past twelve months.
German MNEs are the biggest spenders which is consistent with comparative UK research.
Concern with respect to skills shortages in Australia was not particularly prominent although there is no room for complacency on the issue.
85 per cent of MNEs reported that they undertake talent management which typically involves the identification of pivotal positions and the use of talent pools.
Japanese MNEs are considerably less likely to undertake talent management compared to other MNEs.
Relatively low use (41 per cent) of a differentiated HR architecture based on the strategic importance of the talent pools was found.
The primary focus of talent management in MNEs is on developing broad competencies that allow individuals fill a range of positions rather than only narrow, specialist roles.
Formal succession planning and management development programmes for high potentials are in situ in the vast majority of MNEs and tend to be globally oriented.
UK and French MNEs are the most likely to undertake formal succession planning whilst Japanese and Asian MNEs are the least likely.
The assessment of performance against global management competencies and formal global management training are extensively used with Australian owned MNEs seemingly lower users compared to others.
A development programme for the key group was common with 61 per cent indicating this to be the case which is similar to that found in the comparative Irish study and considerably more than what the comparative UK research found.
Section 6: Global staffing and organisational learning
The use of parent country nationals (PCNs) in the Australian subsidiaries of foreign MNEs is common. 53 per cent of MNEs reported the use of expatriates from the corporate headquarters. This global staffing practice is most common amongst Japanese MNEs.
43 per cent of MNE surveyed reported the use of third-country nationals (TCNs) as part of their staffing of the Australian operation.
70 per cent of MNEs in Australia reported the use of PCNs or TCNs in their subsidiaries.
That the use of parent country expatriates is a prevalent in global staffing practice, despite the cost of such postings, illustrates the perceived importance of these postings to MNEs.

5
Staff outflows are also a feature of global staffing in the foreign MNEs operating in Australia. 65 per cent of foreign MNEs reported having Australian expatriates in either the parent country HQ or a third-country operation.
Outward flow of staff from the Australian subsidiary is more likely to occur to third-country subsidiaries than to parent operations.
The movement of PCNs to Australian subsidiaries is much more common than the movement of Australian expatriates to parent country operations.
International staff flows are also common in indigenous-owed MNEs, with 84 per cent reporting the use of Australian expatriates in their foreign operations and 61 per cent hosting staff from their foreign operations in Australia.
The most utilised international assignment forms in order are short term assignments (81 per cent), long term assignments (79 per cent), virtual assignments (74 per cent) and international frequent flyer assignments (73 per cent).
Informal networks and international project groups or task forces are the most commonly utilised organisational learning mechanisms in MNEs, with 80 per cent reporting the use of these.
International project groups or task forces was most often selected as the most important international organisational learning mechanism used.
International assignments are also as a learning mechanism utilised to considerable extent, with 66 per cent of MNEs reporting the use of assignments as an organisational learning mechanism.
The most important learning outcome is the generation of new knowledge followed by the goal of best practice dissemination.
Section 7: Employee involvement and communication
There is widespread use of employee involvement practices. 82 per cent of the respondents stated that the LOG were organised into teams in which employees had responsibility for organising their own work. 83 per cent of the MNEs indicated that the LOG were organised into groups where employees discussed issues of quality, production or service delivery.
In terms of the uniformity of communication systems across Australian operations, 44 per cent of the respondents had identical or similar patterns of employee involvement across all sites.
Both formal (through meetings) and informal (an open door policy) channels of communications are important. In comparison with the other forms of communications, joint consultative committees and suggestion schemes were ranked as the least likely mechanisms to be used.
When we look at the different communications mechanisms by country of origin, the rankings between the communications systems are similar. Suggestion schemes and joint consultative committees are not used as much as the other

6
mechanisms across the board. German MNEs stand out in terms of the relative scores for being high on meetings and joint consultative committees and relatively low on attitude/opinion surveys, suggestion schemes, emails and the company intranet (the informal communications processes). There was no finding of US exceptionalism in communications processes from the Australian survey.
In terms of rating the communication mechanisms, by far the most important mechanism was meetings between line managers/supervisors and employees. Meetings between senior managers and the whole workforce were rated second, but well behind. The attitude and opinion surveys and JCCs were not commonly regarded as being important, reflecting their relatively low scores in terms of use as communication’s mechanisms.
Around three quarters of participants reported that employee suggestions were acted on often or sometimes. Only 9 per cent stated that they were regularly acted upon.
The survey asked about the type of information that was disclosed to the LOG. The financial situation of the MNEs local operations is often/regularly reported in 70 per cent of the responses. The comparable incidence for investment and staffing plans is around one quarter of responses; this distribution applies to both foreign and indigenous owned MNEs. The least regularly reported item to the LOG was the staffing plans of the Australian operations.
The local operations have quite a lot or complete control across most forms of communications processes. The area of least local autonomy is with respect to attitude or opinion surveys. Given that these are relatively unused form of communications this finding indicates that the opinion surveys have a strong head office involvement where they were applied.
Australian-owned MNEs reported that they grant least autonomy to their foreign operations with regard to attitude or opinion surveys. For the other forms of communications respondents tended to report that the foreign subsidiaries have quite a lot or complete discretion.
There was no evidence that US owned MNEs stood out in terms of the use of communications mechanisms, the provision of information to the LOG or the autonomy given to local operations regarding the communication systems.
Section 8: Employee representation and consultation
MNEs prefer direct employee representation and consultation with employees in their Australian operations. However, it is also clear that despite recent trends towards the growth in individual level and decentralized employment arrangements in Australia, union representation and collective employment arrangements still remain an important feature within the Australian landscape.
MNEs are still engaging with collective employee representation and consultation particularly in traditionally unionized sectors such as retail and wholesale, utilities and manufacturing.

7
Over 41 per cent reported that trade unions were not recognized at any sites. A further, 18.5 per cent of respondents indicated that all sites in the Australian operations recognized unions, whilst a further 15 per cent or so claimed that most sites recognized unions.
Seventy-five per cent of respondents indicated that the role of trade unions in managing organisational change was best described by the statement “discussions take place with union representatives in a way that their views are taken into account but management are free to make the final decision”.
Overwhelmingly, almost 86 per cent of HR managers reported that they either “agree” or “strongly agree” with the statement “management prefer to deal directly with employees”.
Forty-one per cent of respondents either “disagree” or “strongly disagree” with the statement “management would not mind dealing with unions should employees join one”. A total of 34.5 per cent of managers reported that they either “agree” or “strongly agree” with this statement.
Union collective bargaining covered 29 per cent of the LOG in the Australian operations, non-union collective bargaining covered 9 per cent of the LOG, whilst award only provision covered 18 per cent of the LOG. Furthermore, 48 per cent of the LOG in the Australian operations were covered by individual level arrangements.
Over 85 per cent of the Australian operations are members of an industry or employer association.
Sixty-three per cent of respondents reported that their Australian operations sought information on pay rates from their employer or industry association. Nearly 64 per cent reported that that their Australian operations sought advice on OHS from their employer or industry association. Almost 56 per cent reported that that their Australian operations sought advice on dismissals of their employer or industry association. Furthermore, almost 71 per cent, 64 per cent respectively sought advice on employment legislation and other legal matters.
Respondents reported that their company had direct dealings with the Australian Human Right Authority (20 per cent), indigenous community organizations (21 per cent), Fair Work Australia (75 per cent), alternative dispute resolution bodies (34 per cent) and the Equal Employment Opportunity in the Workplace Authority (67 per cent).
Seventy-one per cent of HR managers in foreign MNEs reported that they had full discretion over trade union recognition in their Australian operations. Moreover, 68 per cent of foreign MNEs reported full discretion over union involvement in management decision making, while 73 per cent stated that they had full discretion over employee consultation.

8
Section 9: Conclusions
US-owned firms are by some considerable distance the largest national grouping of MNEs in Australia. There are also a significant number of indigenous-owned MNEs now operating internationally. Similar to what has taken place in many other developed economies, the services sector accounts for the greatest proportion of MNEs operating in Australia.
There were some interesting country differences. For instance, almost all US MNEs had formal performance appraisal systems for all staff and were the most likely to use force distribution systems. Japanese MNEs were the least likely to report engagement in talent management and no Japanese MNEs offered employee share ownership schemes or share options. Asian MNEs were by some distance the most likely to have a pay policy in the top or second quartile for all employees. They were also one of the least likely to report the use of a formal system of succession planning and few Asian MNEs make use of inpatriate assignments.
It was difficult to establish, based on the analysis undertaken in this report, whether there is a discernible Australian approach to HRM in respect to the indigenous MNEs. In many cases, they are quite similar to some of the foreign MNEs but there were also some unexpected results such as the high utilisation of HR shared services centres.
Many of the findings in this study mirror those from comparative research conducted in the UK and Ireland, however there are also some notable differences. For example, MNEs in Australia appear more likely to have a formal succession planning system and management development programme for high potentials than MNEs in the UK and Ireland. Further, greater numbers of MNEs in Australia reported the use of PCNs or TCNs than in Ireland and the UK.
The report highlights a number of differences between MNEs of different nationality. In saying that, it is also important to highlight the similarity between MNEs from different countries over certain HR practices (e.g. strong similarity in the use of formal performance appraisals). A key conclusion is that while there are commonalities in the use of certain HR practices, there is no single model of MNE in operation.
MNEs should utilise this report to identify where they currently sit and then consider the following questions. First, if they are not using a practice, why aren’t they, and are there positive or negative consequences of this? Second, if they are using particular practices, are they achieving their objectives and are they integrated with other practices into a coordinated HR system?

9
Section 1: Introduction and methodology
Introduction
This wide-ranging study provides the first representative portrait of human resource management (HRM) policy and practice amongst multinational enterprises (MNEs) operating in Australia. This study forms part of a larger international project network called INTREPID which involves collaboration between research teams from Argentina, Canada, Denmark, Ireland, Mexico, Norway, Singapore, Spain, and the UK.
There were four overall aims to the study:
to carry out an innovative and comprehensive survey of HRM practice in organisational context based on a representative sample of MNEs in Australia;
to analyse HRM practice across the main substantive areas in relation to three distinct categories of employees, and relate variations in practice to organisational structure and strategy;
to provide an accurate picture of the organisation and management practice in MNEs;
to contribute to policy debates on the extent to which MNEs are pursuing common agendas and are able to impose these agendas on the countries in which they operate.
The survey focuses on six key international HRM areas, namely the HR function, pay and performance management, training, development and talent management, global staffing and organisational learning, employee involvement and communication and employee representation and consultation.
In addressing these six areas, the study is structured around three categories of staff. First ‘managers’, defined in the study as, ‘employees who primarily manage the organisation, or a department, subdivision, function, or component of the organisation and whose main tasks consist of the direction and coordination of the functioning of the organisation’. In other words managers are those above the level of first-line supervision. The second category was the ‘largest occupational group’ (LOG) defined as, ‘the largest non-managerial occupational group among the employees in the

10
‘headcount’ in Australia’. The final category of employees was the ‘key group’ defined as, ‘those employees whom you might identify as critical to your firm’s core competence and organisational learning. These might be research staff, product designers, major account handlers, developers of new markets, etc’.
We now briefly summarise the importance of MNEs in Australia following which we detail the research methodology employed.
Multinational enterprises in Australia
Globalisation is bringing about a reorganisation of power on the world, national and sub-national level (e.g. Phelps & Alden, 1999; Graham, 2003). Arguably the primary driver and embodiment of globalisation is the MNE. There are some 78,000 MNEs in the world today with more than 780,000 foreign subsidiaries. The employment statistics are even more remarkable with some 73 million employed by MNEs in 2006, an increase of 48 million since 1990 (UNCTAD, 2008a). Furthermore, of the world’s largest 150 economic entities, 95 (63 per cent) are corporations rather than countries (Butler, 2005). Thus, MNEs hold significant global influence.
Like many other economies, the MNE plays a critical role in Australia which has a Foreign Direct Investment (FDI) to Gross Domestic Product (GDP) ratio of almost 35 per cent, considerably higher than the 27 per cent average for comparable developed countries (UNCTAD, 2008b). Australia serves as both a major importer and exporter of FDI with 2007 inward flows of US$22,266 million and outward flows of some US$24,209 million (UNCTAD, 2008b). The total inward FDI stock in 2007 was US$312,275 million with an outward FDI stock of US$277,917 million. The US is Australia’s single most important source of inward FDI (it accounts for almost one quarter of all inward FDI), as well as a location for Australian FDI abroad, accounting for almost 43 per cent of all Australian outward investment (Foreign Investment Review Board, 2008). After the US, the UK, Japan, New Zealand and other European Union countries represent the other critical sources of FDI with varying degrees of importance with respect to inward and outward investment. China and India are critical trading partners in respect to natural resources and are now also beginning to become important countries for attracting FDI, in addition to being potentially lucrative locations for Australian organisations establishing overseas. Additionally, our analysis of the most recent World Investment Report’s Top 100 non-financial sector MNEs (by foreign assets) found that 67 have operations in Australia that employ 100 or more (UNCTAD, 2008b).
The next section will detail how MNEs operate across all key economic sectors. There are, however, whole sectors of the Australian economy such as motor vehicles and white goods that are dominated by MNEs and many of the organisations involved in utilising Australia’s vast natural resources are large MNEs.
Although there is now a vast amount of international literature on the HRM practices of MNEs available, studies in the Australian context are extremely limited (see McDonnell, Stanton, & Burgess, 2011). This is somewhat surprising given their economic importance, as highlighted above, and also considering Australia’s “political stability, a near-Asia location and a favourable business environment” which has made

11
it a location of choice for a significant number of MNEs (Johnston & Menguc, 2007, p. 791). We now detail the critical features of the research methodology employed in this study.
Research methodology
The primary aim of the study was to provide representative evidence of the HRM practices of MNEs in Australia. Consequently developing a comprehensive, reliable listing of all MNEs in Australia was a critical initial step. Definitions derived from the other international, comparative studies were adopted for this survey:
Foreign-owned MNE: all wholly or majority foreign-owned organisations operating in Australia, with 500 or more employees worldwide and 100 or more employed in their Australian operations.
Australian-owned MNE: all wholly or majority Australian-owned organisations with 500 or more employees worldwide and at least 100 employed abroad.
Identifying a comprehensive and accurate population of MNEs in Australia was a challenging process and not as straightforward as envisaged. A key reason behind the difficulty was the incomplete and inaccurate coverage of company database listings. Despite the significance of FDI and MNEs to the Australian economy there is no official data about their activities – a surprising finding in itself. As a result of issues surrounding the reliability and comprehensiveness of many of these databases, we constructed our own database listing using a large number of diverse sources (see Table 1 for a full list of all sources used).
Table 1.1 Sources used to develop the population of MNEs in Australia
Business Source Complete Data Monitor
Mint Global Database OneSource Database
FAME Database Dun & Bradstreet
Business Research Weekly Top 1000 Companies in Australia
American Chamber of Commerce Listing of US Firms in Australia
Top 150 Companies Listed on Australian Stock Exchange
Mayne Report of Foreign Firms in Australia
Mayne Report of Indigenous Firms with Foreign operations
Vault Top Australian Employers List
Indian Embassy List of Firms in Australia German Embassy List of Firms in Australia
Norwegian Embassy List of Firms in Australia
World Investment Report 2008 of Top 100 Infrastructure MNEs by foreign assets
World Investment Report 2008 of Top 100 non-financial MNEs by foreign assets
World Investment Report 2008 of Top 100 non-financial developing country MNEs

12
Australian Human Resource Institute (AHRI) List of Member Organisations
Graduate Careers in Australia Website List of Member Organisations
Forbes Top 2000 Companies 2007 for Australian Owned Organisations
Department of Foreign Affairs and Trade Country Profiles Listed main Organisations with operations in Australia
Kompass Business Week
The process of developing this listing required the research team to undertake an arduous, intense and time consuming review/cross-check of each of these listings. Each company was checked to establish if they met the definitional criteria and where the information was unavailable from these sources we sought it from either each company’s website, annual reports, press releases or we made contact with the company directly. Indeed some 600 phone calls were made during this process.
After completing this process we arrived at a population of 1,008 MNEs in Australia (see Table 2). Unsurprisingly, US owned MNEs were by some distance the largest category of MNEs, followed by Australian-owned and UK MNEs. The services sector emerged with the greatest number of MNEs with 554, followed by 392 manufacturing MNEs and 62 MNEs operating in the primary sector.
Table 1.2 The Australian MNE population
Country of Origin No. in Population Industry No. in Population
US 407 Services 554
Australia 168 Manufacturing 392
UK 90 Primary 62
Japan 71 Total 1008
Germany 49
France 39
Nordic 26
Asia 54
Rest of World 44
Rest of Europe 60
Total 1008
Once we had collated the total population, we then took a random stratified sample of 549 MNEs. We stratified the sample according to country of origin and sector. Of these, we subsequently lost 22 firms during the fieldwork due to merger and acquisition (M&A) activity, delisted or bankrupt companies or they did not in fact meet the definitional criteria set out in this study. Consequently, the final sample was 527.

13
The target respondent for the study was the most senior HR Practitioner – (e.g. HR Director, Senior/Group Head HR Manager), for the MNE in Australia. In other words, the aim was to interview the most senior HR representative able to answer specific questions on the HRM practices and policies of the organisation’s Australian operations. Consequently, this is an organisational rather than subsidiary level study. In the small number of cases where there was no overall company head office in Australia, we sought the most senior HR Practitioner for the largest division or site of the company in Australia.
The survey was administered through a structured face-to-face interview. This administration form was chosen because of its success in yielding better response rates compared to postal, online or telephone methods, as well as its ability to reduce the amount of missing data (McKnight, McKnight, Sidani, & Figueredo, 2007). The research team conducted the fieldwork which began in December 2009 and finished in February 2011. Interviews on average took between 35 and 50 minutes. A total of 211 usable interviews were obtained giving a total overall response rate of 40 per cent. Of the 211, 40 were Australian–owned MNEs with the remaining 171 foreign-owned. Due to the survey responses being largely representative of the total population we have not re-weighted the data for the purposes of this report. In the next section, in-depth information of the respondents will be provided.

14
Section 2: The characteristics of MNEs in Australia
Introduction
In the first section we outlined the significance of MNEs around the world in terms of trade and employment. This section focuses on the Australian context. Specifically, we identify the core characteristics of MNEs in Australia. This is important because one must consider the context before being able to understand the nature of HRM practice. This incorporates data on country of origin, sector, employment numbers and the means of internationalisation. We also examine the ownership and international business structures of MNEs in Australia. Some detail on the role and importance of MNEs in Australia is also provided. Of importance at a broader policy level we also highlight the factors determining whether the Australian operations receive new mandates or investments and the impact of the global financial crisis (GFC) on MNEs in Australia.
Core characteristics
Country of origin
There is a considerable body of literature that has highlighted the way that MNEs are ‘embedded’ in the country in which they originate (Almond & Ferner, 2006), suggesting that the organisational structures of firms rooted in different national business systems display major differences (Whitley, 2001). During the 1990s, research tended to demonstrate that the foreign subsidiaries of MNEs retain strong links to the parent country and their HRM practices are strongly shaped by their home business system (e.g. Doremus, Keller, Pauly & Reich, 1998). Japanese (e.g. Oliver & Wilkinson, 1988) and US companies (Almond et al., 2005) are often cited as examples of this effect. Consequently, the country of origin is a key factor in the way MNEs manage their international workforce (Ferner, 1997).

15
N = 211
Figure 2.1 MNE respondents by country of origin
The critical role played by US investment in the Australian economy is underpinned by our data with just over 38 per cent of all firms in the survey of American origin. This pattern of high US investment was also matched in the other comparative studies in this international project. For example, 40 per cent of all MNEs in the UK (Edwards, Edwards, Ferner, Marginson, & Tregaskis, 2007) and Ireland (Lavelle, McDonnell, & Gunnigle, 2009) were US owned, and the figure in Canada was 50 per cent (Belanger, Harvey, Jalette, Levesque & Murray, 2006). The high number of Australian owned MNEs (19 per cent) is also of note as they tend to receive less attention in the literature. As illustrated in Figure 2.1, there are a number of other nationalities represented but in smaller numbers. Japanese MNEs made up almost 9 per cent of all respondents, while over 6 per cent consisted of UK and German-owned. The relatively small percentage (6 per cent) of Asian MNEs (China, Hong Kong, Singapore and India) may be considered somewhat surprising. However, some of this may be explained by the fact that it is only in recent times that Australia has started to open its doors to Chinese investment while Indian MNEs are also just beginning to emerge. A recent OECD report (2010) suggests that Australian policy settings are not attractive for some foreign investors and proposes key reforms are needed in tax, infrastructure, early childhood education and workforce participation.
The breakdown of MNE respondents is in keeping with the overall population as illustrated in Table 1.1 in the previous section. Consequently, we have a representative response rate meaning we have not re-weighted the data.
Sector
MNEs in Australia are engaged in a wide-ranging number of industrial sectors with a number of organisations operating in more than one sector as illustrated in Figure 2.2. This graph depicts the answers for the question about which sectors the Australian operations of the MNE are engaged in. Therefore, multiple selections were allowed. Like most other developed economies and the results in the other comparative studies
0%
5%
10%
15%
20%
25%
30%
35%
40%
45%
US Japan UK Australia France Germany Asia ROE ROW

16
in this project, the services sectors are the most common. When one thinks of an MNE, they may not think of retail and wholesale trade but this was the sector with the highest number of MNEs. Some 27 per cent stated that they have such operations. Financial and business services (23 per cent), and information and communication technology services (21 per cent) were the other main services sectors. Some 17 per cent of MNEs also reported that they are engaged in engineering, computers and electrical, medical equipment manufacturing, 11 per cent in chemicals and pharmaceuticals, and 13 per cent in more traditional manufacturing (e.g. food and beverages, clothing). Unsurprisingly, considering Australia’s vast natural resources, approximately 15 per cent of respondent organisations were involved in mining.
N = 211. Note: Multiple selections were allowed
Figure 2.2 Sectors which MNEs in Australia operate
After establishing the fact that many MNEs are multi-sector operations we asked respondents to select the dominant sector (based on revenue generation) in which the Australian subsidiaries operate. The results (see Figure 2.3) change somewhat compared to the above figure. The financial and business services sector was the dominant sector of operation with almost 20 per cent reporting this, followed by almost 16 per cent in information and communication technology (ICT) services and 13 per cent of firms in the engineering, computers and medical device manufacturing sector. The most notable finding in respect to dominant sector and country of origin was that 54 per cent of UK MNEs were in financial and business services.
0%
5%
10%
15%
20%
25%
30%

17
N = 211.
Figure 2.3 Dominant sector of operation of the Australian subsidiaries
Employment
The size of the firm has long been noted as an important factor in HRM with larger organisations typically more formal in their policies and practices. Table 2.1 highlights that there are a broad range of MNEs, in terms of size, operating in Australia. More than one quarter have worldwide operations of more than 60,000 and could be classified as large MNEs. Indeed only 14 per cent had a global employment of less than 5,000. Foreign-owned MNEs tend to be the larger in worldwide terms with 50 per cent of foreign MNEs employing more than 30,000 compared to 25 per cent of indigenous MNEs.
Of particular interest to Australia is that almost 42 per cent of MNEs employ between 100 and 499, 17 per cent between 500 and 999, while the remaining 41 per cent have an Australian workforce of greater than 1,000. Opposite to the finding on worldwide size, it is the Australian owned MNEs who are the largest in terms of employees in Australia. Specifically, 40 per cent of Australian MNEs employ more than 5,000 in their home operations whereas just 8 per cent of foreign firms employ greater than 5,000 in their Australian operations. UK MNEs tend to be the largest foreign firms in Australia with over 23 per cent having employment in excess of 1,000.
7%1%
10%
13%
9%
20%
16%
3%
4%
11%
3% 2%
Mining
Utilities
Trad. Manuf.
Computer/Med. Devices Manuf
Chemicals/Pharma
Fin/Bus Services
ICT Services
Engineering/consultancy
Construction
Retail/Wholesale
Transport/Storage
Health

18
Table 2.1 Employment in MNEs
Worldwide Employment % of MNEs Australian Employment % of MNEs
500 – 999 employees 2 100 – 499 employees 42
1,000 – 4,999 employees 11 500 – 999 employees 17
5,000 – 29,999 employees 41 1,000 – 4,999 employees 27
30,000 – 59,999 employees 19 > 5,000 employees 14
> 60,000 employees 26
N = 211
Exploring Australian employment by dominant sector yielded expected results. Health (100 per cent), mining (67 per cent), engineering/consultancy (57 per cent) and construction (56 per cent) based MNEs were the most likely to indicate that they employed in excess of 1,000 in their Australian operations. Perhaps the most surprising result was that the retail sector MNEs were somewhat smaller with only 14 per cent employing more than 1,000.
We also explored changes in employment in the Australian operations over the previous three years. Utilising a five-point scale, we asked respondents to indicate the level of change in employment where 1=greatly decreased and 5=greatly increased. The picture that emerged was one of job churn in that a significant percentage of MNEs had reported a reduction in employment but a significant number of firms also reported an increase in employment. The mean score was 3.18. When one compares the increases in unemployment experienced in most developed economies over the last few years, this is a particularly positive result. Furthermore, respondents were asked to use the same scale to indicate changes in employment in manufacturing and R&D over the same time period. Mean scores of 2.93 and 3.11 were calculated for manufacturing changes and R&D respectively. The slightly negative result in manufacturing employment is not altogether surprising as there has been much evidence that organisations across the developed world are offshoring manufacturing activities to lower cost locations (Levy, 2005). However, the result here does not suggest that this has been a major issue for Australian industry in the past three years. Respondents were also asked about the extent to which they agreed or disagreed (1=strongly disagree; 5=strongly agree) to the statement, “safeguarding employees’ jobs is a high priority for our Australian operations”. The overall mean score was a 4.
The make-up of the workforce This survey explored HRM practices in respect to three categories of employees as explained in section one. The inclusion of managers and the LOG are common for studies of this type but the key group is more noteworthy and innovative (see also Edwards et al., 2007; Lavelle et al., 2009). Respondents were asked to indicate whether the Australian operations formally identified a key group of staff. Some 60 per cent answered that they did which is quite similar to the figure found in the comparative Irish study (52 per cent) although much less than the UK (80 per cent). The nature of the key group unsurprisingly varied from MNE to MNE with engineers, business development employees, sales personnel and R&D staff typically the most common categories identified. The number of employees in each group (see Table 2.2) tended

19
to be on the small side with over one quarter possessing less than 25 employees and a further 39 per cent of those recognising a key group saying it consisted of between 25 and 99 staff.
Table 2.2 Employment numbers for the key group, managers, LOG
Number of Employees % Key Group % Managers % LOG
1-9 employees 12 6 -
10 – 24 employees 14 24 5
25 – 99 employees 38 35 20
100 – 249 employees 16 14 23
250 – 499 employees 7 8 16
> 500 employees 12 14 36
N = 125 (key group); 211 (managers and LOG)
There seems to be some interesting country differences (see Figure 2.4) regarding the identification of a key group. French MNEs (30 per cent) were the least likely to recognise a key group with Australian (70 per cent), UK (69 per cent) and Japanese (67%) the most likely.
N = 209
Figure 2.4 Recognition of a key group according to country of origin
There appears to be few noteworthy differences in the recognition of a key group with the exception of two sectors, one of which seems surprising. Specifically, MNEs in the engineering and consultancy sectors were the least likely to recognise a key group – only 29 per cent do so. This is a surprise given the nature of the work (high-skilled and value) often involved in these types of companies. MNEs in the transport/storage sector were the other category with only 29 per cent reporting a key group. There were minimal differences between the other sectors.
0%
10%
20%
30%
40%
50%
60%
70%
80%
US Japan UK Australia France Germany Asia ROE ROW

20
Respondents were also asked about their utilisation of casual employees because it is an employment form that continues to receive attention in the popular media with trade unions concerned over the employment conditions for such staff. Just in excess of one quarter of respondents indicated that they have increased or greatly increased their utilisation of casuals in the previous five years. Nineteen per cent reported they had deceased or greatly decreased their use while 56 per cent have had no change. Unfortunately we don’t have data on the percentage of the workforce which are casuals but the significant number of firms increasing their use is worthy of follow-up investigation.
Vintage of foreign MNEs in Australia and method of establishment
The data shows that the majority (56 per cent) of foreign MNEs are quite new to Australia (post 1980). Twenty-one per cent of current MNEs first established in the 1961 – 1980 period and the remaining 24 per cent have operated since pre-1960. It is important to note that some Australian operations may have existed somewhat longer because the question only asked about the current parent company. We found that this was the situation in 42 per cent of cases.
N = 169
Figure 2.5 Date the current ultimate controlling company first established in Australia (foreign MNEs only)
The method by which the MNE establishes in a country has proved to be quite an important factor in explaining HRM practice. For instance, Gamble (2003) has noted that subsidiaries established by a greenfield site are more likely to follow the parent country’s practice. The method of establishment is almost 50:50 with 47 per cent indicating the current company established through a greenfield investment, 49 per cent by a acquisition M&A and the final 4 per cent selected other (e.g. joint venture). Little difference was found between the nationality of MNE and method of establishment although French MNEs were considerably the most likely to have used the M&A method (80 per cent).
24%
21%
56%
Pre 1960
1961 - 1980
1981 to 2010
21
Vintage of Australian MNEs and method of internationalisation
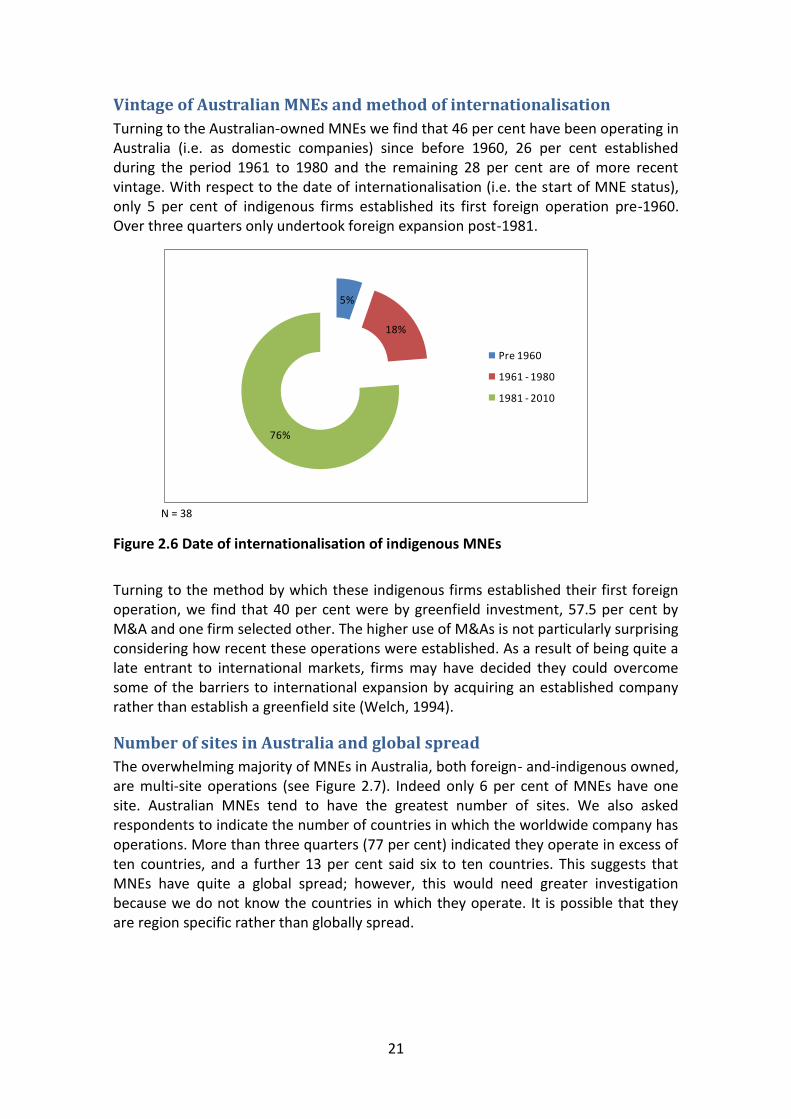
Turning to the Australian-owned MNEs we find that 46 per cent have been operating in Australia (i.e. as domestic companies) since before 1960, 26 per cent established during the period 1961 to 1980 and the remaining 28 per cent are of more recent vintage. With respect to the date of internationalisation (i.e. the start of MNE status), only 5 per cent of indigenous firms established its first foreign operation pre-1960. Over three quarters only undertook foreign expansion post-1981.
N = 38
Figure 2.6 Date of internationalisation of indigenous MNEs
Turning to the method by which these indigenous firms established their first foreign operation, we find that 40 per cent were by greenfield investment, 57.5 per cent by M&A and one firm selected other. The higher use of M&As is not particularly surprising considering how recent these operations were established. As a result of being quite a late entrant to international markets, firms may have decided they could overcome some of the barriers to international expansion by acquiring an established company rather than establish a greenfield site (Welch, 1994).
Number of sites in Australia and global spread
The overwhelming majority of MNEs in Australia, both foreign- and-indigenous owned, are multi-site operations (see Figure 2.7). Indeed only 6 per cent of MNEs have one site. Australian MNEs tend to have the greatest number of sites. We also asked respondents to indicate the number of countries in which the worldwide company has operations. More than three quarters (77 per cent) indicated they operate in excess of ten countries, and a further 13 per cent said six to ten countries. This suggests that MNEs have quite a global spread; however, this would need greater investigation because we do not know the countries in which they operate. It is possible that they are region specific rather than globally spread.
5%
18%
76%
Pre 1960
1961 - 1980
1981 - 2010

22
N = 208
Figure 2.7 Number of sites MNEs have in Australia
Respondents were also asked whether any site had been closed in Australia in the previous five years and whether Australian operations have been involved in any significant investments in establishing new, or expanding existing sites. Eighteen per cent reported the closure of one site and 23 per cent more than one, meaning the majority (59 per cent) have not. Australian-owned MNEs were the most likely to indicate they had closed one or more sites with 61 per cent of respondents stating this was the case. Positively, some 61 per cent answered that they have been involved in a significant investment in a new site and/or expanded an existing site in the previous five years. Country of origin differences were not particularly apparent but there appears to be some interesting sectoral findings as illustrated in Figure 2.8. MNEs in the mining/utilities sectors were the most likely to indicate investments which is unsurprising given that the resource sector was one of the best performing in recent years and was a key reason behind Australia being relatively unaffected by the GFC.
N = 211
Figure 2.8 MNEs that have invested in a new site/expanded existing sites in Australia in the previous five years by sector
6%
34%
26%
12%
21%
One site
2 - 5 sites
6 - 10 sites
11 - 20 sites
> 20 sites
0%
10%
20%
30%
40%
50%
60%
70%
80%
90%
100%

23
A potentially positive result for Australian industry was that 68 per cent of respondents disagreed or strongly disagreed that the Australian operations were moving activities to lower cost countries, 12 per cent stated that they neither agreed nor disagreed while 19 per cent agreed/strongly agreed.
Ownership and the international business structures and strategies of MNEs
Quite a high number of MNEs were privately owned (25 per cent) rather than being a publicly listed company (75 per cent). German MNEs were the most likely to report private ownership (54 per cent) with Australian (15 per cent), French (20 per cent) and US (20 per cent) firms the least likely. MNEs in the engineering/consultancy sector (57 per cent) were the most likely to be privately owned.
Turning to the international business structures, we found that multiple structures were common as illustrated in Figure 2.9. The most common were regional structures (86 per cent of MNEs), followed by international product, service or brand based divisions with 83 per cent of MNEs highlighting their existence. Lower numbers of MNEs in the UK reported the presence of these structures (Edwards et al., 2007). For example, a little over 60 per cent of MNEs stated they had international product, service or brand based divisions.
N = 210
Figure 2.9 Types of international business structures
Almost 55 per cent of MNEs reported all four structures while a further 24 per cent had three and a further 12 per cent had two. There was 1 per cent who reported having none of these structures and 8 per cent with just one. Australian (60 per cent) and German (67 per cent) MNEs were less likely to report three or four of these structures compared to other MNEs. For instance, 92 per cent of UK MNEs have three or four of these business structures, 90 per cent of French and 89 per cent of US firms.
We also asked respondents whether one structure was more important than others within the worldwide company. Figure 2.10 shows that more people classified international product, service or brand based divisions as the most important (28 per
83%
86%79%
76% International Product/Service Divisions
Regions
Global Business Functions
National Subsidiary Companies

24
cent) compared to others. However, 22 per cent reported that no one division was more important than the other and there was a further 21 per cent that selected global business functions.
N = 210
Figure 2.10 Most important business structures in the worldwide company
Our final question regarding international business structures was whether they had Australian headquarters (HQ). Despite being the most prevalent structure, only 7 per cent reported that there was an HQ in Australia. However, almost 25 per cent of MNEs with regional structures have an Australian HQ whilst 6 per cent indicated a global business function was headquartered in Australia.
Table 2.3 signifies how the MNE looks to compete internationally. These are adaptations of Porter’s (1985) business-level strategies. As evident, there is no one set model being utilised by MNEs. Almost 16 per cent compete through a low-cost standardisation strategy which seeks location economies by performing value creation activities in optimal locations worldwide. A further 27 per cent adopt a localisation strategy which focuses on customising products to national markets. Thirty-nine per cent of MNEs reported that they adopt a strategy to simultaneously achieve the previously mentioned approaches and to foster multi-directional flows of knowledge between subsidiaries. Finally, 18 per cent undertake a replication strategy where firms sell products/services that are developed in the home market internationally with minimal customisation. Country of origin differences do not seem particularly significant as typically MNEs of the same nationality are represented by each type of strategy.
0%
5%
10%
15%
20%
25%
30%
International Product/Service
Divisions
Regions Global Business Functions
National Subsidiary
Companies
No one level is more important

25
Table 2.3 Strategy by which the worldwide company competes
Strategy % of MNEs
A low-cost standardisation strategy which seeks location economies by performing value creation activities in optimal locations worldwide.
16
A localisation strategy which focuses on customising products to national markets.
27
A strategy to simultaneously achieve (a) and (b) and to foster multi-directional flows of knowledge between subsidiaries.
39
A replication strategy where firms sell products/services that are developed in the home market internationally with minimal customisation.
18
N = 202
There was evidence of integration between the Australian operations and other worldwide operations of the MNE. Approximately 74 per cent of MNEs reported that other operations of the worldwide company supply components, products or services to the Australian operations. On the other side, 56 per cent noted that the components, products or services of the Australian operations were produced for some or all of the worldwide company’s non-Australian operations. Some interesting country of origin differences seem to exist in regard to integration as illustrated in Figure 2.11. Australian MNEs were the most likely (74 per cent) to report the Australian operations supply components, products or services to other operations in the worldwide operations but were one of the least likely (50 per cent) to report the opposite relationship (i.e. worldwide operations supplying Australia). The foreign-owned firms were far more likely to indicate that they are supplied components, products or services from other worldwide units.
N = 208
Figure 2.11 Integration between Australian and non-Australian operations by country of origin
0%
10%
20%
30%
40%
50%
60%
70%
80%
90%
100%
Aus. Operations supply other worldwide operations
Worldwide operations supply Australia

26
The role the Australian operations play within the corporate value chain of the MNE is of particular relevance for public policy makers as typically countries want to move up the value chain. In other words, they wish to attract high value jobs. We used two proxy measures to indicate the strategic role of the Australian operations. First, we asked the foreign MNEs about the extent to which they had international responsibility for one or more products/services on behalf of the worldwide company. Just over 30 per cent agreed or strongly agreed with this statement and 65 per cent disagreed or strongly disagreed that they held such responsibility. These figures are considerably less than the equivalent result from the UK (52 per cent agreed/strongly agreed they had international responsibility) study (Edwards et al., 2007). This suggests that a greater number of foreign MNEs in the UK have more strategic roles than MNEs in Australia. However, when considering this finding it is important to be aware that respondents may tend to over-emphasise the importance of their operations within the worldwide company.
Second, we asked foreign MNEs whether significant expertise in R&D within the worldwide company is generated by the Australian operations. The results were quite similar with 24 per cent agreeing or strongly agreeing and 60 per cent disagreeing or strongly disagreeing.
In regard to the indigenous MNEs, we asked respondents about their international operations. Over half (55 per cent) agreed or strongly agreed that their international operations held responsibility for one or more products or services on their behalf. With respect to the extent to which their foreign operations have significant R&D expertise, some 23 per cent agreed. Forty-five per cent disagreed or strongly disagreed with this.
Exploring the factors impacting new investments or mandates
There is no doubting the importance of MNE investment to the Australian economy. Therefore, understanding the perceptions of high level managers in these organisations on how various factors impact on whether new investments or mandates are given to the Australian operations rather than some other location is important. We asked respondents to indicate the extent to which the factors in Figure 2.12 are positive or negative in terms of the Australian operations receiving new investments or mandates. A five-point scale was used where 1=very negative factor and 5=very positive.
Unsurprisingly, labour costs and operating costs were the most negatively viewed factors amongst the respondents with a mean score of 2.56 and 2.66 respectively. The quality of infrastructure, availability of skilled labour, financial incentives availability, environmental regulations and access to raw materials were all more positively viewed. The industrial relations (IR) climate was viewed somewhat negatively and may indicate unease with the way legislation has changed quite significantly on more than one occasion in the past twenty years.

27
N varies from 201 to 211
Figure 2.12 Factors impacting new investments or mandates for Australia (mean values)
The impact of the GFC on HRM in MNEs
The GFC has been acutely felt in most economies around the world. Australia was one of just a handful of countries that never officially went into recession. However, that is not to say that organisations in this country were not impacted. For instance, many MNEs reported having undergone worldwide reviews with major restructuring and redundancies reported in some cases.
Typically in times of organisational crises it has been HR and training and development (T&D) that are often the easy targets and this is what the data here once again suggests to be the case (see Figure 2.13). Some 60 per cent of respondents indicated that there was reduced recruitment activity since the middle of 2007 as a result of the GFC. Fifty-one per cent reported reduced T&D while half of all MNEs said that employment had fallen. International travel was the most hit with over 70 per cent stating this had been reduced. On a positive note, relatively few respondents reported outsourcing and offshoring or site closures directly as a result of the GFC.
0
0.5
1
1.5
2
2.5
3
3.5
4

28
N varies from 208 to 210
Figure 2.13 Changes in the Australian operations since 2007 as a result of the GFC
Conclusions
The review of the MNEs’ profile and the characteristics of their operations in Australia reveal some expected and unexpected results, and many interesting findings. American MNEs dominate the country of origin profile, but we found evidence of a strong Australian domiciled MNE group, but very little evidence of Indian or Chinese MNEs. On average MNEs are found in the services sector. This may seem surprising but on reflection it represents the dominate sector in terms of output and employment in the Australian economy. The international MNEs that have operations in Australia are large global organisations, with over half employing more than 30,000 persons worldwide. In terms of their vintage the majority of MNEs are recent (the last 20 years) in terms of their Australian operations or their international operations (for Australian MNEs).
In terms of the strategic findings from this section there was evidence that the majority of MNEs have multi-site operations in Australia and have their operations organised on a regional basis. Establishment in Australia by MNEs was shared between new investments and acquisitions of existing businesses. While there is extensive integration between Australian and international operations it is unlikely (except in the case of Australian MNEs) that Australian operations will be net providers of goods and services to other international divisions. The evidence on Australia’s position in the global value chain of MNEs suggests that on average the Australian operations are not located at the high-end of the value chain. There is a need for further enquiry on this. In terms of the impact of the GFC on Australian operations the survey found that there was evidence of short-term cost-cutting, but an absence of longer term structural adjustments. Finally, the survey identified key factors that promote (e.g. infrastructure, skills, raw materials) and retard (e.g. labour and operating costs) investment in the Australian operations.
0%
10%
20%
30%
40%
50%
60%
70%
80%

29
Section 3: The HR function
Introduction
HR departments of large companies have been under increasing pressure to become more strategic in their approach in order to improve organisational effectiveness by linking the people management strategy to organisational strategy. In theory, less time spent on transactional and operational tasks creates enhanced opportunities for HR departments to focus on a more value added strategic approach. Hence there has been greater emphasis on improving efficiency and effectiveness of HR departments through restructuring operations and the establishment of shared services, greater utilisation of information technology and devolving HR responsibilities to line management. In MNEs, because of their global nature, questions arise as to the integration of HR across the worldwide enterprise and whether the use of shared services and information technologies lead to increased central control and impact on the relationship between the HQ and the local subsidiary.
Research into the roles of national operations within MNEs has distinguished between those that are autonomous, those that are controlled from above and those that are the source of information and resources for other sites (e.g. Gupta & Govindarajan, 2000). In relation to the HR function parallel UK and Irish studies, Edwards et al. (2007, p. 17) and Lavelle et al. (2009, p. 63) note three potential scenarios:
An autonomous HR function: where the national operations are ‘left to their own devices’, reporting to senior management in the host country but with limited reporting beyond the national level.
A controlled HR function: where national level HR is tightly controlled and monitored by higher levels of management outside the host country (at regional, divisional or corporate level).
A limited autonomy HR function: a variant of the ‘controlled HR function’ where host country operations have some influence on the crafting of international HR policies and are not simply implementers of policies developed outside the host country.

30
In this section, we consider evidence about the nature and role of the HR function in MNEs and the instruments through which MNEs seek to coordinate and control HR policy and practice across borders.
Size of the HR function in MNEs
In the survey respondents were asked about the number of people employed in the HR function in MNEs. Just over 60 per cent employ between one and nine people with a little over 10 per cent of MNEs reporting an HR function in excess of fifty people.
N= 211
Figure 3.1 The number of people employed in the HR function of the Australian operations
Human resource information systems and HR shared services centres
An important feature of the organisation of the international HR function is the extent of the utilisation of electronic HR information systems (HRIS) and the use of shared services centres. These two areas have undoubtedly been key developments in HR service provision over the past few decades. In particular the application of IT to HR issues has opened up new possibilities for standardised service delivery. Evans, Pucik, Bjorkman (2011, p. 577) note three responses to HR service delivery:
the automation of transactional processes allows self-help, shifting the worker to the user of e-HR tools
services can be offered by HR service centres, often with regional or even global scope
appropriate HR transactional tasks can be outsourced.
Respondents were asked whether the worldwide company had an “HR Information System (such as PeopleSoft or SAP HR) that holds data relating to the firm’s international workforce”. Figure 3.2 illustrates that 60 per cent of MNEs indicated the
0%
10%
20%
30%
40%
50%
60%
70%
1-9 10-19 20-29 30-49 50 plus

31
use of an HRIS covering the worldwide company’s workforce. Sixty-three per cent of foreign MNEs reported the use of an HRIS and 48 per cent of Australian MNEs. In comparison, the Irish MNE study found that just over half (54 per cent) of all MNEs reported the use of HRIS operating on an international basis (Lavelle et al., 2009), whilst the UK study found 52 per cent had one in operation (Edwards et al., 2007).
N= 211
Figure 3.2 Use of an HRIS among MNEs in Australia
In Figure 3.3 we break down the use of an HRIS by the MNE’s country of origin. We find that US-owned MNEs were the most likely to have an HRIS system and Japanese firms the least likely. This country of origin finding is largely consistent with the comparative UK and Irish studies (Edwards et al., 2007; Lavelle et al., 2009).
N=211
Figure 3.3 Use of an HRIS among MNEs in Australia by country of origin
63%
48%
60%Foreign MNEs
Indigenous MNEs
All MNEs
0%
10%
20%
30%
40%
50%
60%
70%
80%
90%
US
Japan
UK
Australia
France
Germany
Asia
ROE
ROW

32
In relation to sectoral differences, MNEs in the chemical and pharmaceutical sector were the most likely to report an HRIS. None of the health sector MNEs reported their use although there were only a small number of firms in this sector.
N= 211
Figure 3.4 Use of an HRIS among MNEs in Australia by sector
HR shared services centres gained some degree of popularity in the 1990s. Together with an HRIS they promise economies of scale and specialisation as, potentially, activities can be moved and conducted from a single location. Edwards et al. (2007, p. 18) note that data on the existence of ‘shared services’ across countries provide an indicator of the extent to which the HR function is integrated across countries. The findings on the overall use of shared services centres by MNEs in Australia are outlined in Figure 3.5. Forty-four per cent of MNEs in Australia currently use shared services centres. This is slightly more than found in the Irish study where 39 per cent of respondents indicated the use of shared service centres (Lavelle et al., 2009) but less than the UK study which found 52 per cent of MNEs with such HR shared services centres (Edwards et al., 2007).
N= 211
Figure 3.5 Use of HR shared services centres by MNEs in Australia
0%
10%
20%
30%
40%
50%
60%
70%
80%
90%
100%
Mining
Utilities
Trad Manufacturing
Comp/Med Devices
Chem/Pharma
Fin Services
ICT Services
Engineering
Construction
Retail
Transport
37%
72.5%
44%
Foreign MNEs
Indigenous MNEs
All MNEs

33
Focusing more particularly on country of origin, Figure 3.6 shows that Australian MNEs are the most likely to use HR shared services centres followed by UK-owned MNEs. These findings are quite different to the UK study which found that over 60 per cent of US-owned MNEs operated HR shared services centres.
N= 211
Figure 3.6 Use of HR shared services centres by country of origin
Turning to sector (Figure 3.7), we found no utilisation of HR shared services centres amongst utilities and engineering sector MNEs and low usage in the retail and transport sector.
N=211
Figure 3.7 Use of HR shared services centres by sector
Respondents were also asked to indicate whether shared services centres were global, regional or local (Australian). As shown in Figure 3.8, 43 per cent of respondents indicated that they included the Australia operation and other countries in the region, 32 per cent responded that they only provided services to the Australian operations, while approximately 25 per cent covered the worldwide operations.
0%
10%
20%
30%
40%
50%
60%
70%
80%
US
Japan
UK
Australia
France
Germany
Asia
ROE
ROW
0%
10%
20%
30%
40%
50%
60%
70%
Mining
Trad Manufacturing
Comp/Med Devices
Chem/Pharma
Fin Services
ICT Services
Construction
Retail
Transport
Health

34
N= 93
Figure 3.8 Geographical coverage of HR shared services centres
HR policy development and implementation
The implementation of HR across countries is a key concern for MNEs. In particular, commentators have pointed to the potential importance of policy-making bodies that operate at an international level (Scullion & Starkey, 2000; Tregaskis, Glover, & Ferner, 2005). Implementation in the context of strategy means HR practices are tightly aligned with the reality of the business and consistent with practices in other HR domains. Edwards et al. (2007, p. 17) and Lavelle et al. (2009) note that there is limited knowledge of how such policies are developed and diffused internationally and the institutional arrangements used by MNEs in this regard. This study investigated the incidence of a ‘body within the worldwide company, such as a committee of senior managers that develops HR policies that apply across countries’.
N= 209
Figure 3.9 Existence of an international HR policy formulation committee
0%
5%
10%
15%
20%
25%
30%
35%
40%
45%
50%
Australia operations only Australia & other countries in the region
Worldwide operations
69%
63%
68%
Foreign MNEs
Indigenous MNEs
All MNEs
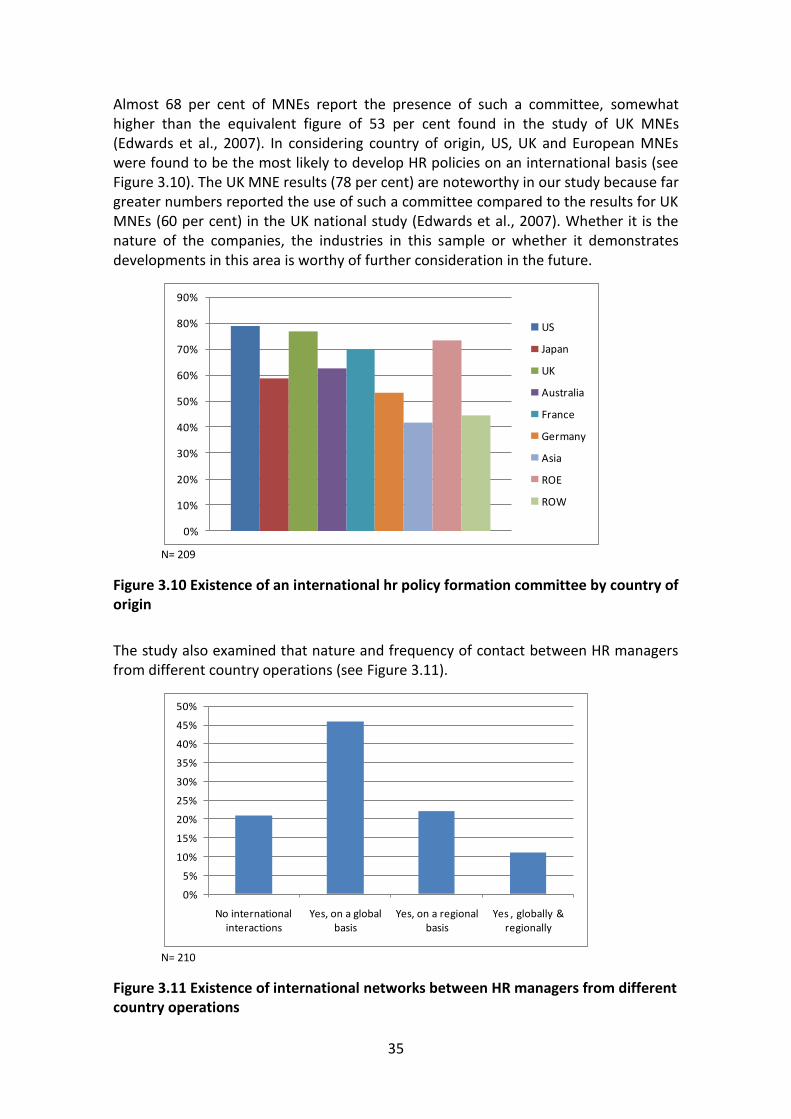
35
Almost 68 per cent of MNEs report the presence of such a committee, somewhat higher than the equivalent figure of 53 per cent found in the study of UK MNEs (Edwards et al., 2007). In considering country of origin, US, UK and European MNEs were found to be the most likely to develop HR policies on an international basis (see Figure 3.10). The UK MNE results (78 per cent) are noteworthy in our study because far greater numbers reported the use of such a committee compared to the results for UK MNEs (60 per cent) in the UK national study (Edwards et al., 2007). Whether it is the nature of the companies, the industries in this sample or whether it demonstrates developments in this area is worthy of further consideration in the future.
N= 209
Figure 3.10 Existence of an international hr policy formation committee by country of origin
The study also examined that nature and frequency of contact between HR managers from different country operations (see Figure 3.11).
N= 210
Figure 3.11 Existence of international networks between HR managers from different country operations
0%
10%
20%
30%
40%
50%
60%
70%
80%
90%
US
Japan
UK
Australia
France
Germany
Asia
ROE
ROW
0%
5%
10%
15%
20%
25%
30%
35%
40%
45%
50%
No international interactions
Yes, on a global basis
Yes, on a regional basis
Yes , globally & regionally

36
These findings point to international interaction between HR practitioners on a global or regional basis in MNEs. Conversely only 20 per cent indicated there was no interaction between HR managers from the MNE’s different country operations. We investigated the use of several mechanisms by which these interactions took place. Figure 3.12 illustrates how often each of four mechanisms are used by MNEs in Australia.
N varies from 165 to 167.
Figure 3.12 International networking between HR managers in different country operations
Unsurprisingly, due to the geographical distance of Australia from other countries, we did not find mechanisms that required face-to-face contact to take place on a very regular basis such as weekly. There was high utilisation of networking via international conferences and face-to-face meetings by MNEs, typically on an annual basis. There was considerable use of virtual interactions by HR managers, the majority of which took place on a monthly or weekly basis.
Monitoring by higher organisational levels
MNEs face two sets of conflicting demands in their international operations: local responsiveness and global efficiency. In terms of local responsiveness this is primarily achieved by delegating decision-making responsibility to the local level, whereas global integration means that the different parts of the MNE are a whole and decisions made from a global perspective. In reality the decision to do either is complex. As Edwards et al. (2007) note, an additional indicator of the degree of autonomy experienced by the subsidiary level HR function is the extent to which higher managerial levels from outside the country of operation monitor HR policy and performance.
To this end, we asked respondents in foreign-owned MNEs whether management outside of Australia monitored information on some nine areas of HR. The results are outlined in Figure 3.13. The areas most monitored by MNEs were managerial pay, management progression, the selection of the top management team, labour costs
0%
10%
20%
30%
40%
50%
60%
Never Weekly Monthly Quarterly Annually Other
Face-to-face meetings
International conferences
Task forces
Virtual
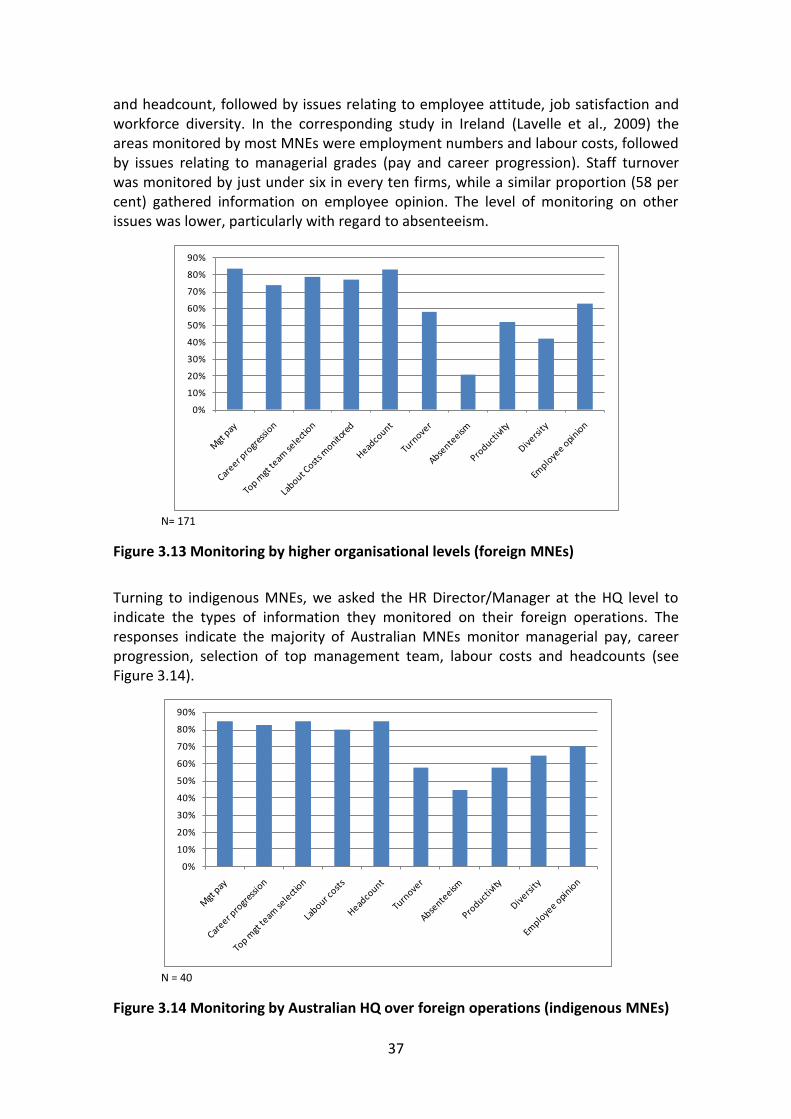
37
and headcount, followed by issues relating to employee attitude, job satisfaction and workforce diversity. In the corresponding study in Ireland (Lavelle et al., 2009) the areas monitored by most MNEs were employment numbers and labour costs, followed by issues relating to managerial grades (pay and career progression). Staff turnover was monitored by just under six in every ten firms, while a similar proportion (58 per cent) gathered information on employee opinion. The level of monitoring on other issues was lower, particularly with regard to absenteeism.
N= 171
Figure 3.13 Monitoring by higher organisational levels (foreign MNEs)
Turning to indigenous MNEs, we asked the HR Director/Manager at the HQ level to indicate the types of information they monitored on their foreign operations. The responses indicate the majority of Australian MNEs monitor managerial pay, career progression, selection of top management team, labour costs and headcounts (see Figure 3.14).
N = 40
Figure 3.14 Monitoring by Australian HQ over foreign operations (indigenous MNEs)
0%
10%
20%
30%
40%
50%
60%
70%
80%
90%
0%
10%
20%
30%
40%
50%
60%
70%
80%
90%

38
Approach to workforce management
The shift to a strategic HRM approach has reportedly become more prevalent in recent decades. Strategic HRM provides a rationale for elevating the influence of the HR function, namely that MNEs can benefit from putting in place better practices that support the strategy in a superior way to those of their competitors. Indeed the very idea of ‘strategic HRM’ infers the development of a strategic management approach to workforce management, and an overall corporate HR philosophy and strategy that complements their business strategy and enhances the ‘bottom line’ (cf. Boxall, 1992; Purcell, 2004; Edwards et al., 2007; Lavelle et al., 2009).
Our survey focused on the extent to which MNEs adopted a uniform approach to the management of employees. Respondents were presented with a series of statements relating to their company’s approach concerning the management of its workforce and asked the extent (five-point scale) to which they agreed or disagreed. The findings with regard to MNEs that agreed/strongly agreed that there is a worldwide approach, regional approach and national approach are summarised in Figure 3.15. The data shows both foreign and Australian MNEs have a tendency to focus on the region. Further detailed analysis may clarify this.
N= 211, 180, 211 respectively
Figure 3.15 Approaches to workforce management (agree/strongly agree answers)
We further investigated the importance of ‘country of origin’ in shaping the overall approach to workforce management. This is seen as a useful indicator of the philosophical approach. In this context an ‘ethnocentric’ approach is the extent to which the company’s approach is dominated by home country traditions and norms. This is seen to contrast other approaches such as a ‘polycentric’ approach, where host country traditions dominate (Deresky, 2010). Figure 3.16 indicates that the majority of MNEs agree (53 per cent) or strongly agree (12 per cent) that the traditions in the country of origin have an ‘overriding influence’ on the approach to HR management.
0%
10%
20%
30%
40%
50%
60%
70%
80%
90%
Worldwide Regional National
Foreign MNEs
Indigenous MNEs
All MNEs

39
N= 210
Figure 3.16 Extent to which traditions in the country of origin have an overriding influence on the approach to the management of employees
Historically HR departments were responsible for personnel administration, but in the last decade or so this role is believed to be shifting to a more strategic type role. The survey explored to what degree there was a distinct HR strategy in the MNE, the extent to which the HR strategy is integrated with the corporate strategy, degree of input/influence the HR strategy has on the corporate strategy and whether the HR practices in place are integrated and consistent with one another. Figure 3.17 illustrates the extent of agreement or disagreement with these statements.
The results overall look positive with regard to the existence of a distinct HR strategy and typically respondents viewed it as being integrated with the corporate strategy. The most concerning finding was that about one quarter of participants did not believe the HR strategy had sufficient influence/input on the corporate strategy.
N= 211
Figure 3.17 HR strategic approach in MNEs
0%
10%
20%
30%
40%
50%
60%
Strongly disagree
Disagree Neither agree nor disagree
Agree Strongly agree
0%
10%
20%
30%
40%
50%
60%
Strongly disagree
Disagree Neither agree nor disagree
Agree Strongly agree
Presence of distinct HR strategy
HR strategy integrated with corporate strategy
HR strategy has sufficient influence on corporate strategy
HR practices are consistent/integrated

40
Conclusion
In this chapter, we have reviewed evidence about the nature and role of the HR function amongst MNEs in Australia. We found that the vast majority of HR functions employ between one and nine employees. A particularly noteworthy finding was the high utilisation of HR shared services centres by Australian-owned MNEs. How these operate and why they were far more likely to be used compared to their foreign-owned counterparts is worthy of future consideration. Almost seven in every ten MNEs in Australia report the presence of a body/committee with a mandate to develop HR policies on an international basis. These are most prevalent amongst US MNEs. We also found international networking between HR managers from different country operations. Virtual correspondence was the most regular mechanism for interacting with other HR managers but annual international conferences and face-to-face meetings were also prominent. Higher organisational levels monitor quite a lot of HR measures including managerial pay, management progression, the selection of the top management team, labour costs and headcount. The findings were similar between foreign and indigenous MNEs. Finally, it appears that the country of origin continues to be a key influence on the approach adopted to workforce management by MNEs.

41
Section 4: Pay and performance management
Introduction
This section explores the policies and practices that MNEs adopt in the area of pay systems and performance management. This is one of the key issues for HRM and it may be viewed as a reflection of the organisation’s strategic approach to the management of its workforce and more particularly, its approach to individual employees. The area of pay and performance management (PPM) is of critical importance to MNEs due in no small part to the view that matching these policies with the business strategy will improve organisational performance (Milkovich, 1988, also, see Claus and Briscoe, 2008).
Country of origin has been seen as a major factor influencing the kinds of PPM policies adopted by MNEs. US companies, for example, have long been regarded as HR innovators in such aspects of PPM as productivity-related pay bargaining, individual performance appraisal, performance-related pay, and employee share ownership (e.g. Gunnigle et al., 1997; Dunning, 1998). National influences stemming from the characteristics of the parent-country business system are to be expected with Japanese organisations, for instance, who typically link pay to seniority rather than performance. German firms, in contrast, have been limited in terms of introducing individually-focused pay forms and performance appraisals due to the strong collective employee agenda, signified by sectoral pay bargaining and company-level employee representation through works councils
A number of specific areas are examined in this section. This section first looks at the overall strategy on pay levels in MNEs. In other words, do they aim to pay employees above, below, or at the market average? Second, the section considers the use of formal performance appraisals for different categories of employees (LOG, key group, managers), as well as the use of forced distribution systems and 360-degree feedback. Third, we report on various systems of financial participation and the use of performance-related pay for staff. Finally, the section explores the degree of subsidiary freedom (‘discretion’) across different facets of PPM policy.
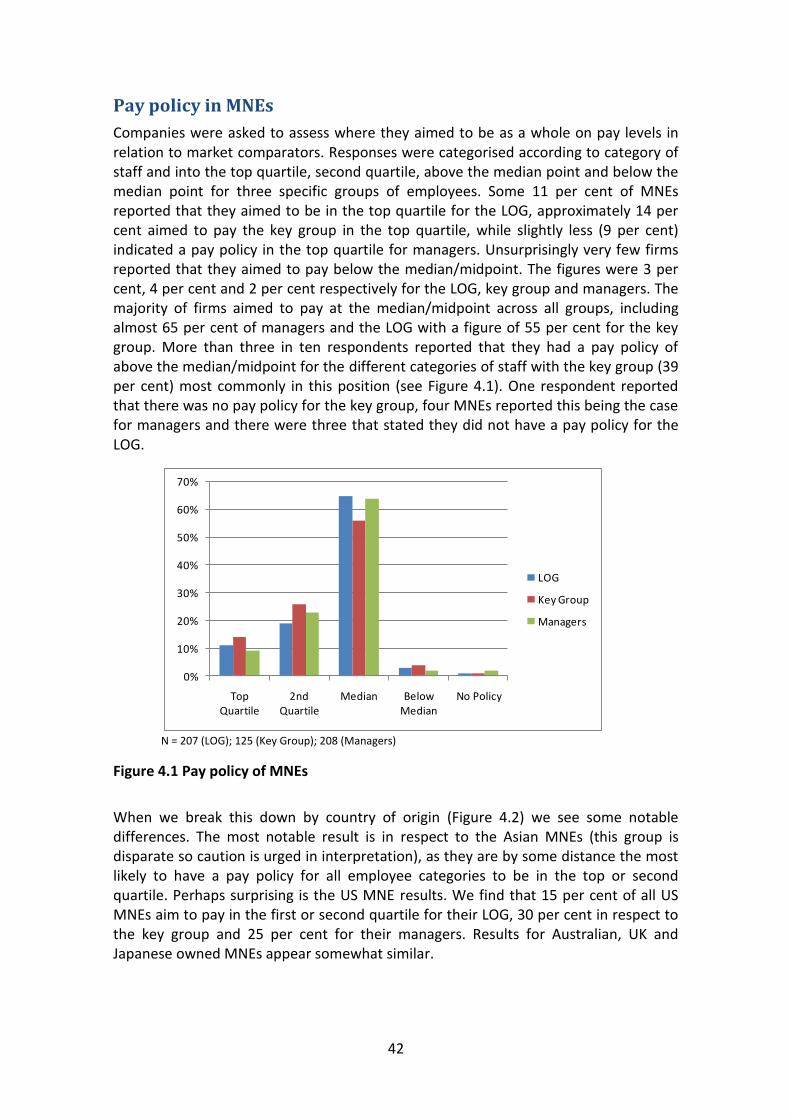
42
Pay policy in MNEs
Companies were asked to assess where they aimed to be as a whole on pay levels in relation to market comparators. Responses were categorised according to category of staff and into the top quartile, second quartile, above the median point and below the median point for three specific groups of employees. Some 11 per cent of MNEs reported that they aimed to be in the top quartile for the LOG, approximately 14 per cent aimed to pay the key group in the top quartile, while slightly less (9 per cent) indicated a pay policy in the top quartile for managers. Unsurprisingly very few firms reported that they aimed to pay below the median/midpoint. The figures were 3 per cent, 4 per cent and 2 per cent respectively for the LOG, key group and managers. The majority of firms aimed to pay at the median/midpoint across all groups, including almost 65 per cent of managers and the LOG with a figure of 55 per cent for the key group. More than three in ten respondents reported that they had a pay policy of above the median/midpoint for the different categories of staff with the key group (39 per cent) most commonly in this position (see Figure 4.1). One respondent reported that there was no pay policy for the key group, four MNEs reported this being the case for managers and there were three that stated they did not have a pay policy for the LOG.
N = 207 (LOG); 125 (Key Group); 208 (Managers)
Figure 4.1 Pay policy of MNEs
When we break this down by country of origin (Figure 4.2) we see some notable differences. The most notable result is in respect to the Asian MNEs (this group is disparate so caution is urged in interpretation), as they are by some distance the most likely to have a pay policy for all employee categories to be in the top or second quartile. Perhaps surprising is the US MNE results. We find that 15 per cent of all US MNEs aim to pay in the first or second quartile for their LOG, 30 per cent in respect to the key group and 25 per cent for their managers. Results for Australian, UK and Japanese owned MNEs appear somewhat similar.
0%
10%
20%
30%
40%
50%
60%
70%
Top Quartile
2nd Quartile
Median Below Median
No Policy
LOG
Key Group
Managers

43
N = 207 (LOG); 125 (key group); 208 (managers)
Figure 4.2 Pay policy by country of origin
When the data is broken down by sector a greater proportion of MNEs aim to be in the first or second quartile in the services sector than multi-sector or the manufacturing MNEs. Caution needs to be again exerted in the interpretation of these results due to the small number of MNEs in some sectors (e.g. health), particularly with respect to the key group. In addition, utilities sector MNEs (n=3) are excluded as none were found to pay in the top or second quartile. All MNEs in the engineering sector and which recognise a key group stated that their pay is in the top or second quartile. Another notable finding is that almost 70 per cent of MNEs in the transport and storage sector reported a pay policy in the top two quartiles.
N = 207 (LOG); 125 (key group); 208 (managers)
Figure 4.3 Pay policy by the dominant sector of the MNE in Australia
Performance appraisals
The key finding in relation to performance appraisal systems is that the vast majority of companies have formal schemes. In regard to Australian- and foreign-owned MNEs
0%
10%
20%
30%
40%
50%
60%
70%
80%
90%
US Japan UK Australia France Germany Asia ROE ROW
LOG 1st/2nd quartile
Key Group 1st/2nd quartile
Managers 1st/2nd quartile
0%
10%
20%
30%
40%
50%
60%
70%
80%
90%
100%
LOG 1st/2nd quartile
Key Group 1st/2nd quartile
Managers 1st/2nd quartile

44
we can see that all domestic MNEs have a formal performance appraisal for managers and the key group and almost 90 per cent for the LOG. Almost 98 per cent of foreign MNEs reported formal appraisals for their for managers, 96 per cent of those recognising a key group stated they had a formal appraisal while 90 per cent have one for the LOG.
Looking more closely at country of ownership breakdown, it is unsurprising given the high utilisation of appraisals that differences are minimal. Findings in respect to the key group and managers are particularly similar with almost every MNE reporting a formal appraisal for such staff. Some differences exist in respect to the use of a performance appraisal system for the LOG. Most notably, is that Asian (67 per cent), Japanese (72 per cent) and German (77 per cent) MNEs were the least likely to report appraisals with UK (92 per cent), French (90 per cent) and Australian (88 per cent) firms the most likely.
N = 211 (LOG and managers); 125 (key group)
Figure 4.4 Use of a formal performance appraisal by country of origin
The vast majority of firms (67 per cent) reported that they use a single integrated appraisal system across the different groups. US MNEs are the most likely to report a single integrated system (see Figure 4.5) with 80 per cent reporting this. German MNEs were the least likely with just 46 per cent of these MNEs stating they operated a single, integrated performance appraisal across different employee categories.
0%
10%
20%
30%
40%
50%
60%
70%
80%
90%
100%
US Japan UK Australia France Germany Asia ROE ROW
LOG
Key Group
Managers

45
N = 197
Figure 4.5 Presence of a single integrated appraisal system by country of origin
Methods of performance appraisal systems
We then investigated the methods of performance appraisal, in particular forced distribution and 360-degree appraisal. Forced distribution (FD) forces appraisers to place a certain proportion of appraised staff in different performance categories or grades, normally with the aim of avoiding the ‘bunching’ of staff in higher grades. Multi-rater or 360-degree feedback appraisals are seen as increasingly prevalent practices in corporate performance management systems. Its managerial rationale is to give individual employees a more rounded and coherent perspective on their performance by providing feedback from peers and subordinates as well as the line manager. It is regarded as a way of strengthening an individual’s skills, competencies and future performance.
Overall, one third of MNEs reported the use of FD for managers, 34 per cent for the key group and somewhat less (27 per cent) for the LOG. The results by country of origin make for some interesting analysis (see Figure 4.6). None of the rest of the world MNEs reported the use of FD. It was unsurprising to see the high use of FD by US firms given that the development of FD is often ascribed to General Electric and other US firms. What was unexpected was the high use amongst Asian MNEs, particularly with respect to the LOG.
80%
65%
62%
57%60%
46%
60%
50%
79% US
Japan
UK
Australia
France
Germany
Asia
ROE
ROW

46
N = 173 (LOG); 121 (key group); 208 (managers)
Figure 4.6 Forced distribution for the LOG, key group and managers by country of origin
In respect to the use of 360-degree appraisals, it was not unexpected to see that managers are the most likely to receive this form. Some 56 per cent of MNEs reported that they provide 360-degree feedback to managers, 39 per cent do so in respect to the key group while only 28 per cent provide such feedback to the LOG. Figure 4.8 highlights that greater percentages of Asian, US and UK MNEs provide 360-degree feedback to managers compared to others. Another noticeable result is the use of 360-degree appraisals by German MNEs for their LOG (60 per cent).
N = 173 (LOG); 121 (key group); 208 (managers)
Figure 4.7 360-degree appraisal by country of origin
0%
10%
20%
30%
40%
50%
60%
US Japan UK Australia France Germany Asia ROE
LOG
Key Group
Managers
0%
10%
20%
30%
40%
50%
60%
70%
80%
US Japan UK Australia France Germany Asia ROE ROW
LOG
Key Group
Managers

47
Performance evaluation
Our survey asked a number of questions in relation to performance evaluation for managers and whether certain measures or criteria were seen as important. The first question asked about the importance of individual quantitative outputs used as evaluation criteria for managers and over 90 per cent of respondents considered these as important or very important (a five-point Likert scale was used). The second question related to qualitative outputs and just under 90 per cent of respondents rated these as important or very important. Some 83 per cent responded that group outputs were important or very important evaluation criteria. Then, respondents were asked if individual competencies or personal skills were important evaluation criteria: 77 per cent agreed that they were either important or very important, while 80 per cent agreed that behaviour in relation to corporate values was important or very important. These findings suggest that companies are using a wide range of individual and group, qualitative and quantitative performance measures as well as measuring skills, competencies and behaviours.
Figure 4.8 provides the mean values for each of these statements according to country of origin. A value of five indicates that particular mechanism is very strongly used in performance evaluation for managers. The results suggest quite similar results by country of origin although it is important to note that the use of the mean can be suspect to outliers.
N = 210
Figure 4.8 Methods of performance evaluation by country of origin (mean values)
Performance related pay
We were also interested in finding out the extent of the use of variable payment systems such as ‘performance-related pay’ (PRP) for employees. We found that 90 per cent of companies had some kind of variable payment system for their managers, 80 per cent had variable payments for the key group but just over 60 per cent indicated variable pay for the LOG.
0.0
0.5
1.0
1.5
2.0
2.5
3.0
3.5
4.0
4.5
5.0
US Japan UK Australia France Germany Asia ROE ROW
Indiv. quant. ouputs
Indiv. qual. ouputs
Group outputs
Competencies
Corp. values

48
N = 211 (LOG and managers); 125 (key group)
Figure 4.9 Performance related pay for the LOG, key group and managers by country of origin
The breakdown by country of origin (see Figure 4.9) appears quite similar although the relatively low numbers of Australian owned MNEs using PRP for the LOG is worthy of note and of further investigation. For example, can this be linked to high union recognition? Considering the evidence that suggests US firms introduced the use of linking pay to performance, one may have expected a greater percentage of US MNEs to report a variable pay element for the LOG.
Financial participation
MNEs, particularly US firms, have traditionally sought to bind their employees into ‘shareholder capitalism’ through the use of employee share ownership schemes. Moreover, the deregulation of financial markets in the 1980s and the rise of ‘shareholder value’ as a concept have further enhanced the use of employee stock options as a device to link the remuneration of managers (O’Sullivan, 2000). Here we examine the use of three financial participation schemes. These include, employee share ownership schemes (ESOSs), profit sharing and share options. The findings show that these financial schemes are most commonly available to managers, followed by the key group and much less likely to be available to the LOG (see Figure 4.10).
0%
10%
20%
30%
40%
50%
60%
70%
80%
90%
100%
US Japan UK Australia France Germany Asia ROE ROW
LOG
Key Group
Managers

49
N = 125 (key group); varies between 210 and 211 (LOG and managers)
Figure 4.10 Financial participation for LOG, key group and managers
Figure 4.11 shows the breakdown for the use of ESOSs according to the country of origin of the MNE. The first finding to highlight is that no Japanese MNEs offer an ESOS to any of their staff, a finding worthy of investigation in the future. Australian MNEs are highly likely to offer an ESOS scheme to their staff. For instance, over half of the Australian MNEs stated that the LOG are offered an ESOS compared to 25 per cent of US firms and 31 per cent of UK MNEs. None of the Asian MNEs offered an ESOS to the LOG and very small numbers provided their managers or key group with one.
N = 210 (LOG and managers); 125 (key group)
Figure 4.11 Employee share ownership schemes by country of origin
Turning to the provision of profit sharing to the LOG, key group and managers (see Figure 4.12), we can see that there tends to be less use than ESOSs. While Australian MNEs were found to be the most likely to offer an ESOS they are amongst the least
0%
5%
10%
15%
20%
25%
30%
35%
40%
45%
50%
LOG Key Group Managers
ESOS
Profit sharing
Share options
0%
10%
20%
30%
40%
50%
60%
70%
80%
US UK Australia France Germany Asia ROE ROW
LOG
Key Group
Managers

50
likely to offer profit sharing. Again, the French MNEs stand out for the relatively high incidence of profit sharing, especially for the key group.
N = 211 (LOG and managers); 125 (key group)
Figure 4.12 Profit sharing by country of origin
Finally, we turn to the offer of share options to staff (Figure 4.13). Again, no Japanese MNEs offered staff share options. Seventy per cent of French MNEs offer share options to their managers, followed by approximately 60 per cent of UK-owned firms. Relatively low numbers of US MNEs offer share options – a finding that corresponds to the other financial participation mechanisms.
N = 211 (LOG and managers); 125 (key group)
Figure 4.13 Share options by country of origin
0%
10%
20%
30%
40%
50%
60%
70%
80%
US Japan UK Australia France Germany Asia ROE ROW
LOG
Key Group
Managers
0%
10%
20%
30%
40%
50%
60%
70%
80%
US UK Australia France Germany Asia ROE ROW
LOG
Key Group
Managers

51
Management discretion over pay and performance management policy
It is important to note that our findings on management discretion are fundamentally different propositions between foreign- and indigenous-owned MNEs. This is the case for all similar variables in subsequent chapters. Among the foreign-owned firms in Australia we sought to establish the level of discretion afforded to the local Australian based management team by higher levels of management outside of Australia. However, in Australian-owned MNEs we wanted to establish the level of discretion granted to managers outside of Australia. Put simply, we sought a subsidiary level perspective from the foreign MNEs and an HQ perspective from the Australian MNEs. In all cases though, respondents were asked to indicate levels of discretion granted on a five-point scale from 1=no discretion to 5=full discretion (can set own policy). First, we explore the level of discretion awarded to Australian subsidiaries by foreign-owned MNEs on a range of issues relating to pay and performance (see Figure 4.14).
In relation to discretion over relating pay to market comparators, over 65 per cent of foreign MNEs operating in Australia are granted at a lot or full discretion. When it comes to variable pay approximately 20 per cent of companies have no or little discretion for the LOG and 25 per cent for managers. Fifty-seven per cent of respondents reported a lot or full discretion over the variable pay policy for the LOG and 48 per cent in respect to managers, the remaining percentage equates to some discretion. The picture regarding performance appraisal is even more marked. Some 35 per cent of MNEs reported having no or a little discretion over the managerial performance appraisal system, the equivalent figure for the LOG was 31 per cent of firms. We also calculated the mean values (1=no discretion, 5=full discretion) where we found that the greatest autonomy was over relating pay levels to market comparators (3.9) followed by variable pay for the LOG (3.61). The area where the lowest discretion was granted, by some distance, was over ESOSs which had a mean value of 1.68 (i.e. suggesting most foreign MNEs in Australia have between none and a little discretion).
N varies from 73 (ESOS) to 171
Figure 4.14 Discretion over pay and performance policy in Australian operations (foreign MNEs)
0%
10%
20%
30%
40%
50%
60%
70%
Payto market comparators
ESOS PA for LOG PA for mgrs PRP for LOG PRP for mgrs
There is no discretion
There is a little discretion
There is some discretion
There is a lot of discretion
There is full discretion

52
Turning now to the discretion the Australian HQ afford their foreign operations. In relation to discretion over relating pay to market comparators, Australian HQ management reported that almost 80 per cent have at least some discretion, however, within this number 15 per cent said they had full discretion. The least discretion granted is clearly with respect to ESOS with over 60 per cent stating their foreign operations had no discretion in this area. Analysing the mean values (1=no discretion, 5=full discretion), we find the highest discretion in the area of relating pay levels to market comparators (3.22) with the lowest over ESOS (1.59) and the remaining variables varying from between 2.48 and 2.86.
N varies from 21 (PA for LOG) to 40
Figure 4.15 Discretion over pay and performance management policy in overseas operations (indigenous MNEs)
Conclusions
This chapter has explored how pay and performance management is practiced by MNEs in Australia. The results indicate that the majority of MNEs aim to pay around the median/midpoint in relation to market comparators for all categories of staff. The numbers of MNEs indicating they pay at the median/midpoint for managers and the key group was higher than found in the comparative studies in the UK (Edwards et al., 2007) and Ireland (Lavelle et al., 2009). This may reflect a timing issue as the Australian study was conducted in the direct aftermath of the GFC while the others were pre-GFC. When the data is broken down by sector a greater proportion of MNEs aim to be in the first or second quartile in the services sector compared to firms that operate across sectors or in the manufacturing sector.
It is clear from the results that the use of a formal performance appraisal for staff is now almost a given in MNEs and there was a majority utilising a single integrated appraisal scheme across the different employee categories. Of note was that US MNEs (as expected) and Asian MNEs were the most likely to indicate the use of forced distribution to the results of performance appraisals. Asian MNEs, along with US and UK MNEs, were also the most likely to report the use of 360-degree feedback. The
0%
10%
20%
30%
40%
50%
60%
70%
Payto market
comparators
ESOS PA for LOG PA for mgrs PRP for LOG PRP for mgrs
There is no discretion
There is a little discretion
There is some discretion
There is a lot of discretion
There is full discretion

53
findings showed that MNEs in Australia used a range of individual and group, as well as qualitative and quantitative, performance measures when evaluating managers’ performance.
With regard to financial participation, there were differences in the use of employee share ownership schemes, profit sharing and share options. These schemes are most commonly available to managers, followed by the key group, but less likely to be available to the LOG. No Japanese MNE indicated they offer ESOSs or share options to any employees in Australia. The use of ESOSs was particularly prominent in indigenous-owned MNEs.
The discretion afforded to the Australian operations of foreign MNEs over different elements of PPM policy varied according to the measure. Employee share ownership schemes were the area where very little autonomy was afforded the Australian operations. This was also the area in which indigenous MNEs reported the least amount of discretion to their foreign operations.

54
Section 5: Training, development and talent
management
Introduction
Training and development (T&D) is used to assist employees develop their personal and organisational skills, competencies and knowledge. The overall focus of T&D is to develop a superior, more effective workforce which will facilitate individual employees, teams, divisions and the organisation to better achieve their objectives. There is little dispute that a well-trained and developed workforce is a valuable asset to the organisation. Although employees possess human capital before they enter the organisation, by investing in it further, and creating the circumstances by which employees will activate their capital, management can secure productivity, flexibility and performance benefits through improvements in employee skills and knowledge (Baron and Armstrong, 2007). However, the amount of T&D that takes place varies extensively between organisations (Grugulis, 2007) with some organisations taking it very seriously and others only paying it lip service.
In more recent times, talent management (TM) has emerged as a key strategic management activity for organisations, particularly MNEs (McDonnell, Lamare, Gunnigle, & Lavelle, 2010; Scullion & Collings, 2011). “Workforce demographics and skills shortages are likely to make the ‘war for talent’ fiercer than ever before making effective talent management a competitive necessity” (McDonnell, 2011, p. 169). TM is likely to be a particularly acute issue in Australia because it was the only developed country to stay out of economic recession during the recent global financial crisis. Australia is experiencing skills shortages in key areas, particularly amongst managers, professionals and technicians (Sheldon & Thornthwaite, 2005). However, there has been little empirical research on TM in Australia – a gap which we redress here.
This section sketches the practice of training, development and talent management in MNEs operating in Australia. Specifically, we examine:
the level of financial investment in T&D for the workforce
engagement in talent management
the use of formal succession planning and management development programmes and the extent to which these are global or local in nature
the existence of a formal development programme for the key group.
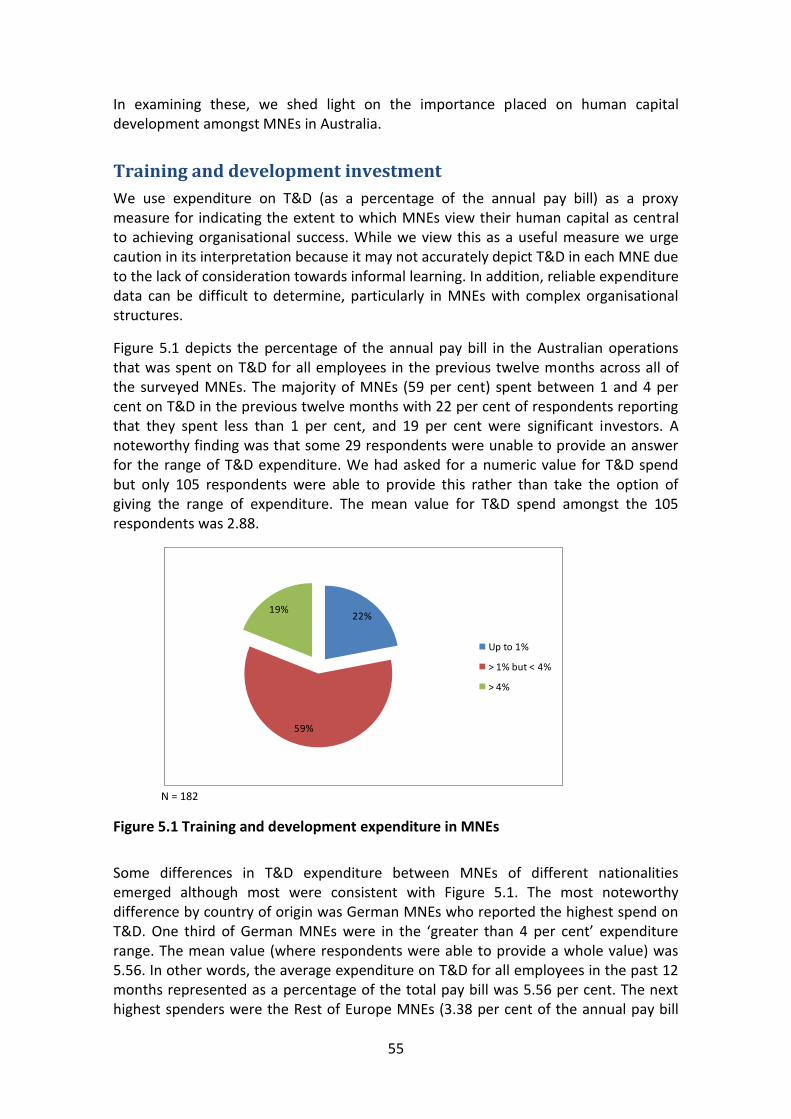
55
In examining these, we shed light on the importance placed on human capital development amongst MNEs in Australia.
Training and development investment
We use expenditure on T&D (as a percentage of the annual pay bill) as a proxy measure for indicating the extent to which MNEs view their human capital as central to achieving organisational success. While we view this as a useful measure we urge caution in its interpretation because it may not accurately depict T&D in each MNE due to the lack of consideration towards informal learning. In addition, reliable expenditure data can be difficult to determine, particularly in MNEs with complex organisational structures.
Figure 5.1 depicts the percentage of the annual pay bill in the Australian operations that was spent on T&D for all employees in the previous twelve months across all of the surveyed MNEs. The majority of MNEs (59 per cent) spent between 1 and 4 per cent on T&D in the previous twelve months with 22 per cent of respondents reporting that they spent less than 1 per cent, and 19 per cent were significant investors. A noteworthy finding was that some 29 respondents were unable to provide an answer for the range of T&D expenditure. We had asked for a numeric value for T&D spend but only 105 respondents were able to provide this rather than take the option of giving the range of expenditure. The mean value for T&D spend amongst the 105 respondents was 2.88.
N = 182
Figure 5.1 Training and development expenditure in MNEs
Some differences in T&D expenditure between MNEs of different nationalities emerged although most were consistent with Figure 5.1. The most noteworthy difference by country of origin was German MNEs who reported the highest spend on T&D. One third of German MNEs were in the ‘greater than 4 per cent’ expenditure range. The mean value (where respondents were able to provide a whole value) was 5.56. In other words, the average expenditure on T&D for all employees in the past 12 months represented as a percentage of the total pay bill was 5.56 per cent. The next highest spenders were the Rest of Europe MNEs (3.38 per cent of the annual pay bill
22%
59%
19%
Up to 1%
> 1% but < 4%
> 4%

56
was spent on T&D) and UK MNEs (3 per cent). Asian MNEs were found to be the lowest spenders with just the one firm reporting spending greater than four per cent of the annual pay bill on T&D, whilst the average value was 2.16 per cent. The mean value found for Australian MNEs was 2.5 per cent. The relatively high training expenditure by German MNEs is not surprising – it can largely be ascribed to the strong vocational educational system in Germany (Mabey & Ramirez, 2004). Our UK colleagues found a similar result in their study with German MNEs being the highest T&D investors (Edwards et al., 2007). They found that the average expenditure on T&D as a percentage of the annual pay bill was 6.3 per cent.
With respect to sector, we find that mining, financial and business services, and engineering/consultancy had the greatest number of MNEs reporting T&D spend in excess of 4 per cent. Specifically, over 40 per cent of MNEs in these sectors answered that they spend this amount.
Talent management
There is much discussion around Australia’s skills shortages and the importance of skilled migration to offset the problems this brings for organisations. Our results suggest that the issue of skills shortages amongst MNEs in Australia may not be as dominant for domestic firms or as depicted more generally in the populist media. We asked participants to indicate the extent to which they agreed or disagreed with the statement, ‘our Australian operations can recruit the specialist skills they require in the Australian labour market’ (1=strongly disagree, 5=strongly agree). The average value was 3.53 with only 15 per cent disagreeing or strongly disagreeing to the statement.
TM typically involves the identification, development, appraisal, deployment, and retention of high-performing and high-potential employees (Collings & Scullion, 2007). TM has emerged as a distinct strategic business activity because it suggests that there needs to be a greater focus on employees and positions that have the greatest differential impact on business strategy (McDonnell, 2011). TM is not just about senior managers and leaders because there may be more functional and technical type roles which have a sizeable strategic impact on organisational performance (Cappelli, 2009).
Some 85 per cent of respondents reported that the Australian operations undertook talent management. Differences according to the country of origin were negligible with the exception of Japanese MNEs who were far less likely to report that they undertake TM (see Figure 5.2) with just 61 per cent doing so. Some differences were found by sector. In a number of sectors (the dominant sector of the operations in Australia) we found that every MNE reported that they undertake TM. These sectors were health, utilities, transport and storage, and engineering/consultancy. Approximately three quarters of MNEs in all other sectors reported that they engage in TM.

57
N = 211
Figure 5.2 MNEs in Australia undertaking talent management by country of origin
Following the question on engagement in TM, we sought to elicit information about the activities that encompassed TM in these organisations (see Figure 5.3). These questions were structured around the work of Collings and Mellahi (2009) who established one of the first conceptual models of TM. They suggest that organisations need to identify their pivotal positions (i.e. those that have the greatest strategic impact), identify and develop a talent pool of high potential and high performing people to be able to fill these positions, and have a differentiated HR architecture which motivates and retains staff in these talent pools. Some 85 per cent of respondents who reported engagement in talent management stated that they strategically identify pivotal organisation positions, 82 per cent reported the use of talent pools but just 41 per cent have a differentiated HR architecture based on the strategic importance of the different talent pools. A key reason behind the low use of a differentiated architecture may be the failure to understand what it may actually involve and the added difficulty such a system would bring (McDonnell, 2011). This is an age-old issue with the considerable high performance work systems literature unable to arrive at a consensus on what practices should be implemented. Perhaps the focus on staff in terms of value-added contribution to the corporate strategy will assist.
0%
10%
20%
30%
40%
50%
60%
70%
80%
90%
100%
US Japan UK Australia France Germany Asia ROE ROW

58
N varies from 177 to 179
Figure 5.3 Elements of talent management system
Invariably, there is little to suggest that there are significant differences in the use of diverse TM system elements according to country of origin with the exception of the utilisation of a differentiated HR architecture. Figure 5.4 highlights that French (22 per cent) and US (33 per cent) MNE are less likely to use a differentiated HR architecture based on the strategic importance of the talent pools. UK-owned MNEs (64 per cent) are the most likely to use a differentiated HR architecture. Some 45 per cent of Australian MNEs adopt this system.
N varies from 177 to 179
Figure 5.4 Elements of talent management system by country of origin
There was one very noteworthy finding in respect to the dominant sector of activity of the Australian operations. All of the MNEs operating in the engineering/consultancy sector reported that they strategically identify pivotal positions, use talent pools and also utilise a differentiated HR architecture based on the strategic importance of the different talent pools.
85%
82%
41%Strategic identification of pivotal organisation positions
Use of talent pools
Differentiated HR architecture
20%
30%
40%
50%
60%
70%
80%
90%
100%
US Japan UK Australia France Germany Asia ROE ROW
Pivotal Positions Talent Pools HR Architecture

59
Respondents were also asked to indicate the extent to which they agreed (1=strongly disagreed, 5=strongly agree) that their TM system incorporates both internal and external talent. The overall mean value for all MNEs that undertake TM was 2.77. This figure may be a little misleading because it suggests a central type approach. In fact 52 per cent disagreed/strongly disagreed, 37 per cent agreed or strongly agreed, and the remaining 11 per cent in the central category of neither agreeing nor disagreeing that their TM system incorporated both internal and external talent. Although not specifically asked, there were significant indications that the focus was primarily internal. This is supported by the finding that 81 per cent agreed or strongly agreed that they preferred internal promotion over external recruitment.
We also asked respondents about the focus of their TM system. Specifically, we asked about the extent to which they focus on developing broad competencies to allow individuals to fit a range of roles rather than only narrow, specialist positions. Utilising a five-point scale, the overall mean value was high at 3.73. Almost three quarters (74 per cent) of respondents agreed or strongly agreed with the statement.
Some differences seem to exist in respect to country of origin as depicted in Figure 5.5. The most notable would be the strong focus on developing broad competencies in Japanese and Asian MNEs compared to others.
N = 179
Figure 5.5 Focus of talent management system by country of origin (means)
Succession planning
Succession planning involves the formal and systematic identification and development of an organisation’s workforce. The reason behind the adoption of succession planning is to identify employees who have the potential to move into senior managerial roles when required. The comparative UK (Edwards et al., 2007) and Irish studies (Lavelle et al., 2009) reported identical results with 65 per cent of MNEs operating a succession planning system. The Australian findings are somewhat different with 76 per cent answering that there is a formal system of succession planning in some or all of the Australian subsidiaries. Similar to the comparative studies we found that where there is formal succession planning it tends to be global
2.63 2.55
3.643.09
2.673.3
2.82.14 2.38
3.634.27 3.36 3.76
3.78
3.9 4.2
3.573.63
US Japan UK Australia France Germany Asia ROE ROW
TM system incorporates internal & external talent
Focus on broad competencies to allow employees fill range of roles rather than narrow, specialist positions

60
in scope. Just 12 per cent of respondents that reported succession planning stated that it was a solely Australian system. This provides support to suggestions that talent pipelines are increasingly being coordinated globally so as to move MNEs away from an HQ perspective and gain from economies of scale (Sparrow, Brewster, & Harris, 2004).
Differences emerged according to country of origin with Japanese (50 per cent) and Asian (58 per cent) MNEs the least likely to report formal succession planning in their Australian operations. UK (92 per cent) and French (90 per cent) MNEs were the most likely to indicate a formal succession planning system.
N = 210
Figure 5.6 Formal succession planning in the Australian operations by country of origin
Management development
Eighty-one per cent of MNEs have a formal management development programme in the Australian operations that is aimed at developing its high potentials/senior management potential. This finding is slightly higher to the corresponding result in the Irish (72 per cent) and UK surveys (70 per cent). Similar to the finding on succession planning, where a formal system exists it typically has a global orientation to it.
Some sectoral differences seem apparent (see Figure 5.7), however, due to the small number of MNEs in some of these sectors we urge caution in its interpretation. The engineering/consultancy sector appear to be particularly strong with respect to human capital development practices.
0%
10%
20%
30%
40%
50%
60%
70%
80%
90%
100%
US Japan UK Australia France Germany Asia ROE ROW
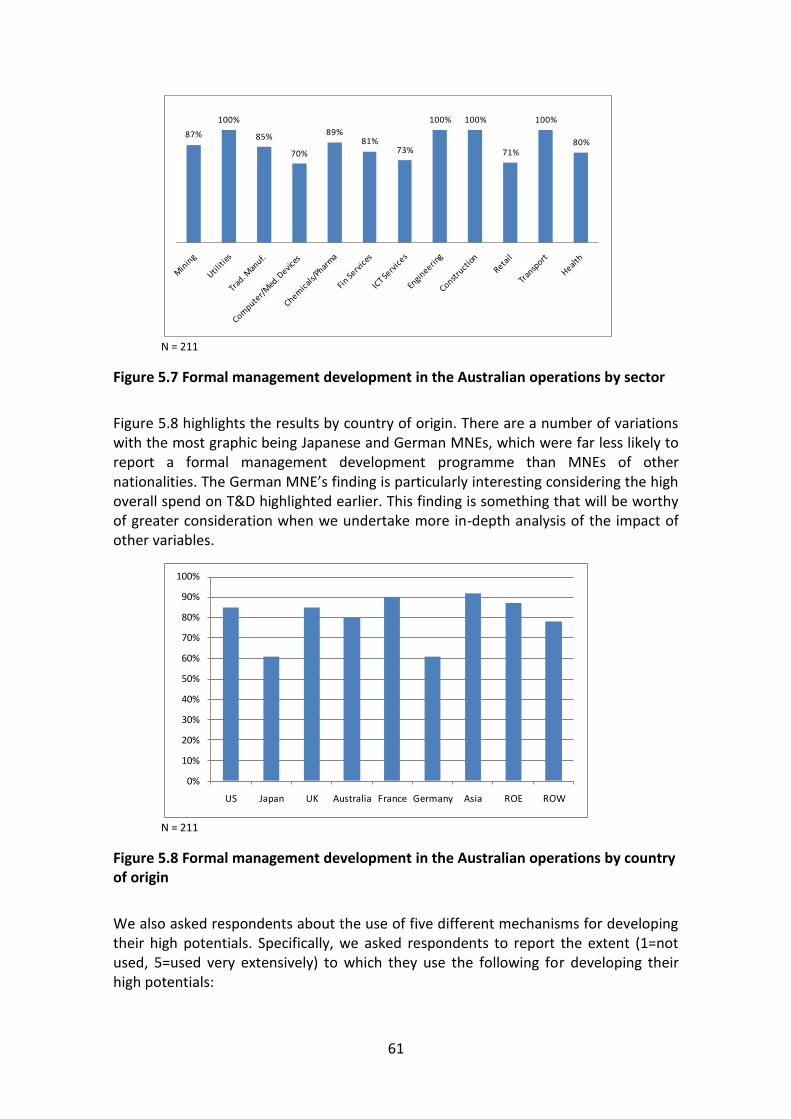
61
N = 211
Figure 5.7 Formal management development in the Australian operations by sector
Figure 5.8 highlights the results by country of origin. There are a number of variations with the most graphic being Japanese and German MNEs, which were far less likely to report a formal management development programme than MNEs of other nationalities. The German MNE’s finding is particularly interesting considering the high overall spend on T&D highlighted earlier. This finding is something that will be worthy of greater consideration when we undertake more in-depth analysis of the impact of other variables.
N = 211
Figure 5.8 Formal management development in the Australian operations by country of origin
We also asked respondents about the use of five different mechanisms for developing their high potentials. Specifically, we asked respondents to report the extent (1=not used, 5=used very extensively) to which they use the following for developing their high potentials:
87%
100%
85%
70%
89%81%
73%
100% 100%
71%
100%
80%
0%
10%
20%
30%
40%
50%
60%
70%
80%
90%
100%
US Japan UK Australia France Germany Asia ROE ROW

62
1. short-term international assignments (< 12 months duration)
2. long-term international assignments (> 12 months duration)
3. formal global management training
4. assessing performance against global management competencies
5. qualifications programmes (e.g. MBA).
Assessing performance against global management competencies is the most extensively used of all five mechanisms (see Figure 5.9) followed by global management training, qualifications, long-term international assignments and short-term international assignments.
Figure 5.9 depicts the mean values for the use of each of these development mechanisms according to the MNE’s country of origin. Australian-owned MNEs tend to be somewhat less extensive users of most mechanisms vis-à-vis other MNEs. This is particularly the case with the use of formal global management training. Another notable finding is in respect to the very high use of long-term international assignments by UK-owned MNEs compared to the other firms. There is also quite extensive use of qualifications programmes by the Asian MNEs with a mean score of 3. French firms were the most extensive users of assessing high potentials against global management competencies, which is in line with the findings of the comparative UK study (Edwards et al., 2007).
N = 171
Figure 5.9 High potential development mechanism use by country of origin (means)
Key group development
Respondents that indicated they formally identify a key group of employees in their Australian operations were asked if there was a specific development programme in place for them. Sixty-one per cent reported that there was a development programme for the key group in some/all of the Australian operations. This is slightly higher than
1.5
2
2.5
3
3.5
4
US Japan UK Australia France Germany Asia ROE ROW
S.T. Assignments L.T Assignments Global Mgt. Training
Global Mgt. Competencies Qualifications

63
the 57 per cent found in the Irish study (Lavelle et al., 2009) and considerably more than the 38 per cent in the UK survey (Edwards et al., 2007).
Australian-owned MNEs were the most likely (61 per cent) to report a development programme for the key group. This may in part be due to this being the home operations and research has shown that MNEs tend to keep higher value activities in their home country (Edwards & Ferner, 2002).
Management discretion over T&D
Similar to the previous chapters, we separate the results on discretion by foreign and indigenous MNEs. Figure 5.10 illustrates the discretion afforded by higher organisational levels of foreign MNEs to the Australian operations over the T&D policy and succession planning for high potentials or senior management potential. The results indicate quite high levels of autonomy are afforded to the Australian operations with 78 per cent of MNEs reporting quite a lot or full discretion in regard to the overall policy on T&D. Less autonomy exists in respect to our second measure with 53 per cent reporting quite a lot or full discretion over succession planning. The mean values for each variable (1=no discretion, 5=full discretion) were 4.1 and 3.4 respectively.
N = 171; 128
Figure 5.10 Discretion over T&D policy in Australian operations (foreign MNEs)
Now we analyse the discretion the Australian headquarters report their foreign operations have over the T&D policy and succession planning. Just in excess of half of the indigenous MNEs stated that the foreign operations have quite a lot or full discretion over the T&D policy. A lot less autonomy is afforded to these operations on succession planning as signified by the 24 per cent that reported a lot or full discretion. The mean values were 3.36 and 2.53 respectively.
0%
5%
10%
15%
20%
25%
30%
35%
40%
45%
T&D Policy Succession Planning
There is no discretion
There is a little discretion
There is some discretion
There is a lot of discretion
There is full discretion

64
N = 39; 30
Figure 5.11 Discretion over T&D policy in overseas operations (indigenous MNEs)
Conclusions
Overall, the findings suggest that the majority of MNEs in Australia place considerable attention on the development of their workforce as indicated by the use of formal succession planning, management development and talent management. Indeed we find that there is a greater percentage of MNEs with formal succession planning and management development than found in comparative studies in the UK (Edwards et al., 2007) and Ireland (Lavelle et al., 2009). Interestingly, concern over skills shortages was not very pronounced amongst respondents.
The findings suggest most MNEs spend significant amounts on T&D activities for its workforce with German MNEs the biggest spenders. MNEs in the mining sector were also found as significant investors in T&D. The vast majority of MNEs have formal succession planning systems and formal management development programmes both of which tend to be global in orientation. The data also suggests that a greater number of MNEs in Australia have these formal systems/programmes compared to MNEs in the UK and Ireland (Edwards et al., 2007; Lavelle et al, 2009). The strong global focus is also demonstrated in the mechanisms used for developing high potentials. We found that the assessment of performance against global management competencies and formal global management training were more extensively used than short- and long-term international assignments and qualifications programmes.
Engagement in talent management was very common amongst the participant firms. One slight exception was with respect to Japanese MNEs which were far less likely to undertake talent management vis-à-vis MNEs of other countries of origin. The strategic identification of pivotal positions and the use of talent pools were commonly part of talent management systems. Further research exploring the processes by which MNEs identify pivotal positions and establish talent pools would be useful. Almost six in ten MNEs that undertake talent management reported that they do not have a differentiated HR architecture based on the strategic importance of the different talent pools which Collings and Mellahi (2009) suggest should take place. It would be
0%
5%
10%
15%
20%
25%
30%
35%
40%
45%
T&D Policy Succession Planning
There is no discretion
There is a little discretion
There is some discretion
There is a lot of discretion
There is full discretion

65
interesting to examine the firms that do so versus those that don’t to establish the effectiveness of the differentiated HR architecture approach. The focus of talent management is also on developing competencies and skills that enables them to fit a range of positions rather than the more traditional system of developing people for a specific role.
In respect to the autonomy of subsidiary management of foreign MNEs in Australia, high levels of autonomy were reported on the T&D policy but less over succession planning. Similarly, the Australian headquarters reported that they give greater autonomy over the T&D policy compared to succession planning.

66
Section 6: Global staffing and organisational learning
Introduction
This section presents findings relating to global staffing practices and organisational learning mechanisms in MNEs. Traditionally, parent country expatriates (PCNs) have been the predominant form of global staffing used by MNEs, however, different assignments have emerged which have led to a portfolio approach to staffing options. In recent years there has been a marked increase in the number of firms making use of third-country nationals (TCNs) and there is increased interest in the use of international assignments which involve the movement of staff between subsidiary units and from subsidiaries to the corporate HQ typically known as inpatriates (Collings, McDonnell, Gunnigle, & Lavelle, 2010). In this context, we explore the use of different forms of long-term expatriates, as well as the use of short-term assignments, international frequent flyer assignments and virtual assignments.
We also explore data on the organisational learning mechanisms utilised by MNEs. The recognised significance of organisational learning and knowledge development in firm advantage unquestionably places a new emphasis on HR issues in the context of international management (Wright, Dunford, & Snell, 2001) and justifies a greater consideration of organisational learning mechanisms utilised by MNEs. While seminal work on organisational learning recognises individual employees as agents in which organisations learn (Argyris & Schon, 1996), our understanding of learning processes has placed a greater emphasis on the role of a variety of practices in ‘institutionalising learning’ (Crossan, Lane, White, & Rush, 1994). Extant academic literature on the management of organisational learning has emphasised the role of HR and other management practices in the creation of an organisational environment for learning (Adler, Goldoftas, & Levine, 1999). We specifically analyse the use of the following practices to promote organisational learning across MNEs:
expatriate assignments
international projects groups or task forces
international formal committees
international informal networks
secondments to other organisations internationally.

67
Global staffing
Examining the portfolio of assignments utilised in MNEs, the data indicates a widespread use of PCNs and TCNs by foreign MNEs. Seventy per cent of MNEs reported the use of either PCNs or TCNs in their subsidiaries. The data presented here is examined principally by country of origin as extant empirical work has long indicated that national influences are prevalent in regard to the use of international assignments (Tung, 1984). Evidence of some use of either of these two staffing options ranges from 56 per cent to as high as 90 per cent: US – 62 per cent, Japanese – 89 per cent, UK – 75 per cent, French – 90 per cent, German – 70 per cent, and Asian – 83 per cent.
Looking separately at the use of PCNs and TCNs, over half of the MNEs surveyed (53 per cent) reported that they had expatriates from the corporate headquarters, while 43 per cent reported they use TCNs. In line with findings in the comparative UK and Irish surveys (see Edwards et al., 2007; Lavelle et al., 2009) country difference was evident in the use of PCNs. The Japanese (89 per cent), French (70 per cent) and UK (67 per cent) MNEs use PCNs most while German MNEs were the least likely to use PCNs (39 per cent). Furthermore, while the use of PCNs is more common than TCNs in MNEs from Japan, UK and US, MNEs from the other countries studied reflect the opposite. The data on Japanese MNEs presented in Figure 6.1 stands out; where PCNs are a much more utilised form of global staffing than TCNs (89 per cent reported using PCNs while 17 per cent reported using TCNs in Australia).
N=211
Figure 6.1 Percentages of MNEs with PCNs and TCNs
There are some notable differences with the UK study. Seventy per cent of foreign MNEs in Australia reported the use of either PCNs or TCNs, the comparative figure in the UK study was 64 per cent of MNEs with the result in Ireland 53 per cent.
Sectoral data were also worthy of note with mining (70 per cent), engineering (67 per cent) and construction (67 per cent) MNEs emerging as those firms which were the most likely to report PCNs. This may be a reflection of relatively tighter labour market conditions in certain sectors in Australia, with MNEs using PCNs in a position filling role.
0%
10%
20%
30%
40%
50%
60%
70%
80%
90%
100%
US Japan UK France Germany Asia ROE ROW
PCNs in Australia
TCNs in Australia

68
International staff flows were even more common in Australian-owed MNEs, with 84 per cent reporting the use of long-term expatriates in their foreign operations and 61 per cent hosting staff from their foreign operations in Australia.
That MNEs continue to make use of PCNs as part of their global staffing portfolios at any level is noteworthy, as the organisational value, HR benefits and return on investment of this form of staffing has to be weighed against the recognised high cost of the use of such postings (Scullion & Collings, 2006). Expatriates from corporate headquarters are known to be utilised for position filling, coordination and control, knowledge transfer and organisational development (Edstrom & Galbraith, 1977; Harzing, 2001). The continued (and common) use of this expensive staffing choice suggests that the perceived benefits of PCNs fulfilling one or a combination of their organisational functions exceed the costs associated with their deployment. An alternative to the use of PCNs involves movements from subsidiaries to parent operations, commonly referred to as inpatriate assignments. These assignments are believed to be on the increase as they can facilitate some of the same organisational processes as those achieved by the use of PCNs, such as the diffusion of organisational culture, employee development and knowledge transfer.
From the data in Figure 6.2 we can see that this form of global staffing, while utilised, is not as common as the use of PCNs in subsidiaries. Thirty-five per cent of MNEs reported that there are expatriate employees from the Australian operations working in the parent country. MNEs from the UK were the most likely to host Australian expatriates with 50 per cent of firms surveyed indicating that they are currently doing so. By contrast Japanese (18 per cent) and other Asian MNEs (17 per cent) were considerably less likely to have Australian expatriates on a posting back to their parent company’s headquarters. Sixty-five per cent of MNEs reported the presence of Australian expatriates in either the parent country HQ or a third-country operation. However, the data clearly indicated that the movement of Australian expatriates to third-country units was more prevalent than movements to parent country operations. Overall, 53 per cent of MNEs reported the use of Australian expatriates in third-country operations of the MNEs global network.

69
N = 211
Figure 6.2 Percentages of expatriates from Australian operations in parent country HQ and third-country Operations
Similar to staff flows into the Australian operations, staff outflows from the Australian operations to other parts of the foreign MNE’s global network (HQ or third-country) takes place in 65 per cent of firms. This is slightly higher than found in the UK study where the figure was 60 per cent (Edwards et al., 2007). Further commonality was also evident. For example, the UK study found that Japanese firms send expatriates from UK operations overseas to a very limited extent, in congruence with the data presented here from the Australian context. Japanese firms are the least likely to have outward staff flows from Australia (47 per cent). They have also been shown to have the lowest outflow of staff from UK operations with 33 per cent of Japanese MNEs in the UK sending employees overseas to other units.
Finally, MNEs were also asked to report on how extensively each of following forms of international assignments are used; short-term assignments, long-term assignments, international frequent flyer assignments and virtual assignments. Frequency was measured using a five-point sale: 1=not used, 2=a little, 3=some use, 4=quiet extensively and 5=very extensively. The most utilised international assignment forms in order (i.e. usage reported to any degree), were short-term assignments (81 per cent), long-term assignments (79 per cent), virtual assignments (74 per cent) and international frequent flyer assignments (73 per cent). The largest percentage utilisation of each category of assignment was represented in the little to some use categories (with the exception of international frequent flyer assignments). For example, of the 81 per cent of MNEs that reported the use of short-term assignments, the majority reported a little (39 per cent) or some use (27 per cent). Similarly, of the 79 per cent of MNEs that reported the use of long-term assignments, the majority reported a little (33 per cent) or some use (29 per cent). The use of a portfolio of assignments forms in MNEs is certainly evident in this data. With the strong use of long-term assignments the data indicates that alternative assignments such as frequent-flyer and virtual assignments serve to complement rather than replace more traditional international assignments.
0%
10%
20%
30%
40%
50%
60%
70%
80%
90%
US Japan UK France Germany Asia ROE ROW
Parent country HQ
Other worldwide operations

70
Organisational learning mechanisms
Organisational learning involves the sharing of knowledge, beliefs and assumptions across the organisation (Argyris, 1999). The importance of staff flows in this process and, in particular, in the sharing of tacit knowledge in MNEs has long been recognised by international management scholars (Buckley & Casson, 1976). Many other organisational learning mechanisms utilised in MNEs implicitly reflect that an important part of a firm’s knowledge and learning capabilities are expressed through the cognitive processes and actions of a firm’s HR (Droege & Hoobler, 2003). For example, with a growing recognition that formal structures have a limited capacity in the integration of MNEs, the creation of informal approaches to integration through staff movements, collaboration and the creation of informal networks has been emphasised for organisational learning (Kostova & Roth, 2003).
N varies from 206 to 207
Figure 6.3 Percentages of MNE utilising each organisational learning mechanisms
From the evidence presented in Figure 6.3 we can see that informal networks and international project groups or task forces are the most commonly utilised organisational learning mechanism. Eighty per cent of MNEs reported the use of these mechanisms. International assignments are also commonly used with 66 per cent of MNEs conveying their use for organisational learning purposes. Over half of all MNEs reported the utilisation of international formal committees whereas only 27 per cent of MNEs use secondments to other organisations. All French MNEs stated they use international assignments for organisational learning purposes while every German and UK MNE reported the use of international project groups or task forces.
Evidence of the widespread use of these leaning mechanisms internationally can be seen in comparisons between the Australian data and that from the UK and Ireland (see Edwards et al., 2007; Lavelle et al., 2009), where informal networks and international project/task forces were also reported as the two most used international organisational learning mechanisms. In the UK the use of informal networks was slightly higher at 84 per cent, and 73 per cent of MNEs reported the use
0%
10%
20%
30%
40%
50%
60%
70%
80%
90%
Int. informal networks
Int.project groups/task forces
Int. assignments International formal committees
Secondments

71
of international project groups. Similarly, for MNEs in Ireland the most common organisational learning mechanism used was international informal networks (76 per cent) followed by international project groups (70 per cent). Interestingly, international assignments were reported as the third most important learning mechanism in all three countries.
While some international assignments may have a specific purpose of knowledge sharing and learning, irrespective of the specific function of an assignment, organisational development and learning is believed to be an outcome of the use of assignments through processes such as the creation of a verbal information network (Harzing, 2001). Informal networks and international project groups also serve to create information networks and, in practice, international project groups may also involve the use of alternative assignments. Therefore, when findings relating to the use of international assignments are coupled with those on the use of informal networks and international project groups in organisational learning, their relative importance in creating collaborative interactions across these MNEs might be worthy of further consideration.
When specifically asked to identify the most important learning mechanism used, 43 per cent identified international project groups as the most important, followed by 27 per cent reporting international assignments, 24 per cent informal networks, 4 per cent formal committees and 1 per cent secondments.
The most important learning outcome associated with the most important organisational learning mechanism utilised was also considered and the findings are presented in Figure 6.4.
N = 50 (international assignments); 80 (international project groups); 8 (international formal committees);
45 (international informal networks; 2 (secondments)
Figure 6.4 Importance of the learning outcome associated with learning mechanism
Data is presented using the mean importance score (1=not at all important, 5=very important). The most important learning outcome is the generation of new knowledge followed by the goal of best practice dissemination, global competency development and international policy development. The significance attached to knowledge
0.00
0.50
1.00
1.50
2.00
2.50
3.00
3.50
4.00
4.50
5.00
Int. informal networks
Int.project groups/task
forces
Int. assignments
International formal
committees
Secondments
Int. policy development
Int. best practice dissemination
Global competency development
Generate new knowledge

72
development and dissemination by MNEs is palpable – two of the central components of contemporary thinking in international management are that knowledge is the most strategically significant resource of the MNE, and that the ability to mobilise knowledge across the MNE is a fundamental strategic imperative (e.g. Gupta & Govindarajan, 2000). These contentions are supported by data presented in Figure 6.4, however, it is apparent from Figure 6.3, that although knowledge generation is a priority outcome when using any international organisational learning mechanism, in practice these outcomes are being achieved primarily through the use of international project groups, international informal networks and international assignments. We can conclude from this data that MNEs believe that these three learning mechanisms play an important role in the generation of new organisational knowledge and the transfer of best practice.
Conclusion
This section explored the data on global staffing and organisational learning practices in MNEs. Examining the portfolio of assignments utilised in MNEs, we reported the widespread use of PCNs and TCNs as part of staffing practices in Australian subsidiaries. In addition, staff movements between the Australian operations and parent country HQ were reported, as was the more frequent movement of Australian expatriates to third-country operations. Country of origin differences were apparent in the data, however, across all MNEs staff movement was evident. The use of a portfolio of assignment forms in MNEs is further supported in the data with alternative forms of assignments being used in addition to longer term overseas postings.
This section also reported on the use of a variety of organisational learning mechanism as well as the organisational learning outcomes attributed to them. Although this data was presented separately to the discussion on global staffing, some integrated discussion of these components of the survey was also provided, in cognisance that the movement of staff between global units is itself a recognised mechanism through which organisational learning occurs in MNEs (Gupta & Govindarajan, 2000).
Data was presented identifying the generation of new knowledge as the most important learning outcome associated with the organisation learning mechanisms, followed by the goal of best practice dissemination. At the outset of our discussion on organisational learning we noted the growing recognition that formal structures have a limited capacity in the integration of MNEs for knowledge generation and dissemination, and emphasised the need to create informal approaches (Kostova & Roth, 2003). The data presented in this section indicates that MNEs use informal networks extensively to complement formal mechanism.

73
Section 7: Employee involvement and
communications
Introduction
There is an interest in the extent and forms of communications that are present within MNEs. The evidence on workplace communication can be associated with high performance work systems (Edwards, Geary, & Sisson, 2002) through the presence of teams, direct communications and forms of information sharing between employees and managers, and between subsidiaries and head office. Such processes are also important in identifying the presence of strategic HRM practices (Lepak, Liao, Chung, & Harden, 2006) through regular two way communications flows between management and employees, feedback mechanisms and forms of employee participation in decision making. Effective communications systems within the workplace can help facilitate good workplace relations (Thomas, Zolin, & Hartman, 2009), the quality of management-employee relationships (Thomas et al., 2009), improve workplace performance (Clampitt & Downs, 1993), and contribute to trust and commitment to the organisation (Rodwell, Kienzle, & Shadur, 1998). The survey reveals how communication takes place within the Australian operations of MNEs
This section reports on the communications systems that are present within MNEs operating in Australia. The focus is on describing the prevalent forms of communication practices that are present within the Australian operations, especially between management and the LOG. The section does not deal with issues about union presence and voice (see Section 8). Nor does it examine the communications systems that are present within the global operations of the MNEs.
The chapter is organised as follows: first there is an overview of general employee involvement and participatory practices; next the different forms of communication and their frequency with the LOG are set out; these are then ranked by their importance; then follows the reporting of the extent to which management act on employee suggestions; the type of information provided to employees is then presented; and then follows presentations on the extent to which subsidiaries of overseas and domestic MNEs have discretion over the various communications processes.

74
Employee involvement practices
The survey suggests that there is widespread use of employee involvement practices (see Figure 7.1). Indeed, these direct practices are extensively used and the findings were above those found in the comparative studies conducted in the UK and Ireland (see Edwards et al., 2007; Lavelle et al., 2009). Eighty-two per cent of the respondents stated that the LOG were organised into teams in which employees had responsibility for organising work. Eighty-three per cent of the MNEs indicated that the LOG were organised into groups where employees discussed issues of quality, production or service delivery. In the Irish survey, problem-solving groups were present in three quarters of the MNEs (Lavelle et al., 2009). The presence of self-managed or semi-autonomous teams was much higher in Australia than compared with the similar findings from the UK (73 per cent) and Irish surveys (55 per cent).
N = 210 (self-managed teams); 208 (problem-solving groups); 193 (cross-unit project groups/task forces)
Figure 7.1 Employee involvement practices
Nearly 80 per cent of MNEs indicated the regular use of project teams that included employees other than managers across different operations in Australia. This result is similar to that found in the UK study (Edwards et al., 2007). In terms of the uniformity of communication systems across Australian sites, 44 per cent of the respondents had identical or similar patterns of employee involvement across all sites (see table 7.1).
Table 7.1 Pattern of employee involvement across Australian locations
The Pattern of Employee Involvement %
An identical or similar pattern exists across all sites 44
All or most sites have involvement systems but they differ from site to site 42
Some sites have involvement systems while others do not 14
N = 195
50%
55%
60%
65%
70%
75%
80%
85%
Self-managed teams Problem-solving groups Cross-unit project groups/task forces

75
Forms of communication with the LOG
With respect to the LOG, the main forms of communications across the MNEs are set out in Table 7.2. The respondents identified what forms of communications were used and they could identify multiple processes.
Table 7.2 suggests that both formal (through meetings) and informal (an open door policy) channels of communication are important. These are traditional forms of communication and they remain important. However, it was surprising to see that in comparison with the other forms of communications, joint consultative committees (JCCs) and suggestion schemes were ranked as the least likely communication mechanisms in use. We would expect that the application of JCCs would be linked to union presence within the MNE which will be investigated at a later stage. Electronic forms of communication via emails or the company intranet were also widely used across the MNEs.
Table 7.2 Forms of communications with the LOG
Communication Mechanisms %
Briefing groups 99.5
Newsletters or emails 98
Open door policy by management (foreign MNEs only) 98
Use of the management chain to cascade information 93
Company intranet 90
Meetings between senior managers and the workforce 86
Attitude and opinion surveys 82.5
Joint consultative committees 61
Suggestion schemes 60
N = 211
In Table 7.3 the use of communications mechanisms by the country of ownership of MNEs is listed. The table excludes the rest of Europe and rest of world categories. Since some of the numbers are relatively small (UK, France and Germany) we urge caution in interpreting the results. However, when we look at the different communications mechanisms the percentages across countries and the rankings between the communications systems are similar. This contrasts with the diversity across countries of origin found in the Irish survey of MNEs (Lavelle et al., 2009). Suggestion schemes and JCCs are not used as much as the other mechanisms. German MNEs stand out in terms of the relative scores for being most likely to report meetings and JCCs (the formal mechanisms) and relatively low on attitude/opinion surveys, suggestion schemes, emails and the company intranet (the informal communication processes). With respect to US-owned MNEs, the UK survey (Edwards et al., 2007) reported that US firms did not stand out in terms of a different pattern of communications being applied or with greater emphasis on centrally controlled practices such as attitude surveys. There does not appear to be any finding of US exceptionalism in communications processes from the Australian survey.

76
Table 7.3 Communications mechanism by country of origin
US
Australia
UK
Japan
France
Germany
Asia ROE ROW
Meetings between
managers and
workforce
94% 82.5% 85% 83% 80% 92% 83% 60% 89%
Briefing groups 99% 100% 100% 100% 100% 100% 100% 100% 100%
Attitude/opinion
surveys
85% 82.5% 85% 89% 80% 77% 50% 93% 78%
Suggestions
schemes
58% 65% 54% 72% 60% 54% 67% 53% 44%
Management chain
to cascade
information
99% 90% 85% 89% 100% 85% 100% 87% 89%
Emails/newsletters 99% 100% 100% 94% 100% 85% 100% 100% 100%
Company intranet 94% 87.5% 100% 83% 90% 77% 100% 80% 89%
JCCs 58% 60% 61.5% 67% 40% 69% 67% 80% 56%
Open door policy 100% NA 100% 100% 90% 92% 92% 94% 100%
N = 211
Taking the information from Table 7.3 further, respondents were asked to rate the importance of the various communication mechanisms (see Figure 7.2). By far the most important mechanism was meetings between line managers/supervisors and employees. Meetings between senior managers and the whole workforce were rated second, but well behind. Every other form of communication scored low ratings, including the electronic forms of communication. The attitude and opinion surveys and JCCs were not regarded as being important, reflecting their low scores in terms of use as communication mechanisms. The attitude and opinion surveys also had a low rating in the Irish survey of MNEs (Lavelle et al., 2009). The implication is that top down communication flows were seen by HR managers to be more important to the organisation than communication processes that flowed from employees. This suggests that employee involvement strategies, in a strict ‘involvement’ sense flowing from employees to managers, may not be as extensive as first indicated by Figure 7.1. In essence, the findings may suggest that communication rather than involvement is the norm.

77
N = 205
Figure 7.2 What is the most important communication mechanism?
When we examined the importance of the communication mechanisms by the country of origin the distribution found in Table 7.3 was followed by most countries. The one exception was German MNEs where 83 per cent ranked meetings between line mangers/supervisors and employees as being the most important communication mechanism. There were differences in some of the ratings – 15 per cent of UK MNEs regarded emails and open door policies as being the most important communication policies while in the case of French MNEs, 40 per cent regarded meetings between senior managers and the LOG as being the most important. This general pattern was also the case across those industries where there were at least 20 MNEs in the sector. In these sectors (all manufacturing, financial services and wholesale/retail trade) meetings between line managers/supervisors and employees, and meetings between senior managers and LOG were regarded as the most important communication mechanism.
Extent to which Management Act on Employee Suggestions
Around three quarters of participants stated that employee suggestions were acted on often or sometimes. In only 9 per cent of the cases did respondents report that they were regularly acted upon (see Figure 7.3). This does not reveal the frequency or quality of employee suggestions. The previous evidence suggests that the information flow from employees to management is considerably less than that from management to employees. Considering that the respondent is the senior HR manager/director, one must be cautious in interpreting these as a true reflection of practice.
0%
10%
20%
30%
40%
50%
60%

78
N = 209
Figure 7.3 How often management act on employee suggestions
Types of information provided to the LOG
The survey asked about the type of information that was disclosed to the LOG. Table 7.4 reports on the provision of financial information, investment plans and the staffing plans of Australian operations to the LOG. The financial situation is often/regularly reported in 70 per cent of MNEs while the comparable incidence for investment and staffing plans is around one quarter of firms; this distribution applies to both foreign- and indigenous-owned MNEs. The least regularly reported item to the LOG was the staffing plans of the Australian operations. The UK survey reported that around 80 per cent of MNEs provided financial information to employees (Edwards et al., 2007).
UK- and US-owned MNEs tended to report the greatest regularity of information provision. For instance, with respect to providing information on the financial position of the company, we found a mean score of 4.14 for US firms, 4.38 for UK firms, 3.83 for Japanese MNEs, 3.7 for Australian organisations and 3.9 for French. Looking at this in a sectoral sense, health sector, transport/storage and construction MNEs were less regular in the provision of financial information to the LOG than MNEs in other areas.
Table 7.4 Extent to which information is reported to the LOG
Item Never Seldom Sometime Often Regularly
Financial situation (all MNEs) 2% 12% 17% 33% 36.5%
Investment for Australian operations plans (foreign MNEs)
27% 26% 21% 135 13%
Staffing plans for Australian operations (foreign MNEs)
18% 25% 31% 165 9%
Investment plans for the company (indigenous MNEs)
26% 23% 23% 15% 13%
Staffing plans for the company(indigenous MNEs)
26% 28% 20.5% 18% 8%
N varies from 39 for indigenous MNE variables to 165 and 169 for foreign MNE variables and 211 for the variable
involving all MNEs.
5%
50%
36%
9%
Seldom
Sometimes
Often
Regularly

79
Discretion and control of over employee involvement and communication
What about the discretion or control exercised by the Australian operations over employee involvement and communications? This can provide an indication of the degree of local autonomy exercised over communications and indicate the extent to which communications policies, details and processes are determined by head offices. A number of questions were asked to the foreign MNEs about the discretion of the Australian operations with respect to different forms of communications (see Figure 7.4).
Figure 7.4 indicates that the local operations report quite a lot or complete control across the four forms of communications processes. The mean values confirm this with values in excess of four the norm, with the exception of attitude or opinion surveys which was the area of least local autonomy. The mean values according to each country on this mechanism tended to be a lot lower than the other methods with the exception of Japanese MNEs who reported similarly high autonomy over all four. Given that these are relatively unused forms of communication this finding indicates that the opinion surveys have a strong head office involvement where they are applied. There does not appear to be any sectoral differences from this preliminary analysis.
N varies from 100 (suggestion schemes) to 141 (attitude/opinion surveys) to 171 for the remaining two
variables.
Figure 7.4 Discretion of the Australian operations over the determination of employee involvement and communication policy
We now turn to the discretion the Australian MNEs afford to their foreign subsidiaries. The area least likely to have quite a lot or complete control is with respect to attitude or opinion surveys. For the other forms of communications there exists quite a lot or complete discretion regarding the different processes.
0%
10%
20%
30%
40%
50%
60%
Involvement of employees in the
work process
Provision of information to
employees
Attitude or opinion surveys
Suggestion schemes
There is no discretion
There is a little discretion
There is some discretion
There is quite a lot of discretion
There is full discretion

80
N varies from N =23 (suggestion schemes) to N = 31 (attitude/opinion surveys) to N = 33 for involving
employees in the work process to N = 38 for provision of information.
Figure 7.5 Discretion afforded to the foreign operations of Australian owned MNEs over the determination of employee involvement and communication’s policy
Conclusion
The evidence suggests widespread use of employee involvement and communication practices in the Australian operations of MNEs. Teams and quality circles were present across most of the MNEs’ operations. These patterns of employee involvement were reported as being identical across nearly one half of all the Australian sites. In terms of the channels of communication that were applied there was widespread use of traditional forms of communication (meetings, open door policy) and electronic forms of communication (emails, the intranet). JCCs and suggestion schemes were the least likely communication mechanisms to be used which suggests that MNEs are more communicators in a top-down sense than looking for ‘true’ employee involvement. When the use of the communication systems is reviewed against the country of MNE ownership the rankings by country are very similar. German MNEs were the only ones to stand out in terms of the relative scores –high on meetings and JCCs and relatively low on attitude/opinion surveys, suggestion schemes, emails and the company intranet (the informal communications processes). When asked to rate the importance of the communication mechanisms by far the most important mechanism was meetings between line managers/supervisors and employees. Meetings between senior managers and the whole workforce were rated second.
Respondents reported that they regularly act upon employee suggestions. The survey asked about the type of information that was disclosed to the LOG. The financial situation of the MNEs local operations is often/regularly reported in 70 per cent of the responses while the comparable incidence for investment and staffing plans is around one quarter of responses; this distribution applies to both foreign- and indigenous-owned MNEs. Thus, a significant number of MNEs provide information on key organisational facets to its workforce. Overall, we conclude that there appears to be an
0%
5%
10%
15%
20%
25%
30%
35%
40%
45%
50%
Involvement of employees in the
work process
Provision of information to
employees
Attitude or opinion surveys
Suggestion schemes
There is no discretion
There is a little discretion
There is some discretion
There is quite a lot of discretion
There is full discretion

81
emphasis on top-down, management directed, traditional communication mechanisms. In contrast, mechanisms that are employee based are regarded as less important in the Australian operations. As the data is interrogated further, we expect to find some more interesting results on the impact of other factors on the use of employee involvement and communication mechanisms.

82
Section 8: Employee representation and consultation
Introduction
Employment relations practices of MNEs have attracted the attention of researchers for many years (Almond et al., 2005). In recent years there has been significant interest in the concept of employee representation and consultation, from its impact on individual and organisational performance to developing more effective systems of employee representation (Wilkinson, Dundon, Marchington, & Ackers, 2004). The forms, structures and approaches to employee representation and consultation often gravitate towards discussions of the role of unions. MNEs from different countries of origin have distinctive preferences with regard to both individual and collective employee representation practices. For example, US-owned MNEs have traditionally preferred individual forms of employee representation such as individual contracts. Approaches of MNEs towards employment relations may derive from national historical, economic, legal and cultural models of the MNEs’ country of origin (Dowling, Festing and Engle, 2008).
The ‘best’ form of employee representation and consultation is hotly debated by academics and managers (Kramar, Bartram & De Cieri, 2011). For example, Freeman and Medoff (1984), suggest that trade unions are seen as the best agents to provide employee voice as they remain independent of the employer. Freeman and Medoff (1984) argue that there is a significant association between unionisation and the retention of employees. The presence of unions in an organisation provides employees with a voice mechanism through which they can obtain higher compensation than they could earn in a non-union job (Batt, Colvin, & Keefe, 2002). Moreover, “unions provide workers with a voice in determining an array of other rules and conditions of work, including policies that reduce pay inequality, grievance and arbitration procedures for appealing managerial decisions, ‘just cause’ for discipline and discharge, and seniority clauses desired by workers” (Batt et al., 2002, pp. 573-594). In contrast, contemporary HRM scholars have argued that individual based employment relations practices that centre on a direct relationship between employees and their employer may enhance organisational commitment, employee trust and organisational flexibility (Kramar et al., 2011). These are both important and complex debates for organisations and their managers, employee welfare, the national economy and wider community in general.
This section sheds light on the character of employee representation and consultation in foreign and Australian MNEs operating in Australia. First, findings are presented on

83
union recognition in MNEs operating in Australia. Second, MNE responses to the role of unions in managing organisational change in their Australian operations are presented. Third, management attitudes towards unions are discussed. Fourth, trade union membership figures are presented in terms of aggregate, industry sector and country of origin. Fifth, employment arrangements for the LOG are presented in terms of aggregate, industry sector and country of origin. Sixth, membership of Employer or Industry Associations and access to business and government services is discussed. Seventh, our findings regarding the discretion of the Australian operations in the determination of employee representation and consultation are presented. Finally, conclusions are drawn.
Trade union recognition
Respondents were asked whether their Australian operations recognised trade unions for the purposes of collective bargaining representation. Over 41 per cent reported that trade unions were not recognised at any sites, 18.5 per cent of respondents indicated that all sites in the Australian operations recognised unions, whilst a further 15 per cent claimed that most sites recognised unions.
N=211
Figure 8.1 Trade union recognition in Australian operations
Figure 8.2 illustrated union recognition by country of origin. We use a dichotomous variable whereby the MNE does not recognise unions or they recognise them in one or more sites. The Rest of Europe MNEs, German, Australian and French MNEs are the most likely to recognise trade unions. British, Japanese and US MNEs are the least likely to engage with trade unions for collective bargaining purposes.
0%
5%
10%
15%
20%
25%
30%
35%
40%
45%
No sites All Sites Most Sites Some Sites Company's Single Australian Site

84
N =211
Figure 8.2 Trade union recognition by country of origin
Respondents were asked to indicate the number of unions that they recognise for the purpose of collective bargaining. Of the 114 respondents that recognised trade unions, the majority of MNEs reported recognising more than one union for the purpose of collective bargaining. Nearly 10 per cent of MNEs recognised five or more trade unions. One MNE reported recognising twelve unions for collective bargaining purposes. The mean response in the sample was 2.84 unions.
Respondents were also asked to think about any new sites which have been established in Australia in the previous five years and whether unions had been recognised for the purposes of collective employee representation. Over 50 per cent of respondents indicated that no new sites had been opened in the last five years. Of those that had opened new sites, over 20 per cent reported that trade unions had been recognised at every site for the purposes of collective employee representation.
N=114
Figure 8.3 Trade union recognition in new Australian sites in the past five years
0%
10%
20%
30%
40%
50%
60%
70%
80%
90%
US Japan UK Australia France Germany Asia ROE ROW
0%
10%
20%
30%
40%
50%
60%
Yes, at each new sites
Yes, at most new sites
Yes at some new sites
No, at no new sites
No new sites were opened

85
Moreover, we asked respondents about the acquisition of sites. A mean of 52.49 sites in Australia were acquired by MNEs operating in Australia in the last five years. This mean is skewed by one MNE acquiring 2,500 sites in Australia in the last five years. Of the 62 MNEs that answered this question, 18 per cent of the MNEs have acquired four or less sites in Australia. Of the acquired sites, most were unionised with only 9 per cent non-union. Since the acquisitions, 31 per cent reported that there had been new trade union recognition for the purpose of collective bargaining with 69 per cent of the acquired sites having no new trade union recognition arrangements.
N = 68
Figure 8.4 Changes have taken place in trade union recognition since acquisition(s) over the past five years
Role of trade unions in managing organisational change
We asked participants about the role of trade unions in managing organisational change. Three quarters of respondents indicated that the role of trade unions in managing organisational change was best described by the statement “discussions take place with union representatives in a way that their views are taken into account but management are free to make the decision”. A further 14.5 per cent reported that “negotiations take place with union reps and the decision is dependent on their agreement”. Over 8.5 per cent of respondents indicated that “no discussions take place with union reps” regarding organisational change.
0%
10%
20%
30%
40%
50%
60%
70%
80%
Yes No

86
N=124
Figure 8.5 The role of trade unions in managing organisational change
Management attitudes towards trade unions
Managers in MNEs were asked “to what extent do you agree with the following statements in respect to the approach of management-employee relations in the Australian operations?”. First, “management prefers to deal directly with employees”. Second, “management would not mind dealing with unions should employees join one”. Overwhelmingly, almost 86 per cent of HR managers reported that they either “agree” or “strongly agree” with the statement “management prefer to deal directly with employees”. Five per cent of respondents either “disagree” or “strongly disagree” with the statement. Moreover, 41 per cent of respondents either “disagree” or “strongly disagree” with the statement “management would not mind dealing with unions should employees join one”. A total of 34.5 per cent of managers reported that they either “agree” or “strongly agree” with this statement.
Trade union membership
We asked HR managers about the total number of employees in their Australian operations that are members of a trade union. The mean response of the total number of employees in the Australian operations that are union members was 18 per cent. This echoes wider Australian averages indicated by the Australian Bureau of Statistics (ABS). The proportion of employees who were union members in their main job decreased from 20 per cent in August 2009 to 18 per cent in August 2010. This represents 1.8 million union members in their main job – a fall of 47,300 from the previous year (ABS, 2010).
Almost 21 per cent of MNEs reported no union members. Of those that reported trade union membership, 49 per cent of HR managers indicated that union membership was below 50 per cent in their MNE Australian operations. Just over 5 per cent of MNEs reported that trade union membership was between 76 and 100 per cent. It is important to note that there was a significant percentage of respondents who were unable to provide union membership. We also investigated these responses in terms of country origin and industry sector. The findings are presented below.
10.5%
75%
14.5%
No discussions take place
Discussions take place but mgt are free to make the decision
Negotiations take place with union reps & the decision is dependent on
their agreement

87
We analysed union membership by country of origin. US MNEs reported the lowest union membership figure (9.98). UK MNEs also reported low union density rates (12.88). Australian MNEs had higher reported rates union density rates at 20.25 and Japanese MNEs at 22.93. Interestingly, Asian MNEs reported union membership at 41.83 of the workforce. However, this figure may be an artifact of the particular organisations included in our sample.
We examined union membership by industry sector. Findings largely echoed general Australian industry figures. MNEs operating in agriculture, utilities, retail and wholesale, manufacturing-engineering, computer, electrical and medical equipment reported the highest levels of union density. MNEs operating in financial and business services, information technology and communication services and engineering and consultancy services reported the lowest union membership figures.
Employment arrangements for the largest occupational group
The HR managers were asked “what percentage of the LOG in the Australian operations are covered by the following arrangements (union collective bargaining, non-union collective bargaining, award only and individual level arrangements)?” Union collective bargaining covered 29 per cent of the LOG (mean values) in the Australian operations, non-union collective bargaining covered 9 per cent of the LOG, whilst award only provision covered 18 per cent of the LOG. Furthermore, 48 per cent of LOG in the Australian operations were reported as being covered through individual level arrangements.
N=211
Figure 8.6 Percentage of the log in the Australian operations covered by union and non-union collective bargaining, award only and individual level bargaining
We also examined these employment arrangements in relation to country of origin and industry sector. It is clear that individual employment arrangements are the dominant arrangement in UK- and US-owned MNEs. To a lesser extent Asian and Japanese MNEs are also high users of individual employment arrangements. In contrast, European, German and Australian MNEs tend to be high users of union collective bargaining arrangements. These practices may reflect institutional structures
29%
9%
18%
48%
Union Collective
Bargaining
Non-Union Collective
Bargaining
Award only
Individual level arrangements

88
that promote collective employment arrangements in Australia and Europe. Award only arrangements remain an important fall back employment arrangement for virtually all MNEs operating in Australia.
With respect to sector, it is clear that mining, agriculture, financial and business services, information and communication services, engineering and consultancy services are high users of individual employment arrangements. In contrast, manufacturing, utilities and transport and storage sector MNEs tend to be higher users of collective employment arrangements. It is clear that within our sample individual level employment arrangements are an important feature across all industries with the exception of the healthcare sector. Non-union collective bargaining arrangements are also an important employment arrangement particularly in the agricultural, mining and healthcare sectors.
Industry/employer association membership
We asked respondents whether their Australian operations were members of an industry or employee association. Over 85 per cent of the Australian operations reported that they are.
N= 208
Figure 8.7 Membership of employer/industry associations
We also asked what type of information management sought from their industry or employee association. Sixty-three per cent of respondents reported that their Australian operations sought information on pay rates from their employer or industry association. Nearly 64 per cent reported that that they sought advice on OHS matters, 56 per cent use them for advice on dismissals, whilst 71 per cent stated they use them for advice on employment legislation. Finally, 64 per cent advised that they use them for other legal matters.
0%
10%
20%
30%
40%
50%
60%
70%
80%
90%
100%
Yes No

89
Table 8.1 Services utilised from employer/industry associations
Services N %
Information on Pay Rates 132 63
Advice on Occupational Health and Safety 134 63.5
Advice on Dismissals 117 55.5
Employment Legislation 150 71
Legal Advice 115 54.5
We also asked participants about whether MNEs had dealings with a number of key bodies or associations. Twenty per cent reported that they have had direct dealings with the Australian Human Rights Authority, 21 per cent with indigenous community organisations, 75 per cent with Fair Work Australia, 34 per cent with alternative dispute resolution bodies, and 67 per cent also answered they have had direct dealings with the Equal Employment in the Workplace Authority.
Table 8.2 Percentage of MNEs that have had direct dealings with the following groups over employment issues
N %
Australian Human Rights Authority 42 20
Indigenous Community Organisations 45 21
Fair Work Australia 159 75
Alternative Dispute resolution or Similar Professional Services 72 34
Equal employment Opportunity in the Workplace Authority 142 67
Discretion over employee representation and consultation policies
Seventy-one per cent of HR managers in foreign-owned MNEs reported that they had full discretion over trade union recognition in their Australian operations. Only 9 per cent reported that Australian operations had no discretion over the trade union recognition policy. Moreover, 68 per cent of foreign MNEs reported full discretion over the extent to which they involved trade union in management decision-making. Further, 73 per cent reported that they had full discretion over employee consultation. Only 1 per cent of foreign MNEs reported having no discretion over the extent of union involvement in decision-making and over employee consultation.

90
N varies from 90 to 168
Figure 8.8 Discretion of the Australian operations over the determination of employee representation and consultation policy
We also asked managers of Australian-owned MNEs about the discretion of their foreign operations over the determination of these aspects of employee representation and consultation. Twenty-two per cent of respondents in Australian MNEs reported that the foreign operations had full discretion over trade union recognition. One quarter reported they had no discretion. Approximately 17 per cent of Australian MNEs stated the foreign operations had full discretion over the extent to which they involved trade unions in management decision-making.
Conclusions
The findings demonstrate MNEs preference for direct employee representation and consultation in their Australian operations. However, it is also clear that despite recent trends towards the growth in individual level and decentralised employment arrangements in Australia, union representation and collective employment arrangements still remain an important feature within the Australian landscape. The results suggest that MNEs continue to engage with collective employee representation and consultation particularly in traditionally unionised sectors such as retail and wholesale, utilities and manufacturing. Almost 60 per cent of MNEs reported they recognise trade unions for the purposes of collective bargaining in at least one of their sites.
0%
10%
20%
30%
40%
50%
60%
70%
80%
Trade union recognition
Extent of union involvement in
decision-making
Employee consultation
There is no discretion
There is a little discretion
There is some discretion
There is quite a lot of discretion
There is full discretion

91
Section 9: Conclusion
This report has provided the key results stemming from a large-scale, representative survey of HRM practices in MNEs operating in Australia. In this final section, we draw out some of the key conclusions from the preceding sections. It is important to note that this report did not involve in-depth statistical analysis and the data were only explored in respect to two variables, namely country of origin and sector. Consequently, we urge caution in interpreting these results.
This report drew on data garnered from the most senior HR practitioner of the Australian operations of 211 foreign- and indigenous-owned MNEs. It is clear that US-owned firms are by some considerable distance the largest national grouping of MNEs in Australia. There are also a significant number of indigenous-owned MNEs now operating internationally. A possible surprise was the relatively small number of MNEs from China and India. This may suggest that a considerable part of Chinese and Indian investment is by means of small shareholdings in listed companies, bonds and property rather than FDI, and/or that a small number of organisations dominate the trade and investment flows from these countries. MNEs in Australia tend to be of quite recent vintage and they are engaged in a wide-ranging number of industrial sectors. A significant percentage of firms also operate in more than one sector. Similar to what has taken place in many other developed economies, the services sector accounts for the greatest proportion of MNEs operating in Australia.
The majority of MNEs are multi-site operations in Australia and these tend to be organised along regional lines. The method of establishment in Australia by foreign-owned MNEs was shared between M&As and new greenfield sites. The evidence suggests that the Australian operations do not commonly have high valued-added mandates. With respect to the impact of the GFC, we found evidence of short-term cost-cutting but large-scale structural changes were less apparent.
With respect to the HR function, we found that the majority of HR departments appear somewhat small in that six in ten firms indicated they had between one and nine employees. The use of HRIS that collated information on the MNE’s international workforce was not very common with less than 50 per cent reporting their existence. There were high levels of monitoring by higher organisational levels with respondents commonly reporting managerial pay, management progression, selection of top management team, labour costs and headcount were all sought by headquarters management. Linked to monitoring, we explored the levels of discretion of different HR policy areas. The results were variable across the different policies. For example, the discretion afforded to the Australian operations of foreign MNEs over employee

92
share ownership schemes was very low. Considerably more discretion was afforded to the Australian operations over the T&D policy.
There was some interesting country differences in respect to the different HR measures included in the study. For instance, almost all US MNEs had formal performance appraisal systems for all staff and were the most likely to use force distribution systems. They tended to be less likely to have a pay policy in the top quartile relative to MNEs of other nationalities. Some interesting results emerged from the Japanese MNEs. For example, they were the least likely to report engagement in talent management. We also found that no Japanese MNEs offered employee share ownership schemes or share options.
It was difficult to establish, based on the analysis undertaken in this report, whether there is a discernible Australian approach to HRM in respect to the indigenous MNEs. Overall, it appears that they are about average in terms of reporting the different HR practices that we sought information on. In saying that, we found that Australian MNEs are the most likely to offer an employee share ownership scheme and the least likely to offer profit sharing. They are low users of forced distribution over the results of performance appraisals for all employee categories. They were also one of the least likely to have performance related pay for the largest occupational group. About three quarters of indigenous MNEs engage with trade unions for collective bargaining purposes.
Some of the most interesting results were with respect to Asian MNEs. They are by some distance the most likely to have a pay policy for all employee categories to be in the top or second quartile. They were found to be lowest spenders on T&D with just the one MNE spending greater than four per cent of their annual pay bill for this purpose. They were also one of the least likely to report the use of a formal system of succession planning and few Asian MNEs make use of inpatriate assignments.
Many of the findings in this study mirror those from comparative research conducted in the UK and Ireland, however there appears some notable differences which warrant future analysis in explaining why. For example, MNEs in Australia appear more likely to have a formal succession planning system and management development programme for high potentials than MNEs in the UK and Ireland. Further, greater numbers of MNEs in Australia reported the use of PCNs or TCNs than in Ireland and the UK.
Although we point to a number of differences between MNEs of different nationality, it is also important to highlight the similarity between MNEs from different countries over certain HR practices (e.g. strong similarity in the use of formal performance appraisals). A key conclusion is that while there are commonalities in the use of certain HR practices, there is no single model of MNE in operation.
We recommend MNEs use the data from this report to identify where they currently sit. After doing this, they should consider the following questions. First, if they are not using a practice, why aren’t they, and are there positive or negative consequences of this? Second, if they are using particular practices, are they achieving their objectives and are they integrated with other practices into a coordinated HR system?

93
References
Adler, P.S., Goldoftas, B., Levine, D.I. (1999) "Flexibility versus efficiency? A case study of model changeovers in the Toyota production systems", Organisation Science, Vol. 10, No.1, pp.43-68.
Almond, P, Edwards, T, Colling, T, Ferner, A, Gunnigle, P, Müller-Camen, M, Quintanilla, J & Wächter, H. (2005) “Unravelling home and host country effects: an investigation of the HR policies of an American multinational in four European countries”, Industrial Relations, Vol. 44, No. 2, pp. 276-306.
Almond, P. and Ferner, A. (2006) American Multinationals in Europe: Managing Employment Relations Across National Borders, Oxford University Press, Oxford
Argyris, C. (1999) On Organizational Learning. Oxford, Blackwell.
Argyris, C., Schon, D. (1996) Organisational Learning II: Theory, Method and Practice, Addison-Wesley, Reading, MA.
Australian Bureau of Statistics (ABS). (2010). Employee Earnings, Benefits and Trade Union
Membership, Australia, Aug 2010 cat. 6310.0. Canberra: ABS.
Baron, A. and Armstrong, M. (2007) Human Capital Management: Achieving Added Value Through People, London: Kogan Page.
Batt, R, Colvin, A & Keefe, J (2002) “Employee Voice, Human Resource Practices, and Quit Rates: Evidence from the Telecommunications Industry”, Industrial and Labor Relations Review, Vol. 54, No. 2, pp. 573 - 94.
Belanger, J., Harvey, P.-A., Jalette, P., Levesque, C. and Murray, G. (2006) Employment Practices in Multinational Companies in Canada: Building Organizational Capabilities and Institutions for Innovation. University of Montreal, HEC Montreal, Laval University: Montreal and Quebec.
Boxall, P. (1992) “Strategic human resource management: beginnings of a new theoretical sophistication”, Human Resource Management Journal, Vol. 2, No. 3, pp. 60-79.
Buckley, P. and Casson, M. (1976) The Future of the Multinational Enterprise, Holmes and Meier, New York.
Butler, R. A. (2005) Corporations among largest global economic entities, rank above many countries. Available from: http:news.mongabay.com/2005/0718-worlds_largest.html. Accessed: 14 October 2008.
Cappelli, P. (2009) “A supply chain model for talent management”, People & Strategy, Vol. 32, pp. 4–7.

94
Clampitt, P. and Downs, C. (1993) “Employee Perceptions of the Relationship Between Communication and Productivity: A Field Study”, Journal of Business Communication, Vol. 30, pp. 5-28.
Claus, L. and Briscoe, D. E. (2008) “Special Issue on Global Performance Management”, European Journal of International Management, Vol. 2, No. 2, pp. 132-227.
Collings, D. G. and Mellahi, K. (2009) “Strategic talent management: A review and research agenda”, Human Resource Management Review, Vol. 19, pp. 304-313.
Collings, D. G., McDonnell, A., Gunnigle, A. and Lavelle, J. (2010) “Swimming against the Tide: Outward Staffing Flows from Multinational Subsidiaries”, Human Resource Management (US), Vol. 49, No. 4, pp. 575–598.
Crossan, M., Lane, W., White, R.E. and Rush, J.C. (1994), "Learning within organisation", The University of Western Ontario Richard Ivey School of Business, London, Ontario.
Deresky, H. (2010), International Management: Managing Across Borders and Cultures. 7th Ed. New York: Pearson Education
Doremus, P.N., Keller, W.W., Pauly, L. W. and Reich, S. (1998) The Myth of the Global Corporation, Princeton University Press, Princeton.
Dowling, P.J., Festing, M. and Engle, A.D (2008) International human resource management (5th Ed). Cengage Learning: Australia
Droege, S. and Hoobler, J. (2003) “Employee Turnover and Tacit Knowledge Diffusion: A Network Perspective”, Journal of Managerial Issues, Vol, 15, No. 1, pp. 50-65.
Dunning, J. H. (1998) American investment in British manufacturing industry, 2nd edition. London: Routledge.
Edstrom, A and Galbraith, J. (1977) “Transfer of Managers as a Coordination and Control Strategy in Multinational Organisations”, Administrative Science Quarterly, Vol. 22, No. 2, pp. 248-263
Edwards, P., Edwards, T., Ferner, A., Marginson, P. and Tregasksis, O. (2007) Employment Practices of MNCs in Organisational Context: A Large-Scale Survey, Feedback Report for Participating Companies. Economic and Social Research Council, De Montfort University, Kings College London and Warwick Business School.
Edwards, P., Geary, J. and Sisson, K. (2002) “New Forms of Work Organization in the Workplace”, in G. Murray, J. Belanger, A. Giles and P.-A. Lapointe (Eds.), Work and Employment Relations in the High-performance Workplace. London: Continuum.
Edwards, T. and Ferner, A. (2002) “The renewed ‘American Challenge’: a review of employment practice in US multinationals”, Industrial Relations Journal, Vol. 33, No. 2, pp. 94-111.
Evans, P., Pucik, V. and Bjorkman, I. (2011) The Global Challenge: International Human Resource Management. 2nd Ed. NY: McGraw-Hill Irwin.
Ferner, A. (1997) “Country of Origin Effects and Human Resource Management in Multinational Companies”, Human Resource Management Journal, Vol. 7, pp. 19-37.
Foreign Investment Review Board (2008). Annual Report 2007-08. Barton, ACT: Commonwealth of Australia.
Freeman, R. and Medoff, J. (1984) What do Unions Do? New York: Basic Books.

95
Gamble, J. (2003) “Transferring human resource practices from the United Kingdom to China: the limits and potential for convergence”, International Journal of Human Resource Management, Vol. 14, pp. 369-387.
Graham, E. M. (2003). Attractive Foreign Direct Investment to the United States: The Joust between the Federal Government and the States. In N. A. Phelps and P. Rains (Eds.). The New Competition for Inward Investment. Cheltenham: Edward Elgar.
Grugulis, I. (2007) Skills, Training and Human Resource Development: A Critical Text, Hampshire: Palgrave Macmillan.
Gupta, A. and Govindarajan, V. (2000) “Knowledge flows within multinational corporations”, Strategic Management Journal, Vol. 21. No. 4, pp. 473.
Gunnigle, P., Morley, M. J., Clifford, N., Turner, T., Heraty, N. and Crowley, M. (1997) Human resource management in Irish organisations: practice in perspective. Dublin: Oak Tree Press.
Harzing, A.W. (2001) “An analysis of the functions of international transfer of managers in MNCs", Employee Relations, Vol. 23, No. 6, pp.581-598.
Harris, H., Brewster, C. and Sparrow, P. (2003) International Human Resource Management. London: CIPD.
Johnston, S. and Menguc, B. (2007) “Subsidiary size and the level of subsidiary autonomy in multinational corporations: a quadratic model investigation of Australian subsidiaries”, Journal of International Business Studies, Vol. 38, pp. 787-801.
Kostova, T. and Roth. K. (2003) “Social capital in multinational corporations and a micro-macro model of its formation”, Academy of Management Review, Vol. 28, No. 2, pp. 297-317.
Kramar, R., Bartram, T. De Cieri, H. (2011) Human resource management : Strategy, people and performance. (4th edn.) Mc-Graw-Hill: Sydney.
Lavelle, J., McDonnell, A. and Gunnigle, P. (2009) Human Resource Practices in Multinational Companies in Ireland. A Contemporary Analysis, Dublin: The Stationery Office.
Lepak, D. P., Liao, H., Chung, Y. and Harden, E. E. (2006) “A Conceptual Review of Human Resource Management Systems in Strategic Human Resource Management Research”, Research in Personnel and Human Resource Management, Vol. 25, pp. 217-271.
Levy, D. L. (2005) “Offshoring in the new global political economy”, Journal of Management Studies, Vol. 42, pp. 685-693.
Mabey, C. and Ramirez, M. (2004) Developing Managers: A European Perspective, London: Chartered Management Institute.
McDonnell, A. (2011) “Still Fighting the War for Talent? Bridging the Science versus Practice Gap”, Journal of Business and Psychology, Vol. 26, No. 2, pp. 169-173.
McDonnell, A., Lamare, R., Gunnigle, P. and Lavelle, J. (2010) “Developing Tomorrow’s Leaders – Evidence of Global Talent Management in Multinational Enterprises”, Journal of World Business, Vol. 45, No. 2, pp. 150-160.

96
McDonnell, A., Stanton, P. and Burgess, J. (2011) “Multinational Enterprises in Australia: Two Decades of International Human Resource Management Research Reviewed”, Asia Pacific Journal of Human Resources, Vol. 49, pp. 9-35.
McKnight, P. E., McKnight, K. M., Sidani, S. and Figueredo, A. J. (2007) Missing Data: A Gentle Introduction, New York, Guilford Press.
Milkovich, G. (1988) “A strategic perspective on compensation management”. In. K. Rowland and G. Ferris (Eds.), Research in personnel and human resource management, volume 6, Greenwich, CT: JAI Press.
OECD (2010) Identification of Foreign Investors: A Fact Finding Survey of Investment Review Procedures, OECD, Paris.
Oliver, N. and Wilkinson, B. (1988) The Japanization of British Industry, Basil Blackwell, Oxford.
O’Sullivan, M. (2000) Contests for Corporate Control: Corporate Governance and Economic Performance in the United States. Oxford: Oxford University Press.
Phelps, N. A. and Alden, J. (1999). Foreign Direct Investment and the Global Economy. London: The Stationery Office.
Purcell, J. (2004), “The HRM-Performance Link: Why, How and When does People Management Impact on Organisational Performance?” Paper presented at the 12th Annual John Lovett Memorial Lecture, University of Limerick, March.
Porter, M. E. (1985) Competitive Advantage. Free Press, New York.
Rodwell, J.J., Kienzle, R. and Shadur, M.A. (1998) “The Relationship Among Work Related Perceptions, Employee Attitudes and Employee Performance: the Integral Role of Communication”, Human Resource Management, Vol. 37, pp. 277-293.
Scullion, H. and Collings, D.G. (2006), Global staffing, Routledge, London.
Scullion, H. and Collings, D. G. (2011) Global Talent Management, Routledge: London and New York.
Scullion, H. and Starkey, K. (2000) “In search of the changing role of the corporate human resource function in the international firm”, International Journal of Human Resource Management, Vol. 11, No. 6, pp. 1061-1081.
Sheldon, P. and Thornthwaite, L. (2005) “Employability skills and vocational education and training policy in Australia: An analysis of employer association agendas”, Asia Pacific Journal of Human Resources, Vol. 43, No. 3, pp. 403-425.
Sparrow, P., Brewster, C. and Harris, H. (2004) Globalizing Human Resource Management, London: Routledge.
Thomas, G., Zolin, R. and Hartman, J. (2009) “The Central Role of Communications in Developing Trust and its Effect on Employee Involvement”, Journal of Business Communication, Vol. 46, pp. 287-310.
Tregaskis, O., Glover, L. and Ferner, A. (2005) International HR Networks in Multinational Companies. CIPD Research Report, London: CIPD.
Tung, R. L. (1984), “Strategic Management of human resources in the multinational enterprise”, Human Resource Management, Vol. 23, No. 2, pp.129-143.
UNCTAD (2008a). Development and Globalization: Facts and Figures. New York and Geneva: UNCTAD.
UNCTAD (2008b). World Investment Report 2008. Transnational Corporations and the Infrastructure Challenge. New York and Geneva: UNCTAD.

97
Welch, D. (1994) “Determinants of international human resource management approaches and activities: a suggested framework”, Journal of Management Studies, Vol. 31, pp. 139-164.
Wilkinson, A, Dundon, T, Marchington, M & Ackers, P 2004, “Changing Patterns of Employee Voice: Case Studies from the UK and Republic of Ireland”, Journal of Industrial Relations, Vol. 46, No. 3, pp. 298-322
Wright P.M, Dunford, B. and Snell, S. (2001). “Human resources and the resource based view of the firm”, Journal of Management, Vol. 27, No. 6, pp. 701-721.
Whitley, R. (2001) “How and Why are International Firms Different? The Consequences of Cross-border Managerial Coordination for Firm Characteristics and Behaviour”, in Morgan, G., Kristensen, P. H. and Whitley, R. (eds.) The Multinational Firm: Organizing Across Institutional and National Divides, Oxford University Press, Oxford.