a proteomic analysis of liver after ethanol binge in chronically ethanol treated rats
TRANSCRIPT

Aroor et al. Proteome Science 2012, 10:29http://www.proteomesci.com/content/10/1/29
RESEARCH Open Access
A proteomic analysis of liver after ethanol bingein chronically ethanol treated ratsAnnayya R Aroor1, Lowery J Roy2, Ricardo J Restrepo1, Brian P Mooney2,3 and Shivendra D Shukla1*
Abstract
Background: Binge ethanol in rats after chronic ethanol exposure augments necrosis and steatosis in the liver. Inthis study, two-dimensional gel electrophoresis proteomic profiles of liver of control, chronic ethanol, control-binge,and chronic ethanol- binge were compared.
Results: The proteomic analysis identified changes in protein abundance among the groups. The levels of carbonicanhydrase 3 (CA3) were decreased after chronic ethanol and decreased further after chronic ethanol-binge. Ethanolbinge alone in control rats had no effect on this protein suggesting its possible role in increased susceptibility toinjury by binge after chonic ethanol treatment. A protein spot, in which both cytosolic isocitrate dehydrogenase(IDH1) and glutamine synthetase (GS) were identified, showed a small decrease after chronic ethanol binge butwestern blot demonstrated significant decrease only for glutamine synthetase in chronic ethanol treated rats. Thelevel of gluathione S-transferase mu isoform (GSTM1) increased after chronic ethanol but was lower after chronicethanol-binge compared to chronic ethanol treatment. The protein levels of the basic form of protein disulfideisomerase associated protein 3 (PDIA3) were significantly decreased and the acidic forms were increased afterchronic ethanol- binge but not in chronic ethanol treated rats or ethanol binge in control rats. The significantchanges in proteome profile in chronic ethanol binge were accompanied by a marked increase in liver injury asevidenced by enhanced steatosis, necrosis, increased 4-hydroxynonenal labeled proteins, CYP2E1 expression, anddecreased histone H2AX phosphorylation.
Conclusions: Given the role of CA3, IDH1 and GST in oxidative stress; PDIA3 in protein quality control, apoptosisand DNA repair and decreased glutamine synthetase as a sensitive marker of pericentral liver injury this proteomestudy of chronic ethanol-binge rat model identifies these proteins for the first time as molecular targets withpotential role in progression of liver injury by binge ethanol drinking.
Keywords: Binge ethanol, Chronic ethanol, Liver proteomics
BackgroundAlcoholic liver disease is a worldwide health problem [1,2].The mechanisms that cause progression of liver injury arecomplex. Healthy liver is resistant to the action of ethanoland most individuals consuming alcohol have steatosis butnot steatohepatitis [3]. The progression of steatosis to stea-tohepatitis has been shown to be dependent on additionalfactors such as endotoxin, nutritional factors, and otherdisease states such as hepatitis C viral infection [4-7]. Inthis regard, binge drinking habit in chronic alcoholics isone of the most important factors contributing to the
* Correspondence: [email protected] of Medical Pharmacology & Physiology, University of Missouri,Columbia, MO 65212, USAFull list of author information is available at the end of the article
© 2012 Aroor et al.; licensee BioMed Central LCommons Attribution License (http://creativecreproduction in any medium, provided the or
progression of alcoholic liver injury [8-11]. We haverecently developed a chronic ethanol-binge rat model inwhich short term chronic ethanol treatment for 4 weeksdoes not result in significant liver injury. When these ratswere subjected to 3 episodes of repeat ethanol binge it dra-matically amplified liver injury. This rat model mimicsfindings similar to humans particularly during early alco-holic liver injury [12]. Therefore, it offers an opportunityto determine the effects of binge after chronic ethanol in-take and to explore the underlying mechanisms ofenhancement of liver injury by binge ethanol.Recent developments of systems biology approaches
including genomics, metabolomics and proteomics offera better insight into the mechanisms of cellular injuryand identification of protein targets without a prior
td. This is an Open Access article distributed under the terms of the Creativeommons.org/licenses/by/2.0), which permits unrestricted use, distribution, andiginal work is properly cited.
Aroor et al. Proteome Science 2012, 10:29 Page 2 of 12http://www.proteomesci.com/content/10/1/29
knowledge of the specific underlying molecular pathway[13]. Although gene expression has provided valuable in-formation on transcriptional regulation, significant dis-crepancy occurs between changes in RNA and proteinexpression since not all expressed genes are translatedinto protein products [14]. Two dimensional electro-phoresis in combination with mass spectrometry (2DE-MS), has been widely applied for the analyses of proteinexpression and their post translational modifications[15]. Proteome studies on liver have been useful in eluci-dating the biomarkers of liver damage and factors thatcontribute to susceptibility of liver tissue to drug ordisease induced liver injury [14-16]. Although, liverproteomic studies have been reported for chronic etha-nol treated rats [17-22], proteomics after ethanol bingedrinking has not been examined. We have thereforeundertaken a 2-dimensional (2D) gel-based proteomicsstudy of liver subjected to binge ethanol administrationin vivo.
Control
Control- binge
53
213
63 64
116 117120
123
53
213
63 64
116 117120
123
14.2kD
20kD
24kD29kD
36kD
45kD55kD
66kD
97kD116kD
200kD
14.2kD
20kD
24kD29kD
36kD
45kD55kD
66kD
97kD116kD
200kD
pH 3 pH 10
pH 3 pH 10
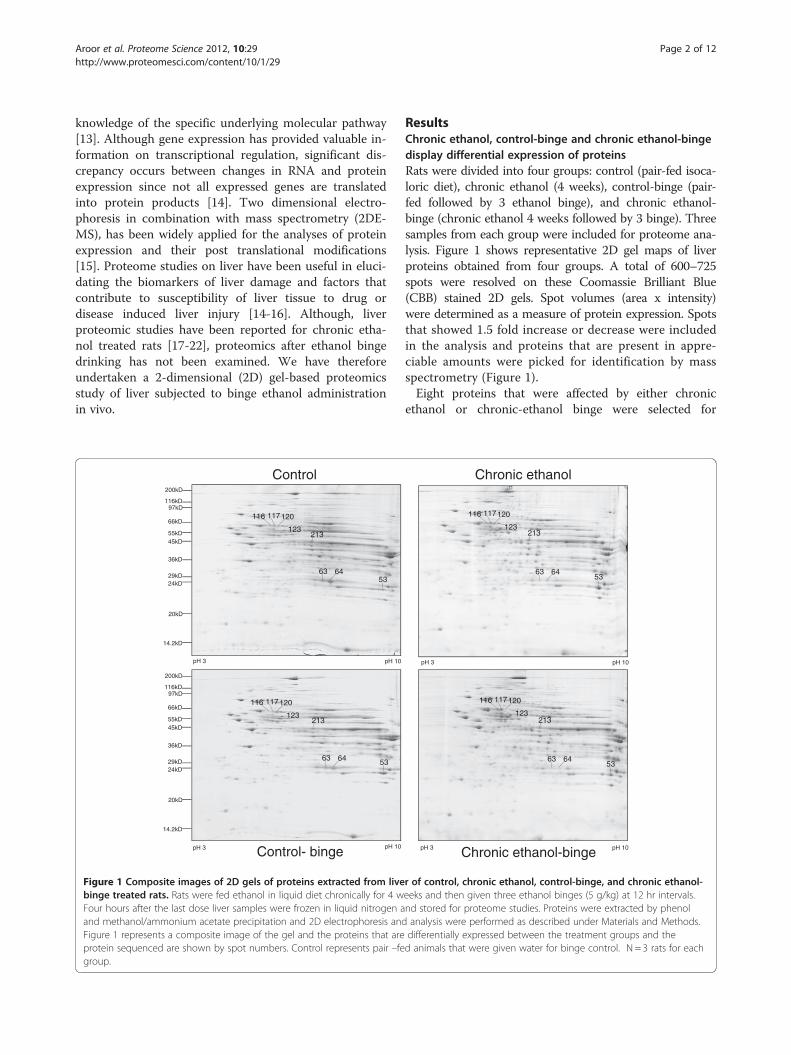
Figure 1 Composite images of 2D gels of proteins extracted from livebinge treated rats. Rats were fed ethanol in liquid diet chronically for 4 wFour hours after the last dose liver samples were frozen in liquid nitrogen aand methanol/ammonium acetate precipitation and 2D electrophoresis andFigure 1 represents a composite image of the gel and the proteins that areprotein sequenced are shown by spot numbers. Control represents pair –fegroup.
ResultsChronic ethanol, control-binge and chronic ethanol-bingedisplay differential expression of proteinsRats were divided into four groups: control (pair-fed isoca-loric diet), chronic ethanol (4 weeks), control-binge (pair-fed followed by 3 ethanol binge), and chronic ethanol-binge (chronic ethanol 4 weeks followed by 3 binge). Threesamples from each group were included for proteome ana-lysis. Figure 1 shows representative 2D gel maps of liverproteins obtained from four groups. A total of 600–725spots were resolved on these Coomassie Brilliant Blue(CBB) stained 2D gels. Spot volumes (area x intensity)were determined as a measure of protein expression. Spotsthat showed 1.5 fold increase or decrease were includedin the analysis and proteins that are present in appre-ciable amounts were picked for identification by massspectrometry (Figure 1).Eight proteins that were affected by either chronic
ethanol or chronic-ethanol binge were selected for
Chronic ethanol
Chronic ethanol-binge
53
213
63 64
116 117120
123
53
213
63 64
116 117120
123
pH 3 pH 10
pH 3 pH 10
r of control, chronic ethanol, control-binge, and chronic ethanol-eeks and then given three ethanol binges (5 g/kg) at 12 hr intervals.nd stored for proteome studies. Proteins were extracted by phenolanalysis were performed as described under Materials and Methods.differentially expressed between the treatment groups and thed animals that were given water for binge control. N = 3 rats for each

Aroor et al. Proteome Science 2012, 10:29 Page 3 of 12http://www.proteomesci.com/content/10/1/29
identification. These proteins were excised from the gel,digested with trypsin, and subjected initially to MALDI-TOF/TOF MS+MS/MS analysis. Protein identificationby MALDI-TOF/TOF was subsequently confirmed bypeptide sequences obtained by acquiring multiple LC/MS/MS spectra for each sample. The results are shownin Table 1. Spots 63 & 64 were identified as carbonicanhydrase 3 (CA3) and spots 116, 117, 120 & 123 wereidentified as isoforms of protein disulfide isomerase asso-ciated protein 3 (PDIA3). Spot 213 contained two pro-teins identified as cytosolic isocitrate dehydrogenase(IDH1) and glutamine synthetase (GS). Spot 53 wasidentified as glutathione S transferase, mu form(GSTM1).The levels of CA3 decreased after chronic ethanol
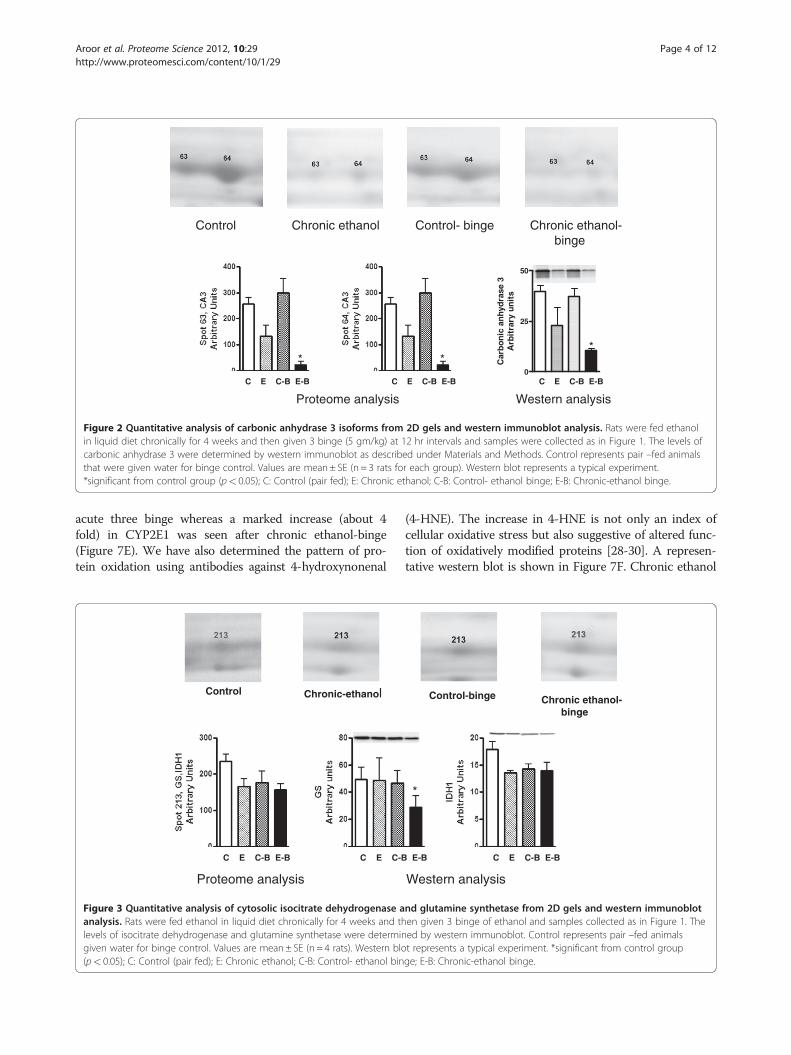
(Figure 2). Its levels decreased further after chronicethanol followed by binge . In the control-binge group,CA3 levels were not significantly changed suggesting itsrole in increased injury by binge ethanol in chronicethanol treated rats. We have also determined proteinlevels of CA3 by western immunoblot (Figure 2). Theresults were in agreement with the proteomic analysis.The spot volume representing combined protein levels ofcytosolic isocitrate dehydrogenase/glutamine synthetase in
Table 1 Identification of differentially expressed proteinspots by mass spectrometry
Spot No. Identificationa AccessionNo.
MW(Da)b
Total IonScorec
No.peptidesmatched
63 Carbonicanhydrase 3
3137484 29698 206 7
64 Carbonicanhydrase 3
3137484 29698 505 12
213 Cytosolic isocitratedehydrogenased
6647554 47030 202 10
213 Glutaminesynthetased
204349 43001 133 5
53 Glutathione Stransferase M1
204503 26127 674 17
116 Protein disulfideisomerase A3
1352384 57044 163 6
117 Protein disulfideisomerase A3
1352384 57044 797 22
120 Protein disulfideisomerase A3
1352384 57044 994 28
123 Protein disulfideisomerase A3
1352384 57044 1294 30
aData from LCMS runs were searched against NCBInr limited to mammalsusing MASCOT V2.2.bThis is the predicted molecular weight based on the translated genesequence.cThe total ion score from the MASCOT report. Individual peptide ion scores>36 have significant identify or homology (p< 0.05).dTwo proteins were confidently identified in spot number 213. Based onnumber of peptides matched, isocitrate dehydrogenase is likely the moreabundant of the two.
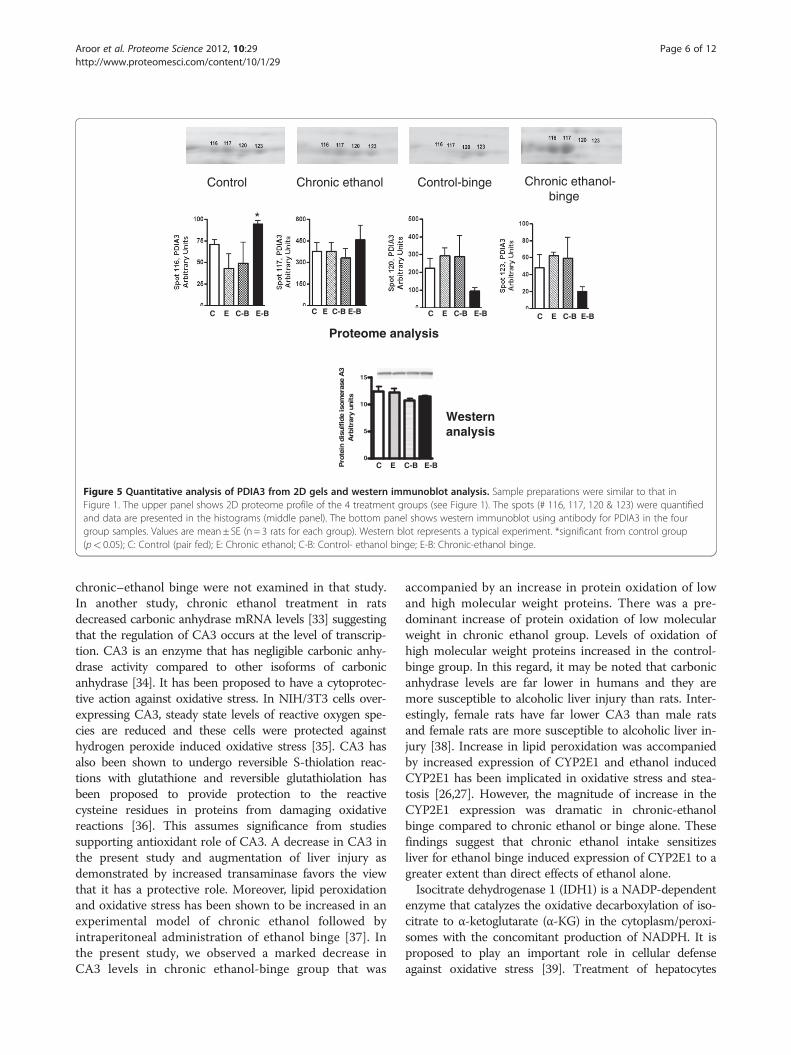
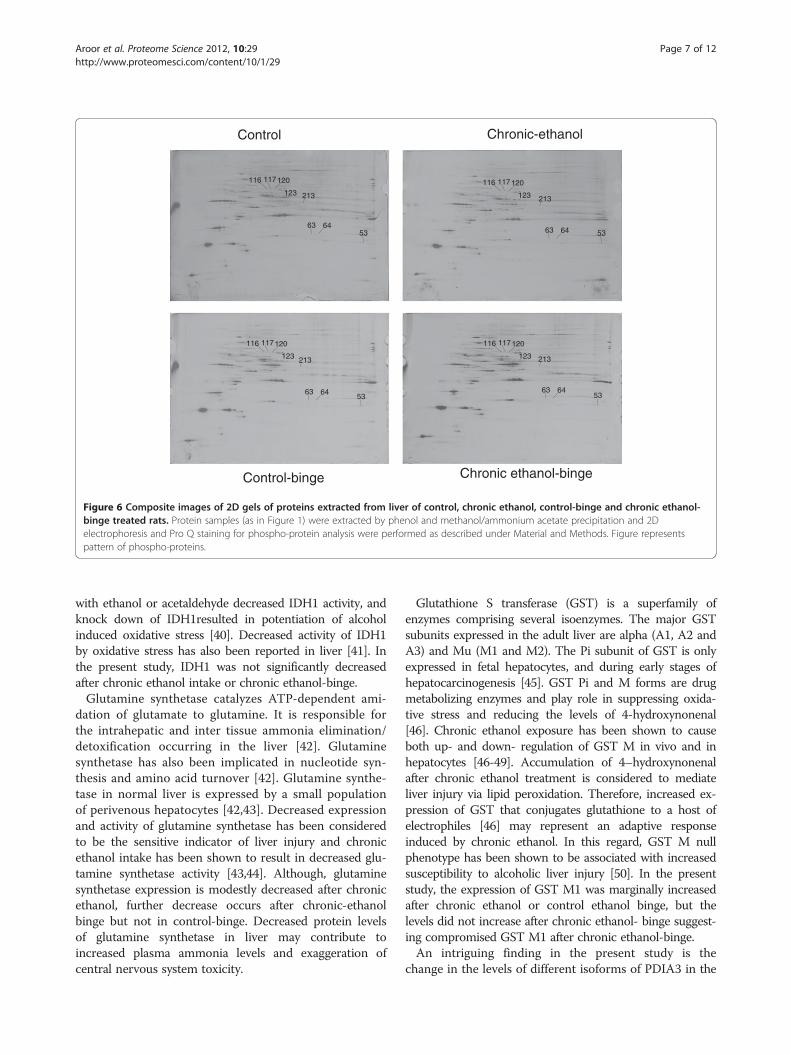
proteome analysis was decreased by about 40% afterchronic ethanol–binge (Figure 3). However, the westernblot results showed only a small decrease in the proteinlevels of cytosolic IDH1 in all the treated groups. Interest-ingly, protein levels of glutamine synthetase decreased inthe chronic ethanol-binge group (Figure 3). In theproteome analysis, GSTM1 levels were increased afterchronic ethanol and control binge but the levels arelower in chronic ethanol-binge compared to chronicethanol (Figure 4). However, western immunoblot didnot reveal significant increase after chronic ethanol(Figure 4). PDIA3 was identified in multiple forms withshifting of isoelectric point (pI). The protein levels ofthe more basic forms (spots 120 and 123) were lower inthe chronic ethanol binge group whereas the proteinlevels of the more acidic forms (spots 116 and 117)were higher in the chronic ethanol binge group(Figure 5). The western immunoblot did not reveal anysignificant change in the expression of PDIA3 in any ofthe groups (Figure 5). We therefore calculated the sumof the density of all the forms in proteome analysis andobserved that the changes in all the three treatedgroups were not different from the control group (datanot shown). These results suggest that, changes in thelevels of different isoforms seen after chronic-ethanolbinge may represent post translational modifications ofthe protein. The shift in charge may be due to phos-phorylation of PDIA3 forms since phosphorylation ofPDIA3 has been shown to occur in vivo and suchalterations are associated with a decrease in proteinfolding function of PDIA3 [23]. To examine this possi-bility, we performed pro-Q staining that detects phos-phorylated forms. Pro Q stain showed significantdecrease and increase in several phosphorylated pro-teins (Figure 6). However, the phosphorylation status ofthose proteins that showed differential changes in Coo-massie blue staining (Table 1) were not altered. It maybe mentioned that the quantitative analysis of thesephosphorylated spots showed a trend for lowered phos-phorylation for basic forms of PDIA3 and increasedphosphorylation for acidic form (data not shown).
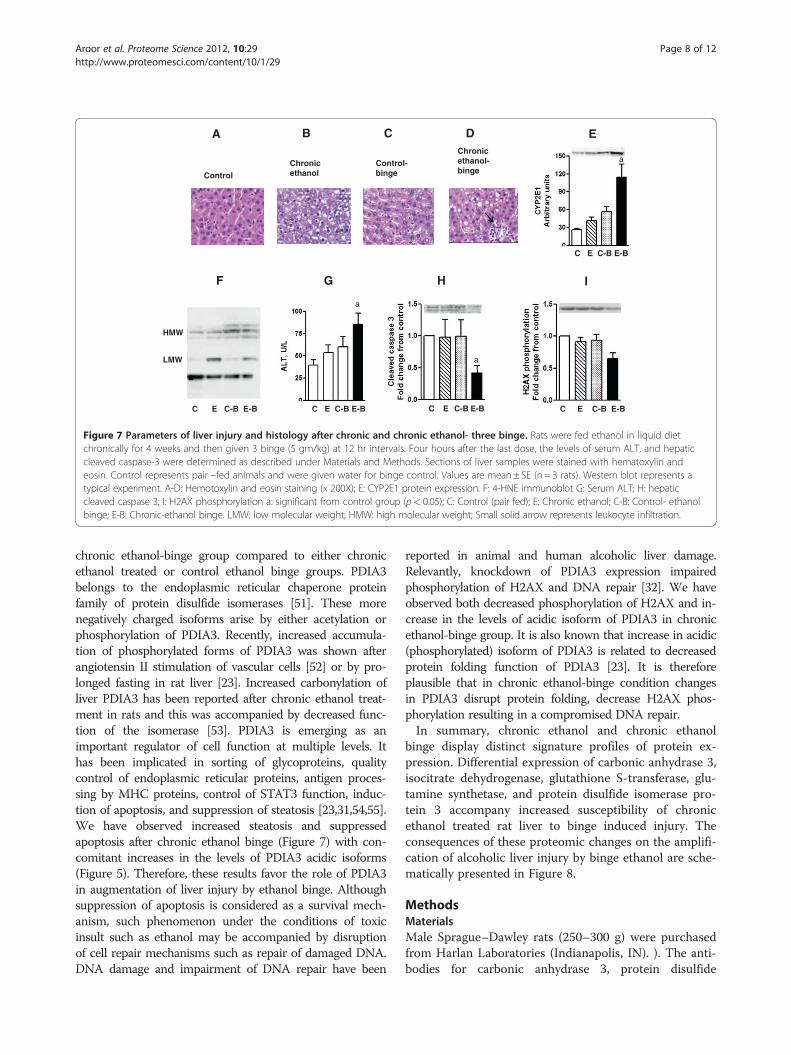
Relationship of proteome changes to liver injury duringchronic ethanol and chronic ethanol-bingeCA3 and IDH1 have been shown to exert protectionagainst oxidative stress and liver injury [24,25]. We exam-ined hepatic steatosis in different groups. The results areshown in Figure 7 A-D. Steatosis was moderate in thechronic ethanol group or control ethanol binge. In con-trast, stetaosis was more marked in chronic ethanol bingegroup. Another parameter of hepatotoxic effects of alcoholis increased expression of CYP2E1 [26,27]. Compared tocontrol, a moderate increase (1.5 to 2 fold) in CYP2E1protein expression was noted after chronic ethanol and
-lonahtecinorhClonahtecinorhCbinge
egnib-lortnoClortnoC
0
25
50
Car
bo
nic
an
hyd
rase
3A
rbit
rary
un
its
C E C-B E-B C E C-B E-B C E C-B E-B
Proteome analysis Western analysis
***
Figure 2 Quantitative analysis of carbonic anhydrase 3 isoforms from 2D gels and western immunoblot analysis. Rats were fed ethanolin liquid diet chronically for 4 weeks and then given 3 binge (5 gm/kg) at 12 hr intervals and samples were collected as in Figure 1. The levels ofcarbonic anhydrase 3 were determined by western immunoblot as described under Materials and Methods. Control represents pair –fed animalsthat were given water for binge control. Values are mean± SE (n = 3 rats for each group). Western blot represents a typical experiment.*significant from control group (p< 0.05); C: Control (pair fed); E: Chronic ethanol; C-B: Control- ethanol binge; E-B: Chronic-ethanol binge.
Aroor et al. Proteome Science 2012, 10:29 Page 4 of 12http://www.proteomesci.com/content/10/1/29
acute three binge whereas a marked increase (about 4fold) in CYP2E1 was seen after chronic ethanol-binge(Figure 7E). We have also determined the pattern of pro-tein oxidation using antibodies against 4-hydroxynonenal
Control Chronic-ethanol
Proteome analysis
C E C-B E-B C E C-B
Figure 3 Quantitative analysis of cytosolic isocitrate dehydrogenase aanalysis. Rats were fed ethanol in liquid diet chronically for 4 weeks and thlevels of isocitrate dehydrogenase and glutamine synthetase were determingiven water for binge control. Values are mean± SE (n = 4 rats). Western blo(p< 0.05); C: Control (pair fed); E: Chronic ethanol; C-B: Control- ethanol bin
(4-HNE). The increase in 4-HNE is not only an index ofcellular oxidative stress but also suggestive of altered func-tion of oxidatively modified proteins [28-30]. A represen-tative western blot is shown in Figure 7F. Chronic ethanol
Control-binge Chronic ethanol-binge
Western analysis
E-B C E C-B E-B
*
nd glutamine synthetase from 2D gels and western immunobloten given 3 binge of ethanol and samples collected as in Figure 1. Theed by western immunoblot. Control represents pair –fed animalst represents a typical experiment. *significant from control groupge; E-B: Chronic-ethanol binge.

Control Chronic-ethanol Control-binge Chronic ethanol-binge
Proteome analysis Western analysis
C E C-B E-B C E C-B E-B
*
Figure 4 Quantitative analysis of glutathione S-transferase M1 from 2D gels and western immunoblot analysis. Rats were fed ethanol inliquid diet chronically for 4 weeks and then given 3 binges before sample collection as detailed in Figure 1. The levels of glutathione transferasemu were determined by western immunoblot. Control represents pair –fed animals that were given water for binge control. Values are mean± SE(n = 3 rats for each group). Western blot represents a typical experiment. *significant from control group (p< 0.05); C: Control (pair fed); E: Chronicethanol; C-B: Control- ethanol binge; E-B: Chronic-ethanol binge.
Aroor et al. Proteome Science 2012, 10:29 Page 5 of 12http://www.proteomesci.com/content/10/1/29
treatment alone caused increases in 4-HNE staining oflow molecular weight whereas increases in 4-HNE stainingof high molecular weight proteins were seen in the controlbinge group. In chronic ethanol–binge group there was anincrease in 4-HNE staining of low molecular weight aswell as of high molecular weight bands demonstratingincreased oxidative stress in this group. Consistent withthis pattern is the observation that CA3 protein levelsdecreased in the chronic ethanol group and further de-crease in the chronic ethanol-binge (Figure 2). In thechronic ethanol, or control-binge groups a moderate in-crease in transaminase levels was noted. Its levelsincreased significantly in the ethanol- binge group suggest-ing augmentation of liver injury (Figure 7G). Recent studieshave shown proapototic role for PDIA3 . This was sup-ported by a decrease in PDIA3 expression and caspase 3levels [31]. To examine this in our model we determinedthe expression of cleaved caspase 3 in different groups ofethanol treatment (Figure 7H). Cleaved caspase 3 levelsdecreased in the chronic ethanol binge. We also examinedthe relevance of PDIA3. PDIA3 has been implicated in themodulation of histone H2AX phosphorylation. Decreasedexpression of PDIA3 by siRNA silencing resulted indecreased phosphorylation of H2AX [32]. Since H2AXphosphorylation has been implicated in DNA repair, wetherefore examined histone H2AX phosphorylation in thefour treatment groups. Histone H2AX phosphorylation
was significantly decreased in the chronic-ethanol bingegroup (Figure 7I).
DiscussionThis is the first proteomic study of global alterations ofproteins in liver from chronic ethanol-binge treated ani-mals. The chronic ethanol binge model developed in thislaboratory displays a number of features that are seenduring human alcoholic liver injury (12). Therefore thismodel is useful for the investigation of the mechanism ofbinge induced enhancement of alcoholic liver injury.Using a proteomics approach, we have demonstratedchanges in the levels of a number of liver proteinsaffected differentially by chronic ethanol, control-bingeand chronic ethanol-binge. A notable aspect of this studyis the identification of these protein targets in a singlemodel. Previously these protein targets have beenreported individually in separate studies. The fact thatnormal liver is resistant to acute ethanol binge [12] asseen in control-binge group in this study, we proposethat the increased vulnerability to binge after chronicethanol treatment and the accompanying alterations inproteins contribute to the amplification of injury.We find a marked decrease in CA3 in chronic ethanol
but not control-binge treated rats. Decrease in CA3 pro-tein level after chronic ethanol administration has beenreported [19], but the effects of acute ethanol binge or
Control Chronic ethanol Control-binge Chronic ethanol- binge
0
5
10
15
Pro
tein
dis
ulf
ide
isom
eras
e A
3A
rbit
rary
unit
s
Proteome analysis
Western analysis
C E C-B E-B C E C-B E-B C E C-B E-B C E C-B E-B
C E C-B E-B
*
Figure 5 Quantitative analysis of PDIA3 from 2D gels and western immunoblot analysis. Sample preparations were similar to that inFigure 1. The upper panel shows 2D proteome profile of the 4 treatment groups (see Figure 1). The spots (# 116, 117, 120 & 123) were quantifiedand data are presented in the histograms (middle panel). The bottom panel shows western immunoblot using antibody for PDIA3 in the fourgroup samples. Values are mean± SE (n = 3 rats for each group). Western blot represents a typical experiment. *significant from control group(p< 0.05); C: Control (pair fed); E: Chronic ethanol; C-B: Control- ethanol binge; E-B: Chronic-ethanol binge.
Aroor et al. Proteome Science 2012, 10:29 Page 6 of 12http://www.proteomesci.com/content/10/1/29
chronic–ethanol binge were not examined in that study.In another study, chronic ethanol treatment in ratsdecreased carbonic anhydrase mRNA levels [33] suggestingthat the regulation of CA3 occurs at the level of transcrip-tion. CA3 is an enzyme that has negligible carbonic anhy-drase activity compared to other isoforms of carbonicanhydrase [34]. It has been proposed to have a cytoprotec-tive action against oxidative stress. In NIH/3T3 cells over-expressing CA3, steady state levels of reactive oxygen spe-cies are reduced and these cells were protected againsthydrogen peroxide induced oxidative stress [35]. CA3 hasalso been shown to undergo reversible S-thiolation reac-tions with glutathione and reversible glutathiolation hasbeen proposed to provide protection to the reactivecysteine residues in proteins from damaging oxidativereactions [36]. This assumes significance from studiessupporting antioxidant role of CA3. A decrease in CA3 inthe present study and augmentation of liver injury asdemonstrated by increased transaminase favors the viewthat it has a protective role. Moreover, lipid peroxidationand oxidative stress has been shown to be increased in anexperimental model of chronic ethanol followed byintraperitoneal administration of ethanol binge [37]. Inthe present study, we observed a marked decrease inCA3 levels in chronic ethanol-binge group that was
accompanied by an increase in protein oxidation of lowand high molecular weight proteins. There was a pre-dominant increase of protein oxidation of low molecularweight in chronic ethanol group. Levels of oxidation ofhigh molecular weight proteins increased in the control-binge group. In this regard, it may be noted that carbonicanhydrase levels are far lower in humans and they aremore susceptible to alcoholic liver injury than rats. Inter-estingly, female rats have far lower CA3 than male ratsand female rats are more susceptible to alcoholic liver in-jury [38]. Increase in lipid peroxidation was accompaniedby increased expression of CYP2E1 and ethanol inducedCYP2E1 has been implicated in oxidative stress and stea-tosis [26,27]. However, the magnitude of increase in theCYP2E1 expression was dramatic in chronic-ethanolbinge compared to chronic ethanol or binge alone. Thesefindings suggest that chronic ethanol intake sensitizesliver for ethanol binge induced expression of CYP2E1 to agreater extent than direct effects of ethanol alone.Isocitrate dehydrogenase 1 (IDH1) is a NADP-dependent
enzyme that catalyzes the oxidative decarboxylation of iso-citrate to α-ketoglutarate (α-KG) in the cytoplasm/peroxi-somes with the concomitant production of NADPH. It isproposed to play an important role in cellular defenseagainst oxidative stress [39]. Treatment of hepatocytes
Control Chronic-ethanol
Control-binge Chronic ethanol-binge
116 117120
123 213
5363 64
116 117120
123 213
5363 64
116 117120
123 213
5363 64
116 117120
123 213
5363 64
Figure 6 Composite images of 2D gels of proteins extracted from liver of control, chronic ethanol, control-binge and chronic ethanol-binge treated rats. Protein samples (as in Figure 1) were extracted by phenol and methanol/ammonium acetate precipitation and 2Delectrophoresis and Pro Q staining for phospho-protein analysis were performed as described under Material and Methods. Figure representspattern of phospho-proteins.
Aroor et al. Proteome Science 2012, 10:29 Page 7 of 12http://www.proteomesci.com/content/10/1/29
with ethanol or acetaldehyde decreased IDH1 activity, andknock down of IDH1resulted in potentiation of alcoholinduced oxidative stress [40]. Decreased activity of IDH1by oxidative stress has also been reported in liver [41]. Inthe present study, IDH1 was not significantly decreasedafter chronic ethanol intake or chronic ethanol-binge.Glutamine synthetase catalyzes ATP-dependent ami-
dation of glutamate to glutamine. It is responsible forthe intrahepatic and inter tissue ammonia elimination/detoxification occurring in the liver [42]. Glutaminesynthetase has also been implicated in nucleotide syn-thesis and amino acid turnover [42]. Glutamine synthe-tase in normal liver is expressed by a small populationof perivenous hepatocytes [42,43]. Decreased expressionand activity of glutamine synthetase has been consideredto be the sensitive indicator of liver injury and chronicethanol intake has been shown to result in decreased glu-tamine synthetase activity [43,44]. Although, glutaminesynthetase expression is modestly decreased after chronicethanol, further decrease occurs after chronic-ethanolbinge but not in control-binge. Decreased protein levelsof glutamine synthetase in liver may contribute toincreased plasma ammonia levels and exaggeration ofcentral nervous system toxicity.
Glutathione S transferase (GST) is a superfamily ofenzymes comprising several isoenzymes. The major GSTsubunits expressed in the adult liver are alpha (A1, A2 andA3) and Mu (M1 and M2). The Pi subunit of GST is onlyexpressed in fetal hepatocytes, and during early stages ofhepatocarcinogenesis [45]. GST Pi and M forms are drugmetabolizing enzymes and play role in suppressing oxida-tive stress and reducing the levels of 4-hydroxynonenal[46]. Chronic ethanol exposure has been shown to causeboth up- and down- regulation of GST M in vivo and inhepatocytes [46-49]. Accumulation of 4–hydroxynonenalafter chronic ethanol treatment is considered to mediateliver injury via lipid peroxidation. Therefore, increased ex-pression of GST that conjugates glutathione to a host ofelectrophiles [46] may represent an adaptive responseinduced by chronic ethanol. In this regard, GST M nullphenotype has been shown to be associated with increasedsusceptibility to alcoholic liver injury [50]. In the presentstudy, the expression of GST M1 was marginally increasedafter chronic ethanol or control ethanol binge, but thelevels did not increase after chronic ethanol- binge suggest-ing compromised GST M1 after chronic ethanol-binge.An intriguing finding in the present study is the
change in the levels of different isoforms of PDIA3 in the
C E C-B E-B
B
I
D
Control
Chronicethanol
Control-binge
Chronicethanol-binge
a
C E C-B E-B
C
C E C-B E-B
A
F G H
C E C-B E-B
a
HMW
LMW
C E C-B E-B
E
a
Figure 7 Parameters of liver injury and histology after chronic and chronic ethanol- three binge. Rats were fed ethanol in liquid dietchronically for 4 weeks and then given 3 binge (5 gm/kg) at 12 hr intervals. Four hours after the last dose, the levels of serum ALT, and hepaticcleaved caspase-3 were determined as described under Materials and Methods. Sections of liver samples were stained with hematoxylin andeosin. Control represents pair –fed animals and were given water for binge control. Values are mean± SE (n = 3 rats). Western blot represents atypical experiment. A-D: Hemotoxylin and eosin staining (x 200X); E: CYP2E1 protein expression. F: 4-HNE immunoblot G: Serum ALT; H: hepaticcleaved caspase 3; I: H2AX phosphorylation a: significant from control group (p< 0.05); C: Control (pair fed); E: Chronic ethanol; C-B: Control- ethanolbinge; E-B: Chronic-ethanol binge. LMW: low molecular weight; HMW: high molecular weight; Small solid arrow represents leukocyte infiltration.
Aroor et al. Proteome Science 2012, 10:29 Page 8 of 12http://www.proteomesci.com/content/10/1/29
chronic ethanol-binge group compared to either chronicethanol treated or control ethanol binge groups. PDIA3belongs to the endoplasmic reticular chaperone proteinfamily of protein disulfide isomerases [51]. These morenegatively charged isoforms arise by either acetylation orphosphorylation of PDIA3. Recently, increased accumula-tion of phosphorylated forms of PDIA3 was shown afterangiotensin II stimulation of vascular cells [52] or by pro-longed fasting in rat liver [23]. Increased carbonylation ofliver PDIA3 has been reported after chronic ethanol treat-ment in rats and this was accompanied by decreased func-tion of the isomerase [53]. PDIA3 is emerging as animportant regulator of cell function at multiple levels. Ithas been implicated in sorting of glycoproteins, qualitycontrol of endoplasmic reticular proteins, antigen proces-sing by MHC proteins, control of STAT3 function, induc-tion of apoptosis, and suppression of steatosis [23,31,54,55].We have observed increased steatosis and suppressedapoptosis after chronic ethanol binge (Figure 7) with con-comitant increases in the levels of PDIA3 acidic isoforms(Figure 5). Therefore, these results favor the role of PDIA3in augmentation of liver injury by ethanol binge. Althoughsuppression of apoptosis is considered as a survival mech-anism, such phenomenon under the conditions of toxicinsult such as ethanol may be accompanied by disruptionof cell repair mechanisms such as repair of damaged DNA.DNA damage and impairment of DNA repair have been
reported in animal and human alcoholic liver damage.Relevantly, knockdown of PDIA3 expression impairedphosphorylation of H2AX and DNA repair [32]. We haveobserved both decreased phosphorylation of H2AX and in-crease in the levels of acidic isoform of PDIA3 in chronicethanol-binge group. It is also known that increase in acidic(phosphorylated) isoform of PDIA3 is related to decreasedprotein folding function of PDIA3 [23]. It is thereforeplausible that in chronic ethanol-binge condition changesin PDIA3 disrupt protein folding, decrease H2AX phos-phorylation resulting in a compromised DNA repair.In summary, chronic ethanol and chronic ethanol
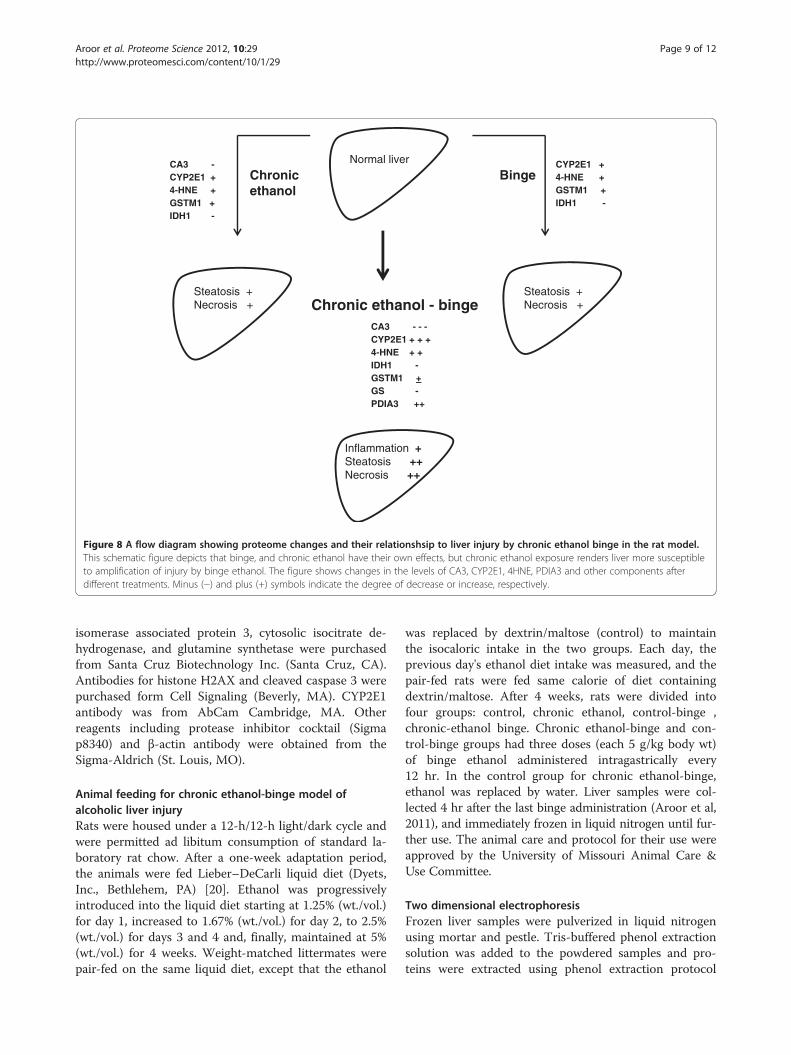
binge display distinct signature profiles of protein ex-pression. Differential expression of carbonic anhydrase 3,isocitrate dehydrogenase, glutathione S-transferase, glu-tamine synthetase, and protein disulfide isomerase pro-tein 3 accompany increased susceptibility of chronicethanol treated rat liver to binge induced injury. Theconsequences of these proteomic changes on the amplifi-cation of alcoholic liver injury by binge ethanol are sche-matically presented in Figure 8.
MethodsMaterialsMale Sprague–Dawley rats (250–300 g) were purchasedfrom Harlan Laboratories (Indianapolis, IN). ). The anti-bodies for carbonic anhydrase 3, protein disulfide
BingeChronicethanol
Chronic ethanol - binge CA3 - - -CYP2E1 + + +4-HNE + +IDH1 -GSTM1 + GS -PDIA3 ++
CYP2E1 +4-HNE +GSTM1 +IDH1 -
CA3 -CYP2E1 +4-HNE +GSTM1 +IDH1 -
Steatosis +Necrosis +
Steatosis +Necrosis +
Inflammation +Steatosis ++Necrosis ++
Normal liver
Figure 8 A flow diagram showing proteome changes and their relationshsip to liver injury by chronic ethanol binge in the rat model.This schematic figure depicts that binge, and chronic ethanol have their own effects, but chronic ethanol exposure renders liver more susceptibleto amplification of injury by binge ethanol. The figure shows changes in the levels of CA3, CYP2E1, 4HNE, PDIA3 and other components afterdifferent treatments. Minus (−) and plus (+) symbols indicate the degree of decrease or increase, respectively.
Aroor et al. Proteome Science 2012, 10:29 Page 9 of 12http://www.proteomesci.com/content/10/1/29
isomerase associated protein 3, cytosolic isocitrate de-hydrogenase, and glutamine synthetase were purchasedfrom Santa Cruz Biotechnology Inc. (Santa Cruz, CA).Antibodies for histone H2AX and cleaved caspase 3 werepurchased form Cell Signaling (Beverly, MA). CYP2E1antibody was from AbCam Cambridge, MA. Otherreagents including protease inhibitor cocktail (Sigmap8340) and β-actin antibody were obtained from theSigma-Aldrich (St. Louis, MO).
Animal feeding for chronic ethanol-binge model ofalcoholic liver injuryRats were housed under a 12-h/12-h light/dark cycle andwere permitted ad libitum consumption of standard la-boratory rat chow. After a one-week adaptation period,the animals were fed Lieber–DeCarli liquid diet (Dyets,Inc., Bethlehem, PA) [20]. Ethanol was progressivelyintroduced into the liquid diet starting at 1.25% (wt./vol.)for day 1, increased to 1.67% (wt./vol.) for day 2, to 2.5%(wt./vol.) for days 3 and 4 and, finally, maintained at 5%(wt./vol.) for 4 weeks. Weight-matched littermates werepair-fed on the same liquid diet, except that the ethanol
was replaced by dextrin/maltose (control) to maintainthe isocaloric intake in the two groups. Each day, theprevious day's ethanol diet intake was measured, and thepair-fed rats were fed same calorie of diet containingdextrin/maltose. After 4 weeks, rats were divided intofour groups: control, chronic ethanol, control-binge ,chronic-ethanol binge. Chronic ethanol-binge and con-trol-binge groups had three doses (each 5 g/kg body wt)of binge ethanol administered intragastrically every12 hr. In the control group for chronic ethanol-binge,ethanol was replaced by water. Liver samples were col-lected 4 hr after the last binge administration (Aroor et al,2011), and immediately frozen in liquid nitrogen until fur-ther use. The animal care and protocol for their use wereapproved by the University of Missouri Animal Care &Use Committee.
Two dimensional electrophoresisFrozen liver samples were pulverized in liquid nitrogenusing mortar and pestle. Tris-buffered phenol extractionsolution was added to the powdered samples and pro-teins were extracted using phenol extraction protocol
Aroor et al. Proteome Science 2012, 10:29 Page 10 of 12http://www.proteomesci.com/content/10/1/29
[56]. Protein pellets were resuspended in IEF buffer (8 MUrea, 2 M thiourea, 4% CHAPS, 2% C7BzO, 100 mMDTT, 2.2% 2-HED). Solubilized samples were quantifiedusing the EZQ protocol from Life Technologies (GrandIsland, NY). One mg of protein sample was then appliedto 24 cm pH 3–10 IPG strips for passive rehydrationovernight. The IPG strips were isoelectrically focused onthe Protean IEF from Bio-Rad using the following para-meters: 250 V for 250Vhr (rapid ramp), 1000 V for500Vhr (rapid ramp), 8000 V for 2 hours (gradient),8000 V for 80,000Vhr (rapid ramp), and then hold at500 V. The IPG strips were then placed on 12% SDS-PAGE gels for the second dimension and ran using theEttan Dalt 12 at 1 W/gel overnight. After the run, gelswere stained with Pro-Q diamond stain and imagedusing the Ettan DIGE imager. Gels were then poststained with Coomassie Brilliant Blue (G250) for thetotal protein and scanned using the UMAX powerlookflatbed scanner. Data were analyzed using Delta 2D sys-tem from Decodon after normalization. The identifica-tion of spots that showed distinct differences was basedon aligning and matching of spots in gels and quantifica-tion of matched spots. The spots were also manuallyinspected to verify the accuracy of matching. Weselected a protein spot that showed the least variationbetween the samples and this spot was used fornormalization. All the protein spots chosen were presentin all the gels. The results were also analyzed based onnormalization to total spot volume and the pattern wassimilar to data analysis based on normalization to theprotein spot with the least variation among the gels. Forphosphoprotein analysis, the values were normalized fortotal protein.
Analysis of proteins by mass spectrometrySpots were excised from the gel and subjected to trypsindigest using a standard in-gel digestion protocol [57].The extracted peptides were lyophilized and resuspendedin 3 μl of 1% formic acid. A 0.5 μl aliquot of the resultingpeptides was mixed 1:1 with CHCA matrix (5 mg/mL in60% ACN, 0.3% TFA, 10 mM ammonium phosphate)and spotted onto the MALDI target. The instrument(Applied Biosystems 470 Proteomics Analyzer) was oper-ated in positive ion mode and spectra were acquired overa mass range of 700 to 4000 Da. Peptide calibration stan-dards (4700 calibration mix, Applied Biosystems) wereused to calibrate the instrument in MS mode using sixpeptides of known mass. Calibration was achieved by the“plate model and default” mode for MS of six externalcalibrant spots. Additionally, internal (i.e. within thesample spot) calibration was achieved using trypsin au-tolysis peptides (where present). Note: although trypsinautolysis ions are useful for obtaining the best mass
accuracy, these ions are automatically excluded from thedatabase search conducted using the GPS Explorer.Following an MS scan of each sample the 8 most abun-
dant peptides were picked automatically for tandem MS(MSMS – peptide fragmentation) acquisition. Followingthis a database search was performed using V3.6 of GPSExplorer. Ions with s/n ratios >20 (excluding trypsin au-tolysis) up to a max of 125 per spectrum were submittedfor searches against mammal entries in the NCBInr data-base (last updated September 9th 2010) using the “com-bined MS+MSMS” function of the GPS Explorersoftware. The GPS Explorer software is integrated withthe MASCOT V2.2 (www.matrixscience.com). Searchparameters allowed: 1 trypsin miss-cleavage and the fol-lowing modifications to peptides: carbamidomethylcysteines, and methionine oxidation. MS mass tolerancewas 100 ppm, MSMS mass tolerance was 0.2 Da.Liquid Chromatography Tandem Mass Spectrometry
analysis: Digests were diluted to 5 μl with 1% formic acidand transferred to an autosampler vial and placed in theautosampler which was maintained at 4°C. A portion ofthe sample (3 μL) was loaded onto a 150 mm C18 CHIP(Agilent Technologies cat# G4240-62002). Peptides wereseparated and eluted from the analytical column with acontinuous gradient of acetonitrile from 3 to 45% (in0.1% formic acid) over 8 minutes. Following an MS scanof the eluting peptides, each cycle, the five most abun-dant peptides were subjected to peptide fragmentation(MSMS). Data across 17 minutes were collected. MSMSdata were extracted and a peak list file (mgf – mascotgeneric format file) was generated using the qualitativeanalysis software. A search of NCBInr-limited to mam-mals was conducted using a local copy of MASCOTserver V2.2. We selected only eight proteins by proteomeanalysis. The use of Coomassie blue staining and use ofbroader pH range might have resulted in the detectionof lower number of spots. Our objective was to coverwide range of proteins and obtain adequate amount ofprotein for mass spectrometry analysis. Therefore, wehave adopted this protocol. The limited number spot dif-ference has also been reported for other proteome studiesin chronic ethanol administration and endotoxin inducedliver injury [19,58].
Statistical analysisData are expressed as means±S.E.M. Statistical significanceof the differences between means was assessed by Student'st test. A probability of less than 5% was considered signifi-cant (P< 0.05).
AbbreviationsALT: Alanine transaminase; CA3: Carbonic anhydrase 3; CBB: Coomassiebrilliant blue; CYP2E1: Cytochrome P 450 2E1; GS: Glutamine synthetase;H2AX: Histone H2A X; HNE: 4-hydroxynonenal; GSTM1: Glutathione S-
Aroor et al. Proteome Science 2012, 10:29 Page 11 of 12http://www.proteomesci.com/content/10/1/29
transferase, mu isoform; MS: Mass spectrometry; IDH1: Cytosolic isocitaratedehydrogenase; PDIA3: Protein disulfide isomerase associated protein 3.
Competing interestsThe authors declare that they have no competing interests.
AcknowledgementsThis work was supported in part by NIH grant AA11962 and AA16347.
Author details1Department of Medical Pharmacology & Physiology, University of Missouri,Columbia, MO 65212, USA. 2Proteomics Center, University of Missouri,Columbia, MO 65212, USA. 3Division of Biochemistry, University of Missouri,Columbia, MO 65212, USA.
Authors’ contributionsARA developed chronic ethanol binge animal model, conductedexperiments, performed western immuno blots, did analysis of the results,and wrote the manuscript. LJR performed protein extraction, twodimensional electrophoresis and proteomic data handling. RJR conductedwestern blots, analysed the data and helped in manuscript writing. MBP didthe MALDI-TOF-MS/MS analysis, contributed to the technical part onproteome experiments and supervised proteome experiments. SDSsupervised the planning & design of experiments, analysis & interpretation ofthe results, and preparation of the manuscript. All authors read and approvedthe final manuscript.
Received: 2 December 2011 Accepted: 30 April 2012Published: 30 April 2012
References1. Adachi A, Brenner DA: Clinical syndromes of alcoholic liver disease. Dig
Dis 2005, 23:255–263.2. dela Hall MP, Lieber CS, DeCarli LM, French SW, Lindros KO, Jarvelainen H,
Bode C, Parlesak A, Bode JC: Models of alcoholic liver disease in rodents.A critical evaluation. Alcoholism Clin Exp Res 2001, 25:254S–261S.
3. Kotesh A, Yang S, Lin H, Huang X, Diehl AM: Chronic ethanol exposurepotentiates lipopolysaccharide liver injury despite inhibiting jun N-terminalkinase and caspase 3 activation. J Biol Chem 2002, 44:13037–13044.
4. Schafer C, Parlesak A, Schutt C, Bode C, Bode JC: Concentrations oflipopolysaccharide binding protein, bactericidal/ permeability-increasingprotein, soluble CD-14 and plasma lipids in relation to endotoxemia inpatients with alcoholic liver disease. Alcohol Alcohol 2002, 37:81–86.
5. Fukui H: Relation of endotoxin, endotoxin binding proteins andmacrophages to severe alcoholic injury and multiple organ failure.Alcoholism Clin Exp Res 2005, 29:172–179S.
6. Rivara PF, Jurkovich GJ, Gurney GJ, Seguin D, Fligner CL, Ries R, Raisvs VA,Copass M: The magnitude of acute and chronic alcohol abuse in traumapatients. Arch Surg 1993, 128:907–913.
7. Crosse KI, Anania FK: Alcoholic hepatitis. Curr Treat Options in Gastroenterol2002, 5:417–423.
8. Ceccanti M, Attili A, Balducci B, Attilia F, Giacomelli S, Rotondo C, Sasso GF,Xerouchakis E, Attilia ML: Acute alcoholic hepatitis. J Clin Gastroenterol2006, 40:833–841.
9. Zakhari S, Li TK: Determinants of alcohol use and abuse: impact ofquantity and frequency patterns on liver disease. Hepatology 2007,46:2032–2039.
10. Mathurin P, Deltenre P: Effect of binge drinking on the liver: an alarmingpublic health issue? Gut 2009, 58:613–617.
11. Mathurin P, Beuzin PF, Louvet A, Carrie-Ganne N, Balian NA, Dalsoglio D,Trinchetet TC, Prevot S, Naveav S: Fibrosis progression occurs in asubgroup of heavy drinkers with typical histological features. AlimentPharmacol Ther 2007, 25:1047–1054.
12. Aroor AR, Jackson DE, Shukla SD: Elevated activation of erk1 and erk2accompany enhanced liver injury following alcohol binge in chronicallyethanol-fed rats. Alcoholism Clin Exp Res 2011, 35:2128–2138.
13. Gstaiger M, Aebersold R: Applying mass spectrometry-based proteomics togenetics, genomics and network biology. Nat Rev Genet 2009, 10:617–627.
14. Mas RV, Fisher RA, Archer KJ, Maluf DG: Proteomics and liver fibrosis:identifying markers of fibrogenesis. Exper Trev Proteomics 2009, 6:421–431.
15. Uto H, Kanumra S, Takami Y, Tsubouchi H: Clinical proteomics for liverdisease: a promising approach for discovery of novel biomarkers.Proteome Science. 2010, 8:70.
16. Beretta L: Liver proteomics applied to translational research in liverdisease and cancer. Proteomics Clin Appl 2010, 4:359–361.
17. Bailey SM, Andringa KK, Landar A, Darley-Usmar VM: Proteomic approachesto identify and characterize alterations to the mitochondrial proteome inalcoholic liver disease. Methods Mol Biol 2008, 447:369–380.
18. Banerjee A, Russell WK, Jayaraman A, Ramaiah SK: Identification of proteinsto predict the molecular basis for the observed gender susceptibility in arat model of alcoholic steatohepatitis by 2-D gel proteomics. Proteomics2008, 8:4327–4337.
19. Kharbanda KK, Vigneswara V, McVicker BL, Newlaczyl AU, Bailey K, Tuma D,Ray DE, Carter WG: Proteomics reveal a concerted upregulation ofmethionine metabolic pathway enzymes, and downregulation ofcarbonic anhydrase-III, in betaine supplemented ethanol-fed rats.Biochem Biophys Res Commun 2009, 381:523–527.
20. Shepard BD, Tuma DJ, Tuma PL: Chronic ethanol consumption induces globalhepatic protein hyperacetylation. Alcohol Clin Exp Res 2010, 34:280–291.
21. Andringa KK, King AL, Eccleston HB, Mantena SK, Landar A, Jhala NC,Dickinson DA, Squadrito GL, Bailey SM: Analysis of the liver mitochondrialproteome in response to ethanol and S-adenosylmethionine treatments:novel molecular targets of disease and hepatoprotection. Am J PhysiolGastrointest Liver Physiol 2010, 298:G732–G745.
22. Newton BW, Russel WK, Russel DH, Ramaiah S, Jayaraman: A liver proteomeanalysis in a rodent model of alcoholic steatosis. J Proteome Res 2009,8:1663–1671.
23. Kita K, Okumura N, Takao T, Watanabe M, Matsubara T, Nishimura O, NagaiK: Evidence for phosphorylation of rat liver glucose-regulated protein 58,GRP58/ERp57/ER-60, induced by fasting and leptin. FEBS Lett 2005,580:199–205.
24. Räisänen SR, Lehenkari P, Tasanen M, Rahkila P, Härkönen PL, Väänänen HK:Carbonic anhydrase III protects cells from hydrogen peroxide inducedapoptosis. FASEB J 1999, 13:513–522.
25. Lee SM, Koh HJ, Park DC, Song BJ, Huh TL, Park JW: Cytosolic NADP(+)-dependent isocitrate dehydrogenase status modulates oxidativedamage to cells. Free Radic Biol Med 2002, 32:1185–1196.
26. Cederbaum AI: Role of CYP2E1 in ethanol-induced oxidant stress, fattyliver and hepatotoxicity. Dig Dis 2010, 28:802–811.
27. Lu Y, Cederbaum AI: CYP2E1 and oxidative liver injury by alcohol. FreeRadic Biol Med 2008, 44:723–738.
28. Smathers RL, Galligan JJ, Stewart BJ, Petersen DR: Overview of lipidperoxidation products and hepatic protein modification in alcoholic liverdisease. Chem Biol Interact 2011, 192:107–112.
29. Sampey BP, Korourian S, Ronis MJ, Badger TM, Petersen DR:Immunohistochemical characterization of hepatic malondialdehyde and4-hydroxynonenal modified proteins during early stages ofethanol-induced liver injury. Alcohol Clin Exp Res 2003, 27:1015–1122.
30. Poli G, Biasi F, Leonarduzzi G: 4-Hydroxynonenal-protein adducts: areliable biomarker of lipid oxidation in liver diseases. Mol Aspects Med2008, 29:67–71.
31. Xu D, Perez RE, Rezaiekhaligh MH, Bourdi M, Truog WE: Knockdown ofERp57 increases BiP/GRP 78 induction and protects against hyperoxiaand tunicamycin-induced apoptosis. Am Physiol Lung Cell Mol Physiol 2009,297:L44–L51.
32. Krynetskaia NF, Phadke MS, Jadhav SH, Krynetskiy EY: Chromatin-associatedproteins HMG1/2 and PDIA3 trigger cellular response to chemotherapy-induced DNA damage. Mol Cancer Ther 2009, 8:864–872.
33. Tadic SD, ELM MS, Li H, Van London GJ, Subbotin VM, Whitcomb DC, EagonPK: Sex differences in hepatic gene expression in a rat model of ethanol-induced liver injury. J Appl Physiol 2002, 93:1057–1068.
34. Mallis RJ, Hamann MJ, Zhao W, Zhang T, Hendrich S, Thomas JA: Irreversiblethiol oxidation in carbonic anhydrase III: protection by S-glutathiolationand detection in aging rats. Biol Chem 2002, 383:649–662.
35. Zimmerman UJ, Wang P, Zhang X, Bogdanovich S, Forster R: Anti-oxidativeresponse of carbonic anhydrase III in skeletal muscle. IUBMB Life 2004,56:343–347.
36. Lii CK, Chai YC, Zhao W, Thomas JA, Hendrich S: S-Thiolation andirreversible oxidation of sulfhydryls on carbonic anhydrase III duringoxidative stress: a method for studying protein modification in intactcells and tissues. Arch Biochem Biophys 1994, 308:231–239.
Aroor et al. Proteome Science 2012, 10:29 Page 12 of 12http://www.proteomesci.com/content/10/1/29
37. Kanbagli O, Balkan J, Aykac-Toker G, Uysal M: Hepatic MitochondrialProoxidant and Antioxidant Status in Ethanol-Induced Liver Injury inRats. Biol Pharm Bull 2002, 25:1482–1484.
38. Parkkila S, Halsted CH, Villanueva JA, Vaananen HK, Niemela O: Expression oftesterone dependent enzyme carbonic anhydrase III and oxidative stress inexperimental alcoholic liver disease. Dig Dis Sci 1999, 44:2205–2213.
39. Brown SM, Upadhya R, Shoemaker JD, Lodge JK: Isocitrate dehydrogenaseis important for nitrosative stress resistance in Cryptococcus neoformans,but oxidative stress resistance is not dependent on glucose-6-phosphatedehydrogenase. Eukaryot Cell 2010, 9:971–980.
40. Yang SE, Lee SM, Park WJ: Silencing of NADP-dependent isocitratedehydrogenase gene enhances ethanol-induced cytotoxicty in Hep G2cells. Arch Pharm Res 2010, 33:1065–1071.
41. Lee JH, Yang ES, Park JW: Inactivation of NADP+dependent isocitratedehydrogenase by peorxynitrite. Implications for cytotoxicity andalcohol-induced liver injury. J Biol Chem 2003, 278:51360–51371.
42. Desjardins P, Rama Rao KV, Michalak A, Butterworth RF Rose C: Effect ofportacaval anastomosis on glutamine synthetase protein and geneexpression in Brain, liver and skeletal muscle. Metabol Brain Dis 1999,14:273–280.
43. Rouach H, Fataccioli V, Gentil M, French SW, Morimoto M, Nordmann R:Effect of chronic ethanol feeding on lipid peroxidation and proteinoxidation in relation to liver pathology. Hepatology 1997, 25:351–355.
44. Abraham P, Wilfred G, Ramakrishna B: Oxidative damage to thehepatocellular proteins after chronic ethanol intake in the rat. Clin ChimActa 2002, 325:117–125.
45. Khan AJ, Choudhuri G, Husain Q, Parmar D: Polymorphisim glutathione –S-transferases: a risk factor for alcoholic liver cirrhosis. Drug Alcohol Dep.2009, 101:183–190.
46. Chen J, Schenker S, Henderson GI: 4-hydroxynonenal detoxification bymitochondrial glutathione-S transferase is compromised by short-termethanol consumption in rats. Alcoholism Clin Exp Res. 2002, 26:1252–1258.
47. Vanhaecke T, Lindros KO, Oinonen T, Coecke S, Debast G, Philips IR, ShepardEA, Vercruysse A, Rogiers V: Effect of ethanol on the expression of hepaticglutathione S transferase. An in vivo/invitro study. Biochemical Phramacol2000, 60:1491–1496.
48. Brind AM, Hurlstone A, Edrisinghe D, Gilmore I, Fisher N, Pirmohamed M,Fryer AA, Brind AM, Hurlstone A, Edrisinghe D, Gilmore I, Fisher N,Pirmohamed M, Fryer AA: The role of polymorphisms of glutathione s-transferase GSTM1, M3, Pi, T1 and A1 in susceptibility to alcoholic liverdisease. Alcohol Alcohol 2004, 39:478–483.
49. Pal-Bhadra M, Bhadra U, Jackson DE, Mamatha L, Park PH, Shukla SD:Distinct methylation patterns in histone H3 at Lys-4 and Lys-9 correlatewith up- & down-regulation of genes by ethanol in hepatocytes. Life Sci2007, 81:979–987.
50. Josephy PD: Genetic variations in human glutathione transferaseenzymes: significance for pharmacology and toxicology. Human GenomicsProteomics 2010. ID 876940.
51. Ellgaard L, Frickel EM: Calnexin, calreticulin, and ERp57: teammates inglycoprotein folding. Cell Biochem Biophys 2003, 39:223–247.
52. Ni M, Lee AS: ER chaperones in mammalian development and humandiseases. FEBS Lett 2007, 581:3641–3651.
53. Panaretakis T, Joza N, Modjtahedi N, Tesniere A, Vitale I, Durchschlag M,Fimia GM, Kepp O, Piacentini M, Froehlich KU, van Endert P, Zitvogel L,Madeo F, Kroemer G: The co-translocation of ERp57 and calreticulindetermines the immunogenicity of cell death. Cell Death Differ 2008,15:1499–1509.
54. Tokutomi Y, Araki N, Kataoka K, Yamamoto E, Kim-Mitsuyama S: Oxidationof Prx2 and phosphorylation of GRP58 by angiotensin II in humancoronary smooth muscle cells identified by 2D-DIGE analysis. BiochemBiophys Res Commun 2007, 364:822–830.
55. Turano C, Coppari S, Altieri F, Ferraro A: Proteins of the PDI family:unpredicted non-ER locations and functions. J Cell Physiol 2002, 193:154–163.
56. Mooney BP, Miernyk JA, Greenlief CM, Thelen JJ: Using quantitativeproteomics of Arabidopsis roots and leaves to predict metabolic activity.Physiol Plant 2006, 128:237–250.
57. Havlis J, Thomas H, Sebela M, Shevchenko A: Fast-response proteomics byaccelerated in-gel digestion of proteins. Anal Chem 2003, 75:1300–1306.
58. Liu XW, Lu FG, Zhang GS, Wu XP, You Y, Ouyang CH, Yang DY: Proteomicsto display tissue repair opposing injury response to LPS-induced liverinjury. World J Gastroenterol 2004, 10:2701–2705.
doi:10.1186/1477-5956-10-29Cite this article as: Aroor et al.: A proteomic analysis of liver afterethanol binge in chronically ethanol treated rats. Proteome Science 201210:29.
Submit your next manuscript to BioMed Centraland take full advantage of:
• Convenient online submission
• Thorough peer review
• No space constraints or color figure charges
• Immediate publication on acceptance
• Inclusion in PubMed, CAS, Scopus and Google Scholar
• Research which is freely available for redistribution
Submit your manuscript at www.biomedcentral.com/submit