a quantitative analysis of collegiate athletic involvement
TRANSCRIPT

Running head: ATHLETIC INVOLVEMENT AND ACADEMIC ACHIEVEMENT 1
A Quantitative Analysis of Collegiate Athletic Involvement and Academic Achievement among
Sport Management Students
Chris Amos
Liberty University

Running head: ATHLETIC INVOLVEMENT AND ACADEMIC ACHIEVEMENT 2
Abstract
Within the last several decades, more attention has been focused on the academic success of
college athletes. It has been documented from several studies that high school athletes perform
better academically than their non-athlete peers (American Sports Institute, 1995; Brand, 2007;
Dilley-Knoles, Burnett, & Peak, 2010; Foltz, 1992; Fox, Barr-Anderson, Neumark-Sztainer, &
Wall, 2010; Slear, 2005). However, at the collegiate level, this heightened academic achievement
trend among student-athletes is not so clear. Lapchick often releases data regarding graduation
rates among a select group of highly achieving teams in certain sports but not much exists in the
way of a comparison of academic achievement by using student Grade Point Averages (GPA) as
a measuring tool. This study examines the academic success of student-athletes by comparing the
achievement of various athletic teams with students enrolled in a particular set of classes at a
Division I institution. Also, in accordance with the time management explanation of student-
athlete success (Byrd & Ross, 1991), GPA comparisons are conducted between athletes and non-
athletes using in-season athletic hours and working hours as a level comparable variable from
which to examine. Several interesting patterns emerged from the data suggesting that although
time commitments among athletes and non-athletes may have somewhat of a positive effect on
academic achievement, it is not necessary significant.

Running head: ATHLETIC INVOLVEMENT AND ACADEMIC ACHIEVEMENT 3
Table of Contents
Introduction………………………………………………………………………………....pg 5
Purpose of the Study………………………………………………………………………..pg 5
Research Questions………………………………………………………………………....pg 5
Hypotheses………………………………………………………………………………….pg 6
Variables and Key Terms………………………………………………………………..…pg 6
Literature Review…………………………………………………………………………..pg 7
Grade Comparison between Athletes and Non-Athletes…………………………...pg 8
Gender and Race……………………………………………………………………pg 11
Time Management……………………………………………………………….…pg 11
Support Groups……………………………………………………………………..pg 12
School Identification………………………………………………………………..pg 13
Ethics and Human Relations………………………………………………………………..pg 14
Data Collection Method…………………………………………………………………….pg 16
Data Analysis Procedures…………………………………………………………………..pg 18
Data Entry…………………………………………………………………………..pg 18
Coding……………………………………………………………………………...pg 18
Flagged Responses………………………………………………………………....pg 19
Research Design…………………………………………………....…………………..…..pg 20
Sampling………………………………………………………………………….………..pg 21
Results………………………………………………………………………………….…..pg 23
High School Athletic Participation Rates………………………………………….pg 23
College Athletic Participation Rates……………………………………………….pg 24
Job Results…………………………………………………………………………pg 24

Running head: ATHLETIC INVOLVEMENT AND ACADEMIC ACHIEVEMENT 4
Grade Point Averages…………………………………………………………...pg 24
Grade Point Average in Relation to the General Population……………………………pg 25
By Race………………………………………………………………………….pg 25
By Gender……………………………………………………………………….pg 26
Grade Point Average in Relation to Athletic Participation……………………………..pg 26
By Sport…………………………………………………………………………pg 26
By Major Sports……………………………………………………….…,…….pg 28
By Number of In-Season Hours…………………………………………,……..pg 29
Grade Point Average in Relation to Working Students………………………………...pg 31
By Number of Jobs……………………………………………………………..pg 31
By Hours Worked……………………………………………………………....pg 32
Comparison between the Number of In-Season Hours for Athletes and Number of
Hours Worked for Non-Athletes…………………………………………………….....pg 34
Limitations…………………………………………………………………………….. pg 36
Conclusion……………………………………………………………………………...pg 40
Future Studies…………………………………………………………………………. pg 41
References……………………………………………………………………………...pg 43
Auxiliary Resources……………………………………………………………………pg 45
Appendix A – Demographic Data and Correlations...…………………………………pg 48
Appendix B – Activities, Race, and Gender Considerations..…………………………pg 54
Appendix C – Sports, Involvement Hours, and GPA……….…………………………pg 59
Appendix D – Survey Questions………………………………………………………pg 69

Running head: ATHLETIC INVOLVEMENT AND ACADEMIC ACHIEVEMENT 5
Introduction
Over the last decade there has been an increased interest in the correlation between
participation in athletics and success in the classroom for middle school, high school, and even
college students. It has been determined in several different studies that junior high and high
school athletes tend to perform better academically than their fellow classmates who do not
participate in extracurricular athletics (Fox, et al., 2010; Miller, Melnick, Barnes, Farrell, &
Sabo, 2005). These studies have identified a variety of possible explanations such as time
management skills, therapeutic effects of physical activity, being involved in a team setting, and
increased accountability as possible answers (Fox, et al., 2010; Miller, et al., 2005). However,
little attention has been devoted to academic achievement amongst collegiate athletes within a
particular field of study, more specifically sport management.
Purpose of the Study
The purpose of this study is to determine if a correlation exists between athletics and
increased academic performance at the collegiate level. More specifically, the desire is to
determine if students that participate in collegiate extracurricular athletics perform, on average,
better academically than their counterparts who do not participate in sports. An examination will
also be conducted determining the academic achievement levels among different sports along
with exploring the time management theories presented by Fox, et al. (2010) and Miller, et al.
(2005).
Research Questions
Do student athletes at the collegiate level perform better academically (based on GPA)
than their student peers who do not participate in athletics?

Running head: ATHLETIC INVOLVEMENT AND ACADEMIC ACHIEVEMENT 6
In what sports are the highest achieving student athletes participating?
Do working hours among student-athletes and non-athletes have an effect on GPA or a
direct correlation between each other?
Hypotheses
Hypothesis 1: Despite previous findings that middle and high school athletes perform
better than their non-athlete peers, collegiate athletes within sport management will have lower
self-reported Grade Point Averages.
Hypothesis 2: Football and men’s basketball players will have the worst self-reported
grade point averages while female soccer players will have the highest self-reported grade point
averages as seems to be a recent trend (Twaro, 2009).
Hypothesis 3: In a comparison regarding the time requirements of athletes and non-
athletes in regards to their individual sports and work requirements, that non-athletes will have
higher GPAs in the majority of time grouping categories.
Variables and Key Terms
While most of the studies deal with extracurricular activities or extracurricular sports,
every author may have a different definition. For some of the authors these terms refers only to
traditional sports like football, basketball, baseball, soccer, softball, volleyball, track and field,
and wrestling. Other authors will use these terms to include activities like drama, choir, and
chess team. Generally, extracurricular activities will be all-encompassing while extracurricular
sports will only cover the main sports.

Running head: ATHLETIC INVOLVEMENT AND ACADEMIC ACHIEVEMENT 7
The difficulty is that these understandings of the definitions are not always the same from
author to author. Some authors may not be very clear on their definition of either extracurricular
activities or extracurricular sports. The literature is filled with both of these terms and
misinterpreting the author’s intended meaning can cause the results of the article to be
misrepresented. One must carefully examine the context of each phrase in the literature to
determine its true meaning.
A term that will be used frequently throughout this research is Grade Point Average
(GPA). While this may seem like a basic concept, especially given the academic setting that this
research is taking place, it is still wise to make sure that all readers are of the same mindset when
discussing academic achievement. For the sake of this research, GPA is defined as “a
quantitative measure of academic record….on a scale from 0.0 to 4.0” (Fabio, 2010).
For the sake of extending clarification, it may be necessary to determine what parameters
made the author classify a student as an athlete. For the purpose of this research, an athlete will
defined as a student who has participated in one or more semester of intercollegiate athletics. To
be classified as an Intramural Athlete or Club Athlete, the student must have participated in one
or more seasons (generally one semester) of athletic competition.
Literature Review
Throughout the extent of the literature a handful of themes emerged. Several of the
themes were established early on and then as a chronological progression ensued, new trends
emerged that were based upon some of the older themes. After time, a general acceptance of
most of the key points came about. In general, researchers were getting the same results from
both qualitative and quantitative research.

Running head: ATHLETIC INVOLVEMENT AND ACADEMIC ACHIEVEMENT 8
Grade Comparison between Athletes and Non-Athletes.
While research regarding academic achievement among high school students has been
common over the years, only more recently has there been a direct focus on sport participation
and academic achievement. It was often thought that sports were not as important as academics
or even that athletic participation hindered academic achievement (American Sports Institute,
1995). In the early 1990s, the American Sports Institute began an initiative called Promoting
Achievement in School through Sport (PASS). The PASS program sought to improve the
mindset of educators regarding athletics and also set out to implement its specific learning
objectives. To prove the validity of the PASS program, the American Sports Institute conducted
a three year study concerning the correlation between their program, athletic involvement, and
academic success among high schools (American Sports Institute, 1995).
The study took place during the 1991-1992, 1992-1993, and 1993-1994 academic school
years. Several interesting results came from this study which began to change educators’
perceptions about athletics and its role in academic settings. Fifty-eight percent more students
who were enrolled in the PASS program increased their academic grades than the control group
over one academic year. When compared to the control group, over twice as many students in the
PASS program increased their scores by a full letter grade. The control group students had fifty-
three percent more of its members grades go down during the school year when compared to
students in the PASS program. PASS student-athletes were eighty-seven percent more likely to
regain their eligibility than those students in the control group. Students involved in the PASS
program were twenty percent less likely to lose their eligibility over the course of the study than
the control group. The study ended with the conclusion that athletic participation actually

Running head: ATHLETIC INVOLVEMENT AND ACADEMIC ACHIEVEMENT 9
increases academic achievement among physically-oriented high school students (American
Sports Institute, 1995).
Recent research has shown that there is an ever increasing pressure on student-athletes at
the collegiate level. They are pushed to excel athletically and academic success can take a back
seat so long as the athlete is maintaining their eligibility. However, it was determined that
athletic participation actually increased academic achievement, which was measured by GPA
(Dilley-Knoles, et al., 2010) . It was also determined by Foltz (1992) that athletes performed
better in-season than they did out-of-season. Dilley, et al., (2010) determined that at their
particular institution of research Women’s Volleyball, Women’s Cross Country, and Women’s
Tennis had the highest GPA among intercollegiate sports. This goes along with a gender theme
which will be discussed in a later section.
Research concerning academic achievement and athletic involvement has even been
examined at the middle school level. In research conducted in the Minnesota area, middle school
boys, high school boys, and high school girls who participated in athletics were determined to
have higher grades than their peers who did not. The only category where athletic involvement
did not seem to have a positive academic affect was among middle school girls (Fox, et al.,
2010).
According to David McDonald, History Department Chair at the University of Wisconsin
and current oversight member of the Wisconsin Athletic Department, football players at most
large scale schools have the same grades and graduation rates as the rest of the student body
(Greenberg, 2008). The correlation between grades and athletic involvement extends to even
nontraditional sports such as swimming. Slear (2005) discusses how athletic involvement, even

Running head: ATHLETIC INVOLVEMENT AND ACADEMIC ACHIEVEMENT 10
in a non-typical sport like swimming, leads to greater academic achievement at the high school
and collegiate levels.
Lapchick (1989) discusses in length about the culture surrounding high school sports. He
addresses the “Pass to Play” mandate which prevents high school athletes from participating in
school sponsored athletic events if they do not meet eligibility requirements. Lapchick even goes
so far as to break down the athletic eligibility guidelines for each state. While Lapchick is more
known of late for his work on graduation rates among NCAA Division I football bowl teams and
basketball March Madness teams, this work concerning high school athletes is full of
information as well.
Myles Brand, former president of the NCAA from 2003-2009, presented information to
convince the general public that collegiate-student athletes performed better than their non-
athlete peers and also had higher graduation rates. According to Brand, in 2005, student-athletes
who were entering a Division I college, on average, had a 0.07 higher GPA and scored 33 points
better on the SAT than the general student population entering Division I institutions. Brand also
states that among Division II schools athletes had an eight percent higher graduation rate than the
general student population (this of course begs the question of why Brand did not address
Division I graduation rates). In addition, Brand addresses the sentiment that football and
basketball players are the worst achieving student-athletes. Brand presents that Black, male
football players had a twelve percent higher graduation rate than all Black, male students. For
White, male football players the graduation rate was the same as all White, male students. When
it comes to basketball, Brand maintains that Black, male basketball players have a five percent
higher graduation rate than the rest of the Black, male student population (Brand, 2007).

Running head: ATHLETIC INVOLVEMENT AND ACADEMIC ACHIEVEMENT 11
Gender and Race
Dilley-Knoles, et al., (2010) determined in their research that female student-athletes
from one particular collegiate institution achieved a 0.511 point higher GPA than the male
student-athletes at that institution. Research among high school athletes shows that females who
participate in athletics report higher grades than those who do not participate in athletics. This
confirms that females athletes seem to achieve the best academically (Miller, et al., 2005).
Race also plays a factor in the athletic involvement and academic achievement query.
Miller, et al., (2005) discovered that black, female athletes performed worse academically than
other races. Miller, et al., attributed this to black, female athletes labeling themselves as “jocks”
but the debate can still be made that it had more to do with race than personal labels.
Time Management
As is the case with every person, student-athletes have a limited amount of time in their
day. For athletes, this limited amount of time can be more severe than people engaging in other
activities or professions. Athletes must juggle many different responsibilities with not much in
the way of time. For this reason, athletes must have excellent time management skills (Byrd &
Ross, 1991). Student-athletes are not afforded the luxury of being able to waste time by playing
video games or simply “goofing off,” they must focus on their homework and study when they
have the time allotted otherwise the work will not get done. This forces student-athletes to finish
homework and study in a timely manner.
Student-athletes are under immense pressure to excel athletically, academically, and
socially. If a student-athlete does not have good time management skills, then not only will their
grades suffer, but all areas of their life will begin to deteriorate. Given this holistic approach, it is

Running head: ATHLETIC INVOLVEMENT AND ACADEMIC ACHIEVEMENT 12
not unreasonable to say the overall success of a student-athlete is greatly contingent on their
ability to practice good time management skills.
Support Groups
Although not quite as common at the middle school and high school levels as the college
level, support groups of all varieties are found at the various levels. These groups help cater to
the athlete’s busy schedule and many of the people involved in running these groups understand
the academic pressures on student-athletes. From the research, it appears that academic support
programs are not a ‘one size fits all' item; male student-athletes may need a different type of
program in order to achieve academic success. It is likely improbable that a general model of a
male and female academic support program may be developed. However, it is worth noting that
these academic support groups immensely help student-athletes when it comes to academic
achievement (American Sports Institute, 1995; Byrd & Ross, 1991; Dilley-Knoles, et al., 2010;
Miller, et al., 2005).
Academic support services are often fraught with one on one tutors and special help. The
groups are also generally only for student-athletes. While many may construe this as an unfair
advantage or privilege over the general student population, it must be mentioned that all students
have access to tutoring help and support groups. These services may not cater to specific
populations, such as athletes, and may not be structured the same but they are still an available
resource. The difference in perception occurs because student-athletes are generally forced by
coaches to attend academic support groups or study halls while the average student will not have
someone showing him all of the resources available and pushing him towards utilizing those
resources.

Running head: ATHLETIC INVOLVEMENT AND ACADEMIC ACHIEVEMENT 13
School Identification
Student-athletes tend to have a significantly higher identification rate with their schools
than the general student population. Students have a social identity which they must maintain. It
is generally seen that teenagers in a high school setting will fall into certain roles. For some of
these students, they fall into the role of being a jock or athlete. It becomes their identity and they
cannot exist apart from it, at least in their own mind. This sense of identity is intensified by being
on an athletic team. Teams are identified by their school name which means a lot is on the line
when student-athletes compete. Student-athletes know that if they lose eligibility then they are
letting their school down. This can create a lot of pressure but at the same time it builds a natural
incentive for the student-athlete to do well in school to maintain their eligibility (Marsh, 2003).
Consequently, there are several arguments that can be made here. The first is that this
pressure may only push the student-athlete to do the bare minimum to maintain eligibility as they
do not find their identity in their academic achievement but rather their athletic achievement.
This point can be countered with the logical progression that most student-athletes are intelligent
enough to know that they must leave themselves a GPA buffer in case they perform
unexpectedly bad on a certain test or assignment. It can also be argued that the student-athlete
may have performed even worse had he not been an athlete and, therefore, meeting the minimum
eligibility requirements is an improvement over what would have been the student’s achievement
(a valid and substantiated position given the research addressed earlier).
The second issue raised would be whether or not the pressure levied against these
student-athletes is fair or right. This is more a question of morality and the answer may vary
from person to person. However, it is not unreasonable to say that pressure is an inherent part of

Running head: ATHLETIC INVOLVEMENT AND ACADEMIC ACHIEVEMENT 14
athletic involvement. There is pressure to perform on the field, pressure to practice adequate time
management, and pressure to succeed academically, along with any personal, family, or
situational pressures that may arise. Apart from coercion from family or school personnel, there
is no reason why a student cannot decide that he does not want to participate in athletics
anymore. If the pressure is too much, the athlete can generally remove himself from the activity.
While this does not directly answer the ethics of whether or not the pressure is fair or right, it
gives guidelines as to how the pressure can be avoided if necessary.
Ethics and Human Relations
IRB Approval
In accordance with university policy and general standards of research within an
academic institution, the research study was submitted to the University’s Institutional Review
Board (IRB) for review and approval. Submitted within the proposal was the survey, along with
the complete logistics of the study from start to finish. Because the university’s IRB process can
take many months, it was requested that the study receive a truncated exemption since the study
had to be wholly completed within a three month period. Since the nature of the study was on a
relatively small scale and there was no significant possible harm to participants, the study was
granted expedited approval.
Ethics and privacy were a main concern of the researcher. There were numerous steps
that were taken to ensure the privacy of the participants was not violated. All surveys were
anonymous. No names were attached to any surveys and this request was made clear to all
participants. The surveys were all mixed together in a folder which prevented the ability for the
researcher to go back later and find a particular survey for a particular person. The only surveys

Running head: ATHLETIC INVOLVEMENT AND ACADEMIC ACHIEVEMENT 15
that were separated from the rest were ones that were flagged for unclear responses, and these
were only pulled after being initially mixed in with the general pool of surveys and were
themselves mixed together in a folder with other flagged surveys.
No one was forced to complete the surveys and participation was completely voluntary.
There were no repercussions for not participating in the study, only random prize incentives for
those who did participate. This is addressed in the Data Collection Method Section. Student
rosters were printed off from each Sport Management class and students’ names were checked
off of the roster sheet as they turned in their surveys. This kept the surveys anonymous but
allowed documentation of participants for the random prize drawings. The three prizes given
away were two $10 gift cards to Chick-fil-A and a $20 gift card to iTunes.
Other than demographical information, no personal information was collected on the
surveys. Participants were asked to provide their age, gender, race, academic rank, home state,
major, and minor within the demographic section. It was the concern of the researcher that it
would be possible to trace surveys back to select individuals if their survey answers were unique.
For example, if a survey respondent listed Alaska as his home state and stated that he was
‘American Indian or Alaska Native’ and participated in Men’s Lacrosse, it would be easy to
determine who this respondent actually was given the lack of male students from Alaska that
play lacrosse. However, after discussing it with the research committee, it was determined that
nothing else could be done to realistically make the surveys any more anonymous. The surveys
would only be in the hands of the researcher and if someone really wanted to trace the survey
back it would be possible in most studies, especially those of the qualitative nature.
Running head: ATHLETIC INVOLVEMENT AND ACADEMIC ACHIEVEMENT 16
Data Collection Method
The data for this research were gathered in the form of a survey administered to students
taking Sport Management classes at a Division I institution. Surveys were given to all students in
these Sport Management classes regardless of whether or not they were Sport Management
majors. The survey was on a single sheet of paper, front and back. Three types of data were
gathered from the surveys: demographic information was collected to look for certain trends,
information from the questions that were directly related to the current research, and information
that reflected the effectiveness of the University’s Department of Sport Management which can
be used to direct further assessment research.
The surveys were handed out over the course of seven days. Careful planning was
conducted to make sure that all classes were given the survey and that all students would have
the opportunity to participate. Faculty members for the classes were very helpful in allowing
time for the surveys to be handed out and the researcher to speak about the logistics of the survey
and the confidentiality of the data.
All surveys were anonymous which was addressed in the Ethics and Human Relations
Section. The surveys were voluntary but most students were in “assessment mode” since the
administering of the surveys happened to coincide during a time when the university was
undergoing its own assessment procedures including a specific assessment day. It is the
researcher’s belief that this helped foster an environment of “survey compliance” which led to an
extremely high return rate. As an incentive to increase participation rates, the students were told
that three random students who completed the survey would win prizes. To maintain the
anonymity of the research, students’ names were checked off a separate sheet when they returned

Running head: ATHLETIC INVOLVEMENT AND ACADEMIC ACHIEVEMENT 17
their surveys. No names were attached to the surveys and all of the surveys were mixed together
from the different classes.
The original intent was that surveys would be distributed at the beginning of a class
period and then collected the next time the class met. For example, surveys for
Tuesday/Thursday classes were administered on Tuesday with the intention of collecting the
surveys on Thursday. Then on Thursday, surveys would be distributed to those who missed class
during the initial handout and would then be collected the following Tuesday, a seven day cycle
in all. For Monday/Wednesday/Friday classes, surveys were distributed on Monday with
collection occurring on Wednesday. Surveys for those missing class on Monday were handed out
after the Wednesday collection and then collected on Friday. This allowed full participation,
even among those who missed a class due to illness, sport travel, or other reasons.
Despite the researcher’s intentions, surveys ended up being returned much quicker than
anticipated. Most respondents returned their surveys on the same day it was administered. Given
the researcher’s office’s close proximity to the Sport Management classrooms, it is not difficult
to see how this could occur. Some faculty members even finished class early and allowed
students time to complete the surveys. While this did not intrude on the voluntary aspect of the
survey participation, it did foster an atmosphere that encouraged completion of the surveys.
In total 255 surveys were handed out. The goal of the researcher was to achieve a 66%
survey return rate. In each class, students who had not yet received the survey were asked to
raise their hands and were consequently given a survey. While this method was obviously not
perfect, it was designed to ensure that students who were enrolled in multiple Sport Management
classes were not given the survey twice as this would distort the statistics. Based on the amount

Running head: ATHLETIC INVOLVEMENT AND ACADEMIC ACHIEVEMENT 18
of surveys handed out (255) and the number of students in the Sport Management Program (314)
the researcher does not think duplicate surveys are of concern at all. Of the 255 surveys
distributed, 220 were returned for an 86.27% completion rate. This completion rate is well above
the researcher’s target mark.
Data Analysis Procedures
Data Entry
Data was entered solely by the researcher. Survey data was entered in three main
groupings as survey collection occurred. Demographic information was pre-coded and entered in
coded formation. Information was entered into a single Microsoft Excel Spreadsheet. This
allowed easy sorting of the data even after the analysis had been run. Once all of the data had
been entered into the spreadsheet, the spreadsheet was then imported into the Statistical Program
for the Social Sciences (SPSS) where statistical analyses were run.
Coding
Data was coded in two different stages. Before data entry began, demographic data was
coded to make data entry easier and more efficient. Standard coding was used for responses such
as Yes=0 and No=1. Not all data was pre-coded because there was no possible way to know
what all of the responses would be for every question. Once all of the data was entered into the
spreadsheet, coding was conducted for each category. To implement the coding on the
spreadsheet, each column or question was grouped by responses and the ‘Find and Replace’
feature on Excel was used to replace all of the various text answers with their new corresponding
code.

Running head: ATHLETIC INVOLVEMENT AND ACADEMIC ACHIEVEMENT 19
High school and college extracurricular activities and sports each received their own
code. Since most respondents participated in multiple sports or extracurricular activities, there
were strings of code in these cells. Due to the researcher’s unfamiliarity with the SPSS program,
it was not discovered until data analysis began that SPSS could not process strings of code. It
was at this point that individual high school extracurricular activities and sports could not be
examined individually but simply by whether or not a student participated in extracurricular
activities or sports in high school. As for college sports participation, fortunately only one athlete
participating in intercollegiate sports was on more than one team. Instead of coding each
individual intramural sport which would consequently lead to string of code, all intramural sports
were recoded to 99. This eliminated all strings of code but one remaining respondent who
participated in both Cross Country and Track and Field. Since the respondent was the only Cross
Country participant, it was determined, after consulting with a committee member, that Cross
Country would just be included with Track and Field for the sake of coding.
Flagged Responses
During the course of the data entry, several surveys were flagged due to unclear answers
or missing information. The researcher then sat down with a member of his committee and
reviewed each of the flagged responses. All of the surveys were counted even if they were
missing some responses or certain responses were unclear. For unclear responses, the committee
member and the researcher worked to determine the intention of the answer.
For most flagged answers, the issue was that the response was not a numerical value. For
example, the question was asked of athletes “How many hours a week do you spend engaged in
team or group activities such as practices, conditioning, or games mandated by the team for in-

Running head: ATHLETIC INVOLVEMENT AND ACADEMIC ACHIEVEMENT 20
season and out-of-season?” An example of flagged response would be an athlete who answered
“a lot” or “most of my time” to either the in-season or out-of-season category. Since this study is
quantitative in nature and anonymous, no follow up questions can be asked to determine how
much time is “a lot.” It was determined by the researcher and the committee member to nullify
answers where no finite quantitative response could be inferred.
For participants who left demographic or other important questions blank on their survey,
their answers were deemed with a “no response” classification and were included in the survey
pool. If a white male who plays basketball did not circle the male classification on the survey, his
overall answers would still be contributed to the pool but he would not be a part of certain
subsets. For example, if the researcher isolated male basketball players versus female basketball
players, the previous respondent would not be included in this analysis because the survey
answer did not fall into either the male or female category, even though he is a basketball player.
Research Design
During the conceptualization of this research study, it was originally anticipated that t-
tests would be able to be used for the research analysis. However, once surveys were created and
data began to come in, it became evident that a simple t-test would not be complex enough for
the type of analysis that was desired. Since a t-test is only used on the mean scores of two groups
(Gall, Gall, & Borg, 2005), it was necessary to use an analysis of variance. An analysis of
variance can be used to “determine the likelihood that the differences between the three mean
scores occurred by chance, in other words, that they are chance values generated by drawing
repeated samples from three populations having identical scores” (Gall, et al., 2005).

Running head: ATHLETIC INVOLVEMENT AND ACADEMIC ACHIEVEMENT 21
A One-Way Analysis of Variance (ANOVA) is “a way to test the equality of three or
more means at one time by using variances” (Jones, 2011). The main concept of an ANOVA is
that variability or differences within the sample group will reflect variability in the means of
different testable aspects of the group (Motulsky, 1999). Generally, within a One-Way ANOVA,
the null hypothesis is that all of the population means are equal (Jones, 2011). The general
equation for a One-Way ANOVA is (MathWorks, 2011). The One-Way ANOVA
works perfectly for this study due to the fact that it can compare multiple levels of just one factor
(National Institute of Standards and Technology, 2010).
Sampling
The sample chosen for this study were undergraduate students enrolled in Sport
Management classes for the Spring 2011 semester. The sample is not limited to only Sport
Management majors; however, it can be safely said that Sport Management majors made up the
majority of the sample. It can also not be said that all Sport Management majors were captured in
this sample. There were students who were declared Sport Management majors who were not
enrolled in a Sport Management class for the Spring 2011 semester or were enrolled in a Sport
Management internship or practicum class which does not regularly meet and was not able to be
included in the sample. The majority of the sample is comprised of white males. This was
unavoidable given the parameters of the research since white males make up the majority of
students in the Department of Sport Management.
Of the 220 respondent, 183 were males (83.2%), 33 were females (15.0%), and 4 did not
answer the question (1.8%) (Appendix A, Table 1, Chart 1). This high ratio of males to females
Running head: ATHLETIC INVOLVEMENT AND ACADEMIC ACHIEVEMENT 22
was anticipated and is not unexpected given that sport management degree programs typically
have a much higher proportion of men than women.
Of the 220 respondents, 168 classified themselves as White (76.4%), 35 as Black
(15.9%), 5 as Hispanic (2.3%), 2 as Native Hawaiian or Pacific Islander (0.9%), 2 as Asian
(0.9%), 1 as American Indian or Alaska Native (0.5%), and 3 as Other (1.4%) (Appendix A,
Table 2, Chart 2). These ethnic or race categories were garnished from the 2010 United States
Census and are the same race categories as what was on the official census (United States
Government, 2011). Once again, the high percentage of Whites who participated in the study is
consistent with overall college attendance figures for race (Lewin, 2006).
The average age of the study participants was 20.6 years of age with the median age
being 21. The range was 13 years with the youngest student participant being 17 years of age and
the oldest being 30 years of age. Of the 220 respondents, only 2 did not supply an age (Appendix
A, Table 4).
Not unexpectedly, the state in which the highest number of survey participants labeled as
their home state was Virginia (73 or 33.2%), followed by North Carolina (25 or 11.4%),
Maryland (17 or 7.7%), Pennsylvania (16 or 7.3%), and Florida (13 or 5.9%). Besides the United
States, survey participants were also from the Bahamas, South Africa, Canada, and Trinidad &
Tobago (Appendix A, Table 5). Seeing as how the university being examined is located in the
state of Virginia, it is reasonable to expect that the highest number of survey participants would
be from Virginia and surrounding states.
The vast majority of participants were Sport Management majors. Since the target
segment was Sport Management classes, these results are all but a given. Data is included from

Running head: ATHLETIC INVOLVEMENT AND ACADEMIC ACHIEVEMENT 23
students who were majoring in something other than Sport Management or who had not declared
at all. The top five majors were Sport Management with 171 students (77.7%), Kinesiology with
12 students (5.5%), Undecided with 9 students (4.1%), along with Business, Exercise Science,
and Religion each with 4 students (1.8% each).
Student participants were asked to provide their academic class (Freshman, Sophomore,
Junior, or Senior). There were 48 Freshmen (21.8%), 44 Sophomores (20.0%), 51 Juniors (23.2),
76 Seniors (34.5), and 1 non-response (0.5%) (Appendix A, Table 6, Chart 3). These figures
were actually somewhat surprising. It was anticipated that there would be more Freshmen since
the 200 level classes have over double, in some cases even triple the capacity of most upper level
classes. Also, given the fact that retention rates at universities are rarely 100%, this number
seemed a bit peculiar. One thing to keep in mind was that this was an anonymous, self-reported
survey and students may have a tendency to place themselves a class ahead in their academic
pursuits from where they truly are. Another possibility is that there may be Freshmen who are
declared Sport Management majors but are working on General Requirement Courses and not
enrolled in any Sport Management classes for the Spring 2011 semester.
Results
High School Participation Rates
Of the 220 survey respondents, 215 (97.7%) participated in high school sports or
extracurricular activities. Only 5 (2.3%) did not participate in any type of extracurricular activity
in high school.

Running head: ATHLETIC INVOLVEMENT AND ACADEMIC ACHIEVEMENT 24
College Participation Results
A significant number of survey takers participated in collegiate athletics whether it be
intercollegiate participation, intramurals, or student managing. Among students that reported
participating in a college sport, 76 (34.4%) were involved in intramurals. The second and third
highest sports participated in were football with 23 participants (10.4%), and Men’s Club
Hockey with 8 participants (3.6%)(Appendix B, Table 1).
Job Results
Subjects were asked “Do you have a job that you are currently working at?” to determine
their status of employment during a typical semester. Since the surveys were administered in
early April, the semester was still in full swing making the currently part of the question apply to
during a school year or semester. Students reported that 66 (30%) currently had a job, 115
(52.3%) did not currently have a job, and 39 (17.7%) were seasonally employed but not currently
working (Appendix B, Table 2, Chart 1). This breaks down to a little less than one-third of Sport
Management students are working during a typical semester in addition to the course load.
Of the 105 students who responded that they currently had a job or had a seasonal job, 70
responded when asked “How many jobs are you currently working?” Of those 70 respondents,
54 (77.1%) said they currently had 1 job, 15 (21.4%) said they currently had 2 jobs, and 1 (0.5%)
said that they currently had 3 jobs (Appendix B, Table 9).
Grade Point Averages
In the survey, students were asked to supply their college GPA. Detailed instructions
were given on how to obtain their GPA using the university’s Automated Student Information

Running head: ATHLETIC INVOLVEMENT AND ACADEMIC ACHIEVEMENT 25
Services Tool (ASIST). Although arguably the most important category, the GPA question was
unanswered the most of any survey question. A total of 18 respondents did not supply their GPA.
Of the 202 respondents that did supply their GPA, the mean GPA was a 2.8799 on a 4.00 point
scale. The highest GPA reported was a 4.0 and the lowest reported GPA was a 1.0. Given the
time and effort required to log onto the ASIST System and navigate to the correct page to
discover one’s GPA, it was predicted that there would be a bundle of GPAs as students would
just estimate or guess their GPA instead of actually looking it up. This appeared to be the case as
GPA bundles occurred around the 2.5, 3.0. 3.5 marks. Although it would have been ideal to
verify survey takers’ GPAs, this was simply unfeasible due to privacy issues. Despite these self-
reported GPA bundles, because of such a large sample size, the number of respondents who were
not in any bundles, and the standard deviation being .592964, that any abnormal or incorrect
responses will have been balanced out in the large data field (Appendix B, Table 6).
Grade Point Average in Relation to the General Population
By Race
Due to reasonable prudence, it is important to understand that GPA results by race at this
particular university are under the limitation that the majority of students enrolled are White.
However, it should also be taken into consideration that this is not uncommon from what is
typical at other universities (Lewin, 2006). It is common that the majority of students on a
college campus are white males (United States Government, 2006). However, when examining
the Asian, Hawaiian, and Hispanic categories, it is worth noting that due to the smaller number
of people who identified themselves as each of those races, skewness is a distinct possibility
(Appendix B, Table 5, Chart 2).

Running head: ATHLETIC INVOLVEMENT AND ACADEMIC ACHIEVEMENT 26
By Gender
As with race, the gender category in relation to GPA also has some limitations. This was
most certainly anticipated before research ever began. The surveys were administered to students
enrolled in Sport Management classes. Sport Management classes tend to be dominated by males
(Brunner, 2003). The reasons why are outside the scope of this report and can be examined in
another study. Therefore, logically, more males than females will be represented in this study
and by a wide margin as well. This does not make the data any less credible as a significant
number of females are still represented in the data which ensures the prevention of skewed
results.
As for the results, the mean GPA for females was 3.038 and for males it was 2.845
(Appendix B, Table 6, Chart 3). It should be noted that this is only amongst those enrolled in
Sport Management courses. Also, it can be argued that the 0.19 difference in GPA is not
necessarily significant. On a typical 10 point grading scale this statistical difference would only
account for less than one-fifth of a letter grade. While this difference is not significant, it is worth
noticing.
Grade Point Average in Relation to Athletic Participation
By Sport
Two different analyses were conducted regarding sport. The first was on the comparison
of GPA within all extracurricular activities and sports reported on the surveys as having been
participated in. The second is a look at just the typical major sports within an athletic program.

Running head: ATHLETIC INVOLVEMENT AND ACADEMIC ACHIEVEMENT 27
When comparing all extracurricular activities and sports, one sport immediately stands
out as having the highest GPA, even across multiple levels. Club Men’s Soccer had the highest
mean GPA with a 4.0 (Appendix C, Table 1, Chart 1). The fault in this particular category lies in
that only person reported that they played Club Men’s Soccer and Men’s Soccer is not a Club
Sport at this institution. Therefore, one can only assume that it is either a transfer student who
played Men’s Club Soccer before coming to Liberty or the respondent gave a falsified answer.
To counteract the single participant in Club Men’s Soccer, the mean GPA of all soccer
categories is still, by far, the highest. Of the top five GPA sports, soccer holds four of the spots.
The top GPA’s were Men’s Club Soccer – 4.0, DIII Women’s Soccer – 3.94, DIII Men’s Soccer
– 3.7, Men’s Soccer – 3.5, and Club Field Hockey – 3.5.
There are several things that need to be said about this data. First, it must be understood
that without a doubt these results are skewed. Most of the categories in the proceeding chart
contain only one respondent. Secondly, of the top three sports, all of them were participated in at
a previous institution since this university is a Division I university. Thirdly, it is not surprising
that two Division III programs made the list. Division III schools do not offer athletic
scholarships. Athletes must either earn academic scholarships or pay for tuition out of pocket.
This causes many Division III athletes to be simply playing for the love of the game. It also lends
to the deduction that Division III athletes may tend to have higher GPAs since the only
scholarships they can obtain are academic (Woods, 2006). The five lowest sport or
extracurricular GPA’s were: Club Men’s Lacrosse – 1.93, Wrestling – 2.0, Club Women’s
Hockey – 2.49, Club Men’s Hockey – 2.5, and Band – 2.52.

Running head: ATHLETIC INVOLVEMENT AND ACADEMIC ACHIEVEMENT 28
Again, as was the case with the highest sport/extracurricular activities’ GPAs, skewness
was a factor, but not as much so in this category. Just the worst sport, Club Men’s Lacrosse, had
only one respondent. If the single Club Men’s Lacrosse player is combined with the four
Women’s Lacrosse players who participated in this study, the mean GPA would raise
significantly. However, doing this would cause two complications for legitimacy. The first
consideration would be that Men’s Lacrosse is a Club Sport and Women’s Lacrosse is a Division
I Sport. Also, combining one male with four females after having just seen that females had a
higher mean GPA would also hurt comparison validity.
By Major Sports
In the interest of practicality, the researcher took a more in depth look at the main college
sports. As a criteria to be included in this grouping, the sport could not be a Club or Intramural
Sport and had to have more than two participants from the survey. In addition, to be classified as
a major sport, the sport has to be a traditionally revenue-generating sport or be a sport with
higher attendance numbers compared to other intercollegiate sports. The only sport that would
generally be considered a main college sport that was represented in the survey data but not
included in this category is Golf. The reason for this exclusion was that Golf only had one survey
participant and that GPA was the lowest of all the sports, demonstrating skewness.
Among the major sports, Men’s Soccer had the highest GPA with a mean GPA of 3.5
(Appendix C, Chart 2). This coincides with the previous results concerning all sports. The lowest
GPA sport was Wrestling with a mean GPA of 2.0. Despite the initial hypothesis that Women’s
Soccer players would have the highest self-reported GPAs, it is actually Men’s Soccer players
who have the highest self-reported GPAs followed by Track and Field / Cross Country (3.21)

Running head: ATHLETIC INVOLVEMENT AND ACADEMIC ACHIEVEMENT 29
and Women’s Soccer (3.18). Also, the hypothesis that Football and Men’s Basketball players
would have the worst GPAs only proved to be half correct. While Wrestling was by far the
worst, Football was also at the bottom (2.73), along with Softball (2.86) who beat out Men’s
Basketball by only 0.09 points for the bottom three honors.
By Number of In-Season Hours
One of the main purposes of this study was to examine the time management argument
that is often heard as a justification of an athlete’s lower GPAs. This argument can be confusing
because it is used as both a justification for positive and negative outcomes. In high school, it is
often argued that student-athletes must have excellent time management skills. They have to sit
in class all day, go to practice or a game, come home, eat, and do homework. All of this must be
completed within a reasonable timeframe to allow the student-athlete to get plenty of sleep to do
it all again the next day. The argument is then made that one of the reasons why high school
student-athletes have higher GPAs is because they do not have time to “goof off” and play
videogames. They have to practice time management skills to complete everything and stay
eligible (Byrd & Ross, 1991).
However, the same argument is then molded and used to explain a completely different
outcome in college athletes. Proponents of college athletic reform often state that student-
athlete’s grades suffer because of the immense workload they are under. They claim that student-
athletes generally are engaged in team required activities more than the NCAA limit of 20 hours
per week. In addition, the student-athletes must attend classes, do homework, study, maintain a
social life, all while allowing enough time for sleep. They claim that because of these immense
time constraints, student-athletes’ GPAs and social lives are struggling. The counter-argument is

Running head: ATHLETIC INVOLVEMENT AND ACADEMIC ACHIEVEMENT 30
often made that many within the general student population that are not athletes have to work the
same amount of hours as athletes spend on their own sports, if not more. The argument then
delves down into the debate of whether or not to pay college athletes. While it is not the goal of
this research study to solve the debate of whether or not to pay college athletes, it is the goal of
this research to at least shed light on one piece of the argument.
Based on the data, there really does not seem to be a trend between increased hours
involved in a particular sport and academic achievement (Appendix C, Table 2, Chart 3). While
the data does seem to indicate that past the 35 hour mark that GPAs tend to fall off, there is a
verification that the more hours a student-athlete is involved in sports, the lower his GPA. The
GPA means for the two ranges 35-39 Hours and 40+Hours coincide with 10-14 Hours and 5-9
Hours categories. Between 15-35 Hours, the GPA means are relatively similar in each category.
The only overtly interesting statistical category is the 0-4 Hour range. GPAs in this category
were much higher than the other categories and would indicate that more free time is better for
academic performance. However, a realistic perspective on this would dictate the realization that
only between 0-4 hours of work for a team is unrealistic for most sports. The data does make a
case for the Time Management argument in that as the workload increased, the mean GPA
typically increased to a point with the exception of two categories. Once the point of overload
was reached (anything greater than 35 hours), Time Management could be deemed extremely
difficult and GPAs dropped. In reality, the best conclusion to draw from this particular data set is
that there does not seem to be a trend in In-Season Hours Spent Participating on a Sport and
GPA.

Running head: ATHLETIC INVOLVEMENT AND ACADEMIC ACHIEVEMENT 31
Grade Point Average In Relation to Working Students
Based on the data discussed previously, 105 students reported that they had jobs. The
average number of hours worked per student per week was 23.08 (Appendix C, Table 3).
By Number of Jobs
The analysis regarding the correlation between the number of jobs a student works and
their academic achievement is extremely interesting. One might assume that the more jobs a
student works, the worse their GPA would be on a sliding scale. Although it is possible to have
three different jobs in which only five hours a week are worked at each job, this is highly
unusual and it would follow logic that the more jobs a student has, the less time they have to
study and complete school work.
Despite these initial premonitions, the data is quite is clear that as the number of jobs a
student works increases, so does their GPA, to a certain point (Appendix C, Table 4, Chart 4).
Students who worked zero jobs had a mean GPA of 2.852 while those that worked one job had a
mean GPA of 2.898. Continuing the trend, those who worked two jobs had an even higher mean
GPA of 3.086. At this point the data becomes inconclusive. Only one respondent reported having
three jobs and there were no students who had any more than three jobs. While the GPA for the
one student with three jobs was 2.600, a significant drop from those with two jobs, this cannot be
construed as a good representation of the student population that works three jobs since there
was only one respondent. This particular student’s GPA could be an anomaly or accurately
represent the general student population working three jobs. There really is no way to tell
without a larger sample size of students working three jobs.

Running head: ATHLETIC INVOLVEMENT AND ACADEMIC ACHIEVEMENT 32
By Hours Worked
When examining the data regarding GPA and the correlation with number of hours a
student worked, an interesting trend emerged. On average, as a student’s amount of hours
worked increased so did their GPA to a certain point (Appendix C, Table 5, Chart 5). This
appears to be similar to the trend involving the number of in-season hours an athlete participated
in their sport and their corresponding GPA. With the slight exception of the 15-19 hour range, as
the number of hours increased the GPA either stayed the same or increased until the 35 hour
mark. What is worth noting is that the 35 hour mark is the same level where athlete’s GPAs also
began to decrease. For educators, this 35 hour mark is certainly worth an examination as
educators may be able to encourage their students not to work over 35 hours if possible as it will
likely lead to a decreased GPA.
While it may seem surprising initially that once again the more hours a person works the
better their GPA to a point, this seems to be an emerging theme. This also contributes to proving
the time management theory (Byrd & Ross, 1991) discussed in the literature review. Although an
increased number of work hours would seem to take away from study time for students, it seems
to have not only a counterbalancing effect, but also an overwhelming positive effect on academic
achievement. Both the general student population and student-athletes are forced to implement
time management skills as their time commitments increase. This prevents all students from
wasting time and gives them set parameters to complete their sport or job duties as well as their
academic requirements.
Another possible explanation for this phenomena deals with the type of people that fall
into this category. It would not be prudent to not delve into the possibility that the statistics may
need to be looked at in reverse. The analysis to this point has looked at the correlation of hours
worked for a sport or a job and its relationship on academic achievement or GPA. However, it

Running head: ATHLETIC INVOLVEMENT AND ACADEMIC ACHIEVEMENT 33
may not be this simple. The number of hours worked may not actually have a direct effect on
GPA. Instead, GPA may have an effect on the number of hours worked. More precisely, GPA
may be a barometer of the student. Indicatively, GPA may be a descriptive factor of the type of
person that is participating in this study.
To put it into an example, look at things from an inductive perspective. A student that has
a 4.0 GPA is invariably a good student. Conclusions can be automatically drawn from their GPA.
They are likely a smart person and responsible, the type of person that people would trust or have
the opinion that they will be very successful in life. Because this 4.0 student has a good GPA,
they may have been raised to be a responsible person and self-sufficient or at the least aware of
what is needed to succeed in life such as a stable financial basis. For this reason, the student
obtains a job during the semester to help provide a monetary basis to live on or to help establish
there self for the future. They are aware that they must continue to excel academically so they do
not take on a full-time job, but one that provides enough hours to make it worth their trouble.
In the previous example, the student’s GPA is not 4.0 because they work. The student
works because their GPA is 4.0, more specifically because they are smart. The 4.0 GPA is an
indication of their intellect. They understand the need for fiscal responsibility and work because
of it. While there is no way to infer this type of scenario from the data to confirm this possible
explanation for the data results, it is still a feasible possibility. It would not be prudent to simply
ignore this possibility and not bring to light its viability. Also, while this may be a plausible
scenario within the analysis of hours worked for non-athletes and their GPA, this scenario does
not make as much sense when it is applied to athletes, the number of hours spent on their
particular sport, and their GPA. A 4.0 student does not usually pick up football because it is good
for their wellbeing. They must have the talent and ability to do so and it is unlikely that they can

Running head: ATHLETIC INVOLVEMENT AND ACADEMIC ACHIEVEMENT 34
just pick up a sport. Also, it does not make much reasonable sense for a typical student to begin
playing a sport, other than for the health benefits and possible intrinsic value. In this case, the
student would be more likely to simply participate in intramural athletics.
Comparison between the Number of In-Season Hours for Athletes and Number of Hours Worked
for Non-Athletes
The final statistical analysis is a comparison of two previous analyses. The debate is often
heard around sport management circles that college athletes must endure a difficult life due to
the time commitment that it takes to play college sports. The argument is also made at times that
college athlete’s GPAs suffer because of the large time commitment that sports involve. This
inevitability degrades into a conversation about whether college athletes should be paid.
Opponents of this line of sympathetic reasoning counter with the validity of all the regular
students who work jobs but do not get scholarships. It is often argued that it is just as hard for
them, if not harder than student-athletes have it. While this is certainly not the scope of this
report, it is a goal of this data analysis to shed light on the argument that collegiate student-
athletes have it much harder than the general, working student population and its consequent
effect on academic achievement.
Due to the nature of the questions asked within the survey and the subsequent coding of
the raw data, it is possible to draw a precise comparison between the GPAs of collegiate student-
athletes versus the GPA of non-athlete, working students. The amount of hours spent practicing
or playing a sport and the amount of hours spent working are able to be compared in a direct
manner.
With the comparison, only one category cannot be compared, the 0-4 hour category
(Appendix C, Chart 6). The reason for this is that there were no students from the general

Running head: ATHLETIC INVOLVEMENT AND ACADEMIC ACHIEVEMENT 35
population that reported working 0-4 hours in a typical week. This is not surprising as most jobs,
even part-time positions, require each employee to work more than just four hours in a week. It
is, however, unusual that seven student-athletes would respond that they only participate in
organized team activities 0-4 hours a week. Based on practices and games, this would seem to be
an impossibility. For these two reasons the 0-4 hour range will be excluded in the analysis.
An examination of the data shows an overwhelming trend. Among the eight work hour
categories examined, six (75%) of them saw working, non-athlete students have higher GPAs
than the in-season athletes. Within the two categories that athletes outperformed non-athletes, the
difference was not overly significant in either category. In the 20-24 hour range athletes’ GPA
was higher by 0.08 points and in the 40+ hour range the athletes’ GPA was higher by 0.03
points. The largest statistical different in any category came in the 30-35 hour range in which
working non-athletes reported a 0.64 point higher GPA.
This particular analysis appears to disprove the argument that student-athletes are
achieving higher GPAs than those non-athlete students who are working the same number of
hours. However, as was presented previously, one cannot overlook the possibility that these
results do not represent that being a student-athlete is tougher, but rather is more indicative of the
type of people that are athletes and the type of people that hold jobs while in college. It would
appear, however, that using the time commitment excuse to explain poor grades in student-
athletes is essentially, a subterfuge. Non-athlete students who are working the same number of
hours are able to achieve higher GPAs. Stress is present in every job whether the “job” is a sport
or it is an actual job that is utilized by a student to help support themselves during their college
education. Future studies may delve in a sport psychology direction by examining how job stress,
whether athletic or an actual job, affects academic achievement.

Running head: ATHLETIC INVOLVEMENT AND ACADEMIC ACHIEVEMENT 36
Another possibility that cannot be overlooked is that the self-reported in-season hours of
athletes may have been inaccurately reported. Most student-athletes know that in accordance
with NCAA regulations, they are not supposed to spend more than 20 hours a week involved in
team activities. Even though the surveys were completely anonymous, some athletes may have
still felt the need to put down what should be the right answer and not necessarily what the actual
answer was. To help alleviate privacy concerns an analysis of the number of in-season hours
worked by sport was not conducted. It is very possible that a student-athlete engaged in 30 hours
a week of team activities only put down 20 hours a week because he knew that answer was what
the NCAA would expect and would also keep his coach out of trouble. Because of this, the chart
may actually shift causing completely different results. The evidence for this possibility may be
the fact that the most common response for the amount of in-season hours was the 20-24 hour
range (n=15). This could be athletes putting down the ‘right’ answer or it simply could be an
accurate answer. It is also not unfeasible to think that coaches would use all of the 20 hours
allotted to them by NCAA each week. Therefore, there really is no way to truly know whether
the answers may be accurate or not.
Limitations
Although the researcher did the best that he could to eliminate limitations within the
study, some foreseen limitations were impossible to avoid and other limitations arose from
unforeseen circumstances. One limitation was the sample size. The sample was limited to
students who were enrolled in Sport Management courses, at only one institution, during only
one semester. Although a lot of athletes are enrolled in Sport Management courses, not all
athletes are and some sports went underrepresented in the study. Also, it is not unreasonable to

Running head: ATHLETIC INVOLVEMENT AND ACADEMIC ACHIEVEMENT 37
assume that most Sport Management students have some sort of certain commonality that caused
them to choose Sport Management classes.
Within the sample size limitation were two additional sample issues. The number of
respondents for each collegiate sport and race were limited. Within collegiate sports, there was a
smattering of respondents participating in various sports but some were not accounted for in the
data. As for race, there was a high amount of white and black survey respondents. Although not
unexpected as addressed previously, it still leads to other races being underrepresented in the
study, although not necessarily in a disproportional manner in comparison to general college
enrollment figures by race.
A limitation also presented itself in regards to athletes not knowing what constitutes as
team mandated activities. Athletes were asked to report the average number of hours per week
that they spent in mandated team activities. This issue was discovered when several athlete
participants asked for a clarification on what the preceding question specifically referred to.
Some athletes may think game travel is a mandatory team activity and should be counted to team
activity hours while others know that is actually inaccurate. In addition, some athletes may
participate in an activity such as film study, but are doing so in a voluntary manner. Coaches are
not requiring this film study session but players are participating in it anyways. Along these same
lines, although an activity may be labeled as voluntary by a coach, in reality, the coach is
coercing the player to participate in the voluntary activity. Whether or not a player reports these
typed of hours as mandated or voluntary will differ from athlete to athlete.
Along the lines of the previous paragraph, athletes may not be reporting accurate hours
on purpose or because of negligence. An athlete may simply not know how many hours they

Running head: ATHLETIC INVOLVEMENT AND ACADEMIC ACHIEVEMENT 38
participate in mandated team activities a week therefore they guessed the hours in what may be a
horribly inaccurate manner. On the other hand, many athletes know that they are only supposed
to be required to engage in 20 hours of mandated team activities each week. While the athlete
may actually be engaging in more than 20 hours per week of mandated team activities, they
know what the correct answer should be, regardless of whether or not it is the actual answer. It is
not unreasonable to assume that an athlete engaging in 30 hours per week of mandated team
activities would report only 20 hours per week to keep his coach from getting in trouble.
Similar to the issues with athletes self-reporting their mandated in-season hours, working
non-athletes may not actually know how many hours per week they are working. Although this is
less likely to occur than an athlete not knowing their mandated in-season hours, it still occurs. It
is likely that a survey respondent simply gave a rough guess at the number of hours they work
per week and the actual number may be quite different.
One limitation that was planned for was students not looking up their GPA. Since it
would violate the privacy of the survey participants to validate self-reported GPAs, it was not
possible to confirm GPA answers. All of the GPA answers were self-reported. Detailed
instruction were given on the survey itself (Appendix D) that guided students in a step by step
process to obtain their actual, current GPA. However, since most surveys were completed more
quickly than expected and during class time, it is reasonable to assume that a good number of
self-reported GPAs were approximations and not completely accurate.
Students who participated on multiple intercollegiate athletic teams provided a potential
problem and limitation. Since SPSS cannot analyze strings of data, students who participated in
more than one intercollegiate sport would only be able to have one sport counted without a

Running head: ATHLETIC INVOLVEMENT AND ACADEMIC ACHIEVEMENT 39
drastic and extensive restructuring of the analysis format. This only ended up being a limitation
for one survey participant. Since the survey participant participated in both Track and Field and
Cross Country and was the only respondent to indicate intercollegiate participation in Cross
Country, Cross Country was grouped together with Track and Field within the recoding process.
Originally each intramural sport was individually coded and entered into the SPSS
program. However, due to SPSS’s inability to analyze strings of data, the researcher was left
with only two options. The first option was to create a separate column in SPSS for every single
intramural sport participated in and then use a sort feature to run analysis for each column, one at
a time. Although this was physically possible, do the time constraints of this study, it was not a
realistic possibility. The second option was to simply group all intramural sports together. After
consulting with a committee member, a researcher advisor, and an SPSS expert, it was
determined that this was the best course of action given the situation.
Some students did not realize that the survey was front and back despite being told so.
This led to several surveys only being completed on the first page and not the second. While
most of the second page was simply assessment data for the researcher, the question that asked
students to report their GPA was also on the back.
An additional limitation is in regards to non-specific answers. While it can be argued that
a answer that conveys imprecise knowledge of a statistic is better than a rough approximation,
this still led to undefined answers. Some examples of this were responses such as “a lot” or “all
week” in which non-numeric answers were given to questions that asked for a numeric response.
In this case, those particular answers were thrown out rather than trying to assign a numerical
value to an inexact qualitative answer.

Running head: ATHLETIC INVOLVEMENT AND ACADEMIC ACHIEVEMENT 40
The final limitation was that of the background of the researcher himself and the process
by which the thesis proposal, process, research, writing, and defense were conducted. As this is
the first major research project that the researcher had conducted, flaws conducting the
methodology, statistical analysis, and conclusions could be expected. This was amplified by a
number of different factors. The first was a lack of education and available resources regarding
use of the SPSS Program and statistical analysis procedures and conclusions. While all attempts
were earnestly made in trying to validate all of the data, methodology, and conclusions, it is the
opinion of the researcher that this is certainly not the most structurally rigorous and sound study.
The second is involving the process. As the researcher was the first student to go through the
graduate program and consequently the first to conduct a thesis study, no guidelines or
expectations were in place. Several times steps in the research process were skipped or
performed incorrectly due to not knowing the process. This may have compromised the data
collection and analysis phases. It is the opinion of the researcher that although the study and
thesis are fairly solid, there are certainly areas of improvement that are apparent and minor flaws
that might be found upon stringent examination of the thesis study.
Conclusion
After analyzing the data several conclusions can be made regarding the initial hypotheses
made. Hypothesis 1 proved to be true. Although previous studies have found that middle and
high school athletes perform better than their non-athlete peers, collegiate athlete within sport
management did not perform better than non-athlete peers in regards to self-reported GPAs.
Hypothesis 2 proved to be partly correctly. While it was anticipated that football and men’s
basketball players would have the lowest GPAs and female soccer players would have the
highest, wrestling and football actually had the worst and Men’s Soccer, not Women’s Soccer,

Running head: ATHLETIC INVOLVEMENT AND ACADEMIC ACHIEVEMENT 41
had the highest self-reported GPAs. Men’s Basketball was just 0.09 points away from the bottom
and Women’s Soccer had the second highest self-reported GPAs. Hypothesis 3 proved to be
inclusive. Although, when looking at the specific numbers, working non-athletes had higher
GPAs than athletes when it came to time commitment grouping in six of the eight time
comparison categories, the results are not statistically significant. Overall, there appears to be
credence to this hypothesis when compared against the data analyses, yet the results are simply
insignificant. It can be said that based on the research conducted in this study, the main idea of
the number of occupied or working hours among non-athlete students is not a determining factor
in regards to academic achievement, more specifically GPA. The statistical insignificant results
of the ANOVAs surrounding this hypothesis could lead to a potential area of future research to
confirm these findings.
Future Studies
Although it is the opinion of the researcher that the data analysis was most certainly
comprehensive concerning the topic and the raw data, there are undoubtedly areas that future
research can explore. The first potential area of research would be surrounding Hypothesis #3.
The ANOVAs returned statistically insignificant results, despite the presuppositions and
hypothesis of the researcher. A study of similar nature, replicating the used methodology would
help to confirm or dispute these findings.
As mentioned previously, sport psychologists may be able to create a study based on the
affect stress levels have on academic achievement in athletes versus non-athletes. Another
possible research area might involve looking more extensively into the backgrounds of student-
athletes and working non-athlete students to find out if work or time management skills are
really having no effect on GPA and rather it is simply the type of students and their background

Running head: ATHLETIC INVOLVEMENT AND ACADEMIC ACHIEVEMENT 42
that determine their future academic success. Another research possibility is to conduct this same
study but on a much larger scale. This current study was only able to look at individuals enrolled
in one department’s courses at one institution during only one semester. While the sample size
was fairly large, it could benefit from expanding to other departments, other universities, and
over a bit more of an expanded time period.

Running head: ATHLETIC INVOLVEMENT AND ACADEMIC ACHIEVEMENT 43
References
American Sports Institute. (1995). Promoting achievement in school through sport: Three-year
impact study and summary report covering data from 1991-92, 1992-93, and 1993-94
school years.
Brand, M. (2007). Yeah, but facts show student-athletes outperform in class. NCAA News, 44(1),
2.
Byrd, C. E., & Ross, S. M. (1991). The influence of participation in junior high athletics on
students' attitudes and grades. Physical Educator, 48(4), 170-177.
Dilley-Knoles, J., Burnett, J. S., & Peak, K. W. (2010). Making the grade: Academic success in
today's athlete. The Sport Journal, 13(1).
Fabio, M. (2010). Definition of GPA. Retrieved June 20, 2010, from
http://lawschool.about.com/od/glossary/g/gpa.htm
Foltz, R. A. (1992). Academic achievement of student-athletes. Fort Hays State University, KS.
Fox, C. K., Barr-Anderson, D., Neumark-Sztainer, D., & Wall, M. (2010). Physical activity and
sports team participation: Associations with academic outcomes in middle school and
high school students. Journal of School Health, 80(1), 31-58.
Gall, J. P., Gall, M. D., & Borg, W. R. (2005). Applying educational research: A practical guide
(5th ed.). Boston: Pearson Education.
Greenberg, S. (2008). It isn't all about the games at this time of year. Sporting News, 232(50), 38.
Jones, J. (2011). Stats: One-Way ANOVA. Retrieved April 29, 2011, from
http://people.richland.edu/james/lecture/m170/ch13-1wy.html
Lapchick, R. E. (1989). Pass to play: Student athletes and academics. (pp. 51): National
Education Association.

Running head: ATHLETIC INVOLVEMENT AND ACADEMIC ACHIEVEMENT 44
Lewin, T. (2006, July 12). A more nuanced look at men, women, and college, New York Times.
Marsh, H. W. (2003). School athletic participation:mostly gain with little pain. Journal of Sport
& Exercise Psychology, 25(2), 205-228.
MathWorks. (2011). One-Way ANOVA. Retrieved May 2, 2011, from
http://www.mathworks.com/help/toolbox/stats/bqttcvf.html;jsessionid=bCnqNHRG4k6V
ylGh6Tc2nSTFln2Szv79QNdg9nCQ80vpBc31421T!-1586862780
Miller, K., Melnick, M., Barnes, G., Farrell, M., & Sabo, D. (2005). Untangling the links among
athletic involvement, gender, race, and adolescent academic outcomes. Sociology of Sport
Journal, 22(2), 178-204.
Motulsky, H. (1999). Analyzing Data with GraphPad Prism. San Diego, CA: GraphPad
Software Inc.
National Institute of Standards and Technology. (2010). NIST/SEMATECH e-Handbook of
Statistical Methods. Retrieved from http://www.itl.nist.gov/div898/handbook/index.htm
Slear, T. (2005). From pool to school: how strong is the connection? Splash, 13(1), 18-21.
United States Government. (2006). College enrollment, by sex, age, race, and hispanic origin
Current Population Reports.
United States Government. (2011). 2010 Census. Retrieved Feb 16, 2011, from
http://2010.census.gov/2010census/

Running head: ATHLETIC INVOLVEMENT AND ACADEMIC ACHIEVEMENT 45
Auxiliary Resources
American Sports Institute. (1995). Promoting achievement in school through sport: Three-year
impact study and summary report covering data from 1991-92, 1992-93, and 1993-94
school years.
Brand, M. (2007). Yeah, but facts show student-athletes outperform in class. NCAA News, 44(1),
2.
Brunner, J. F. (2003). Women and minority recruitment and retention policies and procedures of
graduate sport management and related educational programs. University of Oregon,
Eugene, OR. SPORTDiscus database.
Byrd, C. E., & Ross, S. M. (1991). The influence of participation in junior high athletics on
students' attitudes and grades. Physical Educator, 48(4), 170-177.
Dilley-Knoles, J., Burnett, J. S., & Peak, K. W. (2010). Making the grade: Academic success in
today's athlete. The Sport Journal, 13(1).
Fabio, M. (2010). Definition of GPA Retrieved June 20, 2010, from
http://lawschool.about.com/od/glossary/g/gpa.htm
Foltz, R. A. (1992). Academic achievement of student-athletes. Fort Hays State University, KS.
Fox, C. K., Barr-Anderson, D., Neumark-Sztainer, D., & Wall, M. (2010). Physical activity and
sports team participation: Associations with academic outcomes in middle school and
high school students. Journal of School Health, 80(1), 31-58.
Gall, J. P., Gall, M. D., & Borg, W. R. (2005). Applying educational research: A practical guide
(5th ed.). Boston: Pearson Education.
Greenberg, S. (2008). It isn't all about the games at this time of year. Sporting News, 232(50), 38.

Running head: ATHLETIC INVOLVEMENT AND ACADEMIC ACHIEVEMENT 46
Jones, J. (2011). Stats: One-Way ANOVA Retrieved April 29, 2011, from
http://people.richland.edu/james/lecture/m170/ch13-1wy.html
Lapchick, R. E. (1989). Pass to play: Student athletes and academics. (pp. 51): National
Education Association.
Lewin, T. (2006, July 12). A more nuanced look at men, women, and college, New York Times.
Marsh, H. W. (2003). School athletic participation:mostly gain with little pain. Journal of Sport
& Exercise Psychology, 25(2), 205-228.
MathWorks. (2011). One-Way ANOVA Retrieved May 2, 2011, from
http://www.mathworks.com/help/toolbox/stats/bqttcvf.html;jsessionid=bCnqNHRG4k6V
ylGh6Tc2nSTFln2Szv79QNdg9nCQ80vpBc31421T!-1586862780
Miller, K., Melnick, M., Barnes, G., Farrell, M., & Sabo, D. (2005). Untangling the links among
athletic involvement, gender, race, and adolescent academic outcomes. Sociology of Sport
Journal, 22(2), 178-204.
Motulsky, H. (1999). Analyzing Data with GraphPad Prism. San Diego, CA: GraphPad
Software Inc.
National Institute of Standards and Technology. (2010). NIST/SEMATECH e-Handbook of
Statistical Methods Retrieved from http://www.itl.nist.gov/div898/handbook/index.htm
Slear, T. (2005). From pool to school: how strong is the connection? Splash, 13(1), 18-21.
Twaro, C. (2009). Take five: Soccer post nation's best GPA for fifth straight year Retrieved May
17, 2011, from
http://www.cmuchippewas.com/ViewArticle.dbml?DB_OEM_ID=10500&ATCLID=204
846573

Running head: ATHLETIC INVOLVEMENT AND ACADEMIC ACHIEVEMENT 47
United States Government. (2006). College Enrollment, by Sex, Age, Race, and Hispanic Origin
Current Population Reports.
United States Government. (2011). 2010 Census Retrieved Feb 16, 2011, from
http://2010.census.gov/2010census/
Woods, R. (2006). Social issues in sports (1st ed.): Human Kinetics.

Running head: ATHLETIC INVOLVEMENT AND ACADEMIC ACHIEVEMENT 48
Appendix A – Demographic Data and Correlations
Table 1
Gender
Frequency Percent Valid Percent
Cumulative
Percent
Valid Male 183 83.2 84.7 84.7
Female 33 15.0 15.3 100.0
Total 216 98.2 100.0
Missing System 4 1.8
Total 220 100.0
Chart 1
Table 2
Gender
Male
Female
No Response

Running head: ATHLETIC INVOLVEMENT AND ACADEMIC ACHIEVEMENT 49
One-Sample Test
Test Value = 0
t df Sig. (2-tailed) Mean Difference
95% Confidence Interval of the
Difference
Lower Upper
Gender 6.227 215 .000 .153 .10 .20
GPA 69.031 201 .000 2.8798515 2.797590 2.962113
Table 3
Race
Frequency Percent Valid Percent
Cumulative
Percent
Valid White 168 76.4 77.8 77.8
Black 35 15.9 16.2 94.0
Indian 1 .5 .5 94.4
Hawaiian 2 .9 .9 95.4
Hispanic 5 2.3 2.3 97.7
Asian 2 .9 .9 98.6
Other 3 1.4 1.4 100.0
Total 216 98.2 100.0
Missing System 4 1.8
Total 220 100.0
Chart 2

Running head: ATHLETIC INVOLVEMENT AND ACADEMIC ACHIEVEMENT 50
Table 4
Race * Gender Crosstabulation
Count
Gender
Total Male Female
Race White 138 27 165
Black 30 5 35
Indian 1 0 1
Hawaiian 2 0 2
Hispanic 4 1 5
Asian 2 0 2
Other 3 0 3
Total 180 33 213
Table 5
Race
White
Black
Hispanic
Native Hawaiian orPacific Islander
Asian

Running head: ATHLETIC INVOLVEMENT AND ACADEMIC ACHIEVEMENT 51
One-Sample Test
Test Value = 0
t df Sig. (2-tailed) Mean Difference
95% Confidence Interval of the
Difference
Lower Upper
Race 5.667 215 .000 .421 .27 .57
GPA 69.031 201 .000 2.8798515 2.797590 2.962113
Table 6
Age
Frequency Percent Valid Percent
Cumulative
Percent
Valid 17 1 .5 .5 .5
18 20 9.1 9.2 9.6
19 40 18.2 18.3 28.0
20 50 22.7 22.9 50.9
21 49 22.3 22.5 73.4
22 35 15.9 16.1 89.4
23 14 6.4 6.4 95.9
24 6 2.7 2.8 98.6
25 2 .9 .9 99.5
30 1 .5 .5 100.0
Total 218 99.1 100.0
Missing System 2 .9
Total 220 100.0

Running head: ATHLETIC INVOLVEMENT AND ACADEMIC ACHIEVEMENT 52
Table 7
State Participants and GPAs
GPA
N Mean Std. Deviation Std. Error
95% Confidence Interval for Mean
Minimum Maximum Lower Bound Upper Bound
AZ 1 2.000000 . . . . 2.0000 2.0000
CA 3 3.036667 .5701169 .3291572 1.620418 4.452916 2.4000 3.5000
CO 1 3.400000 . . . . 3.4000 3.4000
CT 1 3.940000 . . . . 3.9400 3.9400
DC 1 2.000000 . . . . 2.0000 2.0000
FL 13 2.726923 .7025594 .1948549 2.302371 3.151475 1.0000 3.6000
GA 3 2.500000 .0000000 .0000000 2.500000 2.500000 2.5000 2.5000
IL 2 3.025000 .3181981 .2250000 .166104 5.883896 2.8000 3.2500
IN 3 2.956667 1.0351006 .5976156 .385334 5.527999 1.9300 4.0000
KY 2 3.600000 .5656854 .4000000 -1.482482 8.682482 3.2000 4.0000
MA 3 3.066667 .8621678 .4977728 .924923 5.208410 2.3000 4.0000
MD 17 2.921765 .5539092 .1343427 2.636971 3.206559 1.8600 3.9600
ME 1 1.720000 . . . . 1.7200 1.7200
MI 5 3.278000 .5185750 .2319138 2.634104 3.921896 2.5000 3.8000
MO 1 3.000000 . . . . 3.0000 3.0000
NC 24 2.775833 .5605193 .1144155 2.539147 3.012520 1.0000 3.6700
NJ 5 2.442000 .4817883 .2154623 1.843781 3.040219 1.8800 3.0000
NY 11 3.063636 .5311548 .1601492 2.706802 3.420471 2.0000 4.0000
OH 5 3.050000 .4401136 .1968248 2.503527 3.596473 2.3300 3.5000
Ontario 4 2.687500 .2796873 .1398437 2.242455 3.132545 2.3200 2.9800
PA 14 3.045000 .6035249 .1612988 2.696535 3.393465 2.1200 4.0000
Saskatchewan 1 2.650000 . . . . 2.6500 2.6500
SC 1 2.630000 . . . . 2.6300 2.6300
South Africa 1 3.100000 . . . . 3.1000 3.1000
TN 2 2.700000 .2828427 .2000000 .158759 5.241241 2.5000 2.9000
Trinidad &
Tobago
1 3.500000 . . . . 3.5000 3.5000
TX 5 2.996000 .7463779 .3337904 2.069249 3.922751 2.2800 3.9000
VA 65 2.846615 .5999044 .0744090 2.697966 2.995264 1.0000 4.0000
WI 1 2.820000 . . . . 2.8200 2.8200
WV 1 3.800000 . . . . 3.8000 3.8000
WA 2 3.130000 .6081118 .4300000 -2.333668 8.593668 2.7000 3.5600
Total 20
0
2.884150 .5937939 .0419876 2.801352 2.966948 1.0000 4.0000
Table 8

Running head: ATHLETIC INVOLVEMENT AND ACADEMIC ACHIEVEMENT 53
Academic Rank
Frequency Percent Valid Percent
Cumulative
Percent
Valid Freshman 48 21.8 21.9 21.9
Sophomore 44 20.0 20.1 42.0
Junior 51 23.2 23.3 65.3
Senior 76 34.5 34.7 100.0
Total 219 99.5 100.0
Missing System 1 .5
Total 220 100.0
Chart 3
Academic Rank
Freshman
Sophomore
Junior
Senior

Running head: ATHLETIC INVOLVEMENT AND ACADEMIC ACHIEVEMENT 54
Appendix B – Activities, Race, and Gender Considerations
Table 1
College Sports
Frequency Percent Valid Percent
Cumulative
Percent
Valid Band 3 1.4 1.9 1.9
Baseball 6 2.7 3.7 5.6
Men’s Soccer 2 .9 1.2 6.8
Club Women’s Crew 2 .9 1.2 8.0
Club Field Hockey 1 .5 .6 8.6
Club Men’s Crew 1 .5 .6 9.3
Club Men’s Lacrosse 1 .5 .6 9.9
Club Men’s Hockey 8 3.6 4.9 14.8
Club Men’s Volleyball 2 .9 1.2 16.0
Club Paintball 1 .5 .6 16.7
Club Men’s Soccer 1 .5 .6 17.3
Club Women’s Soccer 1 .5 .6 17.9
Club Women’s Hockey 2 .9 1.2 19.1
DIII Football 1 .5 .6 19.8
DIII Women’s Soccer 1 .5 .6 20.4
DIII Men’s Soccer 1 .5 .6 21.0
DII Men’s Soccer 1 .5 .6 21.6
Football 23 10.4 14.2 35.8
Golf 1 .5 .6 36.4
Men’s Basketball 4 1.8 2.5 38.9
Student Managers 7 3.2 4.3 43.8
Softball 1 .5 .6 44.4
Track and Field / CC 1 .5 .6 45.1
Women’s Basketball 3 1.4 1.9 46.9
Women’s Lacrosse 4 1.8 2.5 49.4
Women’s Soccer 3 1.4 1.9 51.2
Wrestling 2 .9 1.2 52.5
Intramurals 76 34.4 46.9 100.0
Total 160 73.3 100.0
Missing System 59 26.7
Total 219 100.0

Running head: ATHLETIC INVOLVEMENT AND ACADEMIC ACHIEVEMENT 55
Table 2
Job
Frequency Percent Valid Percent
Cumulative
Percent
Valid Yes 66 30.0 30.0 30.0
No 115 52.3 52.3 82.3
Seasonal 39 17.7 17.7 100.0
Total 220 100.0 100.0
Chart 1
Student Job Situation
Yes
No
Seasonal

Running head: ATHLETIC INVOLVEMENT AND ACADEMIC ACHIEVEMENT 56
Table 3
# of Jobs
Frequency Percent Valid Percent
Cumulative
Percent
Valid 1 54 24.5 77.1 77.1
2 15 6.8 21.4 98.6
3 1 .5 1.4 100.0
Total 70 31.8 100.0
Missing System 150 68.2
Total 220 100.0
Table 4
Statistics
GPA
N Valid 202
Missing 18
Mean 2.879851
Median 2.890000
Std. Deviation .5929264
Range 3.0000
Minimum 1.0000
Maximum 4.0000
Percentiles 25 2.500000
50 2.890000
75 3.235000

Running head: ATHLETIC INVOLVEMENT AND ACADEMIC ACHIEVEMENT 57
Table 5
Race
GPA
N Mean Std. Deviation Std. Error
95% Confidence Interval for Mean
Minimum Maximum Lower Bound Upper Bound
White 156 2.930705 .5804649 .0464744 2.838900 3.022510 1.0000 4.0000
Black 32 2.673750 .5178974 .0915522 2.487028 2.860472 1.5600 3.9000
Hawaiian 2 2.800000 .4242641 .3000000 -1.011861 6.611861 2.5000 3.1000
Hispanic 5 2.980000 1.2070626 .5398148 1.481234 4.478766 1.0000 4.0000
Asian 2 2.350000 .2121320 .1500000 .444069 4.255931 2.2000 2.5000
Other 2 2.200000 .2828427 .2000000 -.341241 4.741241 2.0000 2.4000
Total 199 2.876131 .5945125 .0421439 2.793022 2.959239 1.0000 4.0000
Chart 2
2
2.2
2.4
2.6
2.8
3
White Black Indian Hawaiian Asian Other
Race
GPA

Running head: ATHLETIC INVOLVEMENT AND ACADEMIC ACHIEVEMENT 58
Table 6
Gender
GPA t-test
N Mean Std. Deviation Std. Error
95% Confidence Interval for Mean
Minimum Maximum Lower Bound Upper Bound
Males 166 2.845241 .6021041 .0467323 2.752970 2.937511 1.0000 4.0000
Females 32 3.038125 .5217924 .0922407 2.849999 3.226251 1.8600 4.0000
Total 198 2.876414 .5929182 .0421369 2.793317 2.959511 1.0000 4.0000
Chart 3
2.7
2.75
2.8
2.85
2.9
2.95
3
3.05
3.1
Male Female
Gender
GPA

Running head: ATHLETIC INVOLVEMENT AND ACADEMIC ACHIEVEMENT 59
Appendix C – Sports, Involvement Hours, and GPA
Table 1
GPA by Sport
GPA
N Mean
Std.
Deviation Std. Error
95% Confidence Interval for Mean
Minimum Maximum Lower Bound Upper Bound
Band 3 2.516667 .4186088 .2416839 1.476785 3.556549 2.2700 3.0000
Baseball 6 2.963333 .6445050 .2631181 2.286967 3.639700 2.3000 3.6700
Men’s Soccer 2 3.500000 .0000000 .0000000 3.500000 3.500000 3.5000 3.5000
Club Women’s Crew 2 2.565000 .7566043 .5350000 -4.232820 9.362820 2.0300 3.1000
Club Field Hockey 1 3.500000 . . . . 3.5000 3.5000
Club Men’s Crew 1 3.250000 . . . . 3.2500 3.2500
Club Men’s Lacrosse 1 1.930000 . . . . 1.9300 1.9300
Club Men’s Hockey 6 2.500000 .7848567 .3204164 1.676343 3.323657 1.0000 3.2000
Club Men’s Volleyball 2 2.700000 .4242641 .3000000 -1.111861 6.511861 2.4000 3.0000
Club Paintball 1 2.560000 . . . . 2.5600 2.5600
Club Men’s Soccer 1 4.000000 . . . . 4.0000 4.0000
Club Women’s Soccer 1 2.980000 . . . . 2.9800 2.9800
Club Women’s Hockey 2 2.485000 .2333452 .1650000 .388476 4.581524 2.3200 2.6500
DIII Football 1 2.820000 . . . . 2.8200 2.8200
DIII Women’s Soccer 1 3.940000 . . . . 3.9400 3.9400
DIII Men’s Soccer 1 3.700000 . . . . 3.7000 3.7000
DII Men’s Soccer 1 2.880000 . . . . 2.8800 2.8800
Football 19 2.734737 .5098842 .1169755 2.488981 2.980493 2.0000 4.0000
Golf 1 2.660000 . . . . 2.6600 2.6600
Men’s Basketball 4 2.875000 .8539126 .4269563 1.516235 4.233765 2.0000 4.0000
Student Manager 6 2.986667 .3612017 .1474600 2.607609 3.365725 2.5000 3.5000
Softball 1 2.860000 . . . . 2.8600 2.8600
Track and Field / CC 1 3.210000 . . . . 3.2100 3.2100
Women’s Basketball 3 3.143333 .3855299 .2225858 2.185624 4.101043 2.8500 3.5800
Women’s Lacrosse 4 3.000000 .5099020 .2549510 2.188632 3.811368 2.5000 3.7000
Women’s Soccer 3 3.176667 .8352445 .4822286 1.101804 5.251529 2.3300 4.0000
Wrestling 2 2.000000 .1697056 .1200000 .475255 3.524745 1.8800 2.1200
Intramural Sports 73 2.980000 .6023611 .0705010 2.839459 3.120541 1.0000 4.0000
Total 150 2.913333 .5962226 .0486814 2.817138 3.009528 1.0000 4.0000
Chart 1

Running head: ATHLETIC INVOLVEMENT AND ACADEMIC ACHIEVEMENT 60
0
0.5
1
1.5
2
2.5
3
3.5
4
Ban
d
Bas
ebal
l
Men
’s S
occ
er
Clu
b W
om
en’s
Cre
w
Clu
b F
ield
Ho
ckey
Clu
b M
en’s
Cre
w
Clu
b M
en’s
Lac
ross
e
Clu
b M
en’s
Ho
ckey
Clu
b M
en’s
Vo
lleyb
all
Clu
b P
ain
tbal
l
Clu
b M
en’s
So
ccer
Clu
b W
om
en’s
So
ccer
Clu
b W
om
en’s
Ho
ckey
DII
I Fo
otb
all
DII
I Wo
men
’s S
occ
er
DII
I Men
’s S
occ
er
DII
Men
’s S
occ
er
Foo
tbal
l
Go
lf
Men
’s B
aske
tbal
l
Stu
den
t M
anag
er
Soft
bal
l
Trac
k an
d F
ield
/ C
C
Wo
men
’s B
aske
tbal
l
Wo
men
’s L
acro
sse
Wo
men
’s S
occ
er
Wre
stlin
g
Intr
amu
ral S
po
rts
College Sports
GPA
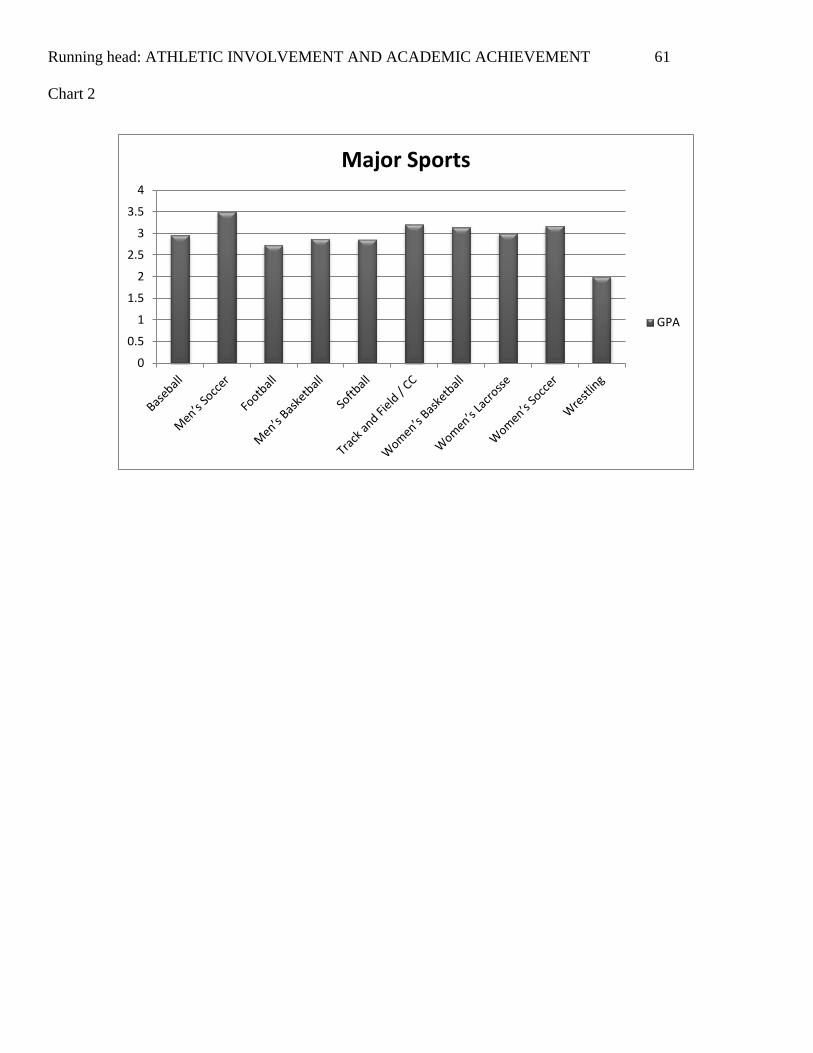
Running head: ATHLETIC INVOLVEMENT AND ACADEMIC ACHIEVEMENT 61
Chart 2
0
0.5
1
1.5
2
2.5
3
3.5
4
Major Sports
GPA

Running head: ATHLETIC INVOLVEMENT AND ACADEMIC ACHIEVEMENT 62
Table 2
GPA by In-Season Hours
GPA among Athletes
N Mean Std. Deviation Std. Error
95% Confidence Interval for Mean
Minimum Maximum Lower Bound Upper Bound
0 – 4 Hours
5 – 9 Hours
7
3
3.232857
2.576667
.5538265
.3682843
.2093267
.2126290
2.720653
1.661798
3.745061
3.491536
2.2700
2.3300
3.9400
3.0000
10 – 14 Hours 8 2.308750 .7132509 .2521723 1.712457 2.905043 1.0000 3.2000
15 – 19 Hours 8 2.920000 .4675468 .1653028 2.529121 3.310879 2.3200 3.7000
20 – 24 Hours 15 3.004667 .6013303 .1552628 2.671661 3.337672 2.1500 4.0000
25 – 29 Hours 9 2.971111 .3816230 .1272077 2.677770 3.264453 2.4000 3.6700
30 – 35 Hours 7 2.997143 .4115707 .1555591 2.616503 3.377782 2.5000 3.5800
35 – 39 Hours 2 2.250000 .3535534 .2500000 -.926551 5.426551 2.0000 2.5000
40+ Hours 6 2.596667 .5911571 .2413389 1.976285 3.217048 2.0000 3.4000
Total 65 2.847077 .5822766 .0722225 2.702796 2.991358 1.0000 4.0000
Table 3
Test of Homogeneity of Variances for In-Season
Hours
GPA
Levene Statistic df1 df2 Sig.
.533 8 130 .830
Table 4
ANOVA for In-Season Hours
GPA
Sum of Squares df Mean Square F Sig.
Between Groups (Combined) 3.523 8 .440 1.229 .287
Linear Term Weighted .566 1 .566 1.580 .211
Deviation 2.957 7 .422 1.179 .319
Within Groups 46.563 130 .358
Total 50.086 138
Chart 3

Running head: ATHLETIC INVOLVEMENT AND ACADEMIC ACHIEVEMENT 63
Table 5
Statistics
# Hours
N Valid 66
Missing 155
Mean 23.08
Median 20.00
0
0.5
1
1.5
2
2.5
3
3.5
0 – 4 Hours
5 – 9 Hours
10 – 14 Hours
15 – 19 Hours
20 – 24 Hours
25 – 29 Hours
30 – 35 Hours
35 – 39 Hours
40+Hours
In-Season Hours for Athletes
GPA

Running head: ATHLETIC INVOLVEMENT AND ACADEMIC ACHIEVEMENT 64
Table 6
GPA by Number of Jobs
GPA
N Mean Std. Deviation Std. Error
95% Confidence Interval for Mean
Minimum Maximum Lower Bound Upper Bound
0 137 2.852847 .5802205 .0495716 2.754816 2.950878 1.0000 4.0000
1 49 2.897959 .6262720 .0894674 2.718073 3.077845 1.0000 4.0000
2 15 3.086000 .6106530 .1576699 2.747832 3.424168 2.3600 4.0000
3 1 2.600000 . . . . 2.6000 2.6000
Total 202 2.879851 .5929264 .0417182 2.797590 2.962113 1.0000 4.0000
Table 7
Test of Homogeneity of Variances for Number of
Jobs
GPA
Levene Statistic df1 df2 Sig.
.437a 2 198 .647
Groups with only one case are ignored in computing
the test of homogeneity of variance for GPA.
Table 8
ANOVA for Number of Jobs
GPA
Sum of Squares df Mean Square F Sig.
Between Groups (Combined) .832 3 .277 .786 .503
Linear Term Unweighted .036 1 .036 .101 .751
Weighted .458 1 .458 1.300 .256
Deviation .373 2 .187 .529 .590
Within Groups 69.832 198 .353
Total 70.664 201
Chart 4

Running head: ATHLETIC INVOLVEMENT AND ACADEMIC ACHIEVEMENT 65
2.3
2.4
2.5
2.6
2.7
2.8
2.9
3
3.1
3.2
0 Jobs 1 Job 2 Jobs 3 Jobs
Number of Jobs
GPA
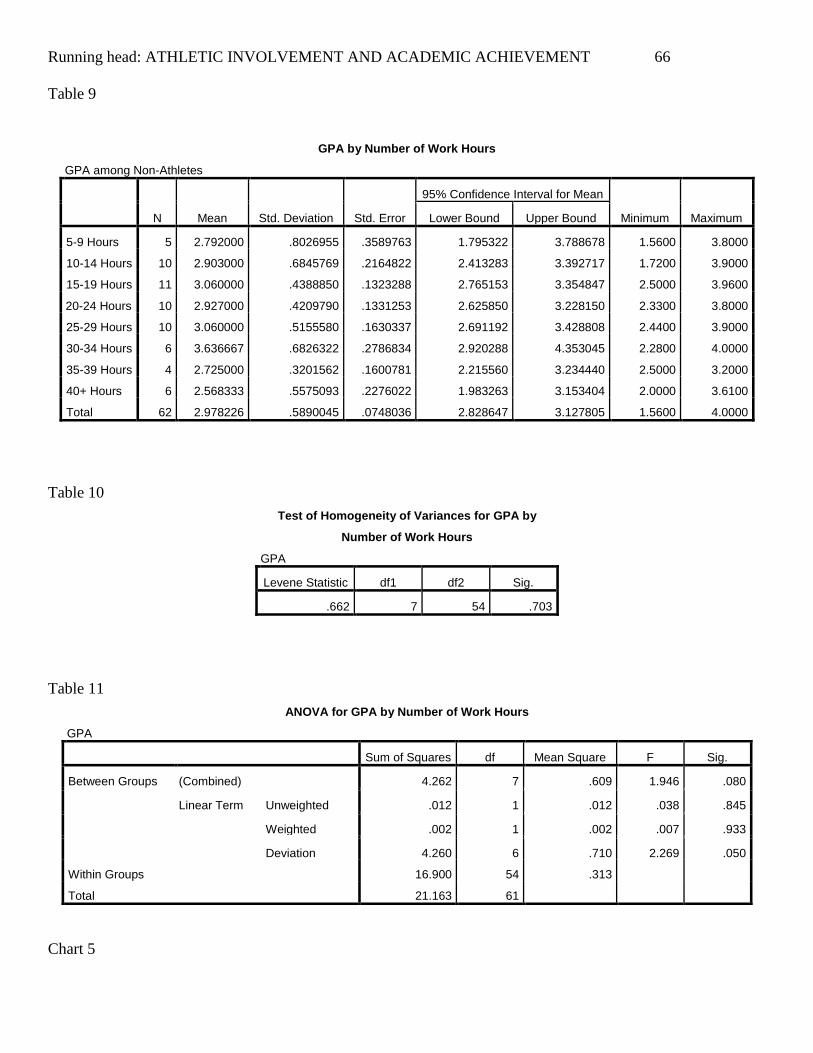
Running head: ATHLETIC INVOLVEMENT AND ACADEMIC ACHIEVEMENT 66
Table 9
GPA by Number of Work Hours
GPA among Non-Athletes
N Mean Std. Deviation Std. Error
95% Confidence Interval for Mean
Minimum Maximum Lower Bound Upper Bound
5-9 Hours 5 2.792000 .8026955 .3589763 1.795322 3.788678 1.5600 3.8000
10-14 Hours 10 2.903000 .6845769 .2164822 2.413283 3.392717 1.7200 3.9000
15-19 Hours 11 3.060000 .4388850 .1323288 2.765153 3.354847 2.5000 3.9600
20-24 Hours 10 2.927000 .4209790 .1331253 2.625850 3.228150 2.3300 3.8000
25-29 Hours 10 3.060000 .5155580 .1630337 2.691192 3.428808 2.4400 3.9000
30-34 Hours 6 3.636667 .6826322 .2786834 2.920288 4.353045 2.2800 4.0000
35-39 Hours 4 2.725000 .3201562 .1600781 2.215560 3.234440 2.5000 3.2000
40+ Hours 6 2.568333 .5575093 .2276022 1.983263 3.153404 2.0000 3.6100
Total 62 2.978226 .5890045 .0748036 2.828647 3.127805 1.5600 4.0000
Table 10
Test of Homogeneity of Variances for GPA by
Number of Work Hours
GPA
Levene Statistic df1 df2 Sig.
.662 7 54 .703
Table 11
ANOVA for GPA by Number of Work Hours
GPA
Sum of Squares df Mean Square F Sig.
Between Groups (Combined) 4.262 7 .609 1.946 .080
Linear Term Unweighted .012 1 .012 .038 .845
Weighted .002 1 .002 .007 .933
Deviation 4.260 6 .710 2.269 .050
Within Groups 16.900 54 .313
Total 21.163 61
Chart 5

Running head: ATHLETIC INVOLVEMENT AND ACADEMIC ACHIEVEMENT 67
0
0.5
1
1.5
2
2.5
3
3.5
4
5-9 Hours 10-14Hours
15-19Hours
20-24Hours
25-29Hours
30-34Hours
35-39Hours
40+ Hours
Work Hours
GPA

Running head: ATHLETIC INVOLVEMENT AND ACADEMIC ACHIEVEMENT 68
Chart 6
0
0.5
1
1.5
2
2.5
3
3.5
4
0 – 4 Hours
5 – 9 Hours
10 – 14 Hours
15 – 19 Hours
20 – 24 Hours
25 – 29 Hours
30 – 35 Hours
35 – 39 Hours
40+Hours
Athletes
Non-Athletes

Running head: ATHLETIC INVOLVEMENT AND ACADEMIC ACHIEVEMENT 69
Appendix D – Survey Questions

Running head: ATHLETIC INVOLVEMENT AND ACADEMIC ACHIEVEMENT 70
Age:____________
Gender:
□Male □Female
Race:
□White
□Black or African American
□American Indian or Alaska Native
□Other
□Native Hawaiian or Pacific Islander
□Hispanic
□Asian
Major:____________________________________________
Minor:____________________________________________
Home State:____________________________
What is your academic rank (Freshman, Sophomore, Junior, Senior)?__________________________________________
What is your absolute favorite sports team (college, amateur, or professional)?__________________________________
Did you participate in athletics or extracurricular activities in High School? Yes No
If yes, what sport(s) or extracurricular activities did you play or participate in and how many years for each?
(during high school only)_______________________________________________________________________
___________________________________________________________________________________________
Did/Do you currently participate in college athletics or extracurricular activities? Yes No
If yes, what sports or activities do you participate in and how many years for each? (during college only) Please
designate between NCAA Division I, II, or III sports, club sports, intramural sports, and extracurricular
activities.____________________________________________________________________________________
___________________________________________________________________________________________
How many hours a week do you spend engaged in team or group activities such as practices, conditioning, or games
mandated by the team for in-season and out-of-season?
In-Season:__________________________ Out-of-Season:________________________
How many hours a week do you spend practicing or engaging in your sport or activity on your own (not required by the
team or group)?_____________________________________________________________________________________
Do you have a job that you are currently working at? Yes No No, I have a Seasonal Job (Camp Counselor, etc)
How many jobs are you currently working?_______________________________________
On average, how many hours per week do you spend working during the school year?______________________

Running head: ATHLETIC INVOLVEMENT AND ACADEMIC ACHIEVEMENT 71
What is your current Grade Point Average (GPA)?_____________________________
To find your GPA, go to www.liberty.edu and click on “Student Login” at the top. Click on “Assist” on the left side
of the page. Enter your Username and Password and click the “Go” button. Click on “Student.” Click “Student Records.”
Click “Academic Transcript.” For “Transcript Level” select the “Undergraduate” option and then click the “Submit”
button. Scroll down to the very bottom of the page and look at the last row titled “Overall.” Your GPA will be the last
number in this row. It will have the format of #.## such as 2.35 or 3.40
Which Sport Management Courses are you currently enrolled in?_____________________________________________
__________________________________________________________________________________________________
What other majors did you consider?____________________________________________________________________
On a scale of 1-10 with 10 being the most satisfied and 1 being the least satisfied, how satisfied are you with your
decision to major in Sport Management?
1 2 3 4 5 6 7 8 9 10
If you could do it all over again, would you still choose to major in Sport Management?
Yes No Maybe N/A
On a scale of 1-10 with 10 being the most enjoyment and 1 being the least enjoyment, how much have you enjoyed your
time in the Sport Management Program?
1 2 3 4 5 6 7 8 9 10
On a scale of 1-10 with 10 being the most difficult and 1 being the easiest, what number value would assign the difficulty
of the Sport Management Program at Liberty in comparison to other degree programs at Liberty?
1 2 3 4 5 6 7 8 9 10
On a scale of 1-10 with 10 being the best and 1 being the worst, what number value would you assign for the quality of
the faculty of the Sport Management Program at Liberty in comparison to other degree programs at Liberty?
1 2 3 4 5 6 7 8 9 10
In comparison to other programs (majors) at Liberty University, would you say the Sport Management Faculty are
better, worse, or the same in terms of quality?
Much Better Slightly Better Same Slightly Worse Much Worse
Which Sport Management class have you learned the most from and the least from?
Most Learned:_____________________________ Least Learned______________________________
What sport would you like to work in (if applicable)?_______________________________________________________
What segment within sports would you like to work in (Marketing, Sales, Finance, Administration, Sport Agent, Ticketing,
Psychology, Coaching, etc)?____________________________________________________________________________