a quantitative content analysis of mercer university med ... · pdf fileeach thesis was coded...
TRANSCRIPT

1
A Quantitative Content Analysis of Mercer University MEd, EdS, and Doctoral Theses
Justus J. Randolph, Lura S. Gaiek, Torian A. White, Lisa A. Slappey
Andrea Chastain, and Rose Prejean Harris
Mercer University
December, 2010
Author Note
Justus J. Randolph, Lura Gaiek, Torian White, Lisa Slappey, Andrea Chastain, and Rose
Prejean Harris, Tift College of Education, Mercer University.
Correspondence concerning this article should be addressed to Justus J. Randolph, Tift
College of Education, Mercer University, 3001 Mercer University Dr., Atlanta, GA 30341. E-
mail: [email protected]

2
Abstract
Quantitative content analysis of a body of research not only helps budding researchers
understand the culture, language, and expectations of scholarship, it helps identify deficiencies
and inform policy and practice. Because of these benefits, an analysis of a census of 980 Mercer
University MEd, EdS, and doctoral theses was conducted. Each thesis was coded on 10
variables. The descriptive characteristics of the theses, the predictors of the length of thesis, and
the predictors of the type of research method of the thesis were investigated. The main results
were that (a) the vast majority of thesis authors were female, (b) the number of qualitative theses
was on the rise, (c) there were slight variations in research method and length based on location
of publication, (d) the page length of MEd theses had been slightly decreasing over time, (e)
mathematics instruction was the most frequent subject descriptor of theses, and (f) the proportion
of male authors increased over time.

3
A Quantitative Content Analysis of Mercer University MEd, EdS, and Doctoral Theses
Quantitative content analysis, “the systematic, objective, quantitative analysis of message
characteristics” (Neuendorf, 2002, p. 1) has been used with much success in fields such as
communications, marketing, sociology, and psychology to monitor trends and identify patterns
of covariation in message characteristics. One benefit of this monitoring within education
research is that it can lead budding scholars to insights about the “tribe and territories” (Becher &
Trowler, 2001) of their field and gain a deeper understanding of the culture, language, and
expectations of scholarship.
Another benefit of a content analysis of the message characteristics and methods within a
body of research is that it can help identify common research deficiencies and, thereby, serve as
a starting point for improving practice and informing policy. One example of this is Leland
Wilkonson and the APA Task Force on Statistical Inference's influential 1999 report--Statistical
Methods in Psychology Journals: Guidelines and Explanations. In that report, social science
researchers drew on content analyses of existing research to identify deficiencies in statistical
analysis and reporting and create guidelines to remedy those deficiencies.
Because of the many benefits that can come about as a result of a content analysis of
existing research, we conducted a content analysis of Mercer University MEd, EdS, and PhD
theses1
1 In this study we refer to MEd, EdS, and PhD theses or dissertations as “theses” although they are appropriately called “projects” or “dissertations” at Mercer University, depending on the type of publication.
. The purposes of this quantitative content analysis are (a) to describe the characteristics
and subjects of Mercer University MEd, EdS, and doctoral theses and (b) identify any trends or
patterns of in these publications. With hope, the results of this research can help budding
scholars better understand the culture, language, and expectations of scholarship and to identify
and trends or deficiencies in the research to improve practice and inform policy. Although the

4
scope of this study is limited to Mercer University theses, it may be the first step in a statewide,
or national, contemporary analysis of educational theses and dissertations.
Related Research
A systematic literature search of Google Scholar, EBSCO Host, and ProQuest using the
keyword combinations dissertation characteristics education and thesis characteristics
education was conducted in October 2010. The results from those searches were explored to
determine which met the following criteria for inclusion and exclusion:
● The research was written in English,
● The research was a content analysis of education theses or dissertations,
● Analyses of theses outside of the field of education were not included.
Furthermore, the references of the articles that met the criteria for inclusion and exclusion were
reviewed to find more research that met the criteria for inclusion.
The systematic search ultimately resulted in nine studies that met the criteria for inclusion
and exclusion (Avery, 1970; Coorough, 1993; Coorough & Nelson, 1994, 1997; Melendez,
2002; Morris, 1993; Rone, 1998; Sharpe, 1993, and Wick & Dirkes (1973). Unfortunately,
Morris and Sharpe’s studies were irretrievable unpublished doctoral theses. A summary of each
retrievable study is given below.
Melendez (2002) conducted a review of 192 dissertations from the field of higher
education, about half of which were published in 1977 and the other half published in 1997. The
key findings of the Melendez study were that (a) there was an increase in the numbers of female
recipients of doctoral degrees, (b) an increase in dissertation length over time, and (c) an increase
in the use of qualitative designs over time.

5
Rone (1998) investigated the characteristics of 115 higher education dissertations. In
contrast to Melendez (2002), Rone found a decrease in dissertation length over time. He found
about an equal number of female and male authors and, like Melendez, also found in increase in
qualitative designs over time.
Coorough (1993) and Coorough and Nelson (1994, 1997) reviewed over 10,000
dissertation abstracts from 1950 to 1990 in terms of the designs and statistical procedures used.
They found that survey research was overwhelmingly the most used design, one quarter of the
reviewed dissertations reported no statistics, and one third of dissertations reported no
statistically significant results. They also reported few changes over time. In terms of the
differences between EdD and Phd theses, Phd theses were found to use more multivariate
statistics and were more generalizable than EdD theses, which used more survey research and
concentrated mostly on topics related to educational administration.
Wick and Dirkes (1973) analyzed the dissertation characteristics of a random sample of
199 included in dissertation abstracts. The coded each dissertation by type, independent variables
used, research design, types of measures used, data analysis techniques, and sampling plans. The
results that are relevant to this study are that 69% of those theses were experimental, and that
only 7% of dissertations used non-numerical data gathering methods, such as interviews.
To examine the reliability of an instrument for the evaluation of doctoral dissertations in
education, Avery (1970) reviewed 127 dissertations from Indiana University. The items on the
instrument were grouped into the following categories: presentation of the subject, research
material, adaptation, evaluation of facts and data, paragraphs, sentences, words, form of
manuscript, and readability. Since this was a measurement study, the results of these
dissertations in each of those categories is not given; reliability estimates are given instead.

6
In summary, the previous research converges on the finding that there is an increasing
number of qualitative doctoral dissertations in education. The research diverges on whether the
length of theses and the proportion of female authors is increasing, decreasing, or staying the
same.
Research Questions
1. What are the descriptive characteristics of Mercer theses?
2. What are the predictors of length of theses?
3. What are the predictors of research methods of theses?
4. Is the proportion of female authors to male authors increasing, decreasing, or staying the
same over time?
Method
In this section we describe the sample and sampling strategy used, the data collection
process, and how interrater reliability was established. We end with a discussion of the data
analysis methods used.
Sample and Sampling Strategy
All published Mercer University MEd or EdS theses or doctoral dissertations were
included in this analysis. These studies were found by using the following terms in the subject
search field of the Swilley Library Online Catalog: Mercer University Atlanta Dissertations and
Mercer University Dissertations. The first search term yielded 855 theses or dissertations housed
in the Atlanta campus. The second search term yielded 427 theses or dissertations from the
Macon campus. A researcher then searched the note field of each bibliographic entry to
determine which of these 1282 entries were MEd, EdS, or theses in the field of education. Of the

7
855 theses housed in the Atlanta campus, 768 (89.8%) were determined to be MEd, EdS, or
doctoral theses in education. Of the 427 theses of theses housed on the Macon campus, 212
(49.7%) were determined to be MEd, EdS, or doctoral theses in education. In total, the
bibliographic entries of the 980 MEd, EdS, or doctoral theses in education published at Mercer
University were reviewed.
Data Collection
The bibliographic entry for each thesis was coded on 10 variables:
1. Type of publication (i.e., MEd, EdS, or doctoral dissertation),
2. Year of publication,
3. Number of authors,
4. Number of female authors (if able to be determined from names),
5. Number of pages,
6. Number of bibliographic pages,
7. The subject descriptors
8. Place of publication (i.e., Atlanta or Macon campus),
9. Research tradition, (quantitative, qualitative, or mixed-methods) if it can be determined
from title of publication), and
10. Complete title of publication.
The coding book that was used can be found in Appendix A.
The six authors of this paper each independently rated between 100 and 200 of the 980
bibliographic entries. The first author of this paper selected a simple random sample of 100 of

8
the 980 entries and also coded those entries to establish interrater reliability estimates on the
nonfactual variable (i.e., the research tradition variable).
Data Analysis
Descriptive statistics were calculated for the quantitative variables mentioned above. The
general linear model was used to identify predictors of thesis length; logistic regression was used
to identify the predictors of research method. All quantitative analyses were conducted with
SPSS 11.0. Computer-based content analysis was done using Concordance software (Watt,
2009). Brennan and Prediger’s (1981) free-marginal kappa was used as the measure of interrater
reliability. It was calculated with Randolph’s (2008) Online Kappa Calculator software.
Results
Interrater Reliability
Based on a simple random sample of 100 cases, the proportion of overall agreement between the
six raters and the interrater reliability rater was 95% on the research tradition variable. The
corresponding free-marginal kappa was 0.93, indicating high interrater reliability.
Descriptive Results
Year of publication. The range of years for this analysis ranged from 1985 to 2010. A
histogram of theses by years is shown in Figure 1 below. Note that while there were
educationally oriented theses published before 1985, they were not labeled as MEd theses, and,
therefore, were not included in this study.

9
Figure 1. Histogram of theses published by year.
Number of authors. Of the 980 theses, 961 of those had a single author. The range of
authors varied from 1-10.
Gender of authors. Of the 913 cases where the gender of the author was able to be
determined by name, female authors accounted for 88.3% of the total.
Number of pages and bibliographic pages. For MEd theses, the minimum and
maximum number of pages was 23 and 183, respectively. The mean was 64.15 with a standard
deviation of 23.37. The minimum and maximum number of bibliographic pages was 1 and 38
respectively. The mean number of bibliographic pages was 5.32 with a standard deviation of
2.57.
For EdS theses, the minimum and maximum number of pages was 29 and 165,
respectively. The mean was 67.18 with a standard deviation of 25.94. The minimum and

10
maximum number of bibliographic pages was 3 and 19 respectively. The mean number of
bibliographic pages was 5.85 with a standard deviation of 2.25.
For doctoral theses, the minimum and maximum number of pages was 77 and 273,
respectively. The mean was 142.40 with a standard deviation of 47.21. The minimum and
maximum number of bibliographic pages was 5 and 24 respectively. The mean number of
bibliographic pages was 10.53 with a standard deviation of 4.96.
Subject descriptors. Across all types of theses and years the ten most frequently
occurring subject descriptors, in order of frequency, are listed below. The descriptors are
followed by the number of occurrences in parentheses. A complete list of subject descriptors can
be found online2
a. Mathematics -- Study and teaching (Elementary) (66)
b. Mathematics -- Study and teaching (Middle school (52)
c. Classroom management (49)
d. Group work in education (46)
e. Mathematics -- Study and teaching (Primary) (46)
f. Reading (Primary) (40)
g. Reading (Elementary) (30)
h. Language arts -- Correlation with content subjects (29)
i. Language arts -- (Elementary) (28)
j. Computer-assisted instruction (27)
Place of publication. Of the 980 articles in our study, 768 (78.4%) were published on the
Atlanta campus.
2 http://justusrandolph.net/gera_2010/subject_descriptor_frequencies.pdf

11
Research tradition. Of the 930 theses where the method could be determined by the
title, the vast majority (90.3%) were quantitative; the others were qualitative. None of the theses
title clearly indicated the use of mixed methods. About 5% of theses had titles that were not
descriptive enough to determine the type of research method used.
Titles of publications. Computer-based content analysis was used to analyze the titles of
publications. The top ten most frequently used words in title are listed below. An interactive,
concordance analysis of all titles can be found online3
1. Effect/effects
.
2. Students
3. Grade
4. Achievement
5. School
6. Mathematics/math
7. Writing
8. Teaching
9. Instruction
10. Classroom
Predictors of Page Numbers
Table 1 below shows a model predicting the number of pages in a Mercer thesis.
Location of publication (i.e. Macon or Atlanta), type of publication (i.e., MEd, EdS, or doctoral
thesis), year of publication, research method (i.e., quantitative or qualitative), type of publication
3 http://justusrandolph.net/gera_2010/textfromclipboard-file3.txt/textfromclipboard-file3.txt.WebConcordance/framconc.htm

12
by research method interaction, and a type of publication by location interaction were
statistically significant predictors of the numbers of pages.
Table 1. Predictors of number of pages
Tests of Between-Subjects Effects
Dependent Variable: pages
324925.086a 8 40615.636 77.308 .00013677.932 1 13677.932 26.035 .00053976.409 1 53976.409 102.740 .000
177685.478 2 88842.739 169.105 .00012336.944 1 12336.944 23.482 .000
3794.105 1 3794.105 7.222 .0077907.669 2 3953.835 7.526 .0012320.326 1 2320.326 4.417 .036
480714.533 915 525.3715066256.000 924
805639.619 923
SourceCorrected ModelInterceptLOCATIONTYPEYEARMETHODTYPE * METHODLOCATION * TYPEErrorTotalCorrected Total
Type III Sumof Squares df Mean Square F Sig.
R Squared = .403 (Adjusted R Squared = .398)a.
Tables 2 through 6 show the estimated marginal means for location, thesis type, method, the type
of thesis by method interaction, and the type of the thesis by location interaction. In short, (a)
theses published in Atlanta tend to be slightly longer (this included Atlanta doctoral theses); (b)
MEd, EdS, and doctoral theses have an increasingly greater number of pages, respectively,
(although the number of MEd and EdS pages is almost identical); (c) on average, qualitative
thesis are longer than quantitative theses; (d) the only exception is that EdS theses have longer
quantitative theses than qualitative theses, and (e) Atlanta MEd and EdS theses tended to be than
Macon MEd and EdS theses (note: Macon does not publish doctoral theses in education at the
current time). Regression analyses between year and length of publication were calculated for

13
each thesis type. The only statistically significant regression parameter was for MEd theses (b = -
0.71, p = 0.00); however, the decrease in practical terms was negligible. For every year after
1985, an MEd has decreased by 7/10ths of a page; see Figure 2.
Table 2. Estimated marginal means by location of publication
1. Location
Dependent Variable: pages
98.700a 1.817 95.133 102.26747.250a,b 2.265 42.805 51.695
LocationAtlantaMacon
Mean Std. Error Lower Bound Upper Bound95% Confidence Interval
Evaluated at covariates appeared in the model: year =2000.13.
a.
Based on modified population marginal mean.b.
Table 3. Estimated marginal means by thesis type
2. type of thesis
Dependent Variable: pages
58.495a 1.690 55.177 61.81261.175a 2.889 55.505 66.846
151.260a,b 3.948 143.512 159.008
type of thesisMEdEdSPhD
Mean Std. Error Lower Bound Upper Bound95% Confidence Interval
Evaluated at covariates appeared in the model: year = 2000.13.a. Based on modified population marginal mean.b.
Table 4. Estimated marginal means by research method

14
3. method
Dependent Variable: pages
75.742a,b 1.484 72.829 78.65580.498a,b 2.696 75.206 85.789
methodQuantitativeQualitative
Mean Std. Error Lower Bound Upper Bound95% Confidence Interval
Evaluated at covariates appeared in the model: year = 2000.13.a.
Based on modified population marginal mean.b.
Table 5. Estimated marginal means by method and type of thesis
4. method * type of thesis
Dependent Variable: pages
57.551a 1.172 55.252 59.85063.611a 2.433 58.835 68.387
136.388a,b 5.324 125.938 146.83759.438a,b 3.262 53.036 65.84058.740a,b 5.204 48.527 68.952
166.132a,b 5.458 155.422 176.843
type of thesisMEdEdSPhDMEdEdSPhD
methodQuantitative
Qualitative
Mean Std. Error Lower Bound Upper Bound95% Confidence Interval
Evaluated at covariates appeared in the model: year = 2000.13.a. Based on modified population marginal mean.b.
Table 6. Estimated marginal means by location and type of thesis

15
5. Location * type of thesis
Dependent Variable: pages
68.467a 1.911 64.716 72.21776.373a 3.252 69.992 82.755
151.260a 3.948 143.512 159.00848.523a 2.156 44.291 52.75445.977a 3.986 38.155 53.800
.a,b . . .
type of thesisMEdEdSPhDMEdEdSPhD
LocationAtlanta
Macon
Mean Std. Error Lower Bound Upper Bound95% Confidence Interval
Evaluated at covariates appeared in the model: year = 2000.13.a. This level combination of factors is not observed, thus the correspondingpopulation marginal mean is not estimable.
b.
Figure 2. Scatterplot of pages of MEd theses by year. Line of best fit is included.

16
Predictors of the Research Method
The results of a binomial logistic regression analysis giving the predictors of a qualitative
thesis are given in Table 7. The results show that qualitative theses are more likely on the Macon
campus, are more likely in PhD theses than MEd or EdS theses, and show an increase over time.
Table 7. Logistic regression predictors of a qualitative research thesis
-1.623 .262 38.372 1 .000 .19743.761 2 .000
-2.522 .431 34.302 1 .000 .080-1.588 .536 8.763 1 .003 .204
.067 .028 5.769 1 .016 1.070-133.584 56.258 5.638 1 .018 .000
AtlantaPhDMEdEdSYEARConstant
Step1
a
B S.E. Wald df Sig. Exp(B)
Variable(s) entered on step 1: LOCATION, TYPE, YEAR.a.
To illustrate these ideas further, crosstabulations are shown in Tables 8 through 10. As shown in
Table 8, Atlanta has 6.9% qualitative theses compare to Macon’s 21.0%. As shown in Table 9,
MEd, EdS, and PhD have in increasing proportion of qualitative theses. Finally, Table 10 shows
that there has been a growth in qualitative theses over time.

17
Table 8. Crosstabulation of location and research method
693 51 74493.1% 6.9% 100.0%82.5% 56.7% 80.0%74.5% 5.5% 80.0%
147 39 18679.0% 21.0% 100.0%17.5% 43.3% 20.0%15.8% 4.2% 20.0%
840 90 93090.3% 9.7% 100.0%
100.0% 100.0% 100.0%90.3% 9.7% 100.0%
Count% within Location% within method% of TotalCount% within Location% within method% of TotalCount% within Location% within method% of Total
Atlanta
Macon
Location
Total
Quantitative Qualitativemethod
Total
Table 9. Crosstabulation of type of thesis and research method
type of thesis * method Crosstabulation
726 51 77793.4% 6.6% 100.0%86.5% 56.7% 83.6%78.1% 5.5% 83.6%
93 20 11382.3% 17.7% 100.0%11.1% 22.2% 12.2%10.0% 2.2% 12.2%
20 19 3951.3% 48.7% 100.0%
2.4% 21.1% 4.2%2.2% 2.0% 4.2%
839 90 92990.3% 9.7% 100.0%
100.0% 100.0% 100.0%90.3% 9.7% 100.0%
Count% within type of thesis% within method% of TotalCount% within type of thesis% within method% of TotalCount% within type of thesis% within method% of TotalCount% within type of thesis% within method% of Total
MEd
EdS
PhD
type ofthesis
Total
Quantitative Qualitativemethod
Total

18
Table 10. Crosstabulation of year and research method
34 34100.0% 100.0%
4.0% 3.7%3.7% 3.7%
59 3 6295.2% 4.8% 100.0%
7.0% 3.3% 6.7%6.3% .3% 6.7%
318 33 35190.6% 9.4% 100.0%37.9% 36.7% 37.7%34.2% 3.5% 37.7%
281 19 30093.7% 6.3% 100.0%33.5% 21.1% 32.3%30.2% 2.0% 32.3%
148 35 18380.9% 19.1% 100.0%17.6% 38.9% 19.7%15.9% 3.8% 19.7%
840 90 93090.3% 9.7% 100.0%
100.0% 100.0% 100.0%90.3% 9.7% 100.0%
Count% within yearfive% within method% of TotalCount% within yearfive% within method% of TotalCount% within yearfive% within method% of TotalCount% within yearfive% within method% of TotalCount% within yearfive% within method% of TotalCount% within yearfive% within method% of Total
85-89
90--94
95-99
00-04
05-10
years
Total
Quantitative Qualitativemethod
Total
Gender Authorship Trends
Table 11 below indicates that the number of male authors has been increasing over time. A
linear-by-linear association test of the data in Table 11 was statistically significant, M² (1, N =
911) = 13.01, p < 0.000.

19
Table 11. Proportion of female/male authors over time
Five year period * GENDER Crosstabulation
GENDER
Total Male Female
Five year period 85-89 Count 0 34 34
% within Five year period .0% 100.0% 100.0%
% within GENDER .0% 4.2% 3.7%
% of Total .0% 3.7% 3.7%
90-94 Count 3 56 59
% within Five year period 5.1% 94.9% 100.0%
% within GENDER 2.8% 7.0% 6.5%
% of Total .3% 6.1% 6.5%
95-99 Count 36 298 334
% within Five year period 10.8% 89.2% 100.0%
% within GENDER 34.0% 37.0% 36.7%
% of Total 4.0% 32.7% 36.7%
00-04 Count 33 266 299
% within Five year period 11.0% 89.0% 100.0%
% within GENDER 31.1% 33.0% 32.8%
% of Total 3.6% 29.2% 32.8%
05-10 Count 34 151 185
% within Five year period 18.4% 81.6% 100.0%
% within GENDER 32.1% 18.8% 20.3%
% of Total 3.7% 16.6% 20.3%
Total Count 106 805 911
% within Five year period 11.6% 88.4% 100.0%
% within GENDER 100.0% 100.0% 100.0%
% of Total 11.6% 88.4% 100.0%

20
Summary
The main results of this study were that,
(a) the vast majority of authors are female,
(b) the proportion of qualitative theses is on the rise,
(c) there are slight variations in research method and length based on location of
publication,
(d) the page length of MEd theses have been slightly decreasing over time,
(e) mathematics instruction is the most frequent subject descriptor of theses, and
(f) the proportion of male authors is increasing over time.
In terms of the relationship between our study and previous studies, first, our finding that
the number of qualitative thesis is on the rise convergences with the research done by Melendez
(2002) and Rone (1998). Second, at least compared to Rone’s sample of higher education
dissertations, which had about 50% female authors, our census indicated that over 88% of
Mercer education thesis authors are female. The proportion of male authors of education theses
had increased since 1985.
References
Avery, W. K. (1970). An instrument for the evaluation of doctoral dissertations in education
(Unpublished doctoral dissertation). Indiana University.
Becher, T., & Trowler, P. R. (2001). Academic tribes and territories: Intellectual inquiry and the
culture of disciplines (2nd ed.). Buckingham, United Kingdom: SRHE & Open
University Press.
Brennan, R. L., & Prediger, D. J. (1981). Coefficient Kappa: Some uses, misuses, and
alternatives. Educational and Psychological Measurement (41), 687-699.

21
Coorough, M. C. (1993). An analysis of educational dissertations from 1950 to 1990.
Unpublished doctoral dissertation. University of Idaho.
Coorough, M. C. & Nelson, J. (1994). Content analysis of the PhD versus EdD dissertation.
Journal of Experimental Education, 62(2), 158-168.
Coorough, M. C., & Nelson, J. (1997). The dissertation in education from 1950 to 1990.
Educational Research Quarterly, 20(4), 3-14.
Melendez, J. (2002). Doctoral scholarship examined: Dissertation research in the field of higher
education studies (Doctoral dissertation). Retrieved from ProQuest. (AAT 308126).
Morris, L. R. (1993). An historical analysis of dissertation topics in the department of
elementary education, East Texas State University, 1964-1989 (Unpublished doctoral
dissertation). East Texas State University.
Neuendorf, K. A. (2002). The content analysis guidebook. Thousand Oaks, CA: Sage.
Randolph, J. J. (2008). Online Kappa Calculator [Software]. Retrieved from
http://justus.randolph.name/kappa
Rone, E. C. (1998). Characteristics of higher education doctoral theses: Defrosting frozen assets
(Doctoral dissertation, University of Toronto, Canada). Retrieved from
http://www.collectionscanada.gc.ca/obj/s4/f2/dsk2/ftp02/NQ35302.pdf
Sharpe, A. D. (1993). Content and focus of dissertations in the field of higher education
administration in the department of higher education at the University of North Texas
from 1971 through 1991 (Unpublished doctoral dissertation). University of North Texas.
Watt, R. (2009). Concordance, Version 3.3 [Software]. Retrieved from
http://www.concordancesoftware.co.uk/

22
Wick, J. W., & Dirkes, C. (1973). Characteristics of current doctoral dissertations in education.
Educational Researcher, 2(7), 20-21.
Wilkinson, L., & the APA Task Force on Statistical Inference. (1999). Statistical methods in
psychology journals: Guidelines and explanations. American Psychologist, 54, 594-604.
Appendix A: Coding Book
23
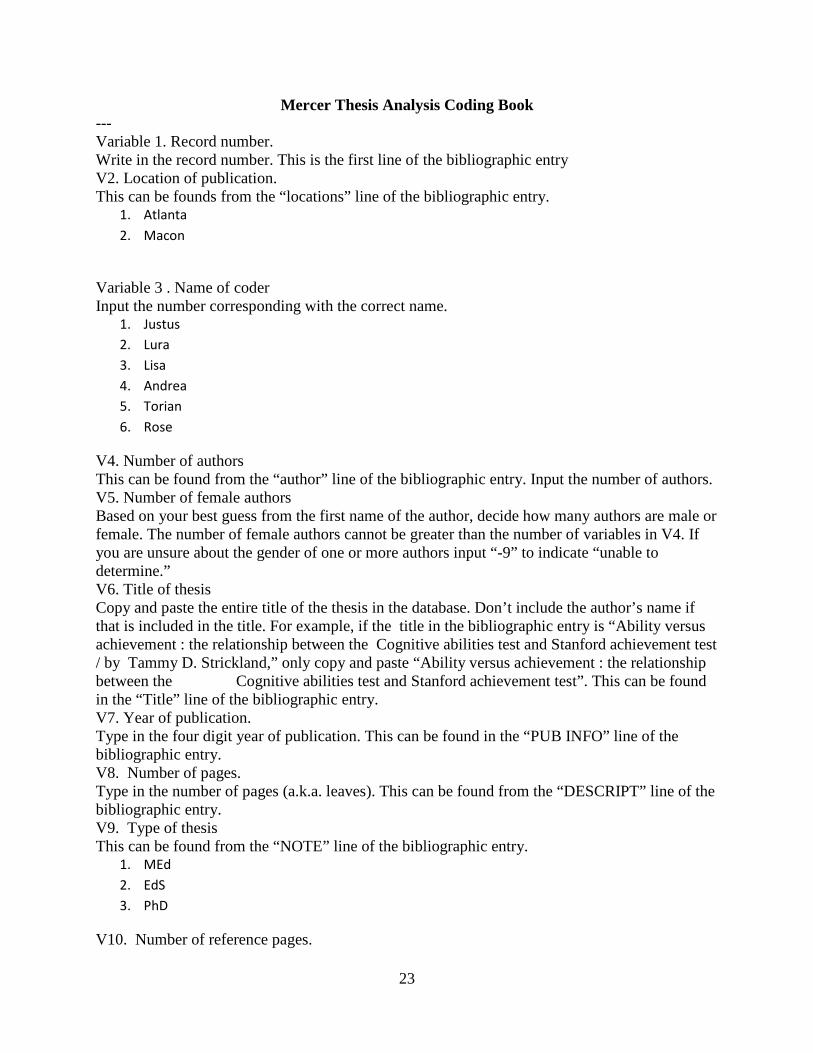
Mercer Thesis Analysis Coding Book --- Variable 1. Record number. Write in the record number. This is the first line of the bibliographic entry V2. Location of publication. This can be founds from the “locations” line of the bibliographic entry.
1. Atlanta 2. Macon
Variable 3 . Name of coder Input the number corresponding with the correct name.
1. Justus 2. Lura 3. Lisa 4. Andrea 5. Torian 6. Rose
V4. Number of authors This can be found from the “author” line of the bibliographic entry. Input the number of authors. V5. Number of female authors Based on your best guess from the first name of the author, decide how many authors are male or female. The number of female authors cannot be greater than the number of variables in V4. If you are unsure about the gender of one or more authors input “-9” to indicate “unable to determine.” V6. Title of thesis Copy and paste the entire title of the thesis in the database. Don’t include the author’s name if that is included in the title. For example, if the title in the bibliographic entry is “Ability versus achievement : the relationship between the Cognitive abilities test and Stanford achievement test / by Tammy D. Strickland,” only copy and paste “Ability versus achievement : the relationship between the Cognitive abilities test and Stanford achievement test”. This can be found in the “Title” line of the bibliographic entry. V7. Year of publication. Type in the four digit year of publication. This can be found in the “PUB INFO” line of the bibliographic entry. V8. Number of pages. Type in the number of pages (a.k.a. leaves). This can be found from the “DESCRIPT” line of the bibliographic entry. V9. Type of thesis This can be found from the “NOTE” line of the bibliographic entry.
1. MEd 2. EdS 3. PhD
V10. Number of reference pages.

24
This can be found from the “NOTE” field. For example, if the note field indicates, “Includes bibliographical references (leaves 41-47),” then you would type in 7 in the datasheet because the reference list is seven pages long. V11. Subject 1 Copy and paste the first subject descriptor from the “SUBJECT” field other than “Mercer University – Dissertations.” Do not copy and paste the period. Be sure to copy and paste because important that all descriptors be exact. If there is more than one subject, record them in variables v12 and v13. If there are ever more than three descriptors just ignore the rest. V12. Subject 2 See V11 for instructions V13. Subject 3 See v11 for instructions V14. Methods Look again at the title. Determine from the title whether the study is quantitative, qualitative, or mixed methods. For example, if the title has the word “Experiment” or “the effects of X on Y” or “the relationship between,” then it is probably a quantitative study. If the title has the name of a qualitative tradition or examines “perceptions” it is probably a qualitative study. If the title has the words “mixed methods,” it’s probably a mixed methods study. If you can’t determine from the title choose “unable to determine”
1. Quantitative 2. Qualitative 3. Mixed methods 4. Unable to determine
V15. Note. Use this space in case you want to make a note about a certain entry. This variable is optional.