a quantitative look at the relationship between fdi inflow
TRANSCRIPT

Business and Economic Research
ISSN 2162-4860
2020, Vol. 10, No. 4
http://ber.macrothink.org 1
A Quantitative Look at the Relationship between FDI
Inflow and Economic Growth in North Macedonia,
2006-2018
Bettina Jones
PhDc. University American College Skopje
Program Analyst, Appalachian Regional Commission
1666 Connecticut Ave, Suite 700, Washington, D.C. 20009, USA
Tel: 1-859-397-0036 E-mail: [email protected]
Received: August 20, 2020 Accepted: September 14, 2020 Published: September 16, 2020
doi:10.5296/ber.v10i4.17548 URL: https://doi.org/10.5296/ber.v10i4.17548
Abstract
Beginning in 2006, the North Macedonian government pursued a strategy for attracting
foreign investment to the country to develop it economically. In theory, FDI inflow should
have this effect in a developing country mainly by contributing to productivity spillovers to
domestic firms and knowledge spillovers to the domestic labor force. The goal of the research
was to determine what statistical association might exist between FDI inflow and economic
growth in North Macedonia, to determine if the policy of FDI attraction was having one of its
desired effects. The paper fleshes out the economic growth function Y=F(K, H, L, A); growth
is a function of capital, human capital, labor, and technology to determine which variables to
utilize. It was found that neither FDI inflow nor any of the other considered factors for
economic growth had a significant association with growth. However, taken together, all
these factors did a moderately good job of explaining the variation in economic growth over
the considered period. Thus, arguments for FDI inflow’s being a silver bullet for economic
growth may be misplaced, as many other factors matter as well. This does not suggest that
foreign direct investment ought not to be used as an economic development tool, however, as
it may be having effects that are not captured by changes in economic growth.
Keywords: Foreign direct investment, Economic growth, Development economics,
Economic development, International business
1. Introduction
One of the most common reasons why foreign direct investment (FDI) is pursued by

Business and Economic Research
ISSN 2162-4860
2020, Vol. 10, No. 4
http://ber.macrothink.org 2
developing countries is that it is often associated with good economic outcomes, including
general economic growth. The logic is that the FDI unlocks the potential of domestic firms
and generates opportunities for the creation of products and services that the domestic market
may not demand, and helps domestic firms orient more towards global markets, both in
mindset and in network development. The injection of foreign capital into a developing
economy can positively impact the local construction sector, local employment, and the
domestic supply chain, as well as contributing to the country’s account balance. Economic
growth is generally accepted as an indicator of economic well-being, with GDP per capita
forming one-third of the trifecta of the human development index. GDP growth is therefore
considered in this work as indicative of general economic/human development. North
Macedonia began an intense policy of FDI attraction in 2006, with related subsidies and other
supports, for the goal of contributing to the country’s overall economic growth and, thus,
providing a better life for its citizens. The work seeks to determine whether over the life of
the policy (2006 to the present day) gains in economic growth can be attributed to FDI inflow
on its own, or if perhaps some other factor is responsible. This is especially important for
countries like North Macedonia, who carry out large and expensive programs in order to
attract FDI to their countries. Determining the true effects of FDI on the growth of a
developing economy will enable policymakers generally to perform cost-benefit analyses of
programs related to FDI, and update their policies accordingly. The effects of policies in
general should always be evidence-based, and particularly when it comes to activities like
FDI, which involves the public sector’s financial involvement in the market.
The paper hypothesizes that the effects of FDI inflow on economic growth over the period
considered in North Macedonia will not be as pronounced as has been argued by state
officials. The paper firstly reviews the relevant scholarship on the relationship between
foreign direct investment and economic growth. The second section provides the
methodological approach to the statistical analysis, including the theoretical bases for the
different variables that explain economic growth. The third section provides some regional
context of FDI inflow in North Macedonia and examines the data graphically and numerically.
The fourth section provides the result of the regression between economic growth and FDI
inflow, among other variables. The fifth section discusses the results of the analysis, and the
sixth section concludes.
2. Literature Review
Most countries prefer FDI over other types of investment due to its “stable nature, low
volatility, and long-term commitment” (Sawalha, Elian, and Suliman, 2016). Proponents
would argue that FDI inflows bring good to an economy for several reasons. They can be
thought of as a debt-free investment in the economy of a country, can increase the quantity
and quality of employment, and can result in technological and managerial spillovers to
domestic firms (Bruno and Campos, 2011). These positive spillovers can be measured by
examining the decreases in the gaps in total factor productivity between the domestic firms
and the MNCs over time (Manral, 2001). Furthermore, FDI aids in local enterprise
development, helps create a competitive business environment, and contributes to the
country’s ability to integrate into international trade networks (Bari, n.d.). All of these factors

Business and Economic Research
ISSN 2162-4860
2020, Vol. 10, No. 4
http://ber.macrothink.org 3
then contribute to economic growth.
The role of foreign businesses is also very significant for key export industries developing
countries. In Vietnam, for instance, foreign businesses contributed to 75% of total exports of
footwear; 35% of garments and textiles and 95% of electronics (Menon, 2009). However, it
may be that the productivity benefits of FDI only take hold when the workforce of the FDI
host country is sufficiently educated (Borenzstein, De Gregorio, and Lee, 1998) or if the
economy and financial markets are sufficiently developed (deMello, 1999; Alfaro et. al,
2003). Borenzstein et. al (1998) found that the interaction between FDI and human capital is
significant for growth in developing countries, but FDI alone is not. The mixed productivity
effects of FDI was also found by Kathuria, who showed that increased sales for domestic
firms following an investment by a foreign firm only occurred only if the domestic firm
invested strongly in R&D, but for those that didn’t, sales decreased (Manral, 2001).
Similarly, it was found that FDI has a significant positive impact on welfare in countries
where the governance is of higher quality (i.e. only the interaction term between governance
and FDI was positively significant for a regression examining a country’s performance on the
Human Development Index (HDI). It was further found that FDI alone had a surprising
negative impact on knowledge infrastructure, or the technological framework within the
country including IP right protections, absorptive abilities, and the like. This may be due to
foreign companies protecting their intellectual property through various means or because of
the country’s technology transfer policies (Lehnert et. al, 2013).
The literature therefore identifies many qualifiers of the direct relationship between FDI
inflow and economic growth. It seems that FDI inflow alone is not enough to cause it, but
FDI can contribute when other factors including quality governance, well-developed human
capital, advanced domestic firms, and others. Moreover, in the economic growth/FDI
relationship there also is the potential problem of direction of causality, which can be
controlled for through the use of the Granger (1969) or Sims (1972) tests (Oladipo, 2012).
This directionality problem explains in part why authors researching on the topic of the
relationship between economic growth and FDI incidence report contradictory results.
Specifically, the problem is that it is very possible that growth in a particular sector is
followed by investment in that sector in that country, rather than the investment causing the
growth. Investors certainly do include growth in various industries and/or countries as one of
the key items under consideration when they make investment decisions (Alfaro, 2003).
The methodology of the paper attempts to control for all these various factors that can
contribute to economic growth in the country so as to determine whether there is an isolated
effect of FDI, or whether there is an effect of FDI that will only take hold in the presence of
another variable.
3. Methodology
In order to determine the relationship of FDI to the variable of economic growth, a regression
is performed in this section that examines the span of time from the beginning of the policy
until the most recent data is available (2018), which will also enable the determination of

Business and Economic Research
ISSN 2162-4860
2020, Vol. 10, No. 4
http://ber.macrothink.org 4
some preliminary macroeconomic results of the change in policy.
Economic growth as measured by the GDP growth rate since the previous year is the
dependent variable with FDI inflow as a percentage of GDP as the independent variable of
interest. To increase the total number of observations, the quarterly GDP growth rate was
used, along with the annual statistics for each of the other indicators, added four times for
each year. It was done in this way because the other variables were not available on a
quarterly basis, but the n is still increased through the use of the quarterly GDP data. The
other variables were selected due to their association with economic growth according to a
combination of economic growth theories/models. The other independent variables included
in the regression were the real interest rate, foreign exchange reserves as a percentage of
money supply, gross fixed capital formation as a percentage of GDP, broad money supply as
a percentage of GDP, gross domestic savings as a percentage of GDP, the population growth
rate, expenditure on R&D as a percentage of GDP, the political stability index, average years
of expected schooling, incoming official development assistance (ODA; i.e. foreign aid) as a
percentage of GDP, and incoming remittances as a percentage of GDP. The latter two capture
the other two major types of foreign inflows of money that can impact economic outcomes in
addition to foreign direct investment (Lehnert et. al, 2013). Foreign exchange reserves
similarly controls for foreign capital in the country and how it may contribute to internal
growth. The paper has used the growth function Y= F(K, L, H, A); economic growth is a
function of capital, labor, human capital, and technology. It based the variables selected to
represent this function on a combination of different economic growth models, including the
Solow-Swan, Harrod-Domar, and endogenous growth models. Accumulation of capital, both
human and financial, forms the contribution of the Solow-Swan model (Renelt, 1991). Gross
fixed capital formation, broad money supply, and average years of expected schooling are its
associated variables. The Harrod-Domar model contributes gross domestic savings as a
percentage of GDP, which drives growth through capital accumulation (System Dynamics,
2016). The model also contributes the population growth rate, which affects the productivity
of labor. Endogenous growth theory holds that internal/human capital development
contributes to economic growth (Renelt, 1991), and provides research development,
measured by R&D investment as a percentage of GDP, and average years of expected
schooling. Also included was the interest rate, which directly affects growth by encouraging
or discouraging investment. Finally, the political stability index is also included to control for
the extent to which economic growth in the country might have been affected by conflict. It is
a particularly important variable for the context of North Macedonia, which has seen a recent
war of independence, civil war, ethnic conflict, and a political crisis.
There were 52 observations total, with no missing data points. There were some limitations of
the data: Though economic growth is recorded on a quarterly basis, none of the other
variables are. This led to repetition of all of the variables four times a year to match the
changing growth variable. The results would have been much more robust if quarterly data
had been available for all of them. Only 12 observations are available for the other variables,
which is a low number of observations. Similarly, the quarterly economic growth figure is
volatile, so attempting to use quarterly data to increase the number of observations may affect
Business and Economic Research
ISSN 2162-4860
2020, Vol. 10, No. 4
http://ber.macrothink.org 5
the validity of the results.
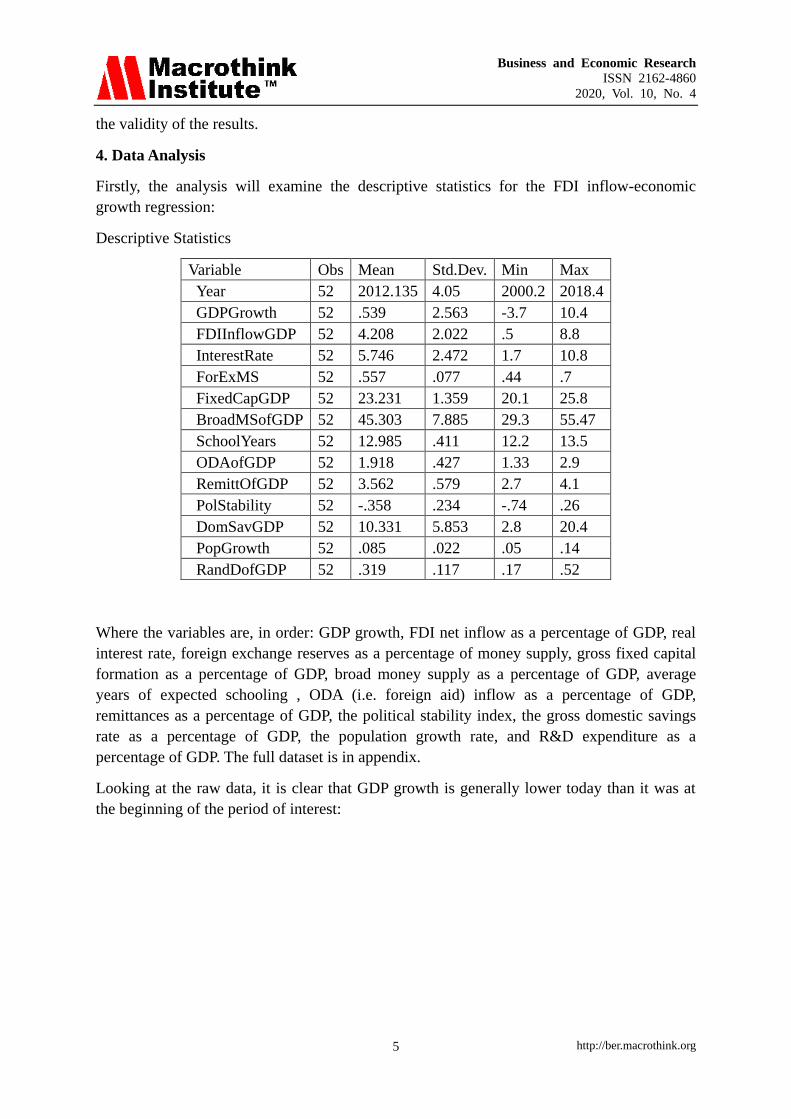
4. Data Analysis
Firstly, the analysis will examine the descriptive statistics for the FDI inflow-economic
growth regression:
Descriptive Statistics
Variable Obs Mean Std.Dev. Min Max
Year 52 2012.135 4.05 2000.2 2018.4
GDPGrowth 52 .539 2.563 -3.7 10.4
FDIInflowGDP 52 4.208 2.022 .5 8.8
InterestRate 52 5.746 2.472 1.7 10.8
ForExMS 52 .557 .077 .44 .7
FixedCapGDP 52 23.231 1.359 20.1 25.8
BroadMSofGDP 52 45.303 7.885 29.3 55.47
SchoolYears 52 12.985 .411 12.2 13.5
ODAofGDP 52 1.918 .427 1.33 2.9
RemittOfGDP 52 3.562 .579 2.7 4.1
PolStability 52 -.358 .234 -.74 .26
DomSavGDP 52 10.331 5.853 2.8 20.4
PopGrowth 52 .085 .022 .05 .14
RandDofGDP 52 .319 .117 .17 .52
Where the variables are, in order: GDP growth, FDI net inflow as a percentage of GDP, real
interest rate, foreign exchange reserves as a percentage of money supply, gross fixed capital
formation as a percentage of GDP, broad money supply as a percentage of GDP, average
years of expected schooling , ODA (i.e. foreign aid) inflow as a percentage of GDP,
remittances as a percentage of GDP, the political stability index, the gross domestic savings
rate as a percentage of GDP, the population growth rate, and R&D expenditure as a
percentage of GDP. The full dataset is in appendix.
Looking at the raw data, it is clear that GDP growth is generally lower today than it was at
the beginning of the period of interest:

Business and Economic Research
ISSN 2162-4860
2020, Vol. 10, No. 4
http://ber.macrothink.org 6
Figure 1. Quarterly GDP Growth in North Macedonia
The low points correspond largely to political or economic crises. The low growth in 2009 is
likely due to the consequences of the 2008 global financial crisis. The 2011/2012 dip can be
explained by the European Sovereign Debt Crisis, wherein North Macedonia’s neighbor
Greece was hard hit. The 2017 low growth is likely due to the 2015-2017 political crisis in
the country. Next, FDI inflow over time will be examined:
Figure 2. FDI Inflow over time as a percentage of GDP in North Macedonia
It is clear here that FDI also began at a higher percentage of GDP and decreased over time,
rebounding after 2015. This strong start is largely due to the increased level of privatization
of formerly state-owned industries in former Yugoslavia throughout the 1990s and early
2000s. To put these trends into perspective, numbers for the GDP growth rate and FDI inflow

Business and Economic Research
ISSN 2162-4860
2020, Vol. 10, No. 4
http://ber.macrothink.org 7
were examined just before the 2006 policy period. GDP growth had been steadily increasing,
in a rebound that occurred after falling into negative growth during and following the 2001
civil war, and then appears to have reached a peak of growth in 2007, when greenfield
investments began occurring, and fell to fluctuating between 3 or 4% and 0%. Prior to the
start of the policy period, FDI had seen a drastic increase in FDI inflow in 2001, interestingly,
during the civil war. This outlier was caused by the acquisition of the country’s national
telecommunications operator by the Deutsche Telekom Group in that year. FDI then dropped
to hover between 2 and 5% before the policy period. Interestingly, the graphs show a strong
performance with regard to both GDP and FDI at the beginning of the policy period, a drop at
the time of the financial crisis, and then a rebound, but not a full recovery.
First, the analysis will look at the relationship between FDI inflow and economic growth
without any of the additional variables. The scatterplot between the variables is below.
Figure 3. Scatterplot of FDI Inflow with GDP Growth
There is a clear visual association between the two variables when seen this way. However, a
regression with the two variables alone will provide a clearer picture of their associative
relationship.
Linear regression
GDPGrowth Coef. St.Err. t-value p-value [95% Conf Interval] Sig
FDIInflowGDP 0.637 0.155 4.11 0.000 0.326 0.948 ***
Constant -2.141 0.722 -2.96 0.005 -3.591 -0.690 ***
Mean dependent var 0.539 SD dependent var 2.563
R-squared 0.252 Number of obs 52.000
F-test 16.886 Prob > F 0.000
Akaike crit. (AIC) 233.295 Bayesian crit. (BIC) 237.197

Business and Economic Research
ISSN 2162-4860
2020, Vol. 10, No. 4
http://ber.macrothink.org 8
*** p<0.01, ** p<0.05, * p<0.1
It appears, according to this regression between only GDP growth and FDI inflow, that there
is a moderate, significant, positive relationship, where the p-value is much smaller than .05,
and the R-Squared is 25. This would indicate that FDI inflow alone is responsible for 25% of
the variation in economic growth over the period, which, were it a final result, would provide
ample evidence that FDI inflow is in fact associated with economic growth. However, adding
many more variables complicates the picture and provides that it is likely other factors that
truly account for the variation.
5. Results
The following regression considers all the variables, including those in the economic growth
model created in the work, political stability, interest rate, and other foreign inflow of capital
variables:
Linear regression
GDPGrowth Coef. St.Err. t-value p-value [95% Conf Interval] Sig
FDIInflowGDP 1.557 3.451 0.45 0.654 -5.423 8.537
InterestRate 0.694 1.331 0.52 0.605 -1.999 3.387
ForExMS -21.308 50.177 -0.42 0.673 -122.801 80.184
FixedCapGDP 0.255 1.887 0.14 0.893 -3.563 4.072
BroadMSofGDP -0.277 0.699 -0.40 0.694 -1.691 1.137
SchoolYears 5.600 47.478 0.12 0.907 -90.434 101.634
ODAofGDP 4.826 20.252 0.24 0.813 -36.137 45.788
RemittOfGDP 19.338 55.848 0.35 0.731 -93.626 132.302
PolStability 4.660 8.746 0.53 0.597 -13.030 22.350
DomSavGDP 2.056 4.667 0.44 0.662 -7.385 11.497
PopGrowth 113.772 278.536 0.41 0.685 -449.620 677.164
RandDofGDP 19.463 84.861 0.23 0.820 -152.185 191.112
Constant -177.768 917.006 -0.19 0.847 -2032.588 1677.051
Mean dependent var 0.539 SD dependent var 2.563
R-squared 0.465 Number of obs 52.000
F-test 2.823 Prob > F 0.007
Akaike crit. (AIC) 237.911 Bayesian crit. (BIC) 263.277
*** p<0.01, ** p<0.05, * p<0.1
In the regression that considers all variables, none of the variables are found to be significant.
Though insignificant, they all have a positive relationship with economic growth, save
foreign exchange reserves as a percentage of money supply and broad money supply as a
percentage of GDP. However, the adjusted r-squared is 47, and the F-statistic’s p-value is

Business and Economic Research
ISSN 2162-4860
2020, Vol. 10, No. 4
http://ber.macrothink.org 9
significant. This indicates that the variables considered here are relatively good determinants
of Macedonia’s economic growth over this period, as they together can explain 47% of its
variation and shows significance.
6. Discussion
Interestingly, the complete regression considering all variables, including the interest rate and
political stability index, result in just a moderately high adjusted r-squared. All of these
factors represent what in the literature is written to be causes of economic growth. The
theories seem to apply moderately well in our case, to explain Macedonia’s economic growth
from 2006 to 2018. Significantly, neither FDI inflow nor any other variable is significant in
the full regression, where many aspects are considered including variables meant to control
for capital accumulation, technological development, and increases in socioeconomic status.
Again, it is possible that the wild fluctuations in the quarterly data has caused this. It may
also be the volatility inherent in the numbers themselves.
North Macedonia has in the past 12 years experienced vast changes. In 2005 it became a
candidate for EU membership, a process which has since stalled (though since 2017, the
trajectory has been somewhat reestablished). The country has seen internal ethnic clashes, 11
years of what has been described as state capture, the effects of the 2008 financial crisis, the
2015 refugee crisis, the effects of the European Sovereign Debt Crisis, rapprochement with
Greece, and most recently, successful accession to NATO. The starting point for growth was
also quite low, with the country only gaining independence in 1991, just 15 years prior to the
start of the policy. It also endured wars between its neighbors throughout the 1990s and
experienced a civil war of its own in 2001. It may be that economic growth has been wildly
fluctuating due to these events or otherwise unaccounted for factors. Though political
stability is also accounted for in the regression, it could be that changes in the index occur at
different times than changes in the business market. It is possible that market changes lag
behind political events, or that socioeconomic indicators lag behind market indicators. For
now it is clear that there remain unknown factors in economic growth in Macedonia over the
policy period, and FDI inflow seems not to have made much difference. This finding agrees
with the paper’s overall hypothesis that the notion that FDI inflow is one of the major factors
for North Macedonia’s economic growth over the past 15 or so years is overstated by officials.
However, as none of the other factors were significant either, it is likely that economic growth
is a complicated phenomenon that requires many different elements to be in place to happen.
7. Conclusion
The finding that over the policy period FDI inflow is not associated with economic growth
does not suggest that FDI should not be utilized as an economic development tool. It seems
that, especially when utilized alongside other mechanisms, it can contribute to economic
growth. What the results point out is merely that FDI inflow is not a silver bullet for
economic growth, but must be accompanied by programs and reforms in other areas to truly
contribute. This notion would agree with the paper’s hypothesis. It also demonstrates that
there are yet-to-be-determined factors that contribute to economic growth, and that would be
a good area for future research. It is highly recommended that North Macedonian

Business and Economic Research
ISSN 2162-4860
2020, Vol. 10, No. 4
http://ber.macrothink.org 10
policymakers examine these results and incorporate them into any future cost-benefit
consideration for crafting FDI-related programming. They should keep in mind that FDI
inflow seems not to singlehandedly cause economic growth. Other developing countries
would do well to perform such statistical analyses as this one and use the results to inform
their FDI policy decisions accordingly.
References
Alfaro, L., Chanda, A., Kalemli-Ozcan, S., & Sayek, S. (2003). FDI and Economic Growth:
The Role of Local Financial Markets. Journal of International Economics.
https://doi.org/10.2139/ssrn.305762
Bari, M. (n.d.). Foreign Direct Investment and Economic Growth in Bangladesh and India: A
Comparative Study. South Asian Journal of Management, 20(1). 7-37.
Borensztein, E., De Gregorio, J., & Lee, J. W. (1998). How Does Foreign Direct Investment
Affect Economic Growth?. Journal of International Economics, 45, 115-135.
https://doi.org/10.1016/S0022-1996(97)00033-0
Bruno, R., & Campos, N. (2011). Foreign Direct Investment and Economic Performance: A
Systematic Review of the Evidence Uncovers a New Paradox. Department for International
Development Systematic Reviews Programme.
DeMello, L. (1997). Foreign Direct Investment in Developing Countries and Growth: A
Selective Survey. The Journal of Development Studies, 34(1), 1-34.
https://doi.org/10.1080/00220389708422501
Lehnert, K., Benmamoun, M., & Zhao, K. (2013). FDI Inflow and Human Development:
Analysis of FDI’s Impact on Host Countries’ Social Welfare and Infrastructure. Wiley
Periodicals Inc Feature Article. Thunderbird International Business Review, 55(3), 285-298.
https://doi.org/10.1002/tie.21544
Manral, L. (2001). Technology Transfer and the Spillover Effect to Local Firms: Evidence
from India. Academy of Management Executive, 15(2), 129-130.
https://doi.org/10.5465/ame.2001.4615023
Menon, J. (2009). Managing Success in Vietnam: Macroeconomic Consequences of Large
Capital Inflows with Limited Instruments. ASEAN Economic Bulletin, 26(1), 77-95.
https://doi.org/10.1355/AE26-1F
Oladipo, O. (2012). Does Foreign Direct Investment Cause Long Run Economic Growth?
Evidence from the Latin American and the Caribbean Countries. International Economic
Policy, 10, 569-582. https://doi.org/10.1007/s10368-012-0225-4
Renelt, D. (1991). Economic Growth: A Review of the Empirical Literature. Policy, Research,
and External Affairs Working Papers; Macroeconomic Adjustment and Growth. Country
Economics Department. The World Bank. [Online] Available: https://bit.ly/3c4BybD
Sawalha, N., Elian, M., & Suliman, A. (2016). Foreign Capital Inflows and Economic

Business and Economic Research
ISSN 2162-4860
2020, Vol. 10, No. 4
http://ber.macrothink.org 11
Growth in Developed and Emerging Economies: A Comparative Analysis. The Journal of
Developing Areas, 50(1). https://doi.org/10.1353/jda.2016.0022
System Dynamics Conference Papers (2016). Exploring Harrod Domar and Solow Models of
Economic Growth. [Online] Available: https://bit.ly/30XsIbD
Appendix
Appendix A: Full dataset
Year
GDP
growth %
(y)
FDI net
inflow
percent
of GDP(x)
Real
Interest
rate
Foreign
Exchange
Reserves
% of
money
supply
Gross
Fixed
Capital
Formatio
n (% of
GDP)
Broad
Money
Supply, %
of GDP
Average
years of
expected
schooling
ODA as a
% of GDP
Remittan
ces
received,
% of GDP
Stability
index
Gross
Domestic
Savings %
of GDP
Populatio
n growth
rate
R&D as %
of GDP
2006 9.00 6.20 8.00 0.64 20.10 29.30 12.20 2.90 3.90 -0.74 4.40 0.14 0.19
2000.2 0.04 6.20 8.00 0.64 20.10 29.30 12.20 2.90 3.90 -0.74 4.40 0.14 0.19
2006.3 6.00 6.20 8.00 0.64 20.10 29.30 12.20 2.90 3.90 -0.74 4.40 0.14 0.19
2006.4 0.02 6.20 8.00 0.64 20.10 29.30 12.20 2.90 3.90 -0.74 4.40 0.14 0.19
2007 0.01 8.80 5.70 0.70 22.70 39.20 12.20 2.41 4.10 -0.43 5.90 0.11 0.17
2007.2 0.05 8.80 5.70 0.70 22.70 39.20 12.20 2.41 4.10 -0.43 5.90 0.11 0.17
2007.3 10.40 8.80 5.70 0.70 22.70 39.20 12.20 2.41 4.10 -0.43 5.90 0.11 0.17
2007.4 9.90 8.80 5.70 0.70 22.70 39.20 12.20 2.41 4.10 -0.43 5.90 0.11 0.17
2008 0.08 6.20 4.50 0.57 25.80 36.80 13.00 2.04 4.10 -0.30 2.80 0.09 0.22
2008.2 0.09 6.20 4.50 0.57 25.80 36.80 13.00 2.04 4.10 -0.30 2.80 0.09 0.22
2008.3 0.04 6.20 4.50 0.57 25.80 36.80 13.00 2.04 4.10 -0.30 2.80 0.09 0.22
2008.4 0.02 6.20 4.50 0.57 25.80 36.80 13.00 2.04 4.10 -0.30 2.80 0.09 0.22
2009 0.03 2.80 10.80 0.62 24.60 39.40 13.00 2.10 4.10 -0.30 4.20 0.08 0.20
2009.2 -1.60 2.80 10.80 0.62 24.60 39.40 13.00 2.10 4.10 -0.30 4.20 0.08 0.20
2009.3 -3.70 2.80 10.80 0.62 24.60 39.40 13.00 2.10 4.10 -0.30 4.20 0.08 0.20
2009.4 0.01 2.80 10.80 0.62 24.60 39.40 13.00 2.10 4.10 -0.30 4.20 0.08 0.20
2010 0.06 3.20 8.50 0.55 23.10 43.90 12.90 2.10 4.10 -0.52 6.20 0.08 0.22
2010.2 0.02 3.20 8.50 0.55 23.10 43.90 12.90 2.10 4.10 -0.52 6.20 0.08 0.22
2010.3 0.09 3.20 8.50 0.55 23.10 43.90 12.90 2.10 4.10 -0.52 6.20 0.08 0.22
2010.4 1.80 3.20 8.50 0.55 23.10 43.90 12.90 2.10 4.10 -0.52 6.20 0.08 0.22
2011 0.01 3.10 5.70 0.59 23.50 42.90 12.90 1.83 4.10 -0.62 8.00 0.08 0.22
2011.2 0.06 3.10 5.70 0.59 23.50 42.90 12.90 1.83 4.10 -0.62 8.00 0.08 0.22
2011.3 -0.70 3.10 5.70 0.59 23.50 42.90 12.90 1.83 4.10 -0.62 8.00 0.08 0.22
2011.4 0.04 3.10 5.70 0.59 23.50 42.90 12.90 1.83 4.10 -0.62 8.00 0.08 0.22
2012 -1.00 3.50 8.00 0.62 23.40 47.90 12.90 1.50 4.00 -0.49 7.50 0.09 0.33
2012.2 0.01 3.50 8.00 0.62 23.40 47.90 12.90 1.50 4.00 -0.49 7.50 0.09 0.33
2012.3 0.00 3.50 8.00 0.62 23.40 47.90 12.90 1.50 4.00 -0.49 7.50 0.09 0.33
2012.4 -1.60 3.50 8.00 0.62 23.40 47.90 12.90 1.50 4.00 -0.49 7.50 0.09 0.33
2013 0.03 3.70 3.80 0.56 23.70 44.10 12.90 1.81 3.50 -0.42 10.70 0.09 0.44
2013.2 0.03 3.70 3.80 0.56 23.70 44.10 12.90 1.81 3.50 -0.42 10.70 0.09 0.44
2013.3 0.05 3.70 3.80 0.56 23.70 44.10 12.90 1.81 3.50 -0.42 10.70 0.09 0.44
2013.4 0.01 3.70 3.80 0.56 23.70 44.10 12.90 1.81 3.50 -0.42 10.70 0.09 0.44
2014 0.03 0.50 6.20 0.55 23.40 45.50 13.00 1.87 3.20 0.26 13.10 0.08 0.52
2014.2 0.04 0.50 6.20 0.55 23.40 45.50 13.00 1.87 3.20 0.26 13.10 0.08 0.52
2014.3 0.02 0.50 6.20 0.55 23.40 45.50 13.00 1.87 3.20 0.26 13.10 0.08 0.52
2014.4 0.04 0.50 6.20 0.55 23.40 45.50 13.00 1.87 3.20 0.26 13.10 0.08 0.52
2015 0.04 2.90 5.30 0.44 23.80 55.47 13.30 2.13 3.00 -0.29 14.20 0.08 0.44
2015.2 0.01 2.90 5.30 0.44 23.80 55.47 13.30 2.13 3.00 -0.29 14.20 0.08 0.44
2015.3 0.05 2.90 5.30 0.44 23.80 55.47 13.30 2.13 3.00 -0.29 14.20 0.08 0.44
2015.4 0.06 2.90 5.30 0.44 23.80 55.47 13.30 2.13 3.00 -0.29 14.20 0.08 0.44
2016 0.04 5.10 3.40 0.47 24.10 55.47 13.50 1.58 2.70 -0.35 17.70 0.07 0.44
2016.2 0.02 5.10 3.40 0.47 24.10 55.47 13.50 1.58 2.70 -0.35 17.70 0.07 0.44
2016.3 0.02 5.10 3.40 0.47 24.10 55.47 13.50 1.58 2.70 -0.35 17.70 0.07 0.44
2016.4 0.03 5.10 3.40 0.47 24.10 55.47 13.50 1.58 2.70 -0.35 17.70 0.07 0.44
2017 0.01 3.40 3.10 0.45 21.90 54.90 13.50 1.33 2.80 -0.25 19.20 0.06 0.40
2017.2 -1.80 3.40 3.10 0.45 21.90 54.90 13.50 1.33 2.80 -0.25 19.20 0.06 0.40
2017.3 0.00 3.40 3.10 0.45 21.90 54.90 13.50 1.33 2.80 -0.25 19.20 0.06 0.40
2017.4 0.02 3.40 3.10 0.45 21.90 54.90 13.50 1.33 2.80 -0.25 19.20 0.06 0.40
2018 0.00 5.30 1.70 0.48 21.90 54.10 13.50 1.34 2.70 -0.20 20.40 0.05 0.36
2018.2 0.02 5.30 1.70 0.48 21.90 54.10 13.50 1.34 2.70 -0.20 20.40 0.05 0.36
2018.3 0.02 5.30 1.70 0.48 21.90 54.10 13.50 1.34 2.70 -0.20 20.40 0.05 0.36
2018.4 0.06 5.30 1.70 0.48 21.90 54.10 13.50 1.34 2.70 -0.20 20.40 0.05 0.36

Business and Economic Research
ISSN 2162-4860
2020, Vol. 10, No. 4
http://ber.macrothink.org 12
B. Compressed dataset (annual figures only)
Copyright Disclaimer
Copyright for this article is retained by the author(s), with first publication rights granted to
the journal.
This is an open-access article distributed under the terms and conditions of the Creative
Commons Attribution license (http://creativecommons.org/licenses/by/4.0/).