a quick guide to expert .net reporting tools
TRANSCRIPT

A Quick Guide to Expert .NET Reporting ToolsLearn how to beautifully presentany analytical and business data
EBOOK

© 2020 Progress. All Rights Reserved. 2
ContentsIntroduction / 3
Choosing a Reporting Solution / 5
The Expert .NET Reporting Tool: Telerik Reporting / 6
Presentation: Report Creation, Styling, Interactivity and Organization / 7
Report Creation / 8
Report Styling / 13
Powerful: Full Control Over Data / 20Data Sources / 21
Data Manipulation / 21
Productive: Viewing Reports in Any Desktop or Web Application / 25
Embedding Reports / 25
Limitless Report Viewers / 26
Pliable: Unlimited Delivery Capabilities / 28Rendering / 28
Export Options / 28
Accessibility / 29
Performant: Modernization and Line-of-Business Solutions / 29
Futureproofing / 30
Modern / 30
Line of Business Solutions / 30
Price: Reporting Solution Value / 34Building vs. Buying / 34
Conclusion / 38
Get Started Today / 38Tried Telerik DevCraft? / 39

© 2020 Progress. All Rights Reserved. 3
Introduction Clear and accurate reporting tools play a pivotal role in any business decision today. As
organizations strive to become more data-driven, vivid presentations offer a powerful
vehicle to harness and understand information. However, visualization as a tool is not new.
For centuries, visualizations have been helping people make sense of data and complex
notions, and tracing back the origins of visual storytelling will hopefully provide a solid
foundation for choosing an expert reporting tool.

© 2020 Progress. All Rights Reserved. 4
A Brief History of Data VisualizationIn 1644, Michael Florent van Langren, a Flemish astronomer, is believed to have provided
the first visual representation of statistical data. It was a one-dimensional line graph that
showed the twelve known estimates at the time of the difference in longitude between
Toledo and Rome. The graph also linked each estimate to the name of the astronomer
who provided it. What is notable here is that while Van Langren could have provided this
information in a table, it is the use of the graph that visually displays the wide variations in
estimates.
Then, in the 18th century, we observe the beginning of thematic mapping. This period
also gave us William Playfair, widely considered the inventor of many of the most popular
graphs we use today (line, bar, circle, and pie charts). Many statistical chart types, including
histograms, time series plots, contour plots, scatterplots, and others were invented during
this period.
At the beginning of the 19th century and continuing today, we continue to see dramatic
and interesting developments in data visualization. From one and two-dimensional maps
and charts to multidimensional presentations of big amounts of data. There has been
tremendous development strongly supported by advancements in technology.
Data visualization is a general term that describes any effort to help people understand
the significance of data by placing it in a visual context. Patterns, trends, and correlations
© 2020 Progress. All Rights Reserved. 5
that might go undetected in text-based data can be exposed and recognized easier with
data visualization tools.
Today’s data visualization tools, also called reporting tools, go beyond the standard charts
and graphs used in the earlier periods. They can display data in more sophisticated ways
such as infographics, dials and gauges, geographical maps, heat maps, and detailed bar,
pie, and other charts. This is due to the advancement of digital information in today’s
business environment.
Business processes and people are moving information at incredible speeds thanks to
the adoption of digital information. This has forced businesses to adopt digital workflows
to exchange information quickly. An example of this might be a stock brokerage or bank
transactions are done all digitally with the only bottleneck being data transfer rates.
An organization like a bank or an accounting firm or any other company which uses data
for business decisions requires reporting tools that meet specific criteria to operate these
high-end digital workflows. A proper reporting solution is of the utmost importance to
ensure streamlined processes and accurate information is delivered.
It is safe to say that we are living in a Golden Age of data visualization. This brief history
and the state of the current times affirms that behind any smart business decision lies a
significant amount of data visualized in the best possible way. Because of this, a complete
set of reporting tools is critical for well-designed and optimized data visualization.
Choosing a Reporting SolutionPresently, there are many automated reporting tools on the market, offering a variety of
functionalities. It can be hard to navigate them all and choose the best option. In assessing
the best reporting tools, the following criteria are a good place to start:
1. Presentation
2. Powerful
3. Productive
4. Pliable
5. Performant
6. Price

© 2020 Progress. All Rights Reserved. 6
The first step in a reporting process is deciding on the presentation. It goes without
saying that, to present something beautifully, it should be easy and intuitive to create.
For example, designing a report with a drag-and-drop, what-you-see-is-what-you-get
(WYSIWYG) approach is simpler and users enjoy it more. It is also expected to apply
uniform styling and it should not take programming wizardry.
During the presentation workflow, there usually comes a time to connect to data. After all,
this is the power of any report. Good reporting solutions connect to many data sources
and data types. Powerful reporting solutions stand out with the ability to manipulate data
to meet presentational needs.
After creating the presentation, it is time to deliver and this needs to be very productive—
fast, efficient and with minimal effort. This is because the report is expected to be seen
in the most possible ways. Stakeholders want to be able to view reports across different
platforms like web and desktop. Additionally, reporting workflows may require pliability in
delivery as the report may need to be consumed simultaneously as a presentation and a
data source.
To meet the powerful presentation criteria, the underlying reporting engine should also be
performant. A major expectation of a reporting engine is to integrate with and/or build a
variety of line-of-business (LoB) applications to deliver reports. The ability to create these
applications extends the reporting solution.
As with any solution, the benefits should outweigh the price. At a minimum, the solution
should meet the previous criteria. However, it should still provide enough extensibility
allowing the end user to build whatever solution they choose. These 6 Ps—Presentation,
Powerful, Productive, Pliable, Performant and Price—are the cornerstone of choosing an
expert reporting solution.
The Expert .NET Reporting Tool: Telerik ReportingProgress® Telerik® Reporting offers a complete feature set for report creation, styling and
interactivity. The intuitive Standalone Desktop, Web and Visual Studio Integrated Report
Designers ensure “pixel-perfect” presentation with sophisticated features like conditional
formatting, report books with table of contents, custom interactive actions, PDF security,
private fonts, continuous paper printing and much more. This enables report designers to
easily create complex reports from anywhere.

© 2020 Progress. All Rights Reserved. 7
Powerful data connectivity is achieved at design time in data source components with
no-code report item bindings that can bind to several sources simultaneously. This
includes Microsoft SQL Server Analysis Services cubes, ADO.NET data sources, relational
databases, business objects, ORMs and XML. Programmatic data binding at runtime is also
supported. Productive developers can also quickly integrate reports in responsive HTML5/
JS, Angular, React, Vue and ASP.NET web apps (Blazor, ASP.NET Core, ASP.NET MVC and
ASP.NET Web Forms), as well as desktop apps (WPF, WinForms and UWP), enabling a
deliver-anywhere experience.
Expanding on the deliver-anywhere experience, Telerik Reporting includes pliable reports
that can be easily exported to more than 15 formats. The supported formats include DOC,
XLS, PDF, PPT, image, CSV and more. All of this is made possible by the modern and
performant reporting engine. Furthermore, Progress® Telerik® Report Server builds on
everything that Telerik Reporting offers by accommodating large enterprise scenarios with
distributive and collaborative functionality as a turn-key solution. I will unroll the topic of
turn-key solutions some paragraphs below.
To summarize, Telerik Reporting enables simple presentation design with powerful control
over the data from anywhere. It empowers developers and designers with a productive
and pliable workflow, which is supported by the performant reporting engine, to deliver
reports everywhere. And it does all of this at an affordable price for an organization of any
size.
Presentation: Report Creation, Styling, Interactivity and OrganizationThe presentation in a complete reporting solution is understood as tooling that is suitable
for any user on any platform. A report designer provides a graphical interface where
developers or users can define data sources, datasets and queries, layout positions for
different data fields, using a set of data items like Crosstab (for pivots), Table, Graph (for
charts), Map, Choropleth and interactive features, such as parameters and sets of reports
that work together. The report designer is the heart of reporting tools that provides a
guided flow for report creation and styling.

© 2020 Progress. All Rights Reserved. 8
Report CreationThe designer should be easily accessible and intuitive, requiring minimal training to use
and should work across different form factors. The designer tool’s job is to abstract the
complexities of designing a report. By providing numerous styling capabilities, such
as conditional formatting, CSS-like styling and countless wizards, it helps users create
complex report layouts, style reports beautifully, manipulate data and build visually
appealing presentations. Generally, there are different types of report designers grouped
by platforms.
In Telerik Reporting, there are three report designers across desktop and web-based
platforms. The desktop designers include the Standalone Desktop Report Designer
and the Visual Studio Report Designer. It also comes with the full-featured Web Report
Designer. These are available with every Telerik Reporting license. While each has the
same functionality, they do provide different benefits to the end user.
Desktop Report DesignersDesktop Report Designers are generally self-contained applications or tooling that is used
with an Integrated Development Environment (IDE). These also target different users. The
self-contained application targets power users and the IDE tooling targets developers who
need advanced capabilities like hooking into the report processing lifecycle.
Telerik Reporting includes two variants of the desktop designer: The Standalone Desktop
Report Designer and the Visual Studio (VS) Report Designer. Choosing between the
designers relies upon the needs of the report and the preferences of the report author or
developer.
Standalone Desktop Report Designer The Standalone Desktop Report Designer enables end users to start from scratch with
easy drag-and-drop design or by choosing from the huge library of pre-defined templates.
It allows them to create, design, edit, preview, save, export and print reports seamlessly and
without any code.
A report designer gets distributed with every installation of Telerik Reporting. The
standalone tool is fully featured for creating and editing declarative report definitions. It is
distributed to end users as a self-contained executable, named Telerik.ReportDesigner.exe.
The Standalone Desktop Report Designer offers a complete feature set for editing reports
(.trdx and .trdp files) and report books (.trbp files). The interface offers a ribbon bar with

© 2020 Progress. All Rights Reserved. 9
multiple tools for layout, formatting, insertion of various report items, data sources addition
and viewing options. It also offers dedicated contextual editing based on the currently
selected report item.
The Standalone Desktop Report Designer also has extensibility options from its
configuration file, so that custom user functions and business objects can be accessed
while working with the report. In the case that more customization is needed, then the IDE
designer is more suitable.
Every report designer starts in the Report Design Surface, the heart of the designer,
bringing the visual representation of the report and all its child items, enabling pixel-
perfect item movement and resizing. It displays visual cues like snap lines, item offsets
from the parent bounds, overlapping warnings and more. There are many important
Graphical User Interface (GUI) areas of the design surface.
One area of the designer is the Report Explorer. It provides a visual tree representation
of the parent-child relationship for all items, where the report item itself as a root item.
Another important area is the Data Explorer. It lists the available fields, including the
calculated fields, and allows easy drag-and-drop behavior to insert new data-bound text
labels in the report. The designer also includes classical Visual Studio style Properties Grid
area, allowing a granular setup of extensive report-creation APIs.

© 2020 Progress. All Rights Reserved. 10
Visual Studio Report DesignerThe Visual Studio Report Designer is a tool fully integrated into the famous IDE with
a WYSIWYG design surface, New Item support, Properties Grid integration and three
dedicated tool windows. This makes it a full-featured tool for creating and editing compiled
(CS or VB) report definitions. It gets integrated into the existing Visual Studio instances
on the developer machine from the Telerik Reporting product installer as a Visual Studio
Extension (VSIX) package.
The designer offers to start a new report, using various templates and setups like a
band, table, crosstab and label reports. These templates will guide the user through
adding data sources and creating the report. The designer also exposes all the necessary
tools for editing compiled reports, report books and project level reporting data source
components.
Desktop designers are relatively similar in visual appearance and functionality. The
exception here is that, when using the Visual Studio Report Designer, the source code is
also visible, which enables hooking into specific events for Report Items to slightly alter
the Report Processing Lifecycle. It is also easier to create and distribute Custom User
Functions, allowing for more complex calculations.
The main window of the Visual Studio Report Designer is the Report Design Surface. Like
the Standalone Report Designer, it provides a visual representation of the report and all
its child items. It also displays the visual cues like snap lines, item offsets from the parent
bounds, overlapping warnings and specialized tools for a table, crosstab and map data
items. The difference is the additional design editor areas are dedicated windows.
One of the dedicated windows of the designer includes the Report Explorer. It provides a
visual tree representation of the parent-child relation, with the report item itself as a root
item. Another dedicated window is the Data Explorer. It lists the available fields, including
the calculated fields, and allows easy drag-and-drop behavior to insert new data-bound
text labels in the report. The Group Explorer window resembles the hierarchy of the data
item groups and provides easy access to their properties. The designer also includes
classical Visual Studio style Properties Grid area allowing the granular setup of extensive
report creation APIs.

© 2020 Progress. All Rights Reserved. 11
The window editors offer granular Style, Conditional Formatting, Grouping, Style Sheets
alternation and many more. Upon edit, the report author may run the handy built-in
report preview functionality to make sure the intended layout is achieved. A recent useful
addition is the Upgrade Wizard that can be accessed from the dedicated Telerik menu.
This updates the Telerik Reporting assembly references and other versioned resources
when a new Telerik Reporting product version gets installed and the project is opened.
Web Report DesignersThe idea of a Web Report Designer is to deliver the same report authoring experience as
the Standalone Desktop Report Designer, only through the web. This allows anyone to edit
a report and access it from anywhere. It is designed as any existing Software-as-a-Service
(SaaS) reporting solutions.
Web Report Designer offers easy-to-use layout for a fine-grained WYSIWYG functionality.
It features most functionalities of Desktop Report Designers and adds more. A big benefit
is enabling developers and report authors to bring report editing functionality to their end
users right from their web applications.

© 2020 Progress. All Rights Reserved. 12
Web Report DesignerWeb-based Report Designer, or simply Web Report Designer, is the next-gen tool to
deliver report editing capability to end users without their having to leave the web
application. Unlike other report designers, it is a control, a jQuery widget, so that it can be
fully integrated into any web application. The vision for it is to provide the next level of
user experience editors so that less-technical end users feel comfortable with it. With this
designer, users may create and edit declarative report definitions (.trdx and .trdp files) and
report books (.trbp files), which can also be used in the Standalone Report Designer.
Architecturally, the Web Report Designer relies on a web service backend that retrieves
and saves the report definition. It is fully customizable so that reports can be saved in a
database or storage of choice. The web service is implemented into a .NET Core or .NET
Framework Web API controller. The client-side jQuery widget is built using the Progress®
Kendo® UI widgets. The widget exposes options, determining the initially loaded report,
its behavior and its view. Having this architecture, the designer gets easily deployed to the
end user as part of the web application.
The designer implements a rich feature set for creating and editing reports. The
workbench offers a top toolbar area with carefully chosen functionality to make it simple
and guiding for the end user. The central area of the designer displays the Report Design
Surface, providing the visual representation of the report and all its child items.
The Report Item Toolbox tab on the left alternates with the Report Explorer tab. The
former lists all available report item templates and data source templates that the user
can add to the report. The latter provides a visual representation of the parent-child
relationship for all items already part of the report, including the report item itself as a
root item. It also incorporates the available data sources, each with a list of the available
fields, including the calculated fields. On the right, the designer includes a user-friendly
Properties Editor that displays custom, easy to use editors for each item property of the
currently selected item.

© 2020 Progress. All Rights Reserved. 13
In reviewing all three report designers included with Telerik Reporting, it shows a
consistent design experience across each platform. With each designer, there is a design
surface that fully embraces a drag-and-drop, WYSIWYG philosophy and includes sections
for the Report Item Components, a Group Explorer, Data Explorer and the Report Explorer.
The platform availability of each designer enables the ability to create a report anywhere.
Another important facet for presentation is the styling experience.
Report StylingWhen choosing a reporting software solution, it needs to be feature-rich and flexible
enough to author reports quickly and consistently. This makes report styling one of the
core features of a report designer. Concepts like interactivity, actions, and organization also
complement the styling experience.
Because of this, a report designer can provide numerous styling capabilities to display
data in many ways. Each reporting solution may have a different design philosophy. Some
may be more intuitive than others and some may be more granular, offering even more
complexity.
Report styling is one area where Telerik Reporting shines as a reporting solution. Specific
design decisions have been made with styling simplicity in mind. For instance, imagine
styling a report that contains hundreds of report objects—it would be painstaking to
change the style for each object individually.

© 2020 Progress. All Rights Reserved. 14
Styling ExperienceStyling consistency is maintained across reports by using a Stylesheet and Selector
approach. In this way, styling is applied to each report item with the designated selector.
Furthermore, by using data-bound items like maps, charts, crosstabs, and sub-reports,
users can present interactive report decks and other elements like dashboards, reports
by region, invoices, inventory reports, barcode reports and much more. This data-bound
styling is possible because of conditional formatting and data-driven styling features like
bindings.
Granular and Reusable Styling: Every Designer’s Dream
The built-in styling model, which is very similar to cascading style sheets, provides fine-
grained and reusable customization of report elements with specially designed editors.
With the cascading style sheet mechanism, all aspects of the report elements’ style can
be defined. These include fonts, borders, alignments, colors, background colors and more.
Styles can then be assigned by using selectors, such as type, attribute, style name and
descendent. Telerik Reporting automatically applies the assigned style to the selector
according to their precedence to the targeted report elements.
For further reuse, the rules can be exported to a portable stylesheet XML file that can be
shared between reports. Thus, all future reports’ styling will be consistent and, in most

© 2020 Progress. All Rights Reserved. 15
cases, will only need the appropriate style name to be set or a small inline style change
to be made. If a change to report styling is required later, change only the portable
stylesheets and all the reports will have a new style. This enables theme-like styling
throughout with shared stylesheets.
In a real-world example, a report designer might add a style to the report’s style sheet
with a TypeSelector of TextBox. That style will be inherited and applied to all textbox
report items in the report. If the report designer chooses only the textboxes in the page
header to have a thicker border, they can use a Descendant selector as well. Additionally, a
StyleSelector with a special background can be assigned that style to targeted textboxes.
Of course, later all those selectors and styles can be reused for other reports with an
external stylesheet.
© 2020 Progress. All Rights Reserved. 16
Data Driven Styling: Data and Styles in Union for Great Reports
Another must-have for styling in reporting solutions is conditional formatting. Conditional
formatting dynamically styles report items based on pre-defined rules that use report data
or functions. With conditional formatting in Telerik Reporting, the visual appearance of
the report can change based on the conditions in the report data without any coding or
events. It could be applied to any report item, including sections and the report itself.
Conditional formatting contains a collection of formatting rules that are evaluated in
the order they are defined. Each rule has an associated style that changes the styling
characteristics (e.g. background, colors, text style, general style, etc.) when the rule is
fulfilled. To make styles conditional, a condition is defined using an expression, operator
and value. The expression can be a data field from a data source or a complex expression
with multiple fields and sophisticated calculations. The operator can be a simple
comparison operator but can also include “like” and additional operators. The value can
be a literal value or again an expression definition. When the condition is met, the rule is
fulfilled and the style is applied.
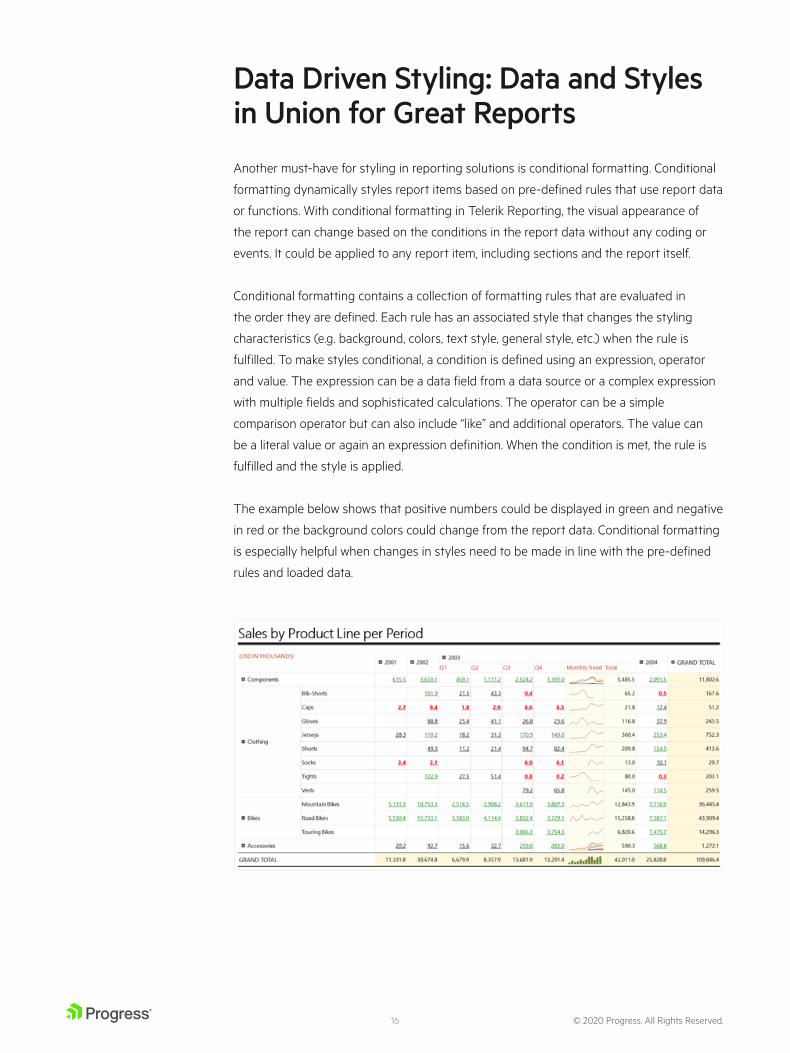
The example below shows that positive numbers could be displayed in green and negative
in red or the background colors could change from the report data. Conditional formatting
is especially helpful when changes in styles need to be made in line with the pre-defined
rules and loaded data.

© 2020 Progress. All Rights Reserved. 17
Bindings: More Data-Driven StylingA very powerful approach to styling can be accomplished with expression bindings. These
are used to modify any expressible property in the report. Expressible properties are
properties that integrate with the Expression editor. They are widely used when designing
reports and provide great flexibility to control the content, style and report behavior.
An expression is evaluated while the report is being processed and can return a new
property value from related data or items. This simple binding between the report item
properties and an expression is accomplished by adding binding expressions to the
binding collection editor. Bindings are priceless when the goal is to alter both the style and
the report layout or modify the data during processing.
One of the most frequent use cases for expression bindings is accessing data from a
parent or child element. This is possible because the entire report is declaratively defined
as a tree structure. More specifically, the structure facilitates obtaining a parent- or child-
element’s data to style a related item. Since this happens during processing, it enables
designers and developers to modify the report and/or its data without any custom event
programming.

© 2020 Progress. All Rights Reserved. 18
Full Control Over the Report ThemeWhat if a user requires multiple styling options for their on-demand preferences? This is
possible with the help of Bindings and Report Parameters. It is as simple as predefining
the Report Parameters values and binding the desired style(s).
Adding InteractivityInteractivity is important for reporting because data can be shaped in different ways,
which can then be used to answer different questions. This makes Interactivity difficult
because it can be described in infinite ways. However, in the context of a reporting
solution, available report actions and report organization are used to create different
report styles.
Telerik Reporting includes adding interactive actions that allow users to perform specific
events within a report. It also enables users to organize reports like books, also known
as Report Books, or in the form of master-detail reports. Many of the actions and
organizational capabilities are complementary and offer unique properties.
Actions in ReportsActions could be defined in reports, allowing users to open web pages, other reports, jump
to a bookmark or drill down to detailed data. Actions are meant to be a non-processing
step.

© 2020 Progress. All Rights Reserved. 19
The Telerik Reporting report engine supports the following action types:
• Navigate to Report: Drill through from one report to the other
• Navigate to Bookmark: Jump to areas within the same report
• Navigate to URL: Navigate to an external web page
• Toggle Visibility: Show or hide items within the same report
• Sorting: Sort items like the Table, Crosstab or Graph
• Custom: An action that contains a collection of parameters to be evaluated during
report processing
The actions are defined using the Edit Action dialog. After the action on a report item is
defined, a user clicks the report item and the specified action takes place. This can help
shape the appearance of the report by linking multiple well-designed reports or systems
together. This is especially helpful when used with the various capabilities for report
organization.
Other stylistic actions are also possible in Telerik Reporting. For example, a table’s
header or row can be frozen to enable navigating a large data set in an interactive report.
Furthermore, tooltips can provide custom descriptions for elements when a user hover
over them.

© 2020 Progress. All Rights Reserved. 20
Organizing ReportsOrganizing reports helps create a style or format of the report. For example, when reading
Shareholder Prospectus versus a 10K/Q. The style of the reports is generally different, but
they are an aggregation of many elements.
Telerik Reporting supports Report Books with a Table of Contents element that allows
printing or displaying many reports in a single file. There are different reasons to use a
Report Book:
• Combine multiple reports into a single document for preview, print and export
• Combine multiple instances of the same report with different settings for preview,
print and export
• Need each report to start on a new physical page or sheet in an Excel workbook
• Need each report to have different page settings like size and orientation
Also, using a Report Book offers a Word-like presentation of data-driven reports, which
is evident with the Table of Contents (ToC). Each report can have its own ToC and the
Report Book Table of Contents (TOC) provides a summary/overview of all the reports
in each Report Book. The Report Book TOC gathers all the TOC entries in all the report
book reports and displays them together in a single TOC, which can be positioned at the
beginning or the end of the Report Book.
Report organization coupled with actions make interactivity an essential part of any
reporting solution. Adding a consistent and simple styling experience makes Telerik
Reporting a breeze for Report designers. Improving on the presentational aspect of Telerik
Reporting is delivering powerful data behind the report anywhere.
Powerful: Full Control Over Data The power behind any report is the data. The complete reporting tool gives developers
full control over their data. It should make use of the most popular data sources like OLAP
cubes, databases, Excel, XML and business objects to compile the reports they need.
The Telerik Reporting Engine can retrieve data from many different data sources with
most of them requiring no programming experience. Once the data is available, features
like grouping, filtering, sorting, aggregating and parameterizing help shape the data in
many ways using an intuitive expression editor.

© 2020 Progress. All Rights Reserved. 21
Data SourcesTelerik Reporting covers a wide array of data sources to meet different needs. The most
used data source is the SQL Data Source, which covers the most popular database
engines. The following is a list of available data sources:
• SQL Data Source: Works with Microsoft SQL Server, MySQL, Oracle, OLE DB, ODBC,
Postgres, Microsoft Access or any database with an ADO.NET provider
• CSV Data Source: Works with a Comma-Separated Values as an embedded source or
local file
• Web Service Data Source: Works with Web Service Data in JSON format
• JSON Data Source: Works with data in JSON format as an embedded source or local file
• Object Data Source: Works with a .NET object model in C# or VB.NET. Allows
displaying data created in the middle tier
• Entity Data Source: Works with ADO.NET Entity Framework
• Cube Data Source: Works with a Microsoft SQL Server Analysis Services OLAP Cube
• Open Client Data Source: Works with OpenEdge AppServer ABL Procedures
In addition to the most popular database engines, Telerik Reporting ships with
approximately twenty free ODBC DataDirect drivers for different databases. This makes
the data source connection options endless.
In Telerik Reporting, the purpose of the data source is to specify declaratively how to
retrieve the data but the source itself does not contain any data. This provides the most
powerful control over the data. It is an abstraction for reading data into a report to shape
the data as desired.
Data ManipulationThe need to shape data is a requirement for any report. Over the long tenure of data
analysis, many ways to shape data have been discovered. These include filtering, sorting,
aggregating and parameterizing. Other important abilities necessary to shape the data are
expressions and calculations.
Telerik Reporting includes many of the well-known data shaping features but extends
upon these with an intuitive expression editor. Additionally, the data retrieved can be
altered with calculated fields, which is an enormous feature as some calculated fields can
be taxing when performed on a server.
The most popular data items—the Report as a SubReport, Table/Crosstab and List—
support standard data shaping functionality. Parameterization can be used in the Report,
Data Source and expressions.

© 2020 Progress. All Rights Reserved. 22
• The SubReport item consists of multiple horizontal sections, one for each part of
the report. For example, data and text in the report header section render at the
beginning of the report, data and text in the page header section render at the
beginning of each page, and data and text in the page footer sections render at the
end of each page. In the middle of the report are the report groups and the detail
section. The report groups are always nested and display data for each value in the
group, which is determined at runtime. The detail section displays at run time one row
for each detail item in the report data source.
• The Table item has a fixed number of columns and displays detail or grouped data by
rows. The Table expands down the page as needed. Detail data can be displayed, row
by row, or grouped by creating row groups. Row groups can be nested or adjacent.
Each row group displays a dynamic row down the page for each value in the group,
which is determined at run time. Static rows for labels or totals can also be added.
• The Crosstab item is derived from the Table item and displays data grouped by
rows and columns. A Crosstab has at least onerow group and onecolumn group. The
Crosstab expands across the page for column groups and down the page for row
groups. The Crosstab cells display summary and aggregate values scoped to the
intersections of the row and column groups. Nested groups and adjacent groups can
also be used to present complex data. The number of rows and columns in a Crosstab
depends on the values for each group, determined at run time. Static rows for labels or
table totals or specific group totals.
• The List item is derived from the Table item and contains one row that repeats for
each value in the data source and displays data in a free-form format. An example for
using a list would be to design a form or display both a table and a chart. With a List, it
is possible to arrange text boxes anywhere in the list to create a layout.
• Report Parameters are used for various purposes like specifying, filtering, sorting and
grouping data, connecting related reports and as an argument to a function.
Since the above items are data items, in addition to data manipulation, they can also be
used with the Expression Editor and calculated fields.
Intuitive Expression EditorExpressions are widely used while designing reports to retrieve, calculate, display, group,
sort, filter and parameterize the data in a report. One major example of an expression
editor is Microsoft Excel. It demonstrates how expressions provide great flexibility to
control the content, style and behavior of reports.

© 2020 Progress. All Rights Reserved. 23
Expressions in Telerik Reporting use the built-in scripting language and are saved in the
report definition. When the report runs, the report processor evaluates the expressions
and substitutes the expression results for the property values. In Telerik Reporting,
expressions can include a combination of constants, operators and references to fields
from the data source, parameters from the report, built-in functions and even to external
or custom code. This is all handled by the easy-to-use Expression Editor.
Any item or property in the report designer that supports an expression includes use of
the editor. This presents a graphical way to create expressions. To open the Expression
Editor when a property is selected, a small ellipse will appear, indicating it supports
expressions.
After opening the Expression Editor, a host of items become available. These include
constant values, built-in functions, logical operators, report parameters and more.
A very powerful aspect of the Expression Editor is access to the data source fields. This
makes calculated fields especially helpful.

© 2020 Progress. All Rights Reserved. 24
Calculated FieldsCalculated fields can be used to create new values that do not exist in the data source.
For example, a calculated field can represent a new value, a constant, an expression value,
a user-defined function, a report parameter or an existing field that is converted to a
different datatype.
The screenshot above illustrates how to create a new data field, presenting a person’s full
name. A calculated field pulls the information from the First Name and Last Name columns
in the database and combines it. The new field values will be available in the report
anywhere the full name data is needed.
The powerful Expression Editor also allows the use of report parameters in calculated
fields.
ParameterizationParameterization is a common topic among database administrators (DBA). However, to
the less DBA–inclined, it might be unusual. The most common use of parameters is for
filtering. The item or items that are being filtered would be distinguished by the parameter
value.
Parameters may contain single or multiple values. Parameter values can be a static list of
values or a dynamic list, tied to a data source. Other usage of report parameters includes
filtering data retrieved from the database with expressions to directly provide a value. This
can also be accomplished in a data item for filtering, sorting or grouping criteria.

© 2020 Progress. All Rights Reserved. 25
To summarize the power of Telerik Reporting, leveraging functionalities like built-in
function expressions, calculated fields and report parameters to shape data in many ways
across the most popular data sources gives report designers and developers full control
over their data.
Productive: Viewing Reports in Any Desktop or Web Application After designing the report presentation, connecting and shaping the data, then comes
the need to deliver the report to an audience. The productivity of a reporting solution lies
in its ability to deliver a report anywhere—the more places a report can be delivered, the
more value it provides. For example, report stakeholders may be viewing the report in a
custom application or on a mobile device through a web browser.
With Telerik Reporting, a developer or report user can utilize the report engine dedicated
APIs for each specific report implementation. This is considered Embedding the Reporting
Engine. It may require programming the report design, processing and rendering the
report. Alternatively, and for convenience, many Report Viewers are included with Telerik
Reporting.
Report Viewers are UI components for displaying the report document produced by
the report engine in an application. Report Viewers can support various technologies
like HTML5/JS, Angular, React, Vue, Blazor, ASP.NET Core, ASP.NET MVC, ASP.NET Web
Forms, WPF, WinForms and UWP. Using the report viewers, the reporting tool might
be integrated (i.e. embedded) with any web and desktop application created with the
supported technologies.
Embedding ReportsWhen embedding reports, the main purpose is to produce a report document using the
report engine. This is achieved by embedding the report engine in an application or
hosting the report engine remotely and exposing the APIs as a service.

© 2020 Progress. All Rights Reserved. 26
Embedding the Report EngineDesktop applications are commonly referred to as monolithic applications. They are
essentially self-contained and may connect to the Internet or not. Everything that the end
user needs is delivered with the desktop application. This is the most beneficial scenario to
embed the report ending.
In Telerik Reporting, .NET desktop applications like WPF and WinForms are most known
for embedding the Report Engine. These types of applications also support hosting the
report engine remotely. The idea is to build and deploy a self-contained application that
can deliver reports. These reports could be designed in any of the designers or defined
programmatically at runtime. Additionally, the monolithic application could connect to the
Report Engine remotely as well.
Hosting the Report Engine RemotelyMany of today’s applications use multiple systems that are connected via the Internet. In
general, the client or frontend is the user-facing application, the middle tier is the business
or service layer and the backend system is the database layer. This describes a simple
Service Oriented Architecture, or SOA for short. It can be thought of as a tiered application
and is most common among line-of-business applications. Today’s modern applications
use a Representational State Transfer (REST) API to communicate with client-heavy
applications that achieve the same architecture, just with different technology.
Telerik Reporting fits nicely into many different types of applications. For example, the
Reporting Engine can be embedded in a monolithic applicationor delivered as a service
through a SOA or a REST API. Telerik Reporting Services has two implementations: The
REST Service and the Windows Communication Foundation (WCF). Presently, the most
widely used service is the Telerik Reporting REST Service. It uses the power of ASP.NET’s
Web API and delivers reports over the internet to any client application.
Limitless Report ViewersTo deliver everywhere means that reports can be viewed as they were designed with pixel-
perfect rendering on any device. To this end, it is important to have many customization
options and intuitive report viewing, exporting and readers. Nearly every device has a web
browser that will work with an HTML5-based Report Viewer.
Telerik Reporting includes a variety of report viewers and each contains the same
capabilities. The list of report viewers includes Plain HTML5/JavaScript, Angular, React,
Vue, Blazor, ASP.NET MVC, ASP.NET Core, ASP.NET Web Forms, WPF, WinForms,

© 2020 Progress. All Rights Reserved. 27
Silverlight and UWP. Because the Report Viewer is based on HTML5 and JavaScript, a
successful experiment allowed building it into a Xamarin application. It works like a native
application in iOS and Android. This is what it means to be limitless.
Customizable Report ViewersOut of the box, Telerik Reporting supports theming in WPF and our web-based viewers.
This is because the WPF Report Viewer uses the UI for WPF framework and the HTML5
Report Viewer uses the Progress® Kendo UI® framework.
Intuitive Report ViewersReport viewers in Telerik Reporting can quickly change the view to print layout and back
with the click of a button. This allows seeing what the report would look like if printed. Also,
Continuous Scroll is the default experience in our report viewers that enables scrolling
through pages. This proves to be a better experience than using a combination of scroll
and button clicks. Furthermore, each of our report viewers comes with a Search in Reports
Dialog that includes expected features like match case and exact match.
Support for AccessibilityProgress® Telerik® has implemented all well-known standards for accessibility in its
desktop and web-based viewers. This enables report designers to build accessibility-
compliant Reports without hassle. Accessible interfaces include keyboard support and
dynamically generated descriptions that can be read by a screen reader, plus localization
for international support.
Succinctly, Telerik Reporting can deliver reports across all platforms. The report can be
embedded in a desktop application or delivered over the internet through a web browser
backed by a REST or WCF application. The report recipient will also enjoy the added
flexibility when using the included Report Viewers, which will expand on the delivery of a
report with more capabilities.

© 2020 Progress. All Rights Reserved. 28
Pliable: Unlimited Delivery Capabilities Expert reporting solutions should not only deliver reports anywhere, but also in different
formats. This is known as rendering the report. Rendering helps flexibly meet the
requirements of the report stakeholder. A suitable example would be an accounting
department that uses a custom-built application to process their financial reports and
export them to PDF files in a shared drive.
In Telerik Reporting, it is possible to export reports in more than 15 formats - Microsoft
Excel or CSV to further manipulate the report data, archive it in PDF format or forward
it via email. It also supports exporting to RTF, MHTML and images, plus printing as
handouts and paper archives.
RenderingAs popularity about a report grows, it comes as no surprise that it will also need to be
viewed in different ways. Particularly, many stakeholders choose to view a report in PDF or
Word formats. Others may want it as an image to be displayed on a large screen around
the office. Additionally, accessibility is important for inclusion as technology has evolved to
enhance everyone’s life. This prompts the need for many rendering options with support
for accessibility as well.
With Telerik Reporting, each of the export options falls under three types of renderers:
data, logical page and physical page renderers. The data renderer is the CSV format and
can be used as a data source for other reports. The logical page renderer is for free-
flowing pages so the page can adapt to the size of the screen. The physical page renderer
is for printed media when the page is more restricted.
Export OptionsA successfully designed report is optimized for the chosen renderer(s). There are 15+
export options in Telerik Reporting, including RTF, image, DOCX, both XLS and XLSX,
and PDF. These are enabled by default and, interestingly, a common question is how to
limit the number of export options. Depending on the renderer selected, certain rules
apply when rendering the report. This informs how items fit together on a page and is
determined by a combination of the following factors:

© 2020 Progress. All Rights Reserved. 29
• Rendering rules
• The width and height of the report items
• The size of the report
• The width and height of the page
• Pagination rules for the renderer
AccessibilityTelerik Reporting includes additional features for the PDF/UA export that will produce a
PDF document with additional metadata and structural elements that meet ISO 14289-1
standards. Elements include tagged contents, description for media items, annotations,
and the document title and natural language.
In reviewing pliability, deliver everywhere also means to deliver in many different formats
at the request of the report stakeholders. The available renderers and export format in
Telerik Reporting make it the most pliable reporting solution. It means a report is only
bound by the technological limitations of the chosen export format. Understandably, to
support presenting powerful data, flexibility and productivity, a reporting solution needs to
also be performant.
Performant: Modernization and Line-of-Business SolutionsGenerating large and complex reports that contain rich graphics can be resource-intensive
and difficult to manage. It is crucial to have a performant and modernized report engine
that can build the report with minimal memory and processor usage. The report engine in
a complete reporting tool is powerful enough to be easily configured and flexible enough
to meet different business requirements.
Business requirements can include features like publishing, exporting, collaborating and
sharing the reports. Design decisions that promote future proofing and modernization
are paramount for meeting these specific requirements. Ultimately, when considering
a reporting solution or any software solution, the technology must work and, most
importantly, people must enjoy using it.
Telerik Reporting has been designed with modernization and line-of-business applications
at its core. In its 15+ years of existence, new features are continuously added to adapt to

© 2020 Progress. All Rights Reserved. 30
modern requirements. These additions to support newer technologies are also evident in a
Progress® Telerik® Report Server deployment.
FutureproofingAs technology improves, performance expectations grow higher. To keep up with the pace
of change, using the latest technology is essential. This is known as futureproofing, or
simply ensuring that the technology will be viable in the future. Futureproofing includes
upgrades, modern features and technical support.
.NET Core is the next iteration of the .NET Framework and will replace it altogether. This
means that the existing full framework will transition to maintenance status with version
4.8 and will only receive security updates.
Telerik Reporting is built on the .NET Framework, however, currently offers .NET Core
Support. Significant and careful design decisions have been made to support the concept
of futureproofing. With Telerik Reporting, a reporting team can enjoy the benefit of always
staying technically relevant and modern.
ModernNo software should be restricted to a single platform. Recently, video game developers
have been adding the ability to save game state across platform. Reporting developers,
stakeholders and designers should enjoy this benefit as well. There should be no limit to
how to view and build their reports.
To fully support multi-platform, with the use of .NET Core, Telerik Reporting can be used
in Linux, macOS, and Docker Containers out of the box. This means any cloud provider
that supports these platforms (e.g. Microsoft Azure) also works with Report Server.
Furthermore, with the use of the HTML5 Report Viewer, the Reporting REST Service and
the Web-based Designer, reports can be designed and delivered anywhere. Today, many
of these technologies are the standard across modern development teams.
Line of Business SolutionsFor LoB or enterprise reporting, turn-key solutions are great as they can support larger teams
that might have limited headcount to build out a custom solution. The idea is to purchase a pre-
built and packaged solution, deploy it and customize it as needed. This approach is safer and
more predictable than building a custom solution since marketed solutions are already tested
and likely support a wider set of functionalities to scale the project.

© 2020 Progress. All Rights Reserved. 31
Telerik Report Server is delivered with similar expectations. Report Server adds value to
Reporting and it is a server-based reporting platform that provides comprehensive report
management functionalities. It provides centralized storage for the reports and various
ways to organize and preview them. It is flexible, customizable and scalable.
FlexibleGenerally, the most bothersome characteristic of turn-key solutions is the lack of flexibility.
Problematic items usually include installation requirements and licensing. The issue with
installation is that it should not require a beast of a server to run. Furthermore, there
should not be hidden licensing fees for extra services or unorthodox support practices
buried in the license.
InstallationInstallation with Telerik Report Server is through a Windows installer that automatically
creates a separate website with its own application pool in Internet Information Services
(IIS), which is Windows Server Web Server.
Telerik Report Server works with 32-bit or 64-bit servers and the only processing limitation
is the amount of RAM installed on the machine. Report Server can also be used with any
browser that is HTML5 compliant, which includes popular browsers like Chrome, Edge,
Opera, Safari and Firefox.
SupportTelerik’s Support policy is designed to provide the highest quality technical support
experience. This applies to all products. As an example, many of the issues related to using
Report Server are environmental. In such circumstance, an engineer can aide the server
administrators by using remote web assistance. Additionally, all support plans include a
24-hour response time with thorough documentation available on the web. This is just one
of the many features available for Telerik Support plans.
CollaborationCollaboration can be difficult to manage across large teams. Nowadays, everyone has a
cloud drive to shares files with other users, which is why a reporting tool is also expected
to foster collaboration. Additionally, users may fear their work will be overwritten or lost.

© 2020 Progress. All Rights Reserved. 32
Every Telerik Report Server installation includes the Standalone Report Designer. It can be
launched directly from the server to begin editing reports. The tool offers full integration
with the server-specific operations like Lock, Save and Publish, which enable the multi-user
collaboration without collisions on a single Report Server instance.
To enable report design collaboration, the report designer gets accessed from end users
by downloading the executable from the Report Server web manager application. If the
client browser supports the ClickOnce deployment technology, the designer gets installed
on the client machine, adding better OS integration.
At the time of writing, the Web Report Designer is also included with Report Server further
to expand its collaborative capabilities. It is enabled experimentally but will soon become
the primary report designer. This means report designers will be able to edit reports
anywhere, using any modern browser.
CustomizableCustomizing packaged software is proverbially difficult to do. There are many ways
customization could be implemented in a turn-key solution. One common practice is using
white labeling to add specific branding. This is typically found in packaged software that is
resold or reused. Another common feature for customizing packaged software is providing
a RESTful API. This is used in a client-server scenario and allows client applications to
perform the same functions as the packaged software.
Telerik Report Server includes many customization options like branding, report delivery,
custom authentication and a REST API for use with custom client applications. With these
customization options, Report Server could look and feel as if the hosting company built it.
BrandingCompanies heavily invest in branding and naturally aim to extend their brand to as many
places as possible, including any technology, tool and third-party software they use. A
common request of teams using a turn-key solution is the ability to change the branding
of the deliverable.
Telerik Report Server supports White-labeling. This includes changing the logo, favicon,
link color, accent color and selected color. Even when launching the Standalone Report
Designer from the server, custom branding is honored with the selected color and accent
colors.

© 2020 Progress. All Rights Reserved. 33
Report DeliveryIt goes without saying that the purpose of a report is to deliver it. In Report Server, this is
accomplished using scheduled tasks. A task ca be scheduled to deliver a report in any of
the 15+ export formats with parameterization. The task manager includes custom email
templates for internal and external users.
REST APIAll the actions available in Report Server are also exposed to a RESTful API. This enables
developers to use the functionality inside their own applications. The API includes Create,
Read, Update and Delete (CRUD) operations for Report Server resources, such as users,
reports, categories and data connections.
ScalableAs application use grows, so does the deployment of the software—this is just the natural
progression of software. Teams get trained and eventually skilled in using applications,
which makes scalability a prerequisite for successful enterprise solutions.
Backup, Restore and Web-Farm SupportIn addition to system requirements, IT departments want easy backup and restore
processes along with web-farm support. The issue occurs when different versions are in
use across different teams, which is never a welcomed scenario. Backing up and restoring
each team becomes a literal nightmare.
For Report Server, there are two different storage models. The first and most basic is
file storage and it could target a shared network drive, a folder in the Report Server
application, or another folder on a different drive. The second is using an external source
like MSSQL Server or Redis. A web-farm environment would use the latter but all support
Storage Backup.
Shared Data SourcesScalability is also closely related to usability. A good example of usability is reports that
embed the connection string, unifying the access to the same connection string across

© 2020 Progress. All Rights Reserved. 34
all reports. A poor example of usability is a reporting team that has over 400 reports on a
single server deployment.
Report Server uses Shared Data Sources. This means that the connections are shared
among the reports hosted by the server instance. For example, an accounting department
could have one primary connection string to the CRM records and several ancillary
connections to different accounting information systems they work with. The key point is
each report on the Server could have access to the connections.
Concluding performance, Telerik Reporting supports the modern technologies which
provides additional multi-platform benefits. The decisions to support modern technologies
ensure future-proof software. This is illustrated in Report Server which is a flexible,
customizable, and scalable Line-of-Business application.
Price: Reporting Solution ValueThe value of a complete reporting solution requires a logical assessment of how the
solution meets organizational requirements and understanding whether the solution will
work when building or buying.
Building vs. BuyingChoosing an expert reporting solution requires evaluating whether to build or buy. Build
of buy is essentially a comparison of what type of solution is most effective: turn-key
solutions that are readily available on the market, custom solutions developed in house
or cloud-deployed solutions. When it comes to turn-key solutions, it is critical to assess
whether each one meets the needs of the business organization. Telerik Reporting
is flexible and extensible enough to deliver pixel-perfect reports in each deployment
method. Below is a comparison of each method’s advantages and disadvantages.
Turn-Key SolutionsTurn-key solutions are packaged software that is hosted on either a virtual or bare-metal
server. The cost is usually the price for the license and, if using a hosting provider, the price
for hosting. Report Server is the turn-key option for Telerik Reporting.

© 2020 Progress. All Rights Reserved. 35
Report Server works exceptionally well with this scenario because it delivers everything
that is needed within the application. In a turn-key scenario, a solution that has low
resource requirements and is easy to update is a common goal. Choosing Report Server
alleviates the high resource requirement and complex management tasks.
Report Server adds significant value to reporting teams that require a collaborative
environment. Reports can be designed locally in the Standalone Report Designer,
published to the server and shared across teams. In this method, each report designer
grabs the latest version, updates the report and publishes the changes. This is usually a
desirable process in large enterprises without a dedicated development team.
Custom-Developed SolutionsCustom-developed solutions give developers full freedom to create exactly what is
needed. Custom solutions start with a blank slate and can be added to an existing
application. The cost usually entails the hourly rate of the developers, working on the
project during and after release, the license and any hosting, if using a hosting provider.
Alternatively, the cost to develop before the release can also be invested and used as a
revenue generator later.
Telerik Reporting Engine can be embedded into any .NET application. An additional
benefit here is the many Report Viewers that deliver reports to any form-factor. This
adheres to the Edit Anywhere and Deliver Everywhere capability.
It also offers the flexibility to implement the desired features without waiting for another
company to decide if the feature is a priority which is the case in some turn-key solutions.
This option provides the most rewards for a reporting solution to meet almost every end
user requirement.
Cloud SolutionsCloud solutions have become quite popular recently and for a good reason. They bid an
alternative to expensive and complex server hosting and infrastructure. There are three
patterns for cloud-deployed solutions: Software-as-a-Service (SaaS), Platform-as-a-Service
(PaaS) and Infrastructure-as-a-Service (IaaS). Reviewing the three cloud patterns—SaaS,
PaaS, and IaaS—will help inform a better decision whether to build or buy a reporting
solution.

© 2020 Progress. All Rights Reserved. 36
Software as a ServiceSaaS is a fully hosted and managed service delivered via web and/or mobile applications.
A company using SaaS generally would not be responsible for hosting and maintaining
the infrastructure or the software. The licensing model is usually Pay-per-User (PPU) on
monthly or yearly intervals and the application is already deployed. Since everything is
managed by the service provider, the end users can reap all the benefits of the latest and
greatest features and do not have to hire a team to manage it.
The Telerik Reporting and Telerik Report Server Licensing Model allows it to be included
or integrated with a SaaS solution. Digital agencies trust Telerik Reporting because it can
be packaged with their software and will not cost per user or even by report run. The
exception to report processing costs is if Telerik Reporting is deployed using the PaaS or
IaaS cloud deployment, models which include some processing charges.
A notable disadvantage of using a SaaS solution for a reporting solution is that rollout and
adoption can be painstaking. Each SaaS solution is developed by a team of individuals
with different UX and development philosophies. This means that not every SaaS solution
will work with every other software. A way around this is to hook into the API, if one is
provided, and integrate the systems.
Platform as a ServicePlatform as a Service is a fully hosted and managed platform delivered via a platform
provider. A PaaS exposes nearly everything needed at the software level to deliver a custom-
developed solution. The licensing model is usually Pay-as-you-Go (PAYG) and includes data-
in, storage and virtual core usage. New services are delivered at astounding rates because
the platform providers manage the infrastructure and can deliver these services through
custom development. To lower up-front costs, projects can be developed locally, which does
not require the use of the platform until later in the release cycle. Still, this requires no hosting
or management costs other than the team developing and deploying the software.
Telerik Reporting’s Report Processing Engine can be hosted remotely to allow some
infrastructure to be located off platform, which can circumvent potentially high processing
costs. This is a true pleasure in a PaaS application as it can be integrated into an on-premises,
SaaS or IaaS application simultaneously.
Many choose to deliver a PaaS solution because of their strong development team and the
added benefits of custom-developed solutions. One concern that surfaces in a PAYG scenario
is that costs can be less manageable due to spikes in processing. Period that typically entail
higher usage can drive higher costs. A specific example would be during an operational
event like quarterly or year-end reporting.

© 2020 Progress. All Rights Reserved. 37
Infrastructure as a ServiceInfrastructure as a Service is essentially a virtual machine managed by a company and
hosted by a platform provider. This scenario offers full control over the virtual server.
Frankly, it is a server rental. A company is responsible for keeping the server up to date but
does not have to host the machine, which can save on storage space. If the server is going
to run at 100% uptime, then the cost can be predictable and simpler with a packaged
solution. Simply put, there is little abstracted away from the teams performing the
deployment. In addition, failover is managed by the IaaS provider to ensure their uptime
service level agreement (SLA).
Telerik Report Server includes a REST API that can be integrated with PaaS or SaaS
applications. In addition, this also enhances the benefit of hosting on premises or in an
IaaS environment. It provides the most cost-effective and flexible approach for delivering
reports in a turn-key solution.
A disadvantage occurs when integrating a packaged reporting solution. It can feel locked
into features that were chosen by the software vendor. Additionally, there is a need to
lower the resource requirements for hosting the application.
Each organization has different business requirements. Telerik Reporting and Report
Server are flexible enough to empower a reporting team to edit reports anywhere and
deliver everywhere. This flexibility is also extending in a turn-key, custom-developed or
cloud solution.
© 2020 Progress. All Rights Reserved. 38
Conclusion One final consideration that does not fit in any of the 6Ps is understanding the difference
between reporting solutions and business intelligence (BI). Most notably, BI is not a
reporting solution. These are different things that serve different purposes. To elaborate,
reporting communicates what HAS happened and BI tries to build on that by adding what
CAN happen. Alas, not everything that can happen will happen. That is not to discredit BI,
it is useful, but these tools are useful for different purposes.
In conclusion, this document presented a six-step framework to aid the analysis of whether
a solution will meet the expert needs of an organization. Telerik Reporting is a natural
fit for today’s business demands with its report designers that are consistent and easy
to use on any platform. The number of data sources and data manipulation options
empower designers and developers to create beautiful and interactive visualizations while
effortlessly supports their work process. Developers, designers and stakeholders alike can
achieve greater productivity and flexibility when delivering reports anywhere using the
Report Viewers or any export format. This is all backed by the modern and future-proof
Reporting Engine. The engine also drives Telerik Report Server, which can be used in any
large enterprise scenario or as a custom developed solution or integrated with a cloud
solution.
Get Started Today Take our reporting tools for a spin—try out the latest versions today with a FREE trial.
Try Telerik Reporting Telerik Reporting is a complete, lightweight, easy-to-use and powerful .NET reporting tool
for web and desktop applications that supports: ASP.NET Core, Blazor, ASP.NET MVC,
ASP.NET Web Forms, HTML5, Angular, React, Vue, WPF, WinForms. With Reporting
tool any developer or reporting user will be able to create, style, view and export rich,
interactive and reusable reports to attractively and beautifully present any analytical and
business data. The reports can be added to any web and desktop business application
through report viewer controls. The ready reports can be exported to more than 15
formats.

© 2020 Progress. All Rights Reserved. 39
Try Telerik Report Server Telerik Report Server is an end-to-end report management solution which helps
transform raw data into actionable business insights and then stores and distributes
these insights within the business. Report Server comes bundled as a lightweight web
application that can be downloaded and run on user local web server. Once its installed,
it enables the company to store all reports in a single server-side repository. It comes
packed with a variety of line-of-business features like report scheduling, data alerts and
e-mail notifications, user management, authentication and authorization and rebranding
functionality.
Tried Telerik DevCraft?You can choose Telerik Reporting and Telerik Report Server as individual products or
enjoy them as part of the great DevCraft bundles.
Try Telerik DevCraftTelerik DevCraft is the finest software developer tools collection across .NET and
JavaScript technologies, which includes modern, feature-rich and professionally
designed UI components for web, desktop and mobile applications, reporting and report
management solutions, document processing libraries, automated testing and mocking
tools from the Telerik and Kendo UI suites. DevCraft will arm you with everything you need
to deliver outstanding applications in less time and with less effort. With the backing of our
legendary support team, which consists of the developers who build the products, and a
ton of resources and trainings you can rest assured that you have a stable partner to rely
on for your everyday challenges along your software development journey.

About Progress
Progress (NASDAQ: PRGS) offers the leading platform for developing and deploying strategic business applications. We enable customers and partners to deliver modern, high-impact digital experiences with a fraction of the effort, time and cost. Progress offers powerful tools for easily building adaptive user experiences across any type of device or touchpoint, the flexibility of a cloud-native app dev platform to deliver modern apps, leading data connectivity technology, web content management, business rules, secure file transfer, network monitoring, plus award-winning machine learning that enables cognitive capabilities to be a part of any application. Over 1,700 independent software vendors, 100,000 enterprise customers, and two million developers rely on Progress to power their applications. Learn about Progress at www.progress.com or +1-800-477-6473.
© 2020 Progress Software Corporation and/or its subsidiaries or affiliates. All rights reserved. Rev 2020/06 RITM0082320
Worldwide Quarter
Progress, 14 Oak Park, Bedford, MA 01730 USA Tel: +1-800-477-6473
www.progress.com
facebook.com/progresssw
twitter.com/progresssw
youtube.com/progresssw
linkedin.com/company/progress-software
To learn more, visittelerik.com/products/reporting.aspx
Author Eric Rohler is a Senior Technical Support Engineer at Progress. He covers all
Telerik DevCraft products, specializing in .NET tools like UI for Blazor, AJAX,
Reporting and Fiddler. When he is not nose-deep in computer screens, he
enjoys spending time with his family and working out.