a randomised control trial of corneal vs. scleral rigid
TRANSCRIPT
A randomised control trial of corneal vs.
scleral rigid gas permeable contact lenses for
ectatic corneal disorders
Mr. Alexander Levit
https://support.orcid.org/hc/articles/360006896894
A thesis submitted in partial fulfilment of the requirements of London
Southbank University for the degree of Professional Doctorate in Optometry
February 2019

ii
Thesis Abstract
Introduction. Keratoconus and related corneal ectatic disorders are conditions characterised
by a misshapen cornea. Keratoconus is typically managed with corneal rigid gas permeable
contact lenses (CRGPcl) and when these are unsuccessful patients may be fitted with the much
larger scleral rigid gas permeable contact lenses (SRGPcl). It has been hypothesised that due
to their superior performance, SRGPcl might be considered as the first option for management
of keratoconus and the present research investigates this hypothesis.
Purpose. To assess the visual performance, vision related quality of life (Qol) and subjective
perception of vision (SPV) and the subjective perception of comfort (SPC) in two contact lens
types: CRGPcl and SRGPcl, in successful CRGPcl wearers with keratoconus (and related
ectatic corneal disorders).
Methods. Thirty-four successful CRGPcl wearers, with keratoconus or related disorders,
participated in a crossover randomised control trial (RCT). This research was approved by the
National Research Ethics Service (NRES) of London-Camden and King’s Cross as well as the
research ethics committees of London South Bank University (LSBU) and the Institute of
Optometry. Participants were randomised into two groups, group 1 (sequence AB) were fitted
with new CRGPcl and after a washout period, in which habitual CRGPcl were worn, were
fitted with and crossed-over to SRGPcl. Group 2 were first fitted with SRGPcl and after a
washout period were fitted with and crossed-over to new CRGPcl (sequence BA). Data for
experimental outcome measures were collected three times: first on recruitment in habitual
CRGPcl, and once after each period in experimental CRGPcl and SRGPcl. The outcome
measures were: The Early Treatment Diabetic Retinopathy (ETDRS) log of minimum angle of
resolution (logMAR) best corrected visual acuity (BCVA); the VectorVision 1000E contrast
sensitivity function (CSF), expressed in both numeric and log contrast sensitivity (logCS); the
National Eye Institute Visual Function Questioannaire-25 (NEI-VFQ) to assess the visual Qol;
and the reported SPV and SPC, recorded on a Likert-like scale from 1–10. The final measure
was at the end of the second period, each participant selected the preferred lens type, out of the
two experimental lenses, for future habitual use.
Results. Thirty participants completed the trial, 13 in group 1 and 17 in group 2.
Randomisation demographics revealed no significant differences between the two
iii
randomised groups except in corneal pachymetry (thickness): group 1[Mean 423.2 (±45.1)],
group 2 [Mean 462.8 (±44.7)] (p= 0.002).
The SPC in the experimental lenses and the SPC in the experimental CRGPcl in participants
who selected CRGPcl as the habitual lens for future use, were the only measures, which
exhibited significant differences. The SPC was not-normally distributed in SRGPcl,
[Median=9.0, IQR=2.0, Mean=8.85, (±1.10)] and normally distributed in CRGPcl
[Mean=7.78, (±1.45), Median=8.0, IQR=2.0]. The intra-subject period differences in SPC
between group 1 (Median=1.0) and group 2 (Median=-1.0), revealed significantly higher
scores in SRGPcl (p=0.002), rejecting H0. The preferred habitual lens choice outcome was:
14 participants (47%) chose SRGPcl and 16 (52%) chose CRGPcl. Higher SPC scores in the
experimental CRGPcl, were found in participants who chose CRGPcl, (p=0.006) and
(p=0.009) by independent samples t-test and Mann-Whitney U test respectively, rejecting H0.
The only significant carryover effect was found in the logCS scores (p=0.019), no other
outcome was found to have significant carryover or period effects.
No other outcome was found to have significant differences between the two lens types,
supporting H0, with respect to: the ETDRS logMAR BCVA, the CSF numeric and logCS, the
specific logCS at 6 cycles per degree (CPD), the 12 domains of the NEI-VFQ, the specific
ocular pain domain of the NEI-VFQ and the SPV.
Conclusion. The research population exhibited significantly better comfort in SRGPcl
compared with CRGPcl, as measured by the Levit Subjective Comfort Scale (LSCS).
Furthermore, participants who chose to remain in CRGPcl had significantly higher LSCS
scores in CRGPcl than those who chose SRGPcl. Successful CRGPcl wearers whose LSCS in
CRGPcl is < 7 are likely to achieve better comfort / tolerance with SRGPcl. No significant
differences were found in this research population between the two experimental lens types, in
the visual outcomes of logMAR, logCS and SPV and no significant difference was found in
the visual Qol outcomes in the 12 domains of the NIE-VFQ. This research indicates that on
average, successful CRGPcl wearers find SRGPcl more comfortable and there should be no
visual and visual Qol advantage or disadvantage in refitting successful keratoconic CRGPcl
wearers with SRGPcl and vice versa.

iv
Research purpose statement
The purpose of this research was to determine whether significant differences in a number of
outcome measures could be established, when comparing the performance of CRGPcl versus
the performance of SRGPcl in participants with keratoconus, who are successfully managed
with habitual CRGPcl wear. It was hoped that the findings of this research may help to
formulate the scope of application of SRGPcl in the management of keratoconus and other
ectatic corneal disorders.
Acknowledgements
I would like to thank my supervisors Prof Bruce Evans and Dr Martin Benwell, for their support
and invaluable advice throughout the research and writing of this thesis. It has been a privilege
and a pleasure to work with them.
I would like to thank the contact lens manufacturers: Alden Optical, Bausch & Lomb and
Menicon David Thomas for supplying all the experimental lenses for this research free of
charge.
Special thanks to the research coordinator optometrist Mr Anthony Stanton and the clinical
assistant optometrist Mr Daniel Gorjian for their help in research management and as naive
data collectors. Dr Robert Marks, who designed and constructed the data entry system used in
this research and my son Dan Levit for his help with computer technology.
v
Contents
List of abbreviations…………………………………………………………………….…... 1
List of tables…………………………………………………………………………….….… 3
List of figures………………………………………………………………………………… 6
List of appended items……………………………………………………………………... 10
Chapter 1: Introduction...…………………………………………………………………. 12
The structure and function of the human cornea and sclera………………………………….12
Corneal refractive properties…………………………………………………………………18
Visual acuity.…………………………………………………………………………………20
Contrast sensitivity.…………………………………………………………………………..26
Summary………………………………………………………………………………….….29
Chapter 2: Literature review, keratoconus and its diagnosis and principles of
management.……………………………………………………………………………… 30
Definition …………………………………………………………………………………….31
Prevalence, incidence, distribution and disease course ………………………………………34
Aetiology …………………………………………………………………………………….35
Pathology …………………………………………………………………………………….37
Management and treatment of keratoconus ………………………………………………….43
Summary ……………………………………………………………………………………..44

vi
Chapter 3: Literature review: contact lenses in the management of keratoconus.….… 46
Introduction …………………………………………………………………………….……46
Contact lens types ……………………………………………………………………………48
Contact lenses in corneal disease ……………………...……………………………………. 49
Management of keratoconus …………………………………………………………………52
CRGPcl in the management of keratoconus …………………………………………………55
Fitting methods and their relation to corneal pathology progression ………………………. 60
Summary ……………………………………………………………………………………..79
Chapter 4: Methods…………………………………………………………………………81
Introduction …………………………………………………………………………………. 81
Crossover design …………………………………………………………….……………… 81
Study population recruitment ………………………………………………………………. 87
Experimental contact lenses ………………………………………………………………… 92
Research outcome-measures ………………………………………………………………... 94
Sample size calculation .…………………………………………………………………….101
Minimising measurement bias ..…………………………………………………………… 103
Statistical analysis .………………………………………………………………………… 103
Compliance and withdrawal ………………………………………………………………. 106
Data handling and record keeping ………………………………………………………… 107
Adverse events …………………………………………………………………………….. 109
Summary …………………………………………………………………………………... 111

vii
Chapter 5: Results………………………………………………………………………… 112
Research (CONSORT) flow diagram ………………………………………………………113
Baseline demographics ……………………………………………………………………. 114
Corneal characteristics ……………………………………………………………………..126
Randomisation demographics …………………………………………………………….. 131
The main outcome measures …………………………………………………………….... 140
ETDRS logMAR.……………………….……………………………………………….….140
Contrast sensitivity function (CSF) visual performance outcomes ………………………… 156
The National Eye Institute-Visual Function Questionnaire (NEI-VFQ) ………………….. 170
Subjective measures of comfort and vision ……………………………………………….. 176
Final lens choice ……………………………………………………………………………183
Chapter 6: Discussion……………………………………………………………………. 188
Descriptive statistics of the study population ………………………………………………188
Randomisation demographics ………………………………………………………………196
Main outcome measures …………………………………………………………………… 199
Visual acuity, ETDRS logMAR BCVA …………………………………………………… 199
Contrast sensitivity measure of visual performance ………………………………………. 204
Summary of subjective visual outcomes ………………………………………………….. 210
National Eye Institute Visual Function Questionnaire (NEI-VFQ) ………………………. 211
Summary of NEI-VFQ outcome measure ………………………………………………… 214
Subjective measures of comfort and vision ……………………………………………….. 214
Final lens choice …………………………………………………………………………… 218

viii
Summary of statistically significant results ……………………………………………….. 220
Strengths and limitations ………………………………………………………………….. 220
Conclusions ………………………………………………………………………………... 223
List of references………………………………………………………………………...... 228
Appendices…………………………………………………………………………………251

1
List of Abbreviations
AAD Age at diagnosis
BCVA Best corrected visual acuity
CLEK Collaborative longitudinal evaluation of keratoconus
CMH Central Middlesex Hospital
COR Coefficient of repeatability
CPD Cycles per degree
CRGPcl Corneal rigid gas permeable contact lenses
CS Contrast sensitivity
CSF Contrast sensitivity function
CXL Collagen cross-linking
DED Dry eye disease
DFCL Definite Apical Clearance
DLK Deep lamellar keratoplasty
DS Dioptres
ETDRS Early treatment diabetic retinopathy survey
HOA High Order Aberration
INTACS Intrastromal corneal ring segments
NEI-VFQ National eye institute-visual function questionnaire-25
NRES National research ethics services
PMD Pellucid marginal degeneration

2
LogCS Logarithm of contrast sensitivity
LogMAR Logarithm of the minimum angle of resolution
LSBU London South Bank University
LSCS Levit subjective comfort score
LSVS Levit subjective vision score
MAR Minimum angle of resolution
NaFl Sodium fluorescein
OCT Optical coherence tomography
PMD Pellucid Marginal Degeneration
Qol Quality of life
RCT Randomised controlled trial
RGP Rigid gas permeable
REC Research ethics committee
ROS Randomised OS
RGPcl Rigid gas permeable contact lenses
SRGPcl Scleral rigid gas permeable contact lenses
SRI Surface regularity index
SPC Subjective perception of comfort
SPV Subjective perception of vision
VA Visual acuity

3
List of Tables
Table 1.1. Visual Acuity Conversion Table…………………………………………………. 23
Table 1.2 Contrast Sensitivity Values for the CSV-1000E in Log Units……………………. 29
Table 2.1 Noninflammatory ectatic disorders – clinical presentation and appearance
compared and contrasted…………………………………………………………………… 33
Table 3.1 Contact lens options for keratoconus.……………………………………………. 55
Table 4.1 Crossover design sequences…………………………………………...…………. 82
Table 4.2 Crossover design sequence by period statistics……………………………………86
Table 4.5. Item number translation from the 51-Item field test version to the VFQ 25
(Appendix V.F..).………………………………………………………...………………… 287
Table 4.6 Averaging of items to generate VFQ-39 Sub-Scales (VFQ-25 + optional Items)…98
Table 4.7. The Efron grading scales contact lens complications (Appendix IV.D)……..… 279
Table 4.8 Research used to establish mean and StdDev for sample size calculation………..101
Table 4.9 Sample size calculation………………………………………………………….. 102
Table 4.10. Randomisation order (Appendix V.E.)……………………………………..…. 286
Table 5.1 Population age demographics…………………………………………..………. 114
Table 5.2 Demographic of age by gender………………………………….……..……….. 116
Table 5.3 AAD population demographics………………………………………………….. 117
Table 5.4. AAD by gender demographics………………………………………….……… 118
Table 5.5 Participant reported duration of CRGPcl wear at enrolment…….……………. 120
Table 5.6 Gender duration of estimated time of where of CRGPcl at enrolment …………. 122
Table 5.7 The occupations of research participants……………………………….……… 123
Table 5.8 Ethnicity demographics…………………………………………….…………… 125

4
Table 5.9 Research participant’s Kmax metrics in mm……………………………………… 127
Table 5.10 Corneal thickness (pachymetry in µm) metrics of the research population……128
Table 5.11 Research population corneal surface regularity index (in dioptres) metrics……129
Table 5.13 Participant randomisation into the two treatment groups and crossover……… 131
Table 5.14 Descriptive statistics of the ages of the randomised groups……………………. 132
Table 5.15 Descriptive statistics of AAD of the randomised groups…………….………... 133
Table 5.16 Kmax descriptive statistics………………………………………………………. 136
Table 5.17 Corneal SRI descriptive statistics ……….………………………...…………… 137
Table 5.18 Corneal pachymetry descriptive statistics………………………..…………… 139
Table 5.19 ETDRS logMAR scores all eyes, all measurements, research population…….. 141
Table 5.20 ETDRS logMAR BCVA group 1, sequence AB: and group 2 sequence BA …… 142
Table 5.21 Baseline logMAR scores of OD OS and ROS ………………………………… 144
Table 5.22 Group by period means for the mean ETDRS logMAR BCVA ……………….. 145
Table 5.23a Group 1 ETDRS logMAR scores, sums and differences Periods 1 & 2 ……… 151
Table 5.23b. Group 2 ETDRS logMAR scores, sums and differences Periods 1 & 2 ……. 152
Table 5.24 Carryover effect statistics Mann-Whitney U test ……………………………… 153
Table 5.25 Mann-Whitney U test logMAR scores period differences groups 1 and 2 …… 154
Table 5.26 Numeric CS scores of the research population (Appendix V.H.) ……………… 288
Table 5.27.a OD/OS averages of the CS numerical scores for CRGPcl and SRGPcl (Appendix
V.A) ………………………………………………………………………………………. 281
Table 5.27.b CS numerical means and StdDev. For averages of OD/OS scores for the research
population …………………………………………………..…………………………….. 157
Table 5.28 Normal population norms age 21-51 FDA study and (Hashemi et al., 2012)
italicised …………………………………………………………………………………… 158

5
Table 5.29 CS normative vs research population data …………………..……………….. 158
Table 5.30 Summary of CS scores by Group and period …………………………………. 161
Table 5.31 logCS all CPD period scores, sums and differences of OD/OS means, group 1(AB)
and 2 (BA) …………………..……………………………………………………………... 162
Table 5.32 Descriptive statistics of Mean OD/OS logCS in the 2 periods in both groups .. 162
Table 5.33 OD/OS logCS, 6CPD scores and period sums and differences group 1(AB) and
2(BA) (Appendix V.G.) ………………….…………………………………………………. 288
Table 5.34 NEI-VFQ descriptive statistics of the 12 domains measured in the research
population (Appendix V.I.) ………………………………………………………………… 289
Table 5.35 Period sums and differences of means of all domains of NEI-VFQ in group 1 & 2
(Appendix V.B.) …………………………………………………………..……………….. 282
Table 5.36 Statistics of Sum of periods, carryover effect …………………………………. 174
Table 5.37 Statistics of period differences; treatment effect ……………………………….. 175
Table 5.38 Scores of subjective perception of comfort in groups 1 and 2 , by period and sums
and differences of periods in both groups …………………………………………………. 179
Table 5.39 Scores of subjective perception of vision in groups 1 and 2 , by period and sums
and differences of periods in both groups …………………………………………………. 179
Table 5.40 Subjective perception of comfort in CRGPcl and vision (scale 1-10) and final lens
choice (Appendix V.D.) ……………………………………………………………………. 285
Table 5.41 Mean, median, StdDev and IQR scores of subjective comfort for final lens choice
……………………………………………………………………………………...……… 185
Table 5.42 χ2 analysis of final lens choice by randomised groups ………………………. 187
Table 5.43a Appendix V.J. Randomised demographics ………………………………….290
Table 5.43b Appendix V.K Inferential crossover statistics summary …………………….291

6
List of Figures
Figure 1.1 Major Ocular Structures + multilayer structure of the cornea ………..………... 13
Figure 1.2. The anterior Cornea: tear film, epithelium and epithelial basement membrane ....14
Figure 1.4 a. ETDRS LogMAR Optotype chart ………..…………………………………… 22
Figure 1.4 b. Snellen optotypes for visual acuity testing copied from https://www.flickr.com..23
Figure 1.5 a. Chromatic Aberrations visual spectrum, b. chromatically aberrated reflected
light………………………………………………………………………………………….. 25
Figure 1.5 c. High Order Aberrations ……………………………………………………… 26
Figure 1.6. a. CSF chart, with sine-wave grating. b. Sinusoidal grating pattern. c. CSF numeric
scores curve. d. high and low contrast scene ……………………………………………….. 28
Figure 2.1. Keratoconus ……………………………………………………………………. 31
Figure 2.2 & 2.3 a. Keratoconus, side view, b. Keratoconus Munson’s sign ………………. 32
Figure 2.4. a. Authors image, corneal scarring b. Vogt’s striae c. Fleischer’s ring d. Stromal
Scarring …………………………………………………………………..………………… 33
Figure 2.5. Corneal Topography of the 3 cone types ……………………………………… 39
Figure 2.6. A Placido rings B Rings reflected from cornea C color-coded contour map normal
cornea. D color-coded contour map Keratoconus …………………………………………. 42
Figure 2.7. Zernike Polynomials …………………………………………………………… 43
Figure 3.1. Neutralisation of corneal irregularity by tear film reservoir ………………….. 50
Figure 3.2. Corneal RGPcl on eyes with keratoconus ……………………………………… 50
Figure 3.3 Scleral RGPcl on an eye with keratoconus …………………….………………. 51
Figure 3.4. SynergEyes UltraHealth Hybrid lens for keratoconus …………………………. 54
Figure 3.5a. Examples of flat central fitting with cone bearing ……………………………. 58
Figure 3.5b. Central clearance fitting with cone clearance ……………………………….. 58
7
Figure 3.5c. Divided support, three-point touch, with different levels of central bearing ….. 59
Figure 3.5d. Optimal physical CRGPcl fit ………………………………………………….. 59
Figure 3.6a. Dark area at 1o’clock shows heavy lens bearing on the cornea ……………… 73
Figure 3.6b Circum-limbal bearing A. Local epithelial breakdown staining B ……………. 73
Figure 3.7. Conjunctival Prolapse under the lens edge, white arrows, corneal vascularisation
due to chronic hypoxia caused by conjunctival adhesion to the cornea …………………….. 74
Figure 3.8. Epithelial bogging ...……………………………………………………………. 74
Figure 3.9. Lens fogging due to accumulation of particular matter behind the lens ………. 75
Figure 4.1 Sequence of randomisation and crossover ……………………………………… 83
Figure 5.1 Research flow diagram according to Consolidated Standards of Reporting Trials
(CONSORT) (Schulz et al., 2010)…………………………………………………………..113
Figure 5.2 Population age frequency ……………………………………………………… 115
Figure 5.3 Box plots of age by gender demographics …………………………………….. 116
Figure 5.4 AAD population distribution histogram ………………………………………. 117
Figure 5.5 Box plot AAD by gender ……………………………………………………….. 119
Figure 5.6 Mean age and age at diagnosis (AAD) by gender, with standard deviations …. 119
Figure 5.7 Participant reported duration of CRGPcl wear at enrolment ………………… 121
Figure 5.8 Box plot of duration of CRGPcl wear by gender ………………………………. 122
Figure 5.9 Race frequencies: a number and percentage of participant’s ethnicities …….. 124
Figure 5.10 Mean age and mean AAD with respective standard deviations for each
ethnicity…………………………………………………………...……………………….. 125
Figure 5.11 Corneal pathology frequencies, including CXL and INTACS treatments …… 126
Figure 5.12 Research participant’s Kmax corneal curvature distribution …………………. 128
Figure 5.13 Research population corneal thickness (pachymetry in µm) histogram ……… 129

8
Figure 5.14 Corneal surface regularity index (in dioptres) of the research population…. 130
Figure 5.15 Gender numbers in group 1 (AB) and group 2 (BA) ……………………….. 132
Figure 5.16 Mean age and AAD and StdDev of the 2 randomised groups …………….… 134
Figure 5.17 Boxplots of age and AAD in group 1(AB) and group 2 (BA) ……….………. 134
Figure 5.18 Race frequencies in the randomised groups ………………………………… 135
Figure 5.19 Box plot of the Kmax in the randomised groups ………………………………. 137
Figure 5.19 b. SRI Box plot of the randomised groups 1 and 2 …………………………… 138
Figure 5.20 Randomised pachymetry Box and whiskers plot, groups 1 and 2 …………… 140
Figure 5.21 ETDRS logMAR scores all eyes and measurements of the research population .141
Figure 5.22 Box Plots ETDRS logMAR BCVA groups 1and 2 ……………………………. 142
Figure 5.23 Boxplots of group by period for the mean OD/OS ETDRS logMAR BCVA …. 145
Figure 5.24 Mean OD/OS logMAR scores of CRGPcl vs SRGPcl ………………………… 146
Figure 5.25 Mean OD/OS ETDRS logMAR BCVA Period 1 versus Period 2, group 1…… 147
Figure 5.26 Mean OD/OS ETDRS logMAR BCVA Period 1 versus Period 2, group 2 …… 147
Figure 5.27 Mean OD/OS logMAR Period 1 vs Period 2 for both groups with centroids …148
Figure 5.28 Profiles Plots for ETDRS logMAR by Group intra-participant period
difference…………………………………………………………………………………....149
Figure 5.29 Group-by-periods plot for mean ETDRS logMAR data……………………… 150
Figure 5.30a. Individual logMAR scores in CRGPcl and SRGPcl of the research population
……………………………………………………………………………………………... 155
Figure 5.30b. Frequency distribution logMAR BCVA with CRGPcl and SRGPcl………….. 155
Figure 5.31a. Numeric values of experimental CS scores distribution by CPD of OD and OS
of the research population………………………………………………………………………… 156

9
Figure 5.31b. Numeric values of CS scores distribution by CPD of the research population
……………………………………………………………………………………………... 157
Figure 5.32 CSF mean and std. deviation of the research population data versus: a. FDA
normative data, b. Hashemi et al., (2012) normative data, c. Wei et al., (2011) …………. 159
Figure 5.33 Boxplots experimental lenses current research ……………………………… 160
Figure 5.34 Mean OD/OS logCS Period 1 versus Period 2 in both groups ……………… 163
Figure 5.35 Average OD/OS logCS mean of CPD 3,6,12,18 scores period 1 vs period 2 for
both groups with centroids (solid black) ………………………………………………….. 164
Figure 5.36 Individual participant’s logCS scores in Group 1 and 2, periods 1 and 2 …… 165
Figure 5.37 Group-by-periods plot for mean ETDRS logMAR data ……………………… 166
Figure 5.38 Average OD/OS logCS mean of all CPDs distribution CRGPcl ~vs~SRGPcl..168
Figure 5.40a NEI-VFQ means and StdDev current study vs CLEK ………………………. 170
Figure 5.40b NEI-VFQ means and StdDev; current study vs Normative Kymes et al., (2004).
………………………………………………………………………………………………171
Figure 5.41a. Means and StdDev NEI-VFQ 12 domains, CRGPcl vs SRGPcl .………….. 172
Figure 5.41b. Boxplots CRGPcl vs SRGPcl mean VFQ scores.…………………….…….…..172
Figure 5.42. NEI-VFQ 12 domains group 1 vs 2 with means and standard deviations……...173
Figure 5.43 Subjective comfort of each participant in group 1, period 1 vs period 2 (Appendix
5.C.)……………………………………………………………………..…………………. 283
Figure 5.44 Subjective comfort of each participant in group 2, period 1 vs period 2 (Appendix
5.C.) ……………………..………………………………………………………………… 283
Figure 5.45 LSVS of each participant in group 1, period 1 vs period 2 (Appendix 5.C) ... 284
Figure 5.46 LSVS of each participant in group 2, period 1 vs period 2 (Appendix 5.C) … 284
Figure 5.47a Individual scores for LSCS in Periods 1 and 2 in groups 1 and 2 …………. 177
Figure 5.47b. LSCS both groups with centroids……………………………..………………….178

10
Figure 5.47c. LSCS individual profiles groups 1 and 2………..……………………………….178
Figure 5.48 Individual scores for LSVS in Periods 1 and 2 in groups 1 and 2 ….……….. 177
Figure 5.49a. Boxplots of subjective perception of comfort scores in CRGPcl and SRGPcl...182
Figure 5.49b. Boxplots of subjective perception of vision scores in CRGPcl and SRGPcl.. 182
Figure 5.51. Distribution of subjective perception of comfort scores in experimental
CRGPcl…………………………………………………………………………………….. 184
Figure 5.52 Subjective perception of comfort scores in CRGPcl in participants who chose
CRGPcl and SRGPcl ……………………………………………………………………… 185
Figure 6.1. CSF score chart, 1 level difference between numbers in each row is equivalent to
approximately 0.15logCS ………………………………………………………………….. 208
List of appended items
Appendix I .…………………………………………………………………………………251
A. Participants information
B. Consent document
C. Consent form
D. Participant information on receipt of contact lenses
E. Handling and Care of Scleral Contact Lenses
Appendix II ……………………………………………………………………………….. 262
A. Baseline clinical information
B. Data Collection (naive data collector) CRF
C. Fitted Lens Information (on fitting appt)
Appendix III ……………………………………………………………………………… 270
A. Good clinical practice certificate
B. IRAS approval certificate

11
Appendix IV ……………………………………………………………………………… 273
A. Database Libre Office, data entry, extraction and analysis
B. NEI-VFQ Spreadsheet information
C. NEI-VFQ data entry, coding and analysis
D. Table 4.7. The Efron grading scales contact lens complications (J&J vision care institute)
Appendix V……………………………………………………………………….……. 281
A. Table 5.27.a OD/OS averages of the CS numerical scores for CRGPcl and SRGPcl
B. Table 5.35 Period sums and differences of means 12 domains of NEI-VFQ in group 1&2
C. Figures 5.43-5.46. Subjective comfort and vision of participants in group 1, period 1 vs
period 2
Figure 5.43 Subjective comfort of each participant in group 1, period 1 vs period 2
Figure 5.44 Subjective comfort of each participant in group 2, period 1 vs period 2
Figure 5.45 Subjective vision of each participant in group 1, period 1 vs period 2
Figure 5.46 Subjective vision of each participant in group 2, period 1 vs period 2
D. Table 5.40 Subjective perception of comfort and vision CRGPcl and final lens choice
E. Table 4.10. Randomisation order
F. Table 4.5. Item number translation from the 51-Item field test version to the VFQ 25
G. Table 5.33 OD/OS logCS, 6CPD scores and period sums and differences group 1 and 2
H. Table 5.26 Numeric CS scores of the research population
I. Table 5.34 NEI-VFQ 12 domains measured in the research population
12
Chapter 1: Introduction
Background overview
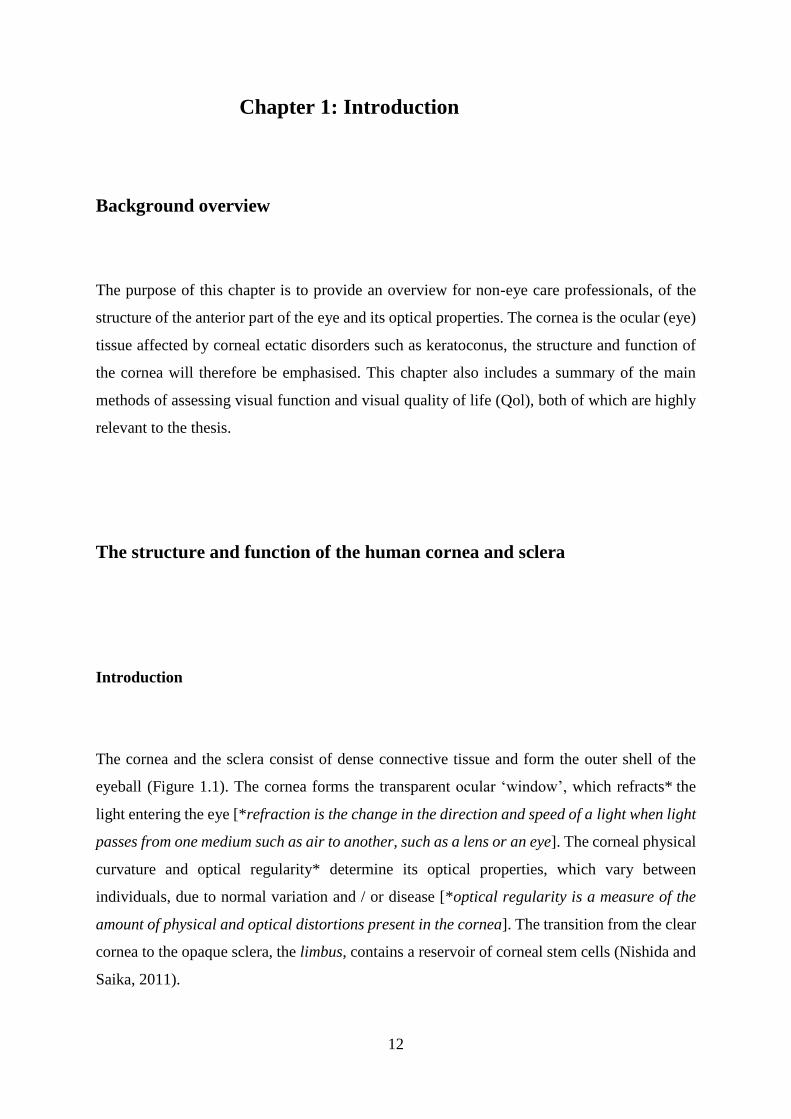
The purpose of this chapter is to provide an overview for non-eye care professionals, of the
structure of the anterior part of the eye and its optical properties. The cornea is the ocular (eye)
tissue affected by corneal ectatic disorders such as keratoconus, the structure and function of
the cornea will therefore be emphasised. This chapter also includes a summary of the main
methods of assessing visual function and visual quality of life (Qol), both of which are highly
relevant to the thesis.
The structure and function of the human cornea and sclera
Introduction
The cornea and the sclera consist of dense connective tissue and form the outer shell of the
eyeball (Figure 1.1). The cornea forms the transparent ocular ‘window’, which refracts* the
light entering the eye [*refraction is the change in the direction and speed of a light when light
passes from one medium such as air to another, such as a lens or an eye]. The corneal physical
curvature and optical regularity* determine its optical properties, which vary between
individuals, due to normal variation and / or disease [*optical regularity is a measure of the
amount of physical and optical distortions present in the cornea]. The transition from the clear
cornea to the opaque sclera, the limbus, contains a reservoir of corneal stem cells (Nishida and
Saika, 2011).

13
The sclera is an opaque protective outer layer of the eye. Interwoven collagen fibres provide
the mechanical strength of the cornea and sclera, protecting the inner eye from physical injury
and maintaining ocular contour (Figure 1.1) (Birk and Trelstad, 1984). The regular corneal
collagen fibres facilitate corneal transparency, the lack of transparency of the sclera is due to
the non-uniformity in the arrangement of its collagen fibres (Watson and Young, 2004).
The cornea, covered by a thin layer of tear film is exposed to the environment, whereas the
sclera is covered with the semi-transparent mucous membrane the conjunctiva and has no direct
exposure to the environment. The conjunctiva is critical to maintaining the integrity of the eye,
it protects the soft tissues of the eyelid and orbit and is the main site for the production of the
mucous components of the tear film (Figure 1.2). Abnormalities of the conjunctiva may lead
to restriction of ocular movement (loss of elasticity), deficiency of the tear film (deficient
production of tear components), and decreased resistance to infection (deficient production of
immune components), which also adversely affect the cornea (Nelson and Cameron, 2011).
Figure 1.1 Major Ocular Structures + multilayer structure of the cornea
https://www.flickr.com (licence type: all creative commons).

14
The cornea is approximately 500µm (0.5mm) thick and has a multilayer structure comprised
of precisely arranged component layers (Figures 1.2), which interact with each other to
maintain corneal function, transparency and structural integrity.
These layers are (Nishida and Saika, 2011):
1. Six layers of epithelial cells, to which the tear film complex is attached.
2. The Basement membrane to which the epithelial cells are anchored.
3. Thin collagen layer of the anterior stroma: Bowman’s layer.
4. A thick central collagen fibrous structure called the substantia propria or stroma
5. Discovered in 2013, a tough, well-defined, acellular lining of 10μm-15μm between the
corneal stroma and Descemet's membrane: Dua’s layer (Dua et al., 2013).
6. A thin homogeneous elastic lamina called Descemet’s membrane
7. A single, non-regenerating layer of endothelial cells forming part of the lining membrane
of the anterior chamber of the eye (Nishida and Saika, 2011).
Figure 1.2. The anterior Cornea: tear film, epithelium and epithelial basement membrane
(https://www.researchgate.net).

15
Tear film
The tear film is a complex composite structure which is a mixture of components from multiple
sources (Nishida and Saika, 2011), it consists of three layers: a superficial lipid layer
approximately 0.1µm thick, an aqueous layer 7µm thick comprising 98% of the tear volume
and a mucinous layer 0.02µm–0.05µm (Holly and Lemp, 1977). Normal tear volume and
production rates are about 6µL and 1.2µL / minute respectively, with a turnover rate of about
16% per minute (Mishima et al., 1966). The base of the tear film is in contact with the outer
surface membrane of the corneal and conjunctival epithelial cells, which incorporates elaborate
folds and filaments, which increase the corneal surface area of contact, aiding adherence with
the tear film (Lemp and Beuerman, 2011).
The tear film protects the cornea from dehydration, it acts as a lubricant, a source of nutrients
and a source of regulatory factors required for corneal epithelial cell maintenance and repair.
Optimal physiology and immunology are maintained by biologically important ions and
molecules, including electrolytes, glucose, immunoglobulins, lactoferrin, lysozyme, albumin,
and oxygen as well as a wide range of active substances such as histamine, prostaglandins,
growth factors, and cytokines (Nishida and Saika, 2011).
Apart from lubrication, protection from disease and provision of nutrition to the cornea, the
tear film is critical for the maintenance of the optical properties of the eye. The pre-corneal tear
film stability between blinks allows clear vision; this limited stability is compromised in dry
eye disease (DED), leading to optical image degradation between blinks (Goto et al., 2006).
Corneal epithelium
The corneal epithelium thickness is approximately 50µm. It forms an effective mechanical
barrier and together with the cellular and chemical components of the conjunctiva and tear film,
protects against potential pathological agents and microorganisms. The epithelial cells on the
base layer of the cornea constantly divide to produce new cells. The superficial epithelial cells

16
differentiate and gradually emerge at the corneal surface. The differentiation process requires
7-14 days to complete, after which the superficial cells are desquamated (shed) (Hanna et al.,
1961). Ultraviolet radiation, hypoxia [deprivation of oxygen] and mechanical stress induce
apoptosis (cell death) and desquamation of corneal epithelial cells (Estil et al., 2000; Ma and
Bazan, 2001; Esco et al., 2001).
Corneal stroma
The smooth surface of the cornea is essential for visual clarity. The regular arrangement of
collagen fibres in the corneal stroma accounts for corneal transparency (Freegard, 1997). The
size of and the distance between the collagen fibres in the corneal stroma are relatively
homogeneous and are less than half of the wavelength of visible light (400–700nm). This
anatomic arrangement generates a cancelling interference of scattered light rays allowing light
to pass through the cornea (Maurice, 1984). If the diameter of or the distance between collagen
fibres becomes heterogeneous, as in fibrosis (scarring), injury or oedema, incident rays are
scattered randomly and the cornea loses its transparency (Nishida and Saika, 2011).
Corneal endothelium
The corneal endothelium contributes to the maintenance of corneal stromal transparency by the
regulation of corneal hydration (Nishida and Saika, 2011). The healthy cornea is maintained at
a relatively dehydrated state by the endothelial ion-pump, which maintains corneal
transparency (Schmedt et al., 2012). Impaired endothelial function due to disease process or
physiological endothelial insult may allow water to accumulate in the cornea causing corneal
oedema and impair its transparency (Schmedt et al., 2012).

17
Innervation
Tissue sensory innervation is required for pain sensation as well as for tissue repair. Most of
the sensory nerves in the cornea are derived from the ciliary nerves of the ophthalmic branch
of the trigeminal nerve (cranial nerve V). The density of nerve endings in the cornea is about
300-400 times greater than that in the skin (Muller et al., 2003). It is one of the most innervated
and therefore most sensitive tissues in the body.
Damage or loss of the corneal epithelium results in severe ocular pain due to exposure of the
nerve endings. Two of the 5th nerve branches, short and long posterior ciliary nerves, penetrate
the sclera and provide fine sensory branches to the scleral stroma. Scleral innervation and
sensitivity are significantly reduced compared to the cornea due to reduced tissue innervation.
Wound healing
Smooth corneal epithelium, transparent stroma, and a functioning endothelium are all essential
for clear vision. Wound healing in the human body is generally initiated by the exit of blood
constituents as a result of disruption of blood vessels. The mechanism of wound healing in the
cornea is different since the cornea is avascular. The surface epithelial cells renew continuously
to maintain the normal layered structure of the corneal epithelium. The existence of corneal
epithelial stem cells at the limbus (Cotsarelis et al., 1989) and their importance for corneal
epithelial homeostasis has been established (Secker and Daniels, 2008). Corneal injury which
results in an epithelial defect is normally repaired by a rapid epithelial cell migration,
proliferation, and differentiation, resulting in restoration of the stratified structure of the
epithelium (Ljubimov and Saghizadeh, 2015). These processes are controlled and regulated by
complex immune, neural, chemical and biological mechanisms and interactions (Ljubimov and
Saghizadeh, 2015).
18
Vasculature
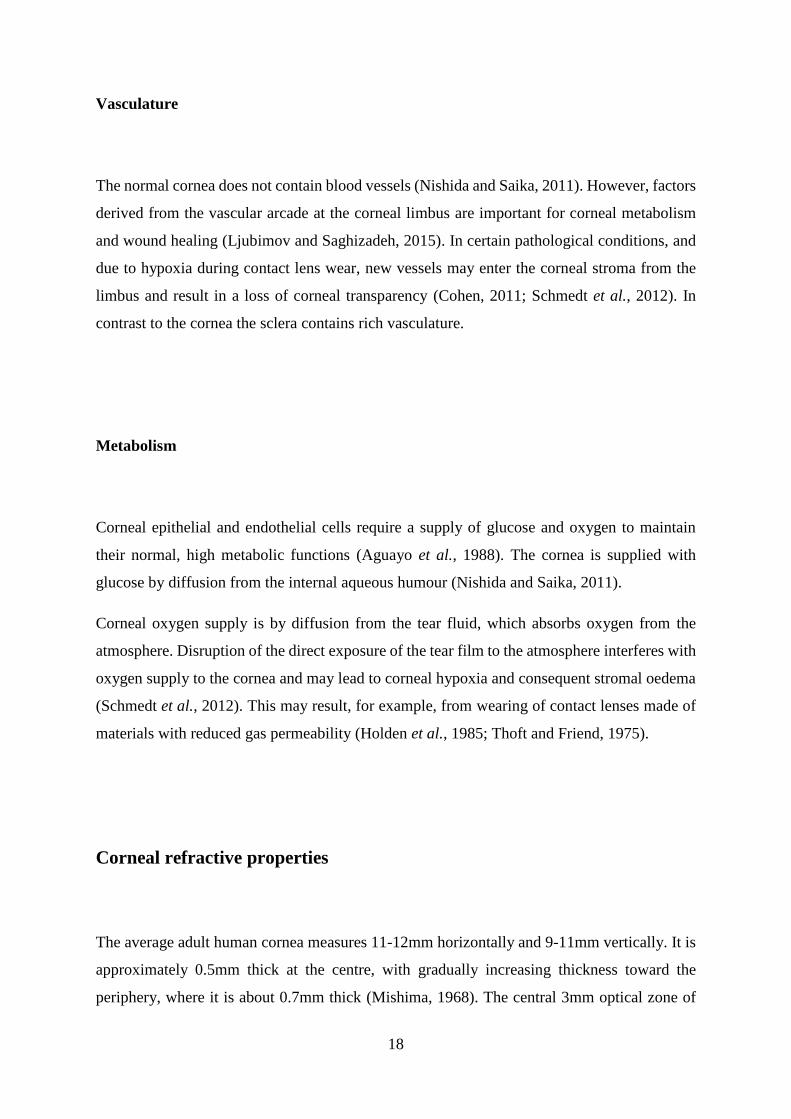
The normal cornea does not contain blood vessels (Nishida and Saika, 2011). However, factors
derived from the vascular arcade at the corneal limbus are important for corneal metabolism
and wound healing (Ljubimov and Saghizadeh, 2015). In certain pathological conditions, and
due to hypoxia during contact lens wear, new vessels may enter the corneal stroma from the
limbus and result in a loss of corneal transparency (Cohen, 2011; Schmedt et al., 2012). In
contrast to the cornea the sclera contains rich vasculature.
Metabolism
Corneal epithelial and endothelial cells require a supply of glucose and oxygen to maintain
their normal, high metabolic functions (Aguayo et al., 1988). The cornea is supplied with
glucose by diffusion from the internal aqueous humour (Nishida and Saika, 2011).
Corneal oxygen supply is by diffusion from the tear fluid, which absorbs oxygen from the
atmosphere. Disruption of the direct exposure of the tear film to the atmosphere interferes with
oxygen supply to the cornea and may lead to corneal hypoxia and consequent stromal oedema
(Schmedt et al., 2012). This may result, for example, from wearing of contact lenses made of
materials with reduced gas permeability (Holden et al., 1985; Thoft and Friend, 1975).
Corneal refractive properties
The average adult human cornea measures 11-12mm horizontally and 9-11mm vertically. It is
approximately 0.5mm thick at the centre, with gradually increasing thickness toward the
periphery, where it is about 0.7mm thick (Mishima, 1968). The central 3mm optical zone of
19
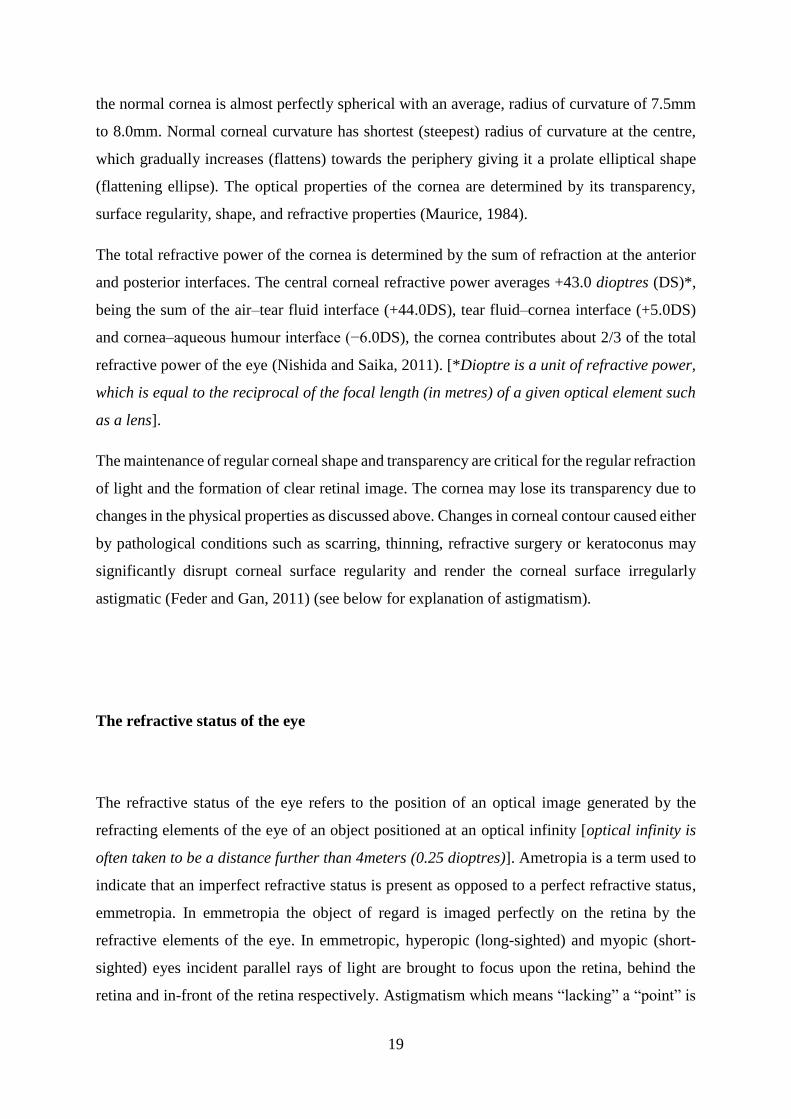
the normal cornea is almost perfectly spherical with an average, radius of curvature of 7.5mm
to 8.0mm. Normal corneal curvature has shortest (steepest) radius of curvature at the centre,
which gradually increases (flattens) towards the periphery giving it a prolate elliptical shape
(flattening ellipse). The optical properties of the cornea are determined by its transparency,
surface regularity, shape, and refractive properties (Maurice, 1984).
The total refractive power of the cornea is determined by the sum of refraction at the anterior
and posterior interfaces. The central corneal refractive power averages +43.0 dioptres (DS)*,
being the sum of the air–tear fluid interface (+44.0DS), tear fluid–cornea interface (+5.0DS)
and cornea–aqueous humour interface (−6.0DS), the cornea contributes about 2/3 of the total
refractive power of the eye (Nishida and Saika, 2011). [*Dioptre is a unit of refractive power,
which is equal to the reciprocal of the focal length (in metres) of a given optical element such
as a lens].
The maintenance of regular corneal shape and transparency are critical for the regular refraction
of light and the formation of clear retinal image. The cornea may lose its transparency due to
changes in the physical properties as discussed above. Changes in corneal contour caused either
by pathological conditions such as scarring, thinning, refractive surgery or keratoconus may
significantly disrupt corneal surface regularity and render the corneal surface irregularly
astigmatic (Feder and Gan, 2011) (see below for explanation of astigmatism).
The refractive status of the eye
The refractive status of the eye refers to the position of an optical image generated by the
refracting elements of the eye of an object positioned at an optical infinity [optical infinity is
often taken to be a distance further than 4meters (0.25 dioptres)]. Ametropia is a term used to
indicate that an imperfect refractive status is present as opposed to a perfect refractive status,
emmetropia. In emmetropia the object of regard is imaged perfectly on the retina by the
refractive elements of the eye. In emmetropic, hyperopic (long-sighted) and myopic (short-
sighted) eyes incident parallel rays of light are brought to focus upon the retina, behind the
retina and in-front of the retina respectively. Astigmatism which means “lacking” a “point” is
20
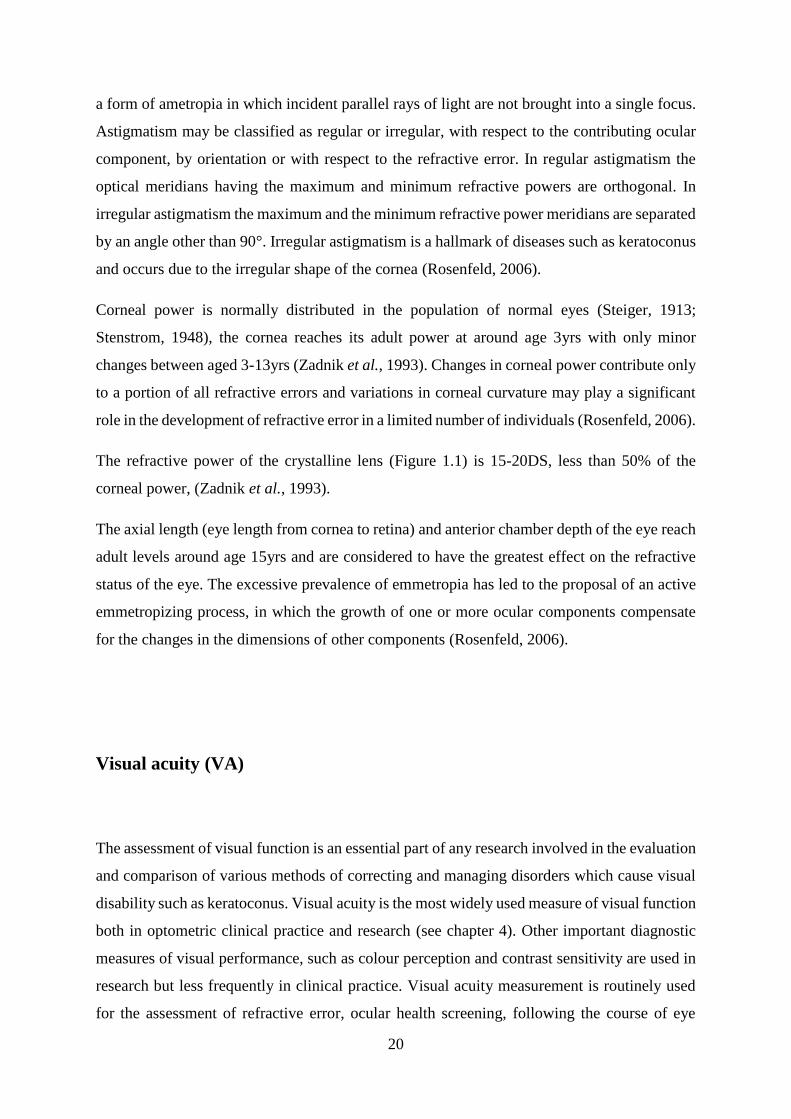
a form of ametropia in which incident parallel rays of light are not brought into a single focus.
Astigmatism may be classified as regular or irregular, with respect to the contributing ocular
component, by orientation or with respect to the refractive error. In regular astigmatism the
optical meridians having the maximum and minimum refractive powers are orthogonal. In
irregular astigmatism the maximum and the minimum refractive power meridians are separated
by an angle other than 90°. Irregular astigmatism is a hallmark of diseases such as keratoconus
and occurs due to the irregular shape of the cornea (Rosenfeld, 2006).
Corneal power is normally distributed in the population of normal eyes (Steiger, 1913;
Stenstrom, 1948), the cornea reaches its adult power at around age 3yrs with only minor
changes between aged 3-13yrs (Zadnik et al., 1993). Changes in corneal power contribute only
to a portion of all refractive errors and variations in corneal curvature may play a significant
role in the development of refractive error in a limited number of individuals (Rosenfeld, 2006).
The refractive power of the crystalline lens (Figure 1.1) is 15-20DS, less than 50% of the
corneal power, (Zadnik et al., 1993).
The axial length (eye length from cornea to retina) and anterior chamber depth of the eye reach
adult levels around age 15yrs and are considered to have the greatest effect on the refractive
status of the eye. The excessive prevalence of emmetropia has led to the proposal of an active
emmetropizing process, in which the growth of one or more ocular components compensate
for the changes in the dimensions of other components (Rosenfeld, 2006).
Visual acuity (VA)
The assessment of visual function is an essential part of any research involved in the evaluation
and comparison of various methods of correcting and managing disorders which cause visual
disability such as keratoconus. Visual acuity is the most widely used measure of visual function
both in optometric clinical practice and research (see chapter 4). Other important diagnostic
measures of visual performance, such as colour perception and contrast sensitivity are used in
research but less frequently in clinical practice. Visual acuity measurement is routinely used
for the assessment of refractive error, ocular health screening, following the course of eye
21
disease, evaluating the effectiveness of refractive, medical and surgical treatments, prescribing
aids for the visually impaired, and setting vision standards for employment and driving. The
British Standards Institution has published standards of visual acuity for the UK (British
Standards Institution., BS 4274-1:2003).
Visual acuity expresses the resolution which detects the threshold size of a spot or a line against
its background or the smallest angular size of the detail that can be resolved and recognised by
the observer. Most clinical tests of visual acuity are based on the visual system’s ability to
correctly recognise the smallest optotypes [figures or letters of different sizes used in testing
visual acuity] (Bailey, 2006).
The minimum angle of resolution (MAR) is typically expressed in minutes of arc and specifies
the angular size of the critical detail within the just-resolvable optotype. For visual targets
comprised of letters the critical detail is taken as 1/5 of the letter height (Figure 1.4b). The
MAR of 1 minute of arc (1´) represents visual acuity of 6/6 (metric notation) or 20/20 (imperial
notation). For a letter twice, the size of a 6/6 letter: 6/12 (20/40) the MAR is 2´. The MAR in
minutes of arc is equal to the reciprocal of the metric or imperial decimal acuity value (Table
1.1) (Bailey, 2006). The logarithm of MAR (logMAR) is a measure of visual acuity represented
by the common logarithm of the MAR (Bailey and Lovie, 1976). For example, the logMAR of
the MAR of 1´: Log101=0.00. The logMAR of 2´: log10 = 0.3. When the visual acuity score is
better than 6/6 the logMAR value becomes negative, for example visual acuity of 6/4.8 in
which the MAR=0.8´, the logMAR=- 0.1 (Table 1.1).
Until recently visual acuity was quite commonly scored in coarse, whole line steps when a
criterion number of letters, e.g., 3 out of 5 letters in a line were identified correctly.
Alternatively, the number of incorrectly identified letters would be designated by a negative
sign e.g., 6/6-2, or a positive sign in front of the number of letters identified from the next line
of optotypes, e.g., 6/6+2. Visual acuities are reported in what is known as the Snellen fraction,
where the numerator indicates the test distance, and the denominator indicates the relative size
of the letter, usually in terms of the distance at which the optotype width to be resolved would
subtend a visual angle of 1´. Thus 20/40 or 6/12 indicate that the actual test distance was 20
feet or 6m and that the strokes of the optotypes would subtend 1´ at 40 feet or 12 m, i.e. the
size of the optotypes in this line is twice as large as in the 20/20 or the 6/6 line (Bailey, 2006).
22
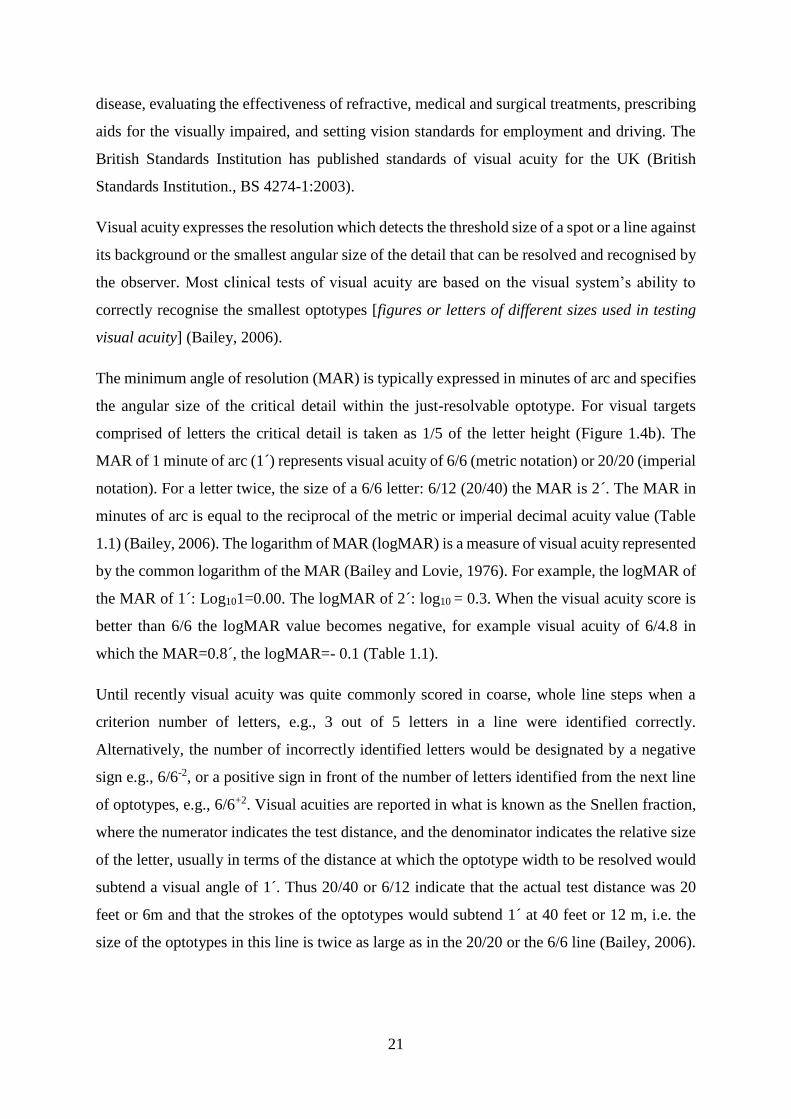
Modern visual acuity chart design
Bailey and Lovie (1976) improved the conventional Sloan (Sloan, 1959) visual acuity chart to
include 5 letters per line, as opposed to 1-8 per row, with interline size progression of 0.1 log
units and following it use in the ETDRS this chart became widely used (Ferris et al., 1982)
(Figure 1.4a). The revised ETDRS 2000 series chart, better equates the letter recognition
difficulty on all lines, and it is generally agreed that whilst gaining a role in clinical trials, its
acceptance in the routine clinical use is limited (Shamir et al., 2016).
Figure 1.4a. ETDRS LogMAR Optotype chart

23
Figure 1.4 b Snellen optotypes for visual acuity testing copied from https://www.flickr.com.
Table 1.1. Visual Acuity Conversion Table
Feet Metre Decimal LogMAR
20/200 6/60 0.1 1
20/160 6/48 0.125 0.9
20/125 6/38 0.16 0.8
20/100 6/30 0.2 0.7
20/80 6/24 0.25 0.6
20/63 6/19 0.32 0.5
20/50 6/15 0.4 0.4
20/40 6/12 0.5 0.3
20/32 6/9.5 0.63 0.2
20/25 6/7.5 0.8 0.1
20/20 6/6 1 0
20/16 6/4.8 1.25 −0.10
20/12.5 6/3.8 1.6 −0.20
20/10 6/3 2 −0.30
24
Visual acuity testing procedures
The logarithmic progression of letter sizes in the ETDRS charts facilitates use at a variety of
distances by the facility of accurate conversion of scores at different distances (VectorVision,
2013). The standard test distance is 4 meters, with chart illumination standards vary from 100
cd / m2 in the USA to 300 cd / m2 in Germany, in normal subjects a plateau in performance is
reached at about 200 cd / m2 (Sheedy et al., 1984).
It has been shown that criterion-dependent test procedures, in which patients decide when the
letters become indistinguishable, lead to inaccurate and unreliable test results (Higgins et al.,
1984). Forced-choice procedures, which are criterion-free because the examiner, rather than
the patient, determines whether the letter is correctly identified, are preferable (Ricci et al.,
1998). It has been shown that letter-by-letter scoring is more reproducible than line-by-line
scoring (British Standards Institution., BS 4274-1:2003; Arditi and Cagenello, 1993).
The physiological limits to visual acuity
When the eye is in ideal focus a point object is imaged on the retina as a diffraction pattern,
which is a small circular patch with faint surrounding rings called the Airy disc (Figure 1.5c
top image). The limits to visual acuity are imposed by a combination of optical and neural
factors (Bailey, 2006). The retinal image quality may be degraded by optical factors such as
the various ametropias, which limit the resolution achieved by the visual system. Even with
optimal refractive correction of ametropia, there still maybe image degradation as a result of
chromatic (colour spectrum) optical aberrations, (as seen when light is refracted through a
prism) (Figure 1.5a and b) and monochromatic (black and white) high order optical aberrations
(HOA) degrade the retinal image (may be expressed by the point spread function, which is the
appearance of a point of light due to a specific HOA distortion) (Figure 1.5c) (Thibos et al.,
2006).

25
Pupil size of the eye will also affect the retinal image quality, if the pupil is too small a
diffraction pattern degrades the image formed, if too large increases the HOA, the ideal
calculated pupil diameter for 1' resolution is 2.5mm (Bailey, 2006). Neural limitations relate to
the anatomy and physiology of the retina and subsequent visual pathways. The calculated
neural limit of resolution, is 0.82', which is similar in magnitude to the calculated optimal
optical limit of resolution of 1' (Bailey, 2006).
a. b.
Figure 1.5 a. Chromatic Aberrations visual spectrum, b. Chromatically aberrated reflected
light https://www.flickr.com (licence type: all creative commons).

26
Figure 1.5 c. High Order Aberrations. Reprinted with permission from Optometric
Management (http://www.optometricmanagement.com)
Contrast sensitivity (CS)
Contrast sensitivity testing was originally developed as a research tool by vision scientists
interested in characterizing normal visual function. Visual acuity measures the eye’s ability to
resolve fine detail at 100% contrast; black optotypes on white background. In the real world, a
range of contrasts present visual challenges, for example the challenge of seeing and
recognising relatively large low-contrast objects such as faces, or important details in an
environment affected by fog or glare (Figure 1.6d). Sine-wave grating stimuli are commonly
used as visual targets in contrast sensitivity testing; these are patterns consisting of alternating
light and dark bars, which have a sinusoidal luminance profile. The size variation in the sine-
wave gratings is generated by varying the spatial frequency of the grating bars by steps

27
measured by CPD (Sukha and Rubin, 2013). A CSF is derived by measuring the lowest
detectable contrast across a range of spatial frequencies. A thorough assessment of contact
sensitivity would involve establishing the minimum contrast that can be detected over a range
of spatial frequencies (Elliott, 2006), (Figure 1.6a).
Clinical CS testing provides a better understanding of the impact of visual impairment on visual
function. Studies have shown that CS loss can lead to mobility problems and difficulty
recognizing signs or faces even when adjusted for loss of acuity (Rubin et al., 2001; Rubin et
al., 1994). Measuring both VA and CS as outcomes of a clinical trial may provide a more
complete picture of the effects of treatment on the quality of vision than either measure alone
(Rubin, 2013). CS tests in clinical use which employ sine-wave grating in a chart form include
the Functional Acuity Contrast Test and the CSV-1000E.
a. b.
28
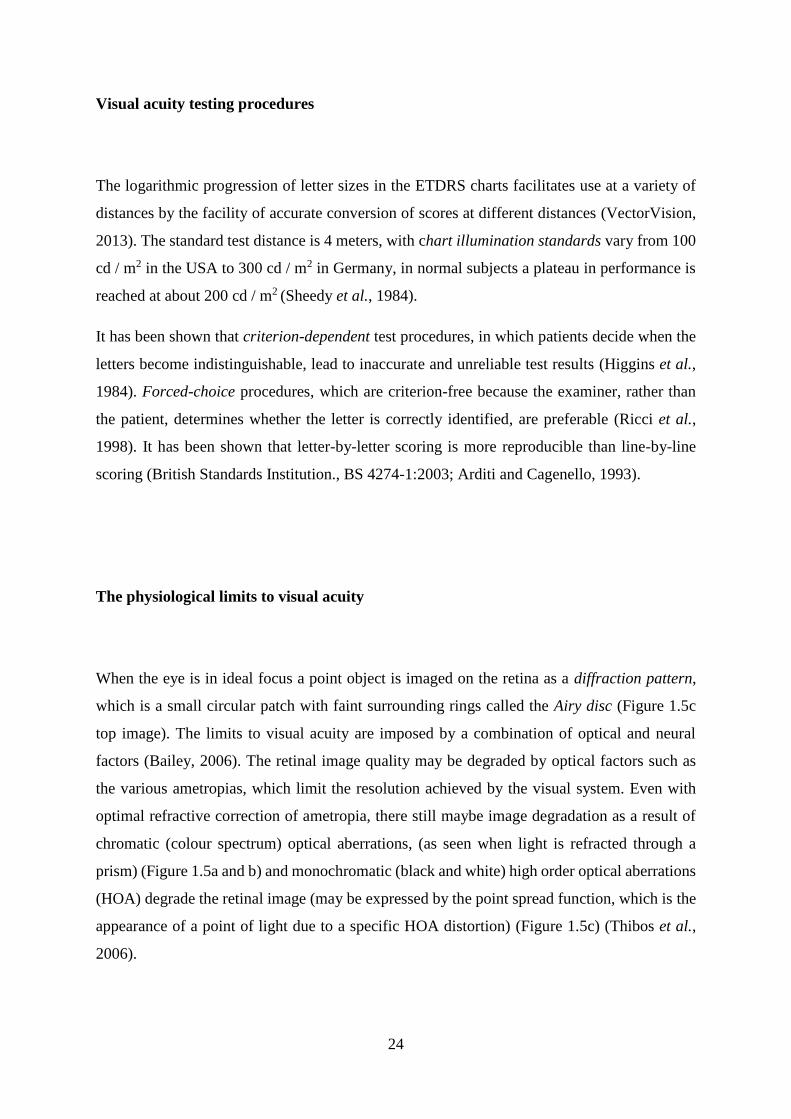
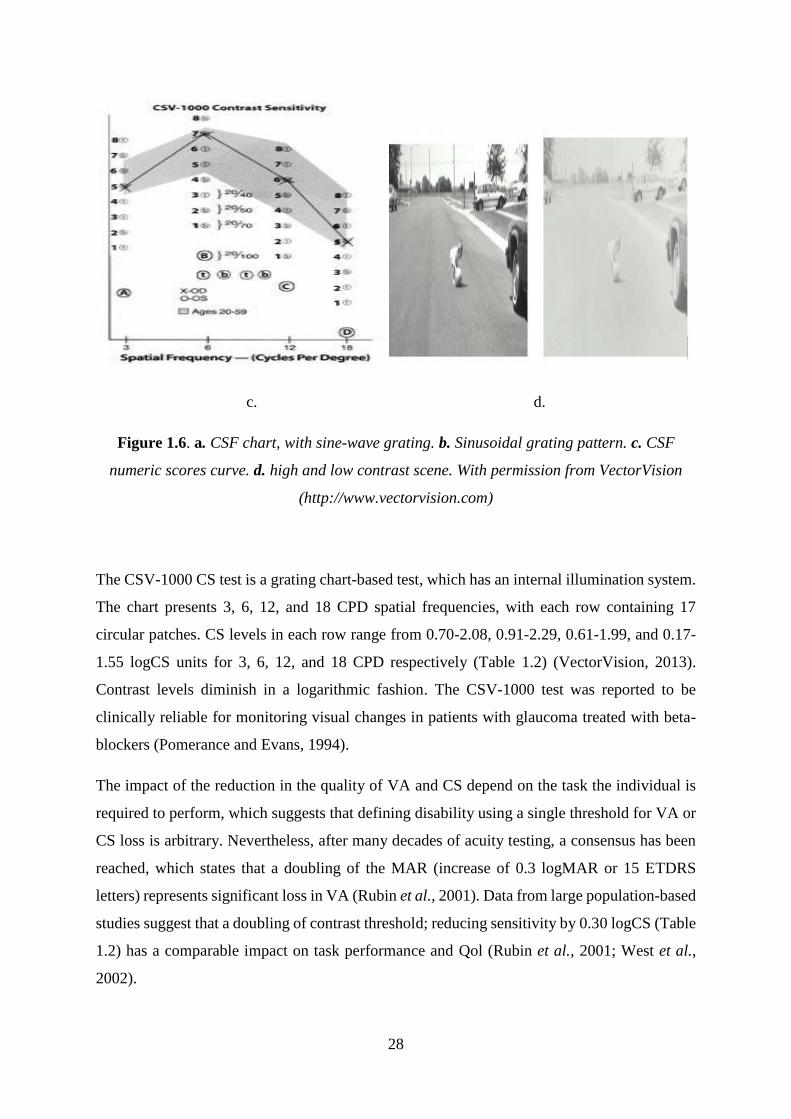
c. d.
Figure 1.6. a. CSF chart, with sine-wave grating. b. Sinusoidal grating pattern. c. CSF
numeric scores curve. d. high and low contrast scene. With permission from VectorVision
(http://www.vectorvision.com)
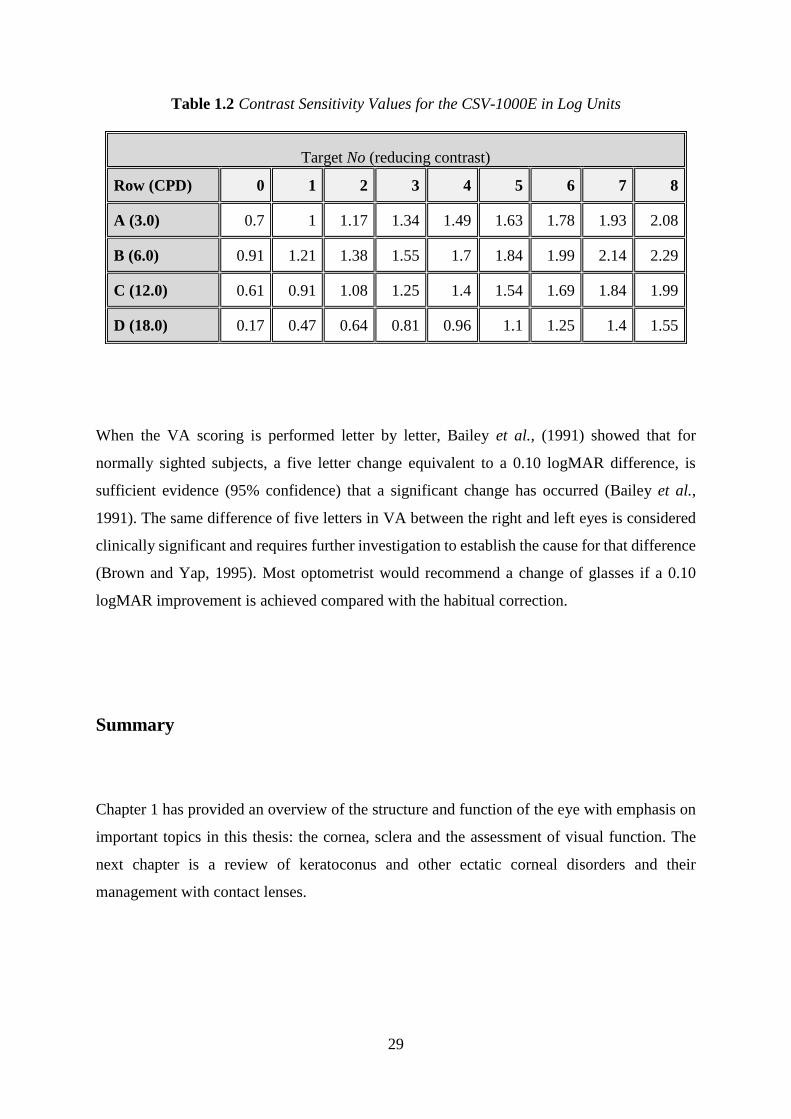
The CSV-1000 CS test is a grating chart-based test, which has an internal illumination system.
The chart presents 3, 6, 12, and 18 CPD spatial frequencies, with each row containing 17
circular patches. CS levels in each row range from 0.70-2.08, 0.91-2.29, 0.61-1.99, and 0.17-
1.55 logCS units for 3, 6, 12, and 18 CPD respectively (Table 1.2) (VectorVision, 2013).
Contrast levels diminish in a logarithmic fashion. The CSV-1000 test was reported to be
clinically reliable for monitoring visual changes in patients with glaucoma treated with beta-
blockers (Pomerance and Evans, 1994).
The impact of the reduction in the quality of VA and CS depend on the task the individual is
required to perform, which suggests that defining disability using a single threshold for VA or
CS loss is arbitrary. Nevertheless, after many decades of acuity testing, a consensus has been
reached, which states that a doubling of the MAR (increase of 0.3 logMAR or 15 ETDRS
letters) represents significant loss in VA (Rubin et al., 2001). Data from large population-based
studies suggest that a doubling of contrast threshold; reducing sensitivity by 0.30 logCS (Table
1.2) has a comparable impact on task performance and Qol (Rubin et al., 2001; West et al.,
2002).
29
Table 1.2 Contrast Sensitivity Values for the CSV-1000E in Log Units
Target No (reducing contrast)
Row (CPD) 0 1 2 3 4 5 6 7 8
A (3.0) 0.7 1 1.17 1.34 1.49 1.63 1.78 1.93 2.08
B (6.0) 0.91 1.21 1.38 1.55 1.7 1.84 1.99 2.14 2.29
C (12.0) 0.61 0.91 1.08 1.25 1.4 1.54 1.69 1.84 1.99
D (18.0) 0.17 0.47 0.64 0.81 0.96 1.1 1.25 1.4 1.55
When the VA scoring is performed letter by letter, Bailey et al., (1991) showed that for
normally sighted subjects, a five letter change equivalent to a 0.10 logMAR difference, is
sufficient evidence (95% confidence) that a significant change has occurred (Bailey et al.,
1991). The same difference of five letters in VA between the right and left eyes is considered
clinically significant and requires further investigation to establish the cause for that difference
(Brown and Yap, 1995). Most optometrist would recommend a change of glasses if a 0.10
logMAR improvement is achieved compared with the habitual correction.
Summary
Chapter 1 has provided an overview of the structure and function of the eye with emphasis on
important topics in this thesis: the cornea, sclera and the assessment of visual function. The
next chapter is a review of keratoconus and other ectatic corneal disorders and their
management with contact lenses.

30
Chapter 2: Literature review, keratoconus and its diagnosis and principles
of management
Methodology of literature search
For chapters 2 and 3 the initial literature search was made for full articles in English, between
Jan 1980 to February 2015 in PubMed employing the following terms: {Contact lenses} AND
{keratoconus OR cornea ectasia} NOT {soft contact lenses} NOT {refractive surgery}, which
yielded 326 articles. The purpose was to present a narrative review addressing the various
aspects of corneal ectatic disorders with emphasis on keratoconus. In addition to these articles,
appropriate, referenced textbooks in the fields of ophthalmology and optometry were referred
to and where appropriate cited. Articles prior to 1980 that were identified in the reference list
of publications found in the search were included if seminal work. In the PubMed search the
command NOT excluded research which describes the use of soft contact lenses in keratoconus
and research which describes iatrogenic keratoconus secondary to refractive surgery.
In chapter 2 the literature from PubMed and referenced textbooks was used to present a
narrative review of current knowledge of corneal ectatic disorders, with emphasis on
keratoconus. The review includes definition, prevalence, incidence, demographics and
aetiology of keratoconus and aspects of disease classification and diagnosis. Chapter 2 ends
with a general outline of management and treatment of keratoconus.
In chapter 3 the literature selection from PubMed and referenced textbooks is focused on
contact lens management of keratoconus and related ectatic disorders. The research is selected
to represent the current state of knowledge concerning contact lens management of
keratoconus, concentrating on CRGPcl and SRGPcl. Research dealing with aspects of fitting
methods and complications and morbidity associated with both lens types is critically appraised
to highlight unresolved clinical questions and areas which require further research to improve
the state of current knowledge and contact lens management of ectatic disorders. This chapter
also includes research describing contact lens related outcomes such as visual acuity, contrast
sensitivity, visual Qol and other objective and subjective measures important to contact lenses
wearers.

31
Updated searches for newer relevant research were performed regularly and relevant new
literature added. The searches were last updated in September 2018.
Definition
Keratoconus; conical cornea, is a clinical term used to describe a non-inflammatory ectatic
corneal disorder, in which the cornea assumes a conical shape because of an inherent
compromise in its structural integrity due to a naturally occurring, traumatic or iatrogenic
corneal thinning and protrusion (Feder and Gan, 2011). It involves the central two thirds of the
cornea with the apex [steepest and thinnest part of the cone] typically positioned inferiorly,
infero-temporally, infero-nasally or centrally, although superior thinning has also been
described (Weed et al., 2005), with mild to marked impairment of visual function (Feder and
Gan, 2011) (Figure 2.1). The sclera in eyes with keratoconus remains normal, with no
difference in thickness compared with healthy eyes (Schlatter et al., 2015).
Figure 2.1. Keratoconus https://www.flickr.com all creative commons license

32
Keratoconus is the most common of a group of ectatic corneal disorders causing corneal
irregularity, such as pellucid marginal degeneration (PMD), Terrien’s corneal marginal
degeneration, keratoglobus and posterior keratoconus (Figures 2.2, 2.3, 2.4, Table 2.1). These
conditions and corneal irregularity due to trauma or surgery generate a degraded retinal
image due to induced HOA and therefore usually require optical management with specialty
contact lenses (Feder and Gan, 2011). Eyes with keratoconus were shown to have 5.5 times
more HOA than eyes with regular corneae (Pantanelli et al., 2007). In practice HOA in
keratoconus result in reduced vision that, in moderate and severe cases, cannot be fully
corrected with spectacles (Watts and Colby, 2017).
a. Keratoconus b. PMD c. Keratoglobus d. Posterior KC
Fig 2.2 Cornea ectatic disorders (https://images.google.co.uk/)
a. b.
Figure 2.3 a. Keratoconus, side view, b. Keratoconus Munson’s sign

33
Table 2.1 Noninflammatory ectatic disorders – clinical presentation and appearance
compared and contrasted (Feder and Gan, 2011).
Condition Keratoconus
(KC)
Pellucid marginal
degeneration (PMD) Keratoglobus
Posterior
keratoconus
Features ↓
Frequency Most
common Less common Rare Least common
Laterality Usually
bilateral Bilateral Bilateral
Usually
unilateral
Age at onset Puberty Age 20 to 40 years Usually at
birth Birth
Corneal
thinning
Inferior
paracentral
Inferior band 1-2 mm
wide
Greatest in
periphery
Paracentral
posterior
excavation
Corneal
protrusion
Thinnest at
apex
Superior to band of
thinning Generalized Usually none
Iron line
(Figure
2.4c)
Fleischer
ring* Sometimes None Sometimes
Scarring
(Figure
2.4a) Common Only after hydrops*** Mild Common
Striae**
(Figure
2.4b) Common Sometimes Sometimes None
a. b. c. d.
Figure 2.4. a. Authors image, corneal scarring b. Vogt’s striae c. Fleischer’s ring d. Stromal
Scarring. (https://images.google.co.uk/)

34
[*Fleischer's ring is not always found in keratoconus but when it is present it is pathognomonic
of the condition and consists of a deposit of ferrous metal in the gutter created by the bulging
protrusion of the cornea. It is a partial or complete annular line, commonly starts at the base
of the cone. When identified, it provides a landmark for the peripheral edge of the cone. As the
ectasia progresses, the ring tends to become more densely pigmented and narrower, and it may
completely encircle the cone at its base.
**Striae occur in the posterior stroma, just anterior to Descemet’s membrane. They disappear
when intraocular pressure is raised, by exerting digital pressure on the globe. Striae are to be
distinguished from the superficial linear scars, which may be seen in keratoconus at the corneal
apex; scars do not disappear when pressure is applied.
***Corneal Hydrops occurs in more advanced ectasiae, when aqueous humour penetrates into
ruptures in Descemet’s membrane. This causes acute corneal oedema, which may persist for
weeks or months, usually diminishing gradually. Eventually, it is replaced by scarring which
in some cases may result in flattening of the cone].
Prevalence, incidence, distribution and disease course
Keratoconus occurs in all races with no clear gender predominance (Ramez et al., 2017). Due
in part to varying diagnostic criteria the prevalence of keratoconus may vary significantly in
different studies, on average from 50-200 per 100,000 (Feder and Gan, 2011). The prevalence
of keratoconus exhibits significant demographic variations from the extremely low prevalence
of 0.0003% in Russia to 2.3% in central India (Gorskova and Sevost'ianov, 1998; Jonas et al.,
2009). The role of ethnicity in the prevalence of keratoconus is demonstrated in the two survey
reports from the United Kingdom; these indicate a 4.4–7.5 times greater prevalence of
keratoconus in Asians (Indian, Pakistani and Bangladeshi) compared with Caucasians,
suggesting a significant role of ethnicity (Georgiou et al., 2004; Pearson et al., 2000).

35
Ethnicity was also found to play an important role in the incidence of keratoconus, which
exhibits a significant difference between the Asian: 25 per 100000 (1 in 4000) and white 3.3
per 100000 (1 in 30000), per year respectively (p<0.001), with Asians presenting at
significantly younger age (Georgiou et al., 2004).
Unlike the displaced apex syndrome, where the off axis corneal apex appears like early
keratoconus on corneal topography (Belin and Khachikian, 2011), keratoconus is a progressive
disorder with an onset typically at puberty and a progression course of 10-20 years (Ramez et
al., 2017). The rate of progression is variable and by the time it stops it may range from mild
irregular astigmatism to severe protrusion, thinning and scarring, which may require
keratoplasty (corneal transplant surgery) for restoration of reasonable vision (del Barrio et al.,
2017).
Aetiology
Heredity
Heredity seems to play an important role in the aetiology of keratoconus as very high
concordance is found in monozygotic twins (Edwards et al., 2001). Keratoconus prevalence of
first-degree relatives was found to be 3.34% which is up to 68 times higher than in the general
population (Wang et al., 2000). Gordon-Shaag et al., (2013) reported that in an Arab
keratoconic population in Jerusalem, children of consanguineous parents had a fourfold risk of
keratoconus compared with those of unrelated parents. Woodward (1981) found that
keratoconus was maternally age related and was reflected in the social class (professional and
intermediate class) of the patients attending the Moorfields contact lens clinic, were born at
older maternal age compared with the general population (p<0.001) (Woodward, 1981). It is
possible that some forms of keratoconus are under direct genetic control, other forms may
require environmental stimuli to develop and progress (Gordon-Shaag et al., 2013).

36
Eye rubbing
Despite the various associations with systemic disorders and ocular disease and the attempt of
early theories to link the systemic and ocular disease associated with keratoconus, the aetiology
of keratoconus remains unclear. Eye rubbing prevalence among keratoconus patients ranges
from 66%-73% (Krachmer et al., 1984) and has been implicated as a causative and contributory
factor in the development and progression of keratoconus (McMonnies, 2016; Gordon-
Shaag,Millodot,Kaiserman et al., 2015; Gasset et al., 1978; Rahi et al., 1977) by inducing a
direct mechanical trauma and by increasing the protease tear film inflammatory mediators
(Balasubramanian et al., 2013). The mechanical micro-trauma associated with eye rubbing may
be the etiologic link between keratoconus and associated systemic and ocular diseases. Itching,
ocular irritation, and eye rubbing are common features of vernal keratoconjunctivitis and atopic
disease which are significantly more prevalent in keratoconus (Gasset et al., 1978). Vigorous
eye rubbing is commonly observed in trisomy 21 (Down’s syndrome), which has a higher
incidence of keratoconus and may explain the high incidence of associated corneal hydrops.
Eye rubbing is also commonly seen in Leber’s tapeto-retinal degeneration and retinopathy of
prematurity, both of which are associated with keratoconus (Feder and Gan, 2011). Regular
repeated counselling against eye rubbing is indicated in patients with keratoconus and other
corneal disorders to avoid corneal trauma associated with eye rubbing (McMonnies, 2016).
Biomechanics
The corneal biomechanics in keratoconus are thought to be abnormal; the keratoconic cornea
is more fragile and has impaired capabilities to recover from chronic corneal epithelial trauma,
which is considered a causative factor in the thinning of the corneal stroma and therefore
associated with the pathogenesis and progression of keratoconus (Kim et al., 1999; Wojcik et
al., 2014). Corneal thinning may be caused by weak stromal inter-lamellar attachments, which
result in free lamellar sliding and the biomechanical instability of this tissue, which may be
caused by the significant alterations in the orthogonal arrangement and the reduced number of

37
the collagen fibrils (Daxer and Fratzl, 1997). The reduced inter-lamellar collagen fibrils
strength profile in the inferior compared with central stroma in the normal cornea, may explain
the association of keratoconus with eye rubbing, which applies pressure gradient from top to
bottom (Smolek and Beekhuis, 1997).
Biochemistry
Biochemical studies show that the total amount of corneal protein is decreased in keratoconus
(Critchfield et al., 1988). The micro trauma caused to the keratoconic corneal epithelium by
eye rubbing or interaction with the rigid surface of a contact lenses elevates the secretion levels
of matrix metalloproteinase MMP-1 and MMP-13 (Mackiewicz et al., 2006) and inflammatory
mediators such as IL-6 and TNF-𝛼 (Lema et al., 2009). The release of these factors by the
corneal epithelium in response to the mechanical insult of eye rubbing or contact lens wear
triggers an undesirable apoptosis of corneal stromal keratocytes and loss of stromal volume
and may lead to scarring in individuals with heightened sensitivity to interleukin-1 such as
occurs in keratoconus (Wilson et al., 1996). These processes suggest that keratoconus may
have inflammatory aetiology.
Pathology
Every layer of the cornea may be involved in the pathologic process of keratoconus.
Fragmentation of the Bowman's layer is an early change which leads to the progression of the
disease and is specific to keratoconus (Sawaguchi et al., 1998). Z shaped interruptions, which
are typical to keratoconus, are formed at the level of Bowman's layer allowing the corneal
epithelium to grow backwards into the stroma and the stromal collagen to grow anteriorly into
epithelium. The basal epithelium accumulates ferritin (iron) particles which eventually form

38
the Fleischer ring. The breaks in the Bowman’s layer are correlated to the clinically observed
spaces within the thin stroma of the cone and are postulated to later fill with scar tissue and
create the reticular branching opacities (Shapiro et al., 1986).
Very early keratoconus may show small islands of corneal steepening, as keratoconus
progresses, the conical area increases in size and decentration and may be classified into one
of three shapes: nipple, oval (Perry et al., 1980) and globus (Feder and Gan, 2011) (Figure 2.5).
Nipple cones typically display a central or infero-nasally decentred apex and are characterized
by the presence of a 5mm steepened region surrounded by normal peripheral cornea. Oval
cones, which are the most common, are larger than nipple cones. They are characterized by an
inferior area of steepening with an infero-temporally displaced apex. In early stages of the
disease superior cornea remains relatively normal. As the oval cone progresses, it proceeds in
a radial fashion, with ectasia spreading into the temporal cornea, and in later stages it
encompasses the superior cornea as well. Often a small island of normal cornea will persist in
the superior nasal quadrant. Unlike nipple cones, oval cones show greater destruction of the
underlying corneal layers (Perry et al., 1980). Globus cones are the largest in area and rarest of
the three types. These cones generally involve at least 75% of the corneal surface (Robertson
and Cavanagh, 2011).
A. Nipple cone

39
B. Oval Cone
C. Globus cone
Figure 2.5. Corneal Topography of the 3 cone types, red indicates a steeper corneal
curvature and blue flatter.

40
Diagnosis
Presenting visual symptoms may range from a minor deterioration in vision to symptoms of
considerable blur, photophobia [discomfort in bright light], glare, monocular diplopia [double
vision] and ocular irritation (Feder and Gan, 2011).
Age of presentation is typically during teens or twenties (Ramez et al., 2017). CS testing may
uncover visual dysfunction before the more standard high contrast VA examination (Zadnik et
al., 1987).
Characteristic findings during slit lamp bio-microscopy examinations are prominent corneal
nerves and fine parallel striae (Vogt’s striae) observed in the posterior stroma, anterior to
Descemet's membrane, these striae disappear when gentle pressure is applied on the globe
(Sherwin et al., 2017). Iron deposits at the base of the cone known as Fleischer ring, may be
observed as incomplete initially, to complete rings at the demarcation of the base of the cone.
As the disease progresses corneal thinning may be observed at the cone apex as well as
superficial linear scars which result from ruptures in the Bowman's layer. In more advance
keratoconus ruptures in Descemet's membrane create deeper opacities at the cone apex.
Aqueous imbibition into the stroma through these defects in Descemet's membrane may cause
corneal oedema (hydrops) also known as acute keratoconus, which may persist for weeks or
months, eventually replaced by scar tissue (Feder and Gan, 2011). Intra-stromal cysts or clefts
may occur as a result of corneal hydrops, which may lead to stromal neovascularisation
(invasion of small blood vessels), which poses a higher risk of future corneal graft rejection
(Parker et al., 2015).
Corneal scarring due to keratoconus disease progression occurs in approximately 30% of eyes
(Barr et al., 2000; Zadnik et al., 1998). Corneal scarring induces forward and backward scatter
and absorption of light, which results in reduction of VA. Corneal scarring may occur as a
natural disease progression in keratoconus or may be induced or accelerated by external factors
such as CRGPcl flat fitting CRGPcl (Korb et al., 1982).

41
Keratometry and Topography
The keratometer measures corneal curvature of the principal meridians only at a central 3-4mm,
by superimposing fine images of projected mires (targets) reflected from the cornea. Inability
to superimpose these images suggests irregular corneal astigmatism, a hallmark of keratoconus.
There is no keratometric value beyond which the diagnosis of keratoconus is definite.
Steepening of the inferior cornea compared to central cornea is typical in keratoconus and may
be identified by keratometry (Feder and Gan, 2011).
Corneal topographers were developed to enable accurate measurement of larger corneal surface
area, originally introduced by Antonio Placido in 1880, consisted of circular, alternating black
and white mire pattern, with a central aperture through which the clinician could view the
reflected virtual image (Versaci and Vestri, 2017). Video capture of Placido disk images and
the automatic detection of the mires facilitated calculation of corneal shape and power
distribution, represented in modern topography with the color-coded contour maps introduced
by Maguire and associates (Maguire et al., 1987). The ‘warmer’ colours represent higher
dioptric powers and steeper curvatures, the ‘cooler’ colours represent the lower dioptric powers
and flatter curvatures. Similar color-coded maps can be used to present changes in corneal
elevation.
The slit-based tomographers measure both the anterior and posterior corneal surface, which
enables the measurement of corneal pachymetry (thickness), which greatly aids in the diagnosis
of corneal ectasiae (Versaci and Vestri, 2017). Pachymetry measurements have become
essential in the diagnosis of early keratoconus, grading disease severity and shown that the
thinnest areas of the corneal stroma are generally infero-temporal to the line of sight (Ambrósio
et al., 2017).
The two topographical approaches in general use currently are the Placido disk or reflection-
based topographers, and the scanning slit-based tomographers. However, other methods to
measure corneal shape have been developed and include scanning slit technology, raster
stereography, scanning high-frequency ultrasound, holography, Fourier profilometry, and
optical coherence tomography (OCT) (Martinez and Klyce, 2011; Versaci and Vestri, 2017;
Cavas-Martínez et al., 2017).

42
A. B. C. D.
Figure 2.6. A Topographer with Placido rings B Rings reflected from cornea C color-coded
contour map normal cornea. D color-coded contour map Keratoconus
Computer-assisted corneal topographers have become an essential standard in the diagnosis of
subclinical keratoconus and for tracking the progression of the disease (Wilson and Klyce,
1991a; Duncan et al., 2016a). Various methods for the measurement and display of corneal
topography have emerged. The original reflected Placido rings systems have evolved and are
used in isolation or in conjunction with slit-scan systems; raster-stereography and scheimpflug
photography in the analysis of corneal topography and keratoconus detection (Versaci and
Vestri, 2017) (Fig 2.6). Corneae are radially asymmetric, aspheric, and may be irregular (Bogan
et al., 1990). This is particularly true for corneae of patients who have corneal ectatic disorders
(Martinez and Klyce, 2011).
A number of statistical indices have been created from corneal topography data in order to
derive corneal quantitative measurements, classification and screening algorithms, such as the
simulated keratometry, which measure the power derived from the four points in the central 3–
4mm of the principal meridians and may be used for numerous tasks from diagnostics to contact
lens fitting. Irregularity of the corneal topography over the pupil is represented with the Surface
Regularity Index (SRI) (Wilson and Klyce, 1991b), which is correlated to potential visual
acuity and is a measure of local fluctuations in central corneal power. It represents the regularity
of the central corneal surface in front of the pupil; higher values suggest higher irregularity and
a consequent reduction in visual acuity (Cavas-Martínez et al., 2017).
Conversion of corneal topography to corneal wave-front may be used for the presentation and
evaluation of corneal optics. Fourier transforms and Zernike polynomials are also quantitative
descriptors of corneal surface optics and can be used to calculate the optical aberrations of the
cornea (Figure 2.7) (Keller and van Saarloos, 1997; Oliveira et al., 2012).

43
Figure 2.7. Zernike Polynomials https://images.google.co.uk/
Other indices were developed to detect specific patterns seen in corneal ectatic conditions, and
artificial intelligence techniques were used in the algorithms to recognize topographical
appearances of keratoconus and other abnormal corneal conditions (Swartz et al., 2007;
Duncan et al., 2016b; Lopes et al., 2016).
Management and treatment of keratoconus
When keratoconus is mild it may be successfully managed with spectacle and soft contact lens
correction. If disease progression is detected, treatment to increase corneal rigidity, collagen
cross-linking (CXL), may be considered to halt or slow the progression of keratoconus (Wittig-
Silva et al., 2008; Giacomin et al., 2016; O’Brart, 2017). CXL is achieved by corneal stromal
saturation with riboflavin followed by irradiation with ultraviolet-A light, which induces cross-
links at the surface of collagen fibrils, with resultant overall increase in mechanical stiffness,
which usually halts the progression keratoconus (Bao et al., 2017).

44
If spectacles and standard contact lenses fail to provide adequate visual function, specialist
contact lenses are required to manage the visual disability caused by the corneal irregularity in
keratoconus (Watts and Colby, 2017). Contact lens intolerance may result from epithelial
breakdown over a sub-epithelial scar at the apex of the cone. This epithelial abnormality may
be debrided by a special laser assisted procedure, phototherapeutic keratectomy and after the
cornea has healed, contact lens wear may be resumed (Rapuano, 1997).
Individuals with early to moderate keratoconus, without central scarring who are intolerant to
contact lenses, may be candidates for intra-stromal ring segment (INTACS) insertion. This
procedure flattens the central cornea when circular plastic implants are inserted into specially
created tunnels in the peripheral corneal stroma aiming to reshape the cornea and reduce its
irregularity (Alio et al., 2006; Kılıç et al., 2017).
When stable and comfortable contact lens fit cannot be achieved or when contact lenses fail to
provide adequate vision, surgical management may be considered. Keratoplasty (corneal
transplantation) depend on the individual’s needs and the surgeon’s preferred technique.
Traditionally full thickness corneal replacement, penetrating keratoplasty, which entails
removing the entire thickness of the cornea and replacing with donor tissue, has been the
surgery of choice (Bao et al., 2017). The partial removal and replacement of stromal tissue;
lamellar keratoplasty may be considered for mild to moderate disease. A more recent
alternative used is deep anterior lamellar keratoplasty, in which only the anterior corneal layers
are removed and replaced with healthy donor tissue, leaving Descemet’s membrane and
endothelium, with the advantage of preserving these tissues (Feder and Gan, 2011; del Barrio
et al., 2017).
Summary
Chapter 2 outlines relevant aspects of corneal ectatic disorders, specifically keratoconus, the
most commonly encountered corneal ectasia. The complex, multifactorial aetiology of
keratoconus remains only partially understood, with inconclusive evidence regarding
environmental and genetic influences. Recent research, which revealed evidence to
overexpression of inflammatory mediators undermines the very definition of keratoconus as a
non-inflammatory corneal disorder. The consensus regarding keratoconus is that it is a
bilateral, progressive disorder, with highly variable prevalence and incidence, due in part to its

45
complex aetiology, but also the variability in diagnostic criteria. The significantly detrimental
effect of keratoconus on the integrity of the retinal image and therefore on vision is universally
accepted, and results from irregular astigmatism and high order aberrations and in many cases
corneal scarring. The impact of keratoconus is exacerbated by young age at which the disease
presents. When keratoconus progresses to levels which are not amenable to standard optical
corrections with spectacles and soft contact lenses, the preferred mode of management is
RGPcl, which neutralise the corneal irregularity and facilitate restoration of clear vision.
Contact lens management of keratoconus will be discussed in the next chapter.

46
Chapter 3: Literature review: contact lenses in the management of
keratoconus.
In this chapter, key literature on the contact lens management of keratoconus and related
disorders will be presented. Based on the literature presented, the rationale for the research
described in successive chapters will be outlined. The methodology of literature search in this
chapter is outlined in the section Methodology of literature search section at the beginning of
chapter 2 page 30.
Introduction
Contact lenses have evolved since the 1900s when they were made from materials impervious
to air such as glass or polymethylmethacrylate, to the modern highly gas permeable soft and
rigid materials (Robertson and Cavanagh, 2011). Soft contact lenses became commercially
available in 1965 and have improved considerably over the years, in design, manufacture, and
material (e.g., improved oxygen permeability).
Contact lenses are routinely used as the primary mode of vision correction and in 2007 were
estimated to be used by 125million wearers worldwide (Key, 2007). They offer obvious
cosmetic benefits and improvement in Qol (Plowright et al., 2015), compared with glasses
(Ehsaei et al., 2011). Superior visual performance over spectacles is achieved by the
elimination of the magnification effects, which degrade visual quality in individuals with high
myopia / hyperopia, astigmatism or anisometropia [large difference in refractive error between
the eyes] (Benjamin, 2006; Taylor Kulp et al., 2006). The well-centred optical zone of contact
lenses, unlike the fixed optical zone of spectacles, moves with the eyes, providing improved
optical alignment with the direction of gaze, thereby improving peripheral and binocular vision.
For patients with uncorrected regular and irregular astigmatism, rigid lenses often provide
superior to spectacle visual quality through the formation of an aqueous ‘lens’ in the post lens
47
tear film, which optically neutralizes regular and irregular corneal astigmatism (Robertson and
Cavanagh, 2011; Watts and Colby, 2017). Modern contact lens designs can meet almost any
individual optical requirement in both healthy and pathological eyes. These optical advantages
of contact lenses may be offset in some cases by the contact lens interaction with the tear film,
such as occur in ocular surface abnormalities associated with dry eyes and other tear film
dysfunctions (Muntz et al., 2015). Other significant limitations of contact lenses are
interruption of oxygen (O2) supply to the cornea, risk of infection and mechanical trauma.
Contact lenses pose a barrier to natural corneal respiration since the cornea, which has no direct
blood supply, relies on its contact with the atmosphere for supply of O2 and removal of carbon
dioxide (CO2). The barrier that contact lenses pose to normal gas exchange between the cornea
and the atmosphere was found to cause corneal warpage, vascularization, oedema, and
susceptibility to infection (Robertson and Cavanagh, 2011). Contact lens materials have
evolved continuously over the past several decades to improve O2 permeability, to maintain
healthy corneal physiology.
Contact lens material permeability to air is defined as Dk, where D is the diffusion coefficient
of the material and k is the air solubility constant (Fatt, 1986). The O2 transmissibility of a
specific lens is a measure of O2 permeability as a function of lens thickness, Dk/t (Fatt, 1986;
Nicolson and Vogt, 2001). The higher the DK and the DK/t values the better the transmission
of air through the contact lens matrix, leading to healthier the corneal physiology during contact
lens wear (Fatt, 1996).
Microbial keratitis is the most serious complication of contact lens use, and contact lenses are
a major risk factor for corneal ulcers (Cohen, 2011). Corneal ulcers are usually caused by
bacteria such as pseudomonas, other microorganisms such as fungi and amoeba may be
involved in microbial keratitis in contact lens wearers.
Mechanical corneal trauma from contact lenses such as corneal abrasion, can cause discomfort,
compromise the physical barrier to resident and foreign microorganisms and can produce
scarring that impairs visual function. Intensive antibiotic treatment may be required if the
abrasion is associated with immune-mediated infiltrates because it may rapidly develop into a
microbial keratitis (Cohen, 2011). In keratoconus mechanical trauma is associated with reduced
contact lens tolerance, scarring and disease progression due to corneal scarring, which will be
discussed in detail below.

48
Contact lens types
Soft contact lenses
Conventional soft, flexible lenses are composed of a HEMA (2-hydroxyethylmethacrylate)
core polymer and a hydrophilic monomer which functions to absorb water. To reduce the rate
of infection and other complications associated with contact lens wear, materials with better
lens-cornea biocompatibility and oxygen transmissibility were developed to optimize corneal
physiology during contact lens wear (Holden and Mertz, 1984).
Corneal rigid gas permeable contact lenses (CRGPcl)
In the early 1980s, newer Rigid Gas Permeable contact lens (RGPcl) materials and designs
emerged replacing the original impermeable polymethylmethacrylate material. Compared with
early soft contact lenses, CRGPcl offer significant physiological advantages as well as
improved comfort and safety because they do not cover the entire corneal surface, feature high
O2 permeability/transmissibility values and due to their mobility during blinks generate
continuous tear exchange. Additional advantages of CRGPcl over soft lenses include increased
durability, enhancement of visual acuity, due to neutralization of both regular and irregular
corneal astigmatism (Benjamin, 2006) and a decrease in adverse reaction due to resistance to
binding of tear film deposits and chemically preserved contact lens care solutions. Despite the
advantages of RGP materials, the majority of contact lens wearers use soft lenses owing to
greater comfort during adaptation (Morgan and Efron, 2006).

49
Scleral gas permeable contact lenses (SRGPcl)
SRGPcl vault (bridge over) the cornea and limbus and are physically supported entirely by the
conjunctival tissue overlying the sclera (van der Worp, 2015). The lack of widespread use of
SRGPcl since their inception in the 1880s is attributable to limitations in corneal imaging
systems, problems with contact lens manufacturing technology and products and skills required
for fitting, cost and patient perceptions. The use of SRGPcl has recently increased due to
availability of large-diameter RGP buttons, from which lenses are lathe cut, improvement in
corneal and scleral contour assessment and computer-driven lathes, which are now able to
accurately produce large-diameter lenses to precise specifications. The development of
complex modern SRGPcl designs and availability of diagnostic fitting sets have recently
facilitated a more widespread utilisation of these lenses (van der Worp et al., 2014).
Contact lenses in corneal disease
Common indications for therapeutic contact lenses include their use as a bandage to support
and protect the cornea, manage pain, and aid in epithelial healing following abrasions or
recurrent corneal erosions. Bandage contact lenses most commonly fitted are the soft highly
O2 permeable, such as silicone hydrogel contact lenses, although large diameter CRGPcl and
SRGPcl may occasionally be utilised in the rehabilitation of diseased ocular surface (Christie,
1999).
In eyes with keratoconus the visual distortions lead to significantly lower visual Qol scores
compared to individuals with normal corneal health (Tatematsu-Ogawa et al., 2008; Aydin
Kurna et al., 2014). Vision in eyes with keratoconus may be markedly improved by RGPcl, by
the optical neutralisation of the corneal irregularity by the tear layer formed by the regular rigid
contact lens surface (Benjamin, 2006). Due to the similarity in the refractive index of the cornea
and the tear film under the RGPcl, 90% of the corneal irregularity is optically neutralised
(Figure 3.1) (Szczotka-Flyn et al., 2006).

50
Figure 3.1. Neutralisation of corneal irregularity by tear film reservoir
(https://images.google.co.uk/.)
According to the Scleral lens education society, the classification of RGPcl is determined by
the area of contact between the lens and the ocular surface (van der Worp, 2015). If a lens bears
on the cornea only, it is called a CRGPcl (Figures 3.2. a, b). A lens which partly rests on the
cornea and partly on the sclera is called a corneo-scleral lens. A lens which rests entirely on
the sclera is classified as a SRGPcl (Figure 3.3) (van der Worp et al., 2014). Over the years a
plethora of contact lens designs has emerged.
Figure 3.2. CRGPcl on eyes with keratoconus
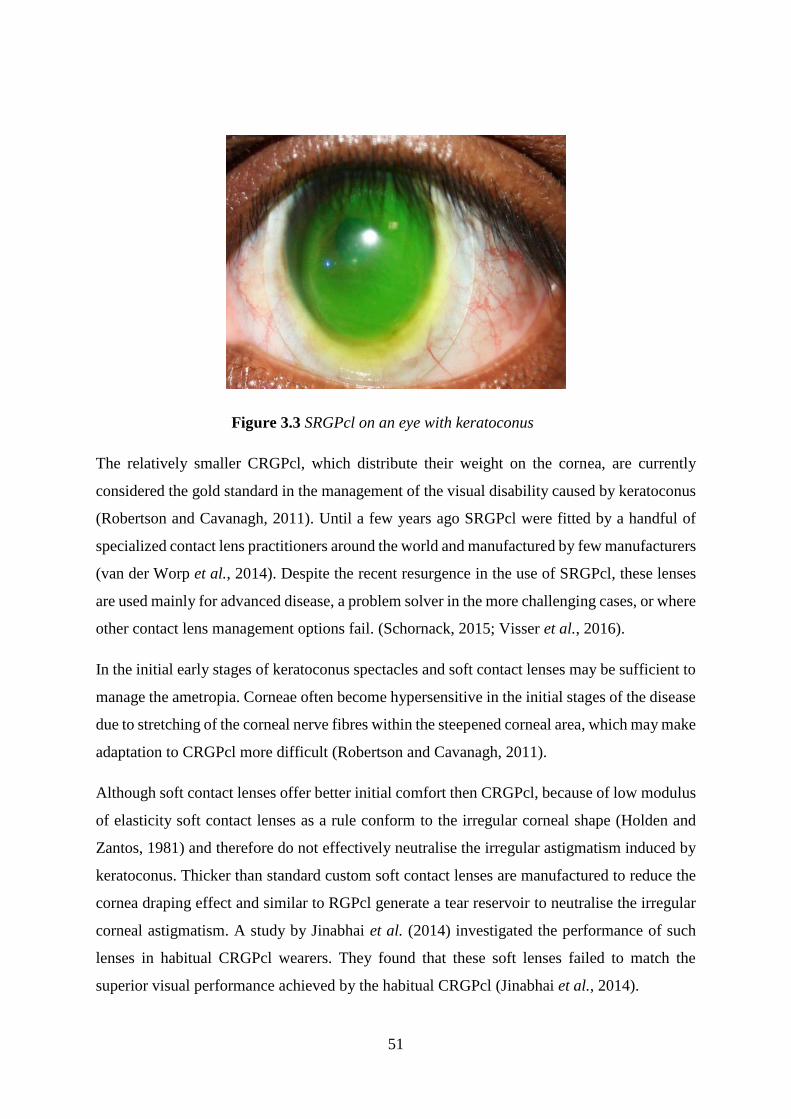
51
Figure 3.3 SRGPcl on an eye with keratoconus
The relatively smaller CRGPcl, which distribute their weight on the cornea, are currently
considered the gold standard in the management of the visual disability caused by keratoconus
(Robertson and Cavanagh, 2011). Until a few years ago SRGPcl were fitted by a handful of
specialized contact lens practitioners around the world and manufactured by few manufacturers
(van der Worp et al., 2014). Despite the recent resurgence in the use of SRGPcl, these lenses
are used mainly for advanced disease, a problem solver in the more challenging cases, or where
other contact lens management options fail. (Schornack, 2015; Visser et al., 2016).
In the initial early stages of keratoconus spectacles and soft contact lenses may be sufficient to
manage the ametropia. Corneae often become hypersensitive in the initial stages of the disease
due to stretching of the corneal nerve fibres within the steepened corneal area, which may make
adaptation to CRGPcl more difficult (Robertson and Cavanagh, 2011).
Although soft contact lenses offer better initial comfort then CRGPcl, because of low modulus
of elasticity soft contact lenses as a rule conform to the irregular corneal shape (Holden and
Zantos, 1981) and therefore do not effectively neutralise the irregular astigmatism induced by
keratoconus. Thicker than standard custom soft contact lenses are manufactured to reduce the
cornea draping effect and similar to RGPcl generate a tear reservoir to neutralise the irregular
corneal astigmatism. A study by Jinabhai et al. (2014) investigated the performance of such
lenses in habitual CRGPcl wearers. They found that these soft lenses failed to match the
superior visual performance achieved by the habitual CRGPcl (Jinabhai et al., 2014).

52
Management of keratoconus
Contact lens types for the management of keratoconus are summarised in Table 3.1. CRGPcl
are fitted directly onto the corneal surface to correct the corneal optical abnormalities, these
lenses are relatively small and cover up to 80% of the corneal surface area, attached to it by
surface tension forces. There is no standard fitting algorithm for every cornea with keratoconus,
it is therefore imperative to employ a variety of lens designs to address individual cases.
Although multiple CRGPcl designs are utilised in the management of keratoconus, there is to
date a lack of high-quality evidence from controlled prospective clinical trials comparing the
performance of different proprietary CRGPcl designs (Downie and Lindsay, 2015).
Topographical assessment of corneal shape and curvature, revealing the shape, type, size and
position of the cone, is an essential first step in CRGPcl fitting. Specialist designs of CRGPcl
are available, such as the Rose-K design (Menicon USA, Clovis, CA), which was found to be
successful for centrally positioned cones (Ozkurt et al., 2008). The Rose-K and other CRGPcl
for keratoconus are designed with steeper than normal central lens curvature to fit the steep
corneal cone, and flatter peripheral lens curvature to align the more normal corneal periphery
and distribute the weight of the lens in that area, to avoid excessive mechanical pressure on the
cone (Watts and Colby, 2017). These lenses are available in overall diameters of 7.9–10.2mm,
with central curves ranging from 4.75mm (steep) to 8.0mm (relatively flat). Variable peripheral
curves are designed for attaining the recommended peripheral corneal alignment and the
desired lens edge lift of 0.8mm in order to facilitate good tear exchange. The newer Rose-K2
lens design incorporates a posterior, central aspheric curve, for further optimisation of lens fit
and vision and is advocated not only for centrally positioned nipple cones but also for oval
cones (Romero-Jimenez et al., 2013).
The stability of CRGPcl is affected by the lens cornea fitting relationship: eyelid forces (e.g.,
during blinking) and gravitational forces. These lenses therefore exhibit a level of inherent
positional instability on the cornea, which is more pronounced when fitted to eyes with
keratoconus. CRGPcl may display multidirectional movement, decentration, rotation, rocking,
tilt and flexure, all of which may reduce comfort and cause retinal image degradation by
inducing optical aberrations. Zadnik et al., (2000) reported in the Collaborative Longitudinal
53
Evaluation of Keratoconus (CLEK*) study, that CRGPcl fitted to unscarred keratoconic eyes
achieved what is considered normal BCVA in only 34.6% of cases (Zadnik et al., 2000).
*[The (CLEK) study is an eight-year, multi-centre, natural history study of 1,209 CRGPcl
wearing patients with keratoconus who were examined annually for eight years. Its goals were
to prospectively characterise changes in vision, corneal curvature, corneal status, and vision
related Qol].
Large diameter RGPcl ranging from 10.4-12.0mm, the intra-limbal designs are also used in
keratoconus fitting (Ozbek and Cohen, 2006). The resulting larger optic zone (circa 9.4 mm)
may improve vision, especially in corneae with decentred cones, due to better lens centration
(Watts and Colby, 2017). The drawbacks of these lenses relate to sub-optimal distribution of
lens weight over the cone and peripheral cornea and more challenging lens handling.
With advanced cones and significant irregular astigmatism, clinicians may not be able to
achieve adequate lens centration and stability with CRGPcl, the semi-scleral and SRGPcl may
be fitted. These lenses are designed to rest on the sclera and vault the entire cornea and limbus.
The reduced lens movement and minimal lens edge interaction with the eyelids result in
comfort similar to soft contact lenses (Visser et al., 2016). SRGPcl are currently available in
advanced and varied designs with the aim of achieving better physical fit and optical
performance. Fitting of modern SRGPcl is performed through diagnostic lens assessment using
trial lenses (van der Worp et al., 2014).
Patients intolerant of CRGPcl may also be fitted with hybrid lenses (Figure 3.4), which have a
rigid centre of 8-8.5mm and a soft lens skirt reaching diameters of 14-15mm. In 2008,
SynergEyes have developed hybrid lenses with skirts made of silicone hydrogel material, with
good oxygen transmissibility, which makes these an ideal hybrid lens for keratoconus (Nau,
2008). The commonly encountered problems of corneal hypoxia, oedema and
neovascularization with the older hybrid lenses are less likely to occur with the newer materials
(improved oxygen permeability) and designs. However, the occasional lens tightening may
cause corneal abrasions and allergic reactions such as giant papillary conjunctivitis (Chung et
al., 2001).

54
Figure 3.4. SynergEyes UltraHealth Hybrid lens for keratoconus (image kindly
supplied by SynergEyes UK)
Another alternative to CRGPcl are the piggyback lens combination (O'Donnell and
Maldonado-Codina, 2004). Lens fit is accomplished by first fitting a low plus-power soft
contact lens and on top of it a 9.0–9.5mm CRGPcl. Custom soft lens designs are available, such
as the Flexlens with a cut-out or depression to hold the CRGPcl and maintain optimal centration
(Watts and Colby, 2017) . My own impression is that the main drawbacks of the piggyback
system are the cost of lenses, patient compliance with the complex cleaning regimen of soft
and hard lenses and sub-optimal physiological performance due to reduced O2 transmission
through the combination of two lenses.

55
Table 3.1 Contact lens options for keratoconus (Robertson and Cavanagh, 2011 P.1223)
Contact lens type Indication
Conventional hydrogels Early cones with little astigmatism, lenses will drape the
cornea
Silicone hydrogel Early cones, less lens drape due to higher modulus
Toric hydrogels Early cones with regular astigmatism
Soft keratoconic designs Early to moderate cones, increased central lens thickness to
mask irregular astigmatism
Corneal RGP standard design Early to moderate cones, individual lens parameters may be
modified to enhance lens fit
Aspheric corneal RGP Early to moderate cones, lens decentration may cause
problems with vision
RGP keratoconus designs Moderate to advanced cones, may add toric surfaces to
enhance vision
Semi-scleral and scleral RGP Advanced cones, vault the cornea, may use toric designs to
enhance lens fit, bi-toric designs to enhance lens fit and vision
Piggy-back and hybrid designs Moderate to advanced cones, comfort of soft lenses vision of
RGP lenses.
CRGPcl in the management of keratoconus
In the following section key literature will be used to describe aspects related to the
management of keratoconus with CRGPcl, their fitting approaches and effects on the visual
Qol of the lens wearers and corneal pathophysiology.

56
Quality of life with CRGPcl
Patients with keratoconus require prolonged daily contact lens wearing schedules because their
visual wellbeing depends on contact lens correction of their corneal irregularity. The aim of
the diagnostic fitting process, which utilises fluorescein* for the assessment of lens fitting
patterns, is to achieve the optimal lens cornea fitting relationship. [*sodium fluorescein, NaFl,
is a diagnostic dye used routinely in optometric practice for enhancing visualisation of the tear
film, cornea and conjunctiva. In RGPcl fitting the NaFl enhanced tear film thickness is
evaluated to achieve the desired lens cornea relationship].
CRGPcl are considered the gold standard in the management of keratoconus. However, their
fitting, especially in the more advanced stages of the disease, is not as straight-forward as in
normal corneae. Even well-fitting lenses may result in complications such as sub-optimal
vision, reduced tolerance and exacerbation of the corneal disease.
Kymes et al., (2004) validated the vision related Qol instrument, the NEI-VFQ for patients
with keratoconus. They found that CRGPcl wearers with keratoconus had significantly lower
scores in all domains of the NEI-VFQ compared with an age matched reference group from a
study of Walline et al., (2000), of healthy CRGPcl wearers (Kymes et al., 2004; Walline et al.,
2000). It is therefore suggested that clinicians should carefully evaluate and address the full
range of Qol issues that may affect patients with keratoconus (Tatematsu-Ogawa et al., 2008).
Tatematsu-Ogawa et al., (2008) and Kurna et al., (2014) also found that vision related Qol was
worse in individuals with keratoconus than in healthy individuals when assessed by NEI-VFQ
and suggested that the maintenance of good BCVA with contact lens correction may improve
vision related Qol (Tatematsu-Ogawa et al., 2008; Aydin Kurna et al., 2014).
Wu et al., (2015) reported that CRGPcl do not improve the visual Qol of patients with the more
advanced stages of keratoconus. They recommended that other contact lens modalities should
be available for those patients to achieve better subjective outcomes (Wu et al., 2015).
Jones-Jordan et al., (2013) reported on 961 subjects with keratoconus who completed the NEI
VFQ. They found relatively small changes in the NEI-VFQ scores due to the maintenance
adequate BCVA in CRGPcl. The authors found that larger ocular asymmetry; decreases in VA
and increase in corneal steepness in the better eye were associated with decreasing Qol scores.

57
They concluded that the vision of the better eye typically has a more significant effect on visual
Qol than the difference between the eyes (Jones-Jordan et al., 2013).
Effects of CRGPcl on the keratoconic cornea
Although the scarring of Bowman's layer and the anterior corneal stroma may occur as a natural
disease process (Feder and Gan, 2011), the increased susceptibility of the keratoconic corneae
to trauma (Wojcik et al., 2014) is thought to be associated with abnormal expression of genes
responsible for the biochemical processes in wound healing. Chronic corneal epithelial trauma
is therefore thought to be associated with the pathogenesis and progression of keratoconus
(Kim et al., 1999; Wojcik et al., 2014). Corneal abrasions and scarring which arise as a result
of chronic corneal injury by CRGPcl are therefore a major concern and led to critical reviews
and refinements of CRGPcl fitting techniques (Ruben, 1975; McMonnies, 2005; Szczotka-Flyn
et al., 2006).
Fitting methods of CRGPcl
There are three philosophies for fitting of CRGPcl in keratoconus (Loft and Wolffsohn, 2016;
Szczotka-Flyn et al., 2006; Watts and Colby, 2017).
1. The apical bearing fitting method (Figure 3.5a)
2. The apical clearance or cone vaulting fitting method (Figure 3.5b)
3. Three-point-touch, or the divided-support fitting method (Figure 3.5c)

58
1. The apical bearing with primary lens support and bearing on the apex of the cornea and
minimal peripheral stabilisation.
Figure 3.5a. Examples NaFl patterns in flat central fitting with cone bearing.
2. Apical clearance or cone vaulting, with lens support and bearing directed away from the
apex to the para-central cornea.
Figure 3.5b. NaFl patterns in central clearance fitting with excessive (bubbles) to acceptable
cone clearance
3. Three-point-touch, or the divided-support method, with emphasis directed towards reducing
or "feathering" the apical touch to minimise scarring of the fragile apical cone area. This is
done by distributing the lens weight and spreading it over a larger area, including the central
and peripheral cornea.

59
Figure 3.5c. NaFl patterns in divided support, three-point touch, fitting
Currently the most widely accepted corneal lens fitting philosophy is the three point touch or
the divided support method, in which the intention is to distribute the weight of the lens
between the cone area and the normal peripheral cornea (Loft and Wolffsohn, 2016; Szczotka-
Flyn et al., 2006; Woodward, 1989; Watts and Colby, 2017), thus achieving good physical lens
fit and minimal physiological corneal insult (Figure 3.5d).
Optimal centration lens centration side view translation/movement in down gaze
Figure 3.5d. Optimal physical CRGPcl fit.
60
Fitting methods and their relation to corneal pathology progression
Corneal bearing fitting method of CRGPcl
Mechanical interaction between the CRGPcl and cornea is inevitable, irrespective of the
method of fitting. If as a result of these interactions the ectatic cornea fails to maintain an intact
epithelium, its deficient wound healing mechanisms may contribute to stromal scarring and
disease progression.
Korb et al., (1982) suggested that the harsh contact between the CRGPcl and the fragile corneal
apex in keratoconus is likely to be associated with corneal scarring (Korb et al., 1982). They
investigated whether apical corneal insults such as corneal abrasion and scarring may be the
consequence of the apical-bearing lens fitting method. They recruited 7 patients with
keratoconus who had never worn contact lenses and fitted them with CRGPcl. The
experimental eye was fitted with a lens bearing on the cone; the control eye was fitted with
cone clearance. The authors postulated that this fitting difference between the eyes in the same
individual would ensure that the primary variable would be the lens-cornea relationship. The
intra-subject variability was minimised by selecting individuals fulfilling nine criteria of
disease severity equivalence.
Both lens fitting modalities were fitted to the better and worse eyes in equal numbers. Detailed
examinations of the state of the cornea were performed at baseline and during follow up at
intervals of 1, 2, 4, 8, and 12 weeks. Further follow-up was performed at 3-month intervals for
the first year. After one year the authors found no significant or permanent changes in the
corneae of any of the seven eyes fitted by apical clearance. In contrast, 4 of the 7 experimental
eyes fitted with apical bearing, developed superficial opacities (scarring) after 3-12 months. A
fifth eye wearing the apical bearing lens developed a moderate corneal fold after 12 months.
The experimental, cone-bearing lenses were reported to be more comfortable than the control
(apical clearance) in all 5 eyes, which exhibited the adverse findings (the better reported
comfort was most likely due to better vision, normally achieved with cone bearing). The
acquired corneal opacities in the four eyes remained permanent.

61
These results led to the conclusion that lenses fitted with apical bearing produced corneal
scarring, whilst lenses fitted with apical clearance did not. Interestingly of the four corneae
which developed scarring, two occurred with the more advanced and two with the less
advanced level of keratoconus. This finding suggests that the fitting characteristics of CRGPcl
may be more important in the development of scarring than differences in the degree of
keratoconus.
The authors recommended that attempts to achieve central apical clearance or at least a three-
point divided support fit should be attempted in eyes with keratoconus and heavy apical
bearing of CRGPcl on the cornea should be avoided.
Despite the small sample size and the selection of participants with early keratoconus,
inexperienced in contact lens wear, this study supported the clinical impressions and reports of
previous investigators (Bier and Lowther, 1977; Black and in Girard, 1967; Williams, 1960)
who have advised against the fitting of CRGPcl by the apical bearing method. The authors did
not address other important aspects of contact lens wear, such as differences in comfort and
quality of vision between the two fitting methods, furthermore the lens designs used for the
two methods of fitting were not identical; this introduces an additional variable which may
have affected the results.
Zadnik et al., (2005) compared the safety and efficacy of flat and steep fitting CRGPcl in 761
keratoconic participants who completed an 8-year follow up in the CLEK study. At baseline
they found that 41% of eyes with CRGPcl had a corneal scar compared with 24% corneal
scarring in non-CRGPcl wearers (Zadnik et al., 2005). CRGPcl were fitted with apical bearing
and apical clearance to 87% and 13% respectively. They found that 43% of the corneae fitted
with apical bearing were scarred compared to 26% of those fitted with apical clearance. When
the eyes with unscarred corneae at baseline were evaluated, they found that by year 8, 32% of
these eyes developed scarring during wear of apical bearing lenses, compared with 14%
scarring of corneae fitted with apical clearance (p=0.007).
The authors postulated that despite the significant differences in corneal scarring between the
two methods of fitting, only a randomised study would be able to assess the risk of corneal
scarring due to a particular fitting method. The CLEK study is a natural history sample;
therefore, the correlation of fitting method and corneal scarring is not necessarily causal. As
more advanced disease presents higher risk for scarring and CRGPcl tend to fit flatter and bear
on the corneal apex in advanced keratoconus, it is impossible to statistically discriminate

62
between the effects of flat fitting lenses and disease severity on the incidence of corneal
scarring. This principle also applies to other CLEK studies such as measurement of VA in
(Zadnik and Mutti, 1987), assessment of contact lens comfort (Edrington et al., 2004) and
evaluation of ocular pain (Kymes et al., 2008).
The difference between the divided support and apical bearing fitting methods is often difficult
to establish, especially in a progressive disorder such as keratoconus. As the disease progresses,
the divided support lens fit, with minimal bearing on the apex may alter into heavy bearing
even when disease progression is relatively minor, as described by Edrington et al., (1999).
The authors re-fitted the 808 patients according to a protocol of fitting from their previous
study (Edrington et al., 1996) and analysed the lens-cornea fitting relationship of the habitual
lenses worn by these patients. They found prior to refitting the participants, that despite the
clinically established association between cone bearing and corneal scarring, 88% of eyes had
their habitual CRGPcl bearing on the cone apex, and only 12% exhibited corneal clearance
(Edrington et al., 1999).
A report by Szczotka et al., (2001) in the CLEK study, evaluated corneal scarring, visual acuity,
corneal curvature and Qol in 1209 CRGPcl wearers with keratoconus. They found that 88%
wore CRGPcl with apical bearing, 53% had corneal scarring in one or both eyes, and that
corneal scarring was associated with corneal staining, contact lens wear, age, the presence of a
Fleischer's ring and a steeper cornea. All these parameters except age contributed to, or may
have been the result of, CRGPcl bearing on the cornea (Szczotka et al., 2001).
Since almost 90% of keratoconic CRGPcl in the CLEK study exhibited apical bearing
(Edrington et al., 1999) and more than 50% had corneal scarring in one or both eyes (Szczotka
et al., 2001), these findings appear to support the conclusions of Korb et al., (1982), which
attributed a causal relationship between chronic CRGPcl bearing on cornea and corneal
scarring. Furthermore, the CLEK study concluded that corneal scarring was associated with
decreased measures of high and low-contrast visual acuity, and possibly the reduced visual Qol
in keratoconic CRGPcl wearers. Since the nature of CRGPcl fit may be causal or contributory
to the complications associated with corneal morbidity, reduced visual performance and visual
Qol, it follows that practitioners should take measures to minimise contact lens wear related
complications such as corneal scarring when managing corneal ectasiae with CRGPcl.

63
Apical clearance fitting of CRGPcl
Clinical experience shows that the steep central curvature of CRGPcl required to achieve a
vault of the corneal apex, may also cause problems such as: the trapping of air bubbles in the
flatter areas adjacent to the corneal apex, which may disrupt vision by corneal deformation
(Szczotka-Flyn et al., 2006). The small optic zone and lens diameters used in fitting
keratoconus, may lead to discomfort and visual disturbances such as halos, ghosting and glare
due to the encroachment of the peripheral (non-optical) part of CRGPcl into the pupil area. The
steep lens curves required in this approach may reduce tear exchange and lens mobility
resulting in tear stagnation, oedema, corneal insult and lens intolerance. The positively powered
tear lens created by the steep central back curve, requires high negative optical powers, which
may reduce retinal image quality and increase lens thickness (Szczotka-Flyn et al., 2006). Lens
flexure resulting from the steep central fit will induce astigmatism and reduce vision (Sorbara
et al., 2000).
Gundel et al., (1996) investigated the feasibility of fitting keratoconic patients with apical
clearance, as recommended by Korb et al. (1982). To achieve apical clearance, they used the
lens design developed and validated by Edrington et al., (1996) (Gundel et al., 1996). Thirty
eyes of 17 participants were randomly assigned to a steep lens-fitting protocol*; the lenses
dispensed had on average a 0.6mm steeper central radius than their habitual CRGPcl *[Their
fitting protocol stipulated that a 0.2 mm steeper radius than the diagnostic lens which exhibits
a definite apical clearance (DFCL) is used]. The strict criteria for success were based on the
measurement of VA, hours of daily lens wear and observable levels of corneal fluorescein
staining, erosions, distortion from CRGPcl pressure, corneal oedema and scarring. All these
changes were noted at different stages for some subjects, including central corneal scarring in
one eye after 12 months. At 12 months the mean visual acuity was 6/7.5 (logMAR 0.10) and
the average wearing time was 14 hours a day, both features are indicative of a successful result.
As no control group was implemented in this study, no comparative results with alternative
fitting approaches such as divided support or corneal bearing lenses are available. Nevertheless,
the conclusion of this study was that fitting keratoconic corneae with apical clearance is a viable
method.

64
An interesting finding in this study is the corneal steepening in 14 eyes (47%), the flat meridian
increased by 2.29D, the steep meridian increased by 1.28D, which indicates corneal moulding.
This effect was especially obvious in 5 of the 14 eyes that showed a mean increase of 5.9D
(0.83mm) in the flattest meridian and 3.92D (0.56mm) mean increase in the steepest. These
findings demonstrate a marked increase in the level of keratoconus in those eyes, which is
known to be associated with increased risks of scarring (Zadnik and Mutti, 1987), reduced
visual acuity (Zadnik et al., 2005) and a reduction in almost all aspects of NEI-VFQ scores
(Kymes et al., 2004; Kymes et al., 2008; Aydin Kurna et al., 2014).
McMonnies (2004) reported a case in which a keratoconic patient wore a substantially steeper
lens in the right eye and flatter lens in the left eye due to accidental lens switching. The right
eye required an alteration in contact lens fitting due to a progression in keratoconus at a higher
rate than exhibited previously and more than the progression exhibited by the left eye. The
author suggested that: It is possible that the adventitious apical clearance fitting on the right
eye served to promote an increase in ectasia that might not have occurred if the intended apical
support fitting had been worn (McMonnies, 2004). This case report is in agreement with the
findings of Gundel et al., (1996) regarding the possible contribution / causation of disease
progression by CRGPcl fitted to vault the cone apex.
The corneal shape changes occurring in orthokeratology*, a method in which centrally flat
fitting CRGPcl worn overnight, generate tear fluid pressure to alter the shape of the cornea in
a controlled manner to achieve a desired optical change (Maseedupally et al., 2013), may be
useful in understanding the tendency of even the healthy corneae to adopt the shape and
curvature of the CRGPcl. These changes which affect corneal thickness and shape (Gifford et
al., 2011) are reversible, the healthy cornea returns to its original shape and thickness,
exhibiting no significant difference to controls in the frequency or severity of corneal NaFl
staining during wear (Lui et al., 2000), no alteration in the corneal epithelial permeability and
no clinically significant changes in corneal biomechanical properties on lens removal (Yeh et
al., 2013).
Hartstein and Becker (1970) examined the corneal rigidity in three groups of patients who were
successful long-term wearers of CRGPcl. Despite the inability to perform statistical analysis
due to the small numbers involved, the authors postulated that higher ocular rigidity is
associated with a better maintenance of a normal corneal shape and that at least one type of

65
keratoconus may be related to the long-term wearing of CRGPcl in eyes with unusually low
ocular rigidity (Hartstein and Becker, 1970) .
Hill et al., (1974) found that even healthy corneae are susceptible to deformation by CRGPcl
by showing that corneal steepening occurred in 85% with centrally steep lenses over a period
of 1 to 6 years. (Hill and Rengstorff, 1974).
In keratoconus the central cornea is abnormally thin, soft and pliable compared with the normal
cornea, it exhibits reduced total protein, variable total collagen, and reduced levels of sulphate
proteoglycans (Kenney and Brown, 2003). The pathological thinning in keratoconus may
develop as a result of altered biomechanical properties (Bao et al., 2017) such as the loss of
tensile strength and elasticity (Wojcik et al., 2014) or may be the primary change, which if
associated with loss of elasticity and increased plasticity, may reduce the corneal ability to
recover from trauma associated with external mechanical insult such as contact lens wear or
eye rubbing (Gordon-Shaag et al., 2015). Kenney and Brown (2003) who examined the
hypothesis of a cascade of events causing keratoconus and its progression, recommend that
patients with keratoconus should minimize their exposure to oxidative stress by wearing
ultraviolet protection, minimize the mechanical trauma like eye rubbing, poorly fitting contact
lenses and keep eyes comfortable with artificial tears, non-steroidal anti-inflammatory drugs
and/or allergy medications (Kenney and Brown, 2003). The recovery from deformation by a
healthy cornea such as observed in orthokeratology and poorly fitting CRGPcl may not occur
in keratoconus, in which corneal biomechanics are impaired (Wojcik et al., 2014; Kenney and
Brown, 2003; Bao et al., 2017). This impaired recovery may predispose the cornea to
permanent deformation by the mechanical pressure induced by sub optimally fitting CRGP and
lead to progressive pathological changes as demonstrated by Gundel et al., (1996) and noted
by McMonnies (2004, 2005).
McMonnies (2005) analysed the possible influence of eyelid tonus, tear fluid pressure and
intraocular pressure on the generation and progression of keratoconus during CRGPcl wear.
He postulated that the lens bearing on the peripheral cornea and suction forces in the central
area generated by lenses fitted with apical clearance are compounded by the rise in intraocular
pressure due to eyelid squeeze forces during blinks, which may be pushing and stretching the
softer central cornea and cause keratoconus progression by additional forward protrusion. This
would occur due to strong sub-atmospheric fluid pressure forces under the lens that draw the
lens to the cornea and the cornea to the lens, which flattens the mid peripheral cornea and

66
facilitates compensatory steepening of the apex. He concluded that the known risk of scarring
responses to excessively flat fitting CRGPcl must be balanced against the possible risk of
corneal moulding and keratoconus progression responses to CRGPcl fitted with apical
clearance. He suggested that fittings by divided support, where there is minimal central bearing
or clearance may be the most appropriate fitting approach. He stipulated that this is difficult to
achieve in practice in view of the high level of accuracy required and the dynamic-progressive
nature of keratoconus. The author further suggested that any large increases of intraocular
pressure due to activities such as vigorous eye rubbing, strong squeeze blinks, inverted body
positions, and strenuous muscular effort, should be recognised as risk factors in patients with,
or at risk of keratoconus, glaucoma, or progressive myopia (McMonnies, 2005).
McMonnies summarised the known risks associated with apical support fitting method.
1. Chronic corneal epithelial changes, which may not be evident on bio-microscopy.
2. Chronic, visible epithelial trauma caused by friction between CRGPcl and cornea.
3. Acute or chronic epithelial trauma that results in permanent scarring of the corneal apex.
4. Chronic epithelial trauma that may cause corneal stromal thinning.
McMonnies summarised the known risks associated with the apical clearance fitting.
1. Corneal moulding may be greater in keratoconus due to reduced tensile strength and
elasticity, and/or greater plasticity of the softer and thinner cornea.
2. Reduced oxygen tension caused by the thicker lens and post-lens tear layer, leading to
corneal oedema and increased tendency to mould to the steeper lens curvature.
3. Progression of ectasia if moulding to the steeper lens curvature becomes a permanent change.
4. Tighter lenses with sharper transitions may reduce lens movement and cause imprinting
insult of the corneal epithelium.
5. Apical clearance may facilitate fine bubbles formation, increase light scatter and glare.
6. Cornea moulding to a steeper shape during lens wear may cause a myopic shift and reduction
in unaided visual acuity on lens removal.
67
7. Reduced acuity with contact lenses may result from residual astigmatism (McMonnies,
2004; McMonnies, 2005).
Summary of CRGPcl fitting methods and their effects on keratoconus progression
The available evidence suggests that corneal changes associated with both CRGPcl fitting
philosophies have significant negative effects on VA and disease status. The scarring
associated with CRGPcl wear (Barr et al., 2000) is likely to be caused by apical support-cone
bearing lenses, found in the majority (88%) of patients (Edrington et al., 1999). The cone
clearance fitting philosophy recommended to safeguard against corneal scarring (Gundel et
al., 1996; Korb et al., 1982) appears to negatively affect disease progression by inducing
permanent corneal steepening (McMonnies, 2004; McMonnies, 2005). The theoretically
desirable fitting method of divided support may not be achievable or sustained in many wearers
(McMonnies, 2005). CRGPcl may therefore contribute to disease progression and adversely
affect vision, corneal health, contact lens tolerance and subsequently all aspects of visual Qol,
as demonstrated by Kymes et al. (2008), who found that a decline in visual acuity of 10 letters,
and a disease progression equivalent to a corneal curvature increase of 3.00D, were associated
with significant declines (10 points) in the NEI-VFQ scale scores (Kymes et al., 2008).
Clinical implications of SRGPcl management of keratoconus
CRGPcl provide better high and low contrast BCVA than spectacles and soft lenses in eyes
with keratoconus (Griffiths et al., 1998) and are the most widely prescribed optical
management in keratoconus (Zadnik et al., 1998; Mandathara et al., 2017). The conclusion
from the discussion above is that irrespective of the fitting philosophy, CRGPcl may contribute
to or cause pathological changes in keratoconic corneae. It is therefore understandable that
68
SRGPcl, which vault (bridge over) the cornea attracted considerable interest in the management
of keratoconus.
Both SRGPcl and CRGPcl, almost completely neutralise the anterior corneal surface
irregularities caused by ectatic corneal disorders. Unlike CRGPcl, which distribute their weight
and mass on the cornea, SRGPcl are fitted to bear on the sclera, without contact with any part
of the cornea, which precludes mechanical interaction between the cornea and contact lens
surface. The cornea is immersed in the tear and saline reservoir vaulted by SRGPcl (van der
Worp et al., 2014; Visser et al., 2013; Visser et al., 2007a). The cornea is therefore protected
not only from mechanical interaction with the rigid contact lens surface but also from the
shearing forces of the eyelids, eye rubbing, exposure to ultraviolet radiation and external debris,
all of which are recognised irritants with the potential to exacerbate keratoconus (Wojcik et al.,
2014; Kenney and Brown, 2003). However, SRGPcl are not prescribed as a first option but
only when other lenses did not provide adequate management (van der Worp et al., 2014;
Szczotka-Flyn et al., 2006). This view was supported by Rathi et al., (2013) who stipulated
that contact lenses can improve the vision and delay or obviate the need for keratoplasty and
that the lenses of choice are CRGPcl. They recommend that if discomfort with or intolerance
to CRGPcl occur, then customized soft toric, piggyback combination or hybrid contact lenses
should be fitted. SRGPcl in their opinion are only to be used when all other options fail, or if
patients present with associated ocular allergic disease (Rathi et al., 2013). This reluctance to
use SRGPcl remains, despite significant improvements in manufacturing techniques, wider
availability of improved lens designs, systematisation of the fitting protocols, availability of
preformed SRGPcl fitting sets and substantial reductions in costs (van der Worp et al., 2014).
Other researchers suggest that long-term management with SRGPcl reduced the indication for
corneal transplant surgery in severe keratoconus by more than 50% (Koppen et al., 2017) and
was well accepted in patients with advanced ectasia who are intolerant to other contact lenses,
or when surgery is not available or considered inappropriate (Maharana et al., 2016).
Visser et al. (2007) performed a prospective study to evaluate the indications for modern
SRGPcl and their clinical performance (Visser et al., 2007a). In part II: the authors have
evaluated patient satisfaction with their SRGPcl (Visser et al., 2007b). All 178 participants
(284 eyes) in these studies failed with other contact lens modalities, 143 (50.3%) eyes had
keratoconus, 56 (19.7%) eyes had penetrating keratoplasty [full thickness central corneal graft
surgery], the rest had irregular astigmatism due to various causes such as PMD and ocular
69
surface disorders such as keratitis sicca [severe dry eye disorder] and corneal dystrophies,
totalling 25 eyes (8.8%). SRGPcl were fitted according to a strict fitting protocol which aimed
to achieve the desired clearance of the cornea and the limbus, the peripheral-haptic zone of the
lens was fitted precisely to align the sclera and distribute lens weight without causing undue
local pressure. When required, custom made toric scleral lenses were used to achieve this. The
authors claimed that optimal lens fitting characteristics were achieved with most eyes. Fifty-
nine eyes (20.8%) had to be refitted due to adverse clinical findings. Most patients showed no
adverse clinical signs during their review appointments, with the exception of bulbar
conjunctiva [the area which bears the weight of the lens] hyperaemia [redness due to local
blood vessel dilation], which occurred in 20.8% of eyes. The authors stipulated that a well-
balanced scleral bearing area, gentle movement of the lens with digital push up testing,
approximately 250μm of corneal clearance and 50μm-100μm of limbal clearance are all
essential fitting attributes to avoid contact lens related complications. The authors claimed to
achieve visual rehabilitation with SRGPcl for this group of patients by demonstrating
significant increases in monocular and binocular visual acuities compared to glasses. This
improvement was most apparent in participants with keratoconus and penetrating keratoplasty.
No comparison was made between SRGPcl and CRGPcl with respect to visual acuity.
Earlier studies by Kok and Visser (1992), Tan et al., (1995), Pullum and Buckley (1997), Segal
et al., (2003), Pullum et al., (2005) and Rosenthal and Croteau (2005), all found similar
favourable visual improvements and positive clinical performances of SRGPcl in cases of
challenging diseased corneae, in eyes which could not be managed by other contact lens options
(Kok and Visser, 1992; Tan et al., 1995; Pullum and Buckley, 1997; Segal et al., 2003; Pullum
et al., 2005).
Despite variations in study design, sample sizes, conditions managed, definition of diagnoses,
fitting methods, scleral lens types, materials, and so forth their results highlight the usefulness
of SRGPcl in clinical practice. As in the earlier studies the conclusions of Visser et al., (2007)
were: “modern scleral lenses can be used successfully for visual rehabilitation and
management of a wide range of corneal disorders that have not responded adequately to other
treatment modalities” (Visser et al., 2007a).
In a follow up publication Visser et al., (2007b) examined the satisfaction levels with SRGPcl
in the same 178 participants. Fifty per cent were refitted from CRGPcl, 30% wore no lenses at
all, and the rest had various other lens types. The participants were asked to state the number

70
of insertion attempts, lens wearing hours, number of breaks from wearing lenses and the
previous correction before they had received SRGPcl. Scores from a Likert scale questionnaire;
from 1 (very poor) to 5 (excellent) were obtained for the original lenses as well as for the
SRGPcl fitted during the first phase of the study. The questionnaire covered 3 topics: comfort,
visual quality and overall satisfaction as well as 7 aspects of contact lens wear: comfort, lens
dryness, visual quality, air bubbles during lens wear, tear debris during lens wear, lens
cleanliness and lens handling. Significantly higher scores were obtained with SRGPcl. Scores
of 3 (out of 5) for comfort were given by 98.9%, for visual quality by 97.9% and overall
satisfaction by 98.9% of participants. In comparison scores of 3 or more were given with the
former correction by 54.6% for comfort, by 51.8% for visual quality, and by 50.4% for overall
satisfaction. Significant increases were found in the scores with SRGPcl for all three topics
(p<0.001). Higher scores for comfort, visual quality, and overall satisfaction were found in
more than 75%, furthermore in the 99 eyes refitted from a spherical SRGPcl to toric design
[for better scleral fit], significant increases in comfort, visual quality, and overall satisfaction
were observed (Visser et al., 2007b). The authors suggested that this was because of better lens
weight distribution on the naturally toric peripheral sclera, as found by other studies (Visser et
al., 2006; Visser et al., 2013).
High level of subjective satisfaction was confirmed in patients with keratoconus refitted with
SRGPcl despite mid-day lens fogging, reported by 50% of them (Bergmanson et al., 2016). A
retrospective cohort study by Baran et al., (2012) investigated the success rate of fitting
SRGPcl in the management of corneal ectasia (Baran et al., 2012). They reviewed the records
of 59 patients with corneal ectasia disorders, the majority of whom (74.6%) wore CRGPcl.
SRGPcl were fitted to 89 eyes of 49 patients. Forty-three patients, 78 eyes (88%) with
keratoconus completed the validated NEI-VFQ (Mangione et al., 2001; Aydin Kurna et al.,
2014) at six months. The authors measured an improvement of 27.6/100 points (p < 0.001). In
the 10 patients who passed the selection criteria but were not dispensed with SRGPcl, no
significant difference in the score was found at six months (p<0.697). The authors concluded
that a satisfactory fit of SRGPcl in participants with ectasia results in a positive impact on
visual acuity and continued successful contact lens wear. The authors further stipulated that
SRGPcl treatment is an alternative to penetrating keratoplasty for patients with corneal ectasia
who are contact lens intolerant.
A retrospective study by Pecego et al., (2012) reported the results of fitting the Jupiter SRGPcl
in 107 eyes of 63 participants with a variety of ocular conditions; the majority (63%) had
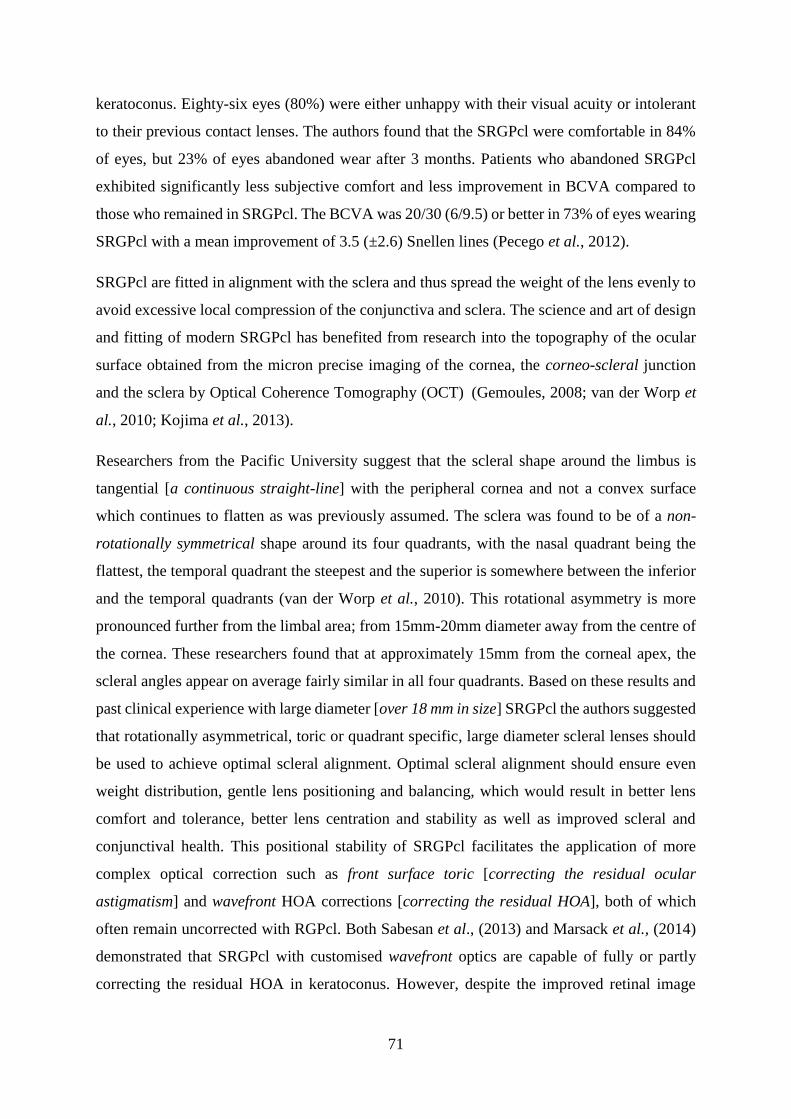
71
keratoconus. Eighty-six eyes (80%) were either unhappy with their visual acuity or intolerant
to their previous contact lenses. The authors found that the SRGPcl were comfortable in 84%
of eyes, but 23% of eyes abandoned wear after 3 months. Patients who abandoned SRGPcl
exhibited significantly less subjective comfort and less improvement in BCVA compared to
those who remained in SRGPcl. The BCVA was 20/30 (6/9.5) or better in 73% of eyes wearing
SRGPcl with a mean improvement of 3.5 (±2.6) Snellen lines (Pecego et al., 2012).
SRGPcl are fitted in alignment with the sclera and thus spread the weight of the lens evenly to
avoid excessive local compression of the conjunctiva and sclera. The science and art of design
and fitting of modern SRGPcl has benefited from research into the topography of the ocular
surface obtained from the micron precise imaging of the cornea, the corneo-scleral junction
and the sclera by Optical Coherence Tomography (OCT) (Gemoules, 2008; van der Worp et
al., 2010; Kojima et al., 2013).
Researchers from the Pacific University suggest that the scleral shape around the limbus is
tangential [a continuous straight-line] with the peripheral cornea and not a convex surface
which continues to flatten as was previously assumed. The sclera was found to be of a non-
rotationally symmetrical shape around its four quadrants, with the nasal quadrant being the
flattest, the temporal quadrant the steepest and the superior is somewhere between the inferior
and the temporal quadrants (van der Worp et al., 2010). This rotational asymmetry is more
pronounced further from the limbal area; from 15mm-20mm diameter away from the centre of
the cornea. These researchers found that at approximately 15mm from the corneal apex, the
scleral angles appear on average fairly similar in all four quadrants. Based on these results and
past clinical experience with large diameter [over 18 mm in size] SRGPcl the authors suggested
that rotationally asymmetrical, toric or quadrant specific, large diameter scleral lenses should
be used to achieve optimal scleral alignment. Optimal scleral alignment should ensure even
weight distribution, gentle lens positioning and balancing, which would result in better lens
comfort and tolerance, better lens centration and stability as well as improved scleral and
conjunctival health. This positional stability of SRGPcl facilitates the application of more
complex optical correction such as front surface toric [correcting the residual ocular
astigmatism] and wavefront HOA corrections [correcting the residual HOA], both of which
often remain uncorrected with RGPcl. Both Sabesan et al., (2013) and Marsack et al., (2014)
demonstrated that SRGPcl with customised wavefront optics are capable of fully or partly
correcting the residual HOA in keratoconus. However, despite the improved retinal image
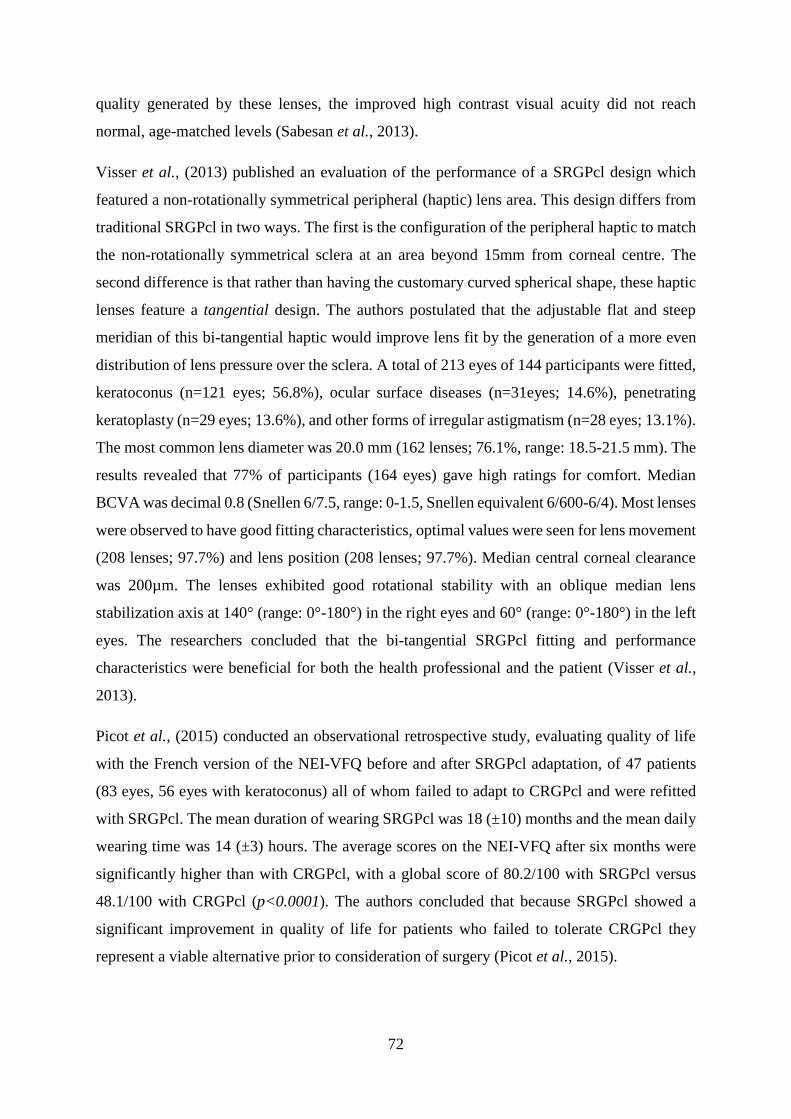
72
quality generated by these lenses, the improved high contrast visual acuity did not reach
normal, age-matched levels (Sabesan et al., 2013).
Visser et al., (2013) published an evaluation of the performance of a SRGPcl design which
featured a non-rotationally symmetrical peripheral (haptic) lens area. This design differs from
traditional SRGPcl in two ways. The first is the configuration of the peripheral haptic to match
the non-rotationally symmetrical sclera at an area beyond 15mm from corneal centre. The
second difference is that rather than having the customary curved spherical shape, these haptic
lenses feature a tangential design. The authors postulated that the adjustable flat and steep
meridian of this bi-tangential haptic would improve lens fit by the generation of a more even
distribution of lens pressure over the sclera. A total of 213 eyes of 144 participants were fitted,
keratoconus (n=121 eyes; 56.8%), ocular surface diseases (n=31eyes; 14.6%), penetrating
keratoplasty (n=29 eyes; 13.6%), and other forms of irregular astigmatism (n=28 eyes; 13.1%).
The most common lens diameter was 20.0 mm (162 lenses; 76.1%, range: 18.5-21.5 mm). The
results revealed that 77% of participants (164 eyes) gave high ratings for comfort. Median
BCVA was decimal 0.8 (Snellen 6/7.5, range: 0-1.5, Snellen equivalent 6/600-6/4). Most lenses
were observed to have good fitting characteristics, optimal values were seen for lens movement
(208 lenses; 97.7%) and lens position (208 lenses; 97.7%). Median central corneal clearance
was 200µm. The lenses exhibited good rotational stability with an oblique median lens
stabilization axis at 140° (range: 0°-180°) in the right eyes and 60° (range: 0°-180°) in the left
eyes. The researchers concluded that the bi-tangential SRGPcl fitting and performance
characteristics were beneficial for both the health professional and the patient (Visser et al.,
2013).
Picot et al., (2015) conducted an observational retrospective study, evaluating quality of life
with the French version of the NEI-VFQ before and after SRGPcl adaptation, of 47 patients
(83 eyes, 56 eyes with keratoconus) all of whom failed to adapt to CRGPcl and were refitted
with SRGPcl. The mean duration of wearing SRGPcl was 18 (±10) months and the mean daily
wearing time was 14 (±3) hours. The average scores on the NEI-VFQ after six months were
significantly higher than with CRGPcl, with a global score of 80.2/100 with SRGPcl versus
48.1/100 with CRGPcl (p<0.0001). The authors concluded that because SRGPcl showed a
significant improvement in quality of life for patients who failed to tolerate CRGPcl they
represent a viable alternative prior to consideration of surgery (Picot et al., 2015).

73
A recent literature review of the complications and fitting challenges associated with SRGPcl
(Walker et al., 2016) reveal that serious complications as a result of infection, inflammation
and corneal hypoxia are rare with modern materials and designs. To prevent corneal hypoxia,
the materials of SRGPcl need to feature high Dk values such as Boston EO (Dk 82), XO (Dk
100) and Menicon Z (Dk 160), as well as having a tear lens thickness of not more than 200µm
(Jaynes et al., 2015). They highlight the challenges of obtaining optimal fitting characteristics
in view of the natural asymmetry of the sclera, such as lens seal-off, which may cause lens
suction and reduced tear exchange. Lens bearing on the corneal limbus should be avoided due
to the importance and sensitivity to mechanical lens pressure of this stem cell rich area (Figures
3.6a. and b.).
Figure 3.6a. NaFl fit of SRGPcl with dark area at 1 o’clock indicating heavy lens bearing on
the cornea. Copied from Walker et al., (2016) with permission from Maria K. Walker, OD,
MS, FAAO, FSLS.
Figure 3.6b A. Circum-limbal bearing. B. Local epithelial breakdown staining. Copied from
Walker et al., (2016) with permission from Maria K. Walker, OD, MS, FAAO, FSLS.
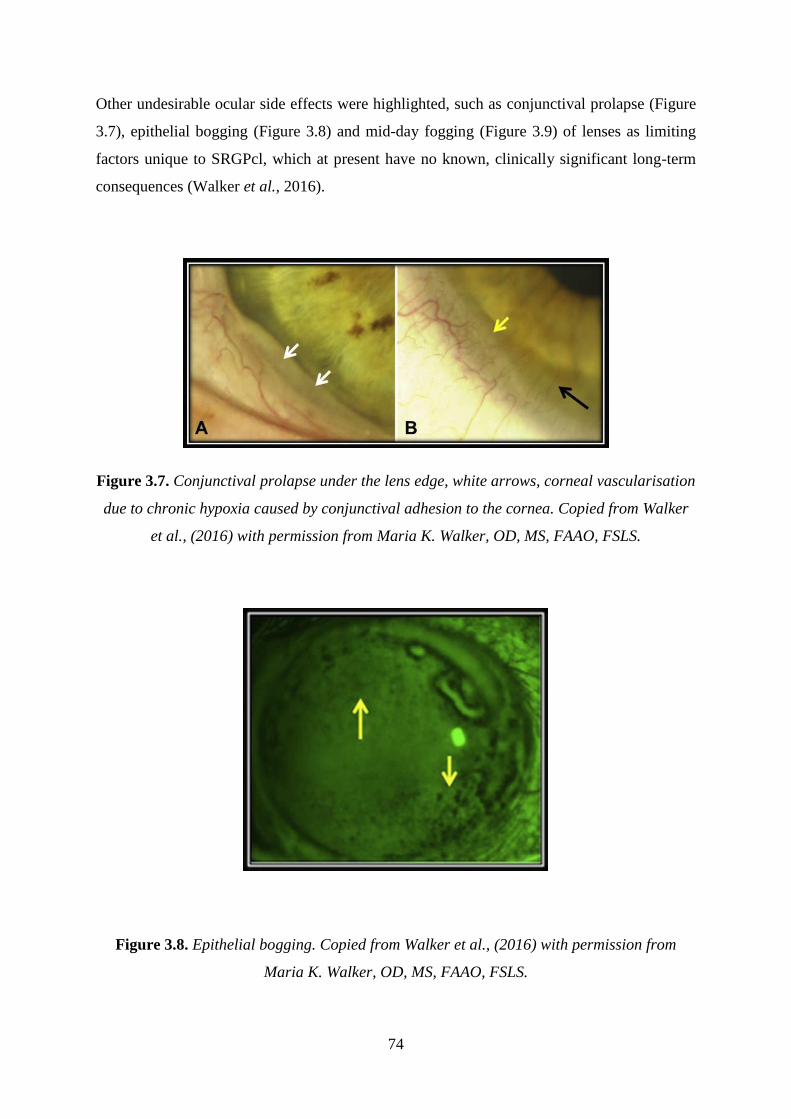
74
Other undesirable ocular side effects were highlighted, such as conjunctival prolapse (Figure
3.7), epithelial bogging (Figure 3.8) and mid-day fogging (Figure 3.9) of lenses as limiting
factors unique to SRGPcl, which at present have no known, clinically significant long-term
consequences (Walker et al., 2016).
Figure 3.7. Conjunctival prolapse under the lens edge, white arrows, corneal vascularisation
due to chronic hypoxia caused by conjunctival adhesion to the cornea. Copied from Walker
et al., (2016) with permission from Maria K. Walker, OD, MS, FAAO, FSLS.
Figure 3.8. Epithelial bogging. Copied from Walker et al., (2016) with permission from
Maria K. Walker, OD, MS, FAAO, FSLS.
75
Mid-day lens fogging was reported by 50% of satisfied keratoconic SRGPcl wearers, refitted
from CRGPcl (Bergmanson et al., 2016). A study by Carracedo et al., (2016) evaluated the
turbidity and thickness of the post lens tear layer and its effect on visual quality in 36
participants with keratoconus. They found a x8 higher number of particles per mm2 after eight
hours of SRGPcl wear compared to 5minutes after lens insertion (p < 0.05). A decrease in
BCVA (p < 0.001) and contrast sensitivity (p < 0.05) after eight hours of SRGPcl wear was
found, both of these visual outcome measures showed a significant correlation with post-lens
tear turbidity: r=0.567 (p=0.002) for turbid tear layer area and r=0.469 (p=0.049) for the
number of particles per mm². Tear layer thickness was considered to positively correlate with
tear turbidity, no correlation between turbidity and post-lens tear layer thickness was found
(p > 0.05) (Carracedo, Serramito-Blanco et al., 2017).
Figure 3.9. Lens fogging due to accumulation of particular matter behind the lens. The
arrows point to the post-lens tear film, which exhibits change in thickness and clarity. Copied
from Walker et al., (2016) with permission from Maria K. Walker, OD, MS, FAAO, FSLS.
In an earlier study exploring the utility of SRGPcl in the management of dry eye symptoms in
patient with keratoconus Carracedo et al., (2016) found that despite a significant decrease in
signs and symptoms of dry eyes, the MMP9 [inflammation bio-marker] increased significantly,
most likely due to tear stagnation and the use of saline in lens cavity at insertion (Carracedo et
76
al., 2016). These researchers found in a later study that corneal and limbal temperatures are not
affected by SRGPcl wear, which suggests that not enough inflammation occurs during SRGPcl
wear to increase temperature, the researchers also found no effect on tear volume or tear break
up time after lens removal (Carracedo,Wang et al., 2017).
Nixon et al., (2017) published a case series report which highlighted an unintended contact
lens related complication of corneal limbal bullae in all 14 participants fitted with small
diameter SRGPcl. [Corneal epithelial bullae are oval, larger than 40µm in size, gas and / or
fluid field lesions manifesting corneal epithelial oedema]. The authors concluded that due to
the unique design of these lenses an unintended mechanical bearing on the corneal limbus,
caused the undesirable local mechanical compression, which led to contact lens induced
epithelial edema after only 6 hours of lens wear (Nixon et al., 2017).
Weber et al., (2017) used conjunctival impression cytology to evaluate the changes in goblet
cell density and the inflammatory mediator HLA-DR [Human Leukocyte Antigen – antigen D
Related] after 12 months wear of SRGPcl in patients with moderate to severe dry eye disease.
They found that the goblet cell density did not differ significantly (p>0.05) and the
inflammatory mediator was also unchanged except in participants with Sjogren syndrome, in
which there was an increase in HLA expression (Weber et al., 2017).
Giasson et al., (2017) measured the in vivo oxygen tension available to the cornea and found
that after 5minutes of wear, SRGPcl fitted with a 400μm corneal clearance reduces oxygen
tension by 30% compared to a 200μm clearance (Giasson et al., 2017). Reduced oxygen to the
cornea may cause undesirable complications such as corneal oedema and vascularisation. Rathi
et al., (2017) described corneal vascularisation, which resolved on discontinuation of lens wear
(Rathi et al., 2017). Esen and Toker (2016) examined the influence of SRGPcl settling and
corneal clearance on clinical performance and hypoxia induced corneal changes. They found
that the corneal swelling after 8 hours was 62.8μm (1.3%) (80% occurred during the first 4hrs)
and wearers comfort scores were not significantly influenced by corneal clearance. They
nevertheless recommended fitting according to the current guidelines of using high DK
materials and minimising apical clearance and lens thickness, to facilitate long-term corneal
health (Esen and Toker, 2017)
The large size of SRGPcl may be challenging with respect to lens handling, in a retrospective
review of 34 patients fitted with SRGPcl, 8 patients (25%) were unable to handle these lenses

77
(Barnett et al., 2016). Even in successful SRGPcl wearers Suarez et al., (2018) found that 40%
of patients had persistent handling difficulties after 1 month of lens wear (Suarez et al., 2018).
Optimal fitting characteristics of SRGPcl are achievable nowadays due to the advent of
computerized lathe cutting technology, which enables manufacturing of very smooth lens
surfaces and edges with sub-micron precision. Contact lens practitioners are now able to adjust
individual lens parameters after assessing the lens fit during trials (Rathi et al., 2015). The
fitting characteristics of complete corneal clearance, the maintenance of liquid lens and the
physical protection from mechanical and other external irritants make SRGPcl useful in cases
of ocular surface pathology (Pullum and Buckley, 1997; Romero-Rangel et al., 2000; Stason
et al., 2010), corneal protection and aid in healing in cases of exposure keratitis (Chahal et al.,
2017; Zaki, 2017) and as a means in aiding management of oculo-plastic pathology such as
exposure keratitis and pain after blepharo-ptosis (droopy eyelids) surgery (Scofield-Kaplan et
al., 2017; Chahal et al., 2017). SRGPcl have demonstrated long term safety and efficacy in
complex cases such as ocular rehabilitation after penetrating keratoplasty (Severinsky et al.,
2014) or long-term maintenance of visual acuity in cases of dry eyes, when the fluid reservoir
between the cornea and SRGPcl needs to be increased (Sonsino and Mathe, 2013). In their
review of modern scleral lenses Maharana et al., (2016) concluded that SRGPcl are extremely
useful in patients with advanced ectasia intolerant to other contact lenses. (Maharana et al.,
2016). The majority of participants in the studies above were individuals whose management
with CRGPcl failed to deliver adequate tolerance and/or visual performance. These studies
conclude that SRGPcl are a viable management option where other correction modalities fail
to deliver the required comfortable and safe contact lens wear and / or the desired visual
outcome.
The decision regarding the most appropriate contact lenses in individual cases must be based
on the degree of corneal irregularity and on secondary factors, such as tear film deficiency and
corneal scars. Visser et al., (2016) developed a contact lens selection algorithm, based on peer
reviewed literature, which takes these primary and secondary factors into account. They
identified sub-optimally fitting lenses in 58% of the participants in their study, who benefitted
from a refitting (Visser et al., 2016).
Schornack (2015) published a literature review of 184 publications selected from 899 peer-
reviewed scientific publications related to SRGPcl design, fabrication, prescription, and
management. The author concluded that current literature provides little insight into the

78
potential effects of SRGPcl on anterior segment anatomy and physiology. The differences in
the physical features as well as the fitting characteristics of the various available SRGPcl,
precludes the assumption of consistency of their performance and effect on the anterior eye.
The author suggested that before embracing the use of SRGPcl in healthy eyes it would be
advisable to fully explore potential metabolic and mechanical challenges to anterior segment
structures. Specific aspects which are characteristic to SRGPcl such as fluid reservoir
thickness, may present a significant barrier to oxygen transmissibility and may lead to hypoxic
complications, furthermore the rate and volume of tear exchange beneath the lens and its effects
on the physiology of the anterior segment are not yet known. There are currently no evidence-
based guidelines for ideal scleral lens fitting characteristics and use of appropriate care
products, or reports regarding incidence of complications and risk factors for complications.
The author concluded that for patients with few other options for disease management,
” we can be reasonably confident that the risks of inaction or surgical intervention
outweigh potential risks of scleral lens wear, but the exact placement of scleral lenses
within an overall management strategy has yet to be defined” (Schornack, 2015).
After reviewing the literature my conclusion is that the current clinical approach in the
management of keratoconus and other irregular corneal disorders is to fit SRGPcl in two
circumstances. First for patients who are intolerant to CRGPcl, second when pathology is either
adversely affected by CRGPcl or too advanced to be effectively managed by CRGPcl or other
contact lens modalities such as soft, hybrid and piggyback combination lenses, with corneal
transplant surgery remaining the only option.

79
Summary
In the management of keratoconus and related conditions with CRGPcl, researchers highlight
the importance of avoiding corneal trauma, chronic irritation, scarring and deformation through
moulding, to preserve corneal integrity and protect against contact lens related exacerbation of
pathology.
Individuals with keratoconus may not only suffer from sub optimally fitting CRGPcl
(Edrington et al., 1999) but also exhibit higher prevalence of atopic disease and therefore
greater sensitivity to external irritants such as glare, dust, pollen and contact lens edges and
movement (Feder and Gan, 2011). These factors may reduce their tolerance to the small
diameter, highly mobile, sub-optimally fitted CRGPcl. The close proximity of CRGPcl to the
fragile, bio-mechanically compromised keratoconic cornea has the potential to cause
undesirable effects, exacerbating corneal pathology. Due to the progressive nature of
keratoconus, the requirement to distribute the weight of the CRGPcl evenly over the fragile
cone and the peripheral cornea is difficult to achieve and maintain. The most commonly
encountered feature in CRGPcl fitting of a keratoconic cornea is lens bearing on the cone,
which is considered by most researchers to lead to corneal scarring, with detrimental
consequences on vision, comfort and Qol.
When CRGPcl are fitted with corneal clearance to avoid corneal bearing, the resultant lens
cornea interaction may result in compromised comfort, reduced vision and lens tolerance and
most worryingly the exacerbation of pathology.
Due to their size and large, 360° area of contact / alignment with the sclera, SRGPcl are
minimally mobile and the thin and well-rounded lens edges are tucked-in under the eyelids,
which facilitate eyelid gliding over the smooth lens surface without undue irritation during
blinking. The complete vault of the entire cornea by the central portion of SRGPcl protects the
cornea and surrounding tissue from direct mechanical insult by the lens and external irritants
and debris. SRGPcl may therefore not only reduce or eliminate the adverse effects of direct
mechanical lens / cornea interactions but also provide a barrier to other external irritants.
SRGPcl may enable through utilisation of more complex optics improve the quality of the
retinal image. The additional advantage of modern highly gas permeable contact lens materials

80
and customisation of SRGPcl with modern computerised manufacturing make the use of these
lenses logical in the management of keratoconus and other irregular cornea disorders, not only
as the last resort in patients who failed with other contact lenses, but also as suggested by
(Bergmanson et al., 2016) as a lens of first choice. Despite these theoretical advantages of
SRGPcl there has not been a marked shift from using these lenses as a problem solver to lens
of first choice. Possible reasons for this may be greater costs, required fitting expertise, and
lack of high-quality evidence-based research.
In agreement with Mandathara et al., (2017), I found no randomised controlled trials evaluating
the management of keratoconus with contact lenses, nor other clinical studies which compare
the performance of SRGPcl on patients whose management with CRGPcl is satisfactory. A
RCT comparing outcome measures of visual performance, vision related Qol and SPC and
SPV, may be useful in the consideration of a wider use for modern SRGPcl in specialist contact
lens practice, not just as a problem solver but as a management of choice to positively enhance
the contact experience and potentially as first choice management option in patients with ectatic
disorders.
To address the issues raised above, a research question may be formulated as follows: Is there
a significant difference in the visual performance, visual Qol, SPC and SPV between CRGPcl
and SRGPcl in successful CRGPcl wearers with keratoconus.
The null hypothesis (H0) of this RCT is that there will be no difference between CRGPcl and
SRGPcl in any of the research outcome measures.
The alternative hypothesis is that a significant difference between CRGPcl and SRGPcl would
be found in one or more of the research outcomes.

81
Chapter 4: Methods
Introduction
In this section the research experimental design, interventions, outcome measures and
statistical methods will be described.
The chosen experimental design for this research is RCT with a crossover. The RCT when
appropriately designed, conducted, and reported, represents the gold standard quantitative
design for evaluating healthcare interventions (Schulz et al., 2010; Burns et al., 2011). The
crossover is described in more detail below, compares intra-subject differences between the
two groups, thus avoiding problems of comparability with regard to confounding variables
such as gender and age, as participants are their own controls (Wellek and Blettner, 2012).
RCT with a crossover was therefore considered the most appropriate experimental design to
show if a difference existed between the performance of the two experimental lens types. The
literature review showed to date no RCT researching contact lens management of keratoconus
was performed, this was also confirmed by other researchers (Mandathara et al., 2017).
Crossover design
A crossover design is a repeated measurements design such that each participant receives
different treatments during different time periods, by crossing over from one treatment to
another during the course of the trial. This is in contrast to a parallel design in which
participants are randomized to a treatment and remain on that treatment throughout the trial. In
crossover clinical trials the disease/condition should ideally be chronic and stable, and
the treatments should not result in total cures but only alleviate the disease / condition.
Crossover design therefore works well for chronic conditions, where there is no cure and the
treatments attempt to improve Qol.

82
Crossover design is considered appropriate in this experiment because, the condition
investigated: corneal ectasiae generally and keratoconus specifically, are chronic in nature
(Gordon-Shaag et al., 2015) and although progressive, tend to stabilise with time and are rarely
diagnosed after age 50 (Ramez et al., 2017). The treatment investigated in this research are two
different contact lens types, which both optimise VA by masking the irregular astigmatism and
reducing the HOA. These lenses are not curative but a mode of management of the optical /
visual disability caused by keratoconus (Feder and Gan, 2011; Watts and Colby, 2017).
Furthermore, we were interested in comparing two contact lens management alternatives with
respect to outcomes measures of visual quality, Qol and SPC and SPV, thus to control for
individual confounds, it was desirable to administer both management options to each
participant.
In this experiment the 2×2 crossover design was used (Table 4.1), participants who were
randomized to the sequence AB received treatment A in the first period and treatment B in the
second period, those randomised to sequence BA receive treatment B in the first period and
treatment A in the second period (Figure 4.1).
Table 4.1 Crossover design sequences
Period / Sequence Period 1 Period 2
Sequence AB CRGPcl SRGPcl
Sequence BA SRGPcl CRGPcl

83
Figure 4.1 sequence of randomisation and crossover
General Contact Lens Clinic Population
Selection + Informed Consent
Selected Participants
Randomisation [Period 0]
Group 1 (AB) Group 2 (BA)
Baseline
measurements and
CRGPcl fitting
Baseline
measurements and
SRGPcl fitting
Period 1 [Group 1, lens A], [Group 2 lens B]
Median length 17.5 (IQR 12.4) weeks
Outcome measures
+ refitting in
SRGPcl
Outcome measures
+ refitting in
CRGPcl
Washout Period
Length of 4 weeks
Crossover to
SRGPcl
Crossover to
CRGPcl
Period 2 [Group 1, lens B], [Group 2 lens A]
Median length 14.5 (IQR 6.2) weeks
Outcome measures,
completion final
lens choice
Outcome measures,
completion final
lens choice

84
The main disadvantage of a crossover design is that carryover, period and sequence effects
(see below) may be confounded with treatment effects and cannot be estimated separately,
which may bias results [treatment effect is the effect of a treatment at the time of its
application].
A carryover effect is defined as the effect of the treatment from the previous time period on the
response at the current time period, i.e., measurements taken during the second period may be
a result of the direct effect of the treatment in period 2 and/or the carryover or residual effect
of the treatment applied in period 1, yielding statistical bias. The incorporation of
appropriate washout periods in the experimental design can diminish the impact of carryover
effects. The presence of a differential carryover effect must be tested for by an appropriate
independent samples test comparing the sums of the treatments between the 2 groups (Wellek
and Blettner (2012). If a differential carryover effect is significant, this must be appropriately
accounted for in the statistical analysis (Jones and Kenward, 2015).
A washout period is defined as the time between treatment periods, the rationale for this is that
the previously administered treatment is “washed out” and therefore should not affect the
measurements taken during the current period with the exception of permanent effects which
alter the participant in some manner. Assuming that no significant permanent alteration of the
participant occurs, it is important to identify if a differential carryover effect, (carryover effect
due to [A] differs to carryover due to [B]), because if the carryover effects for [A] and [B] are
equivalent, this common carryover effect is not confounded with the treatment difference.
A sequence effect can result if participants assigned to one sequence are different from those
assigned to the other sequence, but under a randomized design it is reasonable to assume that
sequence effects are minimized (Diaz-Uriarte, 2002).
A period is each occasion on which a treatment is applied, a period effect must be accounted
for due to changes of the participants during the intervals between the measurements, or
through habituation to the measurement itself (Diaz-Uriarte, 2002). To test for the presence of
period effects, the crossover differences, which are equivalent to the differences in scores of
treatments for all subjects (A-B), are computed and compared by an appropriate independent
samples test (Diaz-Uriarte, 2002). The presence of a period effect must be accounted for in the
statistical analysis of the results (Table 4.2).

85
Wellek and Blettner (2012) in agreement with Diaz-Uriarte (2002), stated that crossover trials
are not typical matched-pairs designs, however are often analysed inappropriately, as if they
were. The main problems with this approach according to Diaz-Uriarte (2002) are
1. Not accounting for period effects, which may affect the results of measurements depending
on the period these measurements occurred.
2. Failure to consider carryover effects when comparing treatment effects.
These errors may lead to questionable results, where the lack of significant treatment effects
could be the consequence of inflated variances (type II error), and the significant effects
reported could be the result of either period or carryover effects (type I error) (Diaz-Uriarte,
2002).
The AB/BA design employed in this research is considered to be balanced [each treatment
precedes every other treatment the same number of times (once)], which means that if the
carryover effects are equal, then carryover effects are not confounded with treatment
differences.
The AB/BA design is also uniform within sequences [each treatment appears the same number
of times within each sequence], which means that sequence effects are not confounded with
treatment differences and are uniform within periods [each treatment appears the same number
of times within each period] minimising the confounding period effect.
Due to the design being balanced, one approach for the statistical analysis of the 2×2 crossover
is to conduct a preliminary test for differential carryover effects, if this is found to be not
significant, then the data from both periods are analysed in the usual manner. If there is a
differential carryover effect, then only the data from the first periods are analysed, where
differences between participants in the two groups are compared as in a parallel RCT (Wellek
and Blettner, 2012; Armitage and Hills, 1982).
Because this experimental design involves repeated measurements on participants, the
statistical modelling must account for between-participant variability [dispersion in
measurements from one participant to another], and within-participant variability [dispersion
in measurements from one time point to another within a patient]. The crucial variable for
analysis in a crossover design is the within subject difference in outcome between the two study

86
periods. In order to assess the difference between treatment effects, a statistically valid test for
independent samples has to be carried out with the values obtained for this variable.
The statistical analysis of normally-distributed data from a 2×2 crossover trial, under the
assumption that the carryover effects are equal is as follows:
The statistical model we assumed for continuous data from the 2×2 crossover trial [(Table 4.2
Jones and Kenward (2015)]:
Table 4.2 Crossover design sequence by period statistics (Jones and Kenward, 2015)
Sequence / Period Period 1 Period 2
Sequence AB μA + ν + ρ μB + ν - ρ + λA
Sequence BA μB - ν + ρ μA - ν - ρ + λB
μA and μB represent population means for the direct effects of treatments A and B, respectively,
ν represents a sequence effect, ρ represents a period effect, and λA and λB represent carryover
effects of treatments A and B, respectively. For sequence AB, the Period 1 vs. Period 2
difference has expectation μAB = μA - μB + 2ρ - λ. For sequence BA, the Period 1 vs. Period 2
difference has expectation μBA = μB - μA + 2ρ - λ. Therefore, we construct these differences for
every participant and compare the two sequences with respect to these differences using an
appropriate independent samples test. Thus, we are testing: H0: μAB - μBA = 0 for each outcome
measure (Jones and Kenward, 2015).

87
Study population recruitment
Participant selection
Most of the participants were recruited from the contact lens clinic in the ophthalmology
department at the Central Middlesex Hospital (CMH) in North-West London. The CMH
ophthalmology department provides specialist contact lens care to patients with corneal
pathologies or other conditions, which require contact lens care beyond the scope of many
community optometrists. Patients are usually referred to the department by community
optometrists via their general practitioners. Three patients, who completed the study, were
recruited from the chief investigator’s community practice. One patient approached the
investigator by email but did not fulfil the selection criterion of being free of problems with his
current CRGP contact lenses and therefore was rejected.
The CMH contact lens clinic offers a single, weekly clinical session, during which up to twelve
patients may be examined. Two optometrists provide specialist contact lens management to
patients in this clinic; the chief investigator Mr A. Levit and the research coordinator Mr A.
Stanton. Both optometrists are contact lens specialists with many years of experience of
working in the NHS hospital eye service and private specialist contact lens clinics. Both
optometrists achieved the Good Clinical Practice certification prior to starting this research
(Appendix IIIA).
Inclusion criteria
1. Diagnosis of Keratoconus or related primary and secondary irregular cornea conditions [see
chapter 2].
2. Participants are successful CRGPcl wearers.
88
3. Age 18 to 69. These ages were decided upon since contact lens management of keratoconus
rarely occurs before the age of 18, and additional eye morbidities which may affect vision are
more common after the age of 70.
Exclusion criteria
1. Patients with keratoconus who are satisfied with their unaided vision in both eyes.
2. Patients with keratoconus who have additional eye disease which affects their vision, such
as significant cataract, glaucoma etc.
Most participants were fitted with the experimental lenses in both eyes. For four participants
only one eye was fitted with both experimental lenses recruited. This is because, although
keratoconus is a bilateral disease (Gomes et al., 2015), there may be a significant asymmetry
between the two eyes (Zadnik et al., 2002). It is not unusual for patients to require keratoconus
management in one eye only, with the other eye having sub-clinical disease or having
undergone a corneal graft due to severe disease. It was therefore considered appropriate not to
exclude participants with eye asymmetry, who either required no treatment or wore contact
lenses which could not be included in this research. Including these patients was considered an
appropriate representation of the variety of patients with corneal ectasiae requiring contact lens
management.
Participants recruitment
The recruitment process was performed during the regular contact lens clinics. At CMH, the
research coordinator, would inform the prospective patients that they were eligible to
89
participate in the study and would provide them with written information about the study
(Appendix IA). In community practice the chief investigator’s clinical assistant Mr Daniel
Gorjian, would inform the prospective participants that they may be eligible to participate in
this research and provide the written information. The recruitment started in January 2016,
following ethical approvals in September 2015 and was completed in July 2018.
No direct payments were made to participants. However, all contact lenses were supplied free
of charge during the trial period. At the end of the trial participants could keep either of the
contact lenses used in the trial, under the usual optometric supervision at the contact lens clinic.
Confirmation of suitability was based on satisfactory performance of CRGPcl. The symptoms
and history examination conducted during the standard, routine contact lens check-up
established whether the prospective participant was experiencing any significant difficulties
during their contact lens wear. Examination of contact lens fit and BCVA were performed
subsequently to ensure that the habitual CRGPcl exhibited acceptable physical fit and enabled
adequate visual performance (Appendix IIA). The integrity of the corneal surface and the rest
of the ocular adnexa were checked to confirm that no significant adverse effects were caused
by contact lens wear.
Suitable candidates were given the research participant information document (Appendix IA
and IB) to read and if interested were invited to participate in the research after the completion
of the formal informed consent procedure (Appendix IC).
Informed consent procedure
After reading the participant information document the prospective candidates had an
opportunity to ask questions and discuss these with the chief investigator during their regular
follow up appointment or other appropriate time during the contact lens clinic. The chief
investigator gave the informed consent document (Appendix IB) to the prospective candidates
and discussed all aspects of the RCT, prior to signing the consent form within three months
from the invitation to participate. All prospective participants had sufficient time to ask
questions and to consider and decide whether they wished to participate.

90
After signing the consent form (Appendix IC), all participants were reminded that they were
free to withdraw at any time without any explanation. It was made clear to them in writing and
verbally that should they choose not to participate in the research or withdraw from the research
prior to its completion their standard of care will not be affected.
Communication of urgent and routine matters
The participants were informed in their consent document that should an issue arise, which
would influence their continued participation; it would be conveyed to them by e-mail,
telephone or by a written letter depending on the urgency. Participants’ details were available
to the chief investigator in the participants’ hospital records and the digital practice records
kept on password protected computer. Routine information was conveyed to the participants
during their routine check-ups.
Loss of capacity
Participants were informed during their consent procedure that in the unlikely event of a loss
of capacity, the research team would retain research data collected and continue to use it
confidentially for the purposes for which consent was sought. This could include further
research after the current project has ended as this was made clear in the information for
participants.

91
Access to research results
At the completion of the study a lay summary of the anonymous results would be prepared and
published on the Institute of Optometry website. The participant information highlighted this
and any participants who did not have web access could contact the researchers for a paper
version.
Randomisation
After the completion of the consent process the participants were randomised to group 1
[sequence AB]and group 2 [sequence BA] according to the randomisation order generated by
the online research randomiser http://www.randomizer.org/ (Figure 4.1 Appendix V.E). The
online randomiser created a list of 30 numbers from 1-30 randomly allocated to the 2 groups.
The participants were allocated their treatment arm in the order of their recruitment from
participant 1 to participant 30 (Table 4.10). The protocol for replacing participants who were
unable or unwilling to complete this study was to recruit additional, appropriate participants to
replace the drop outs with treatment allocation by sequential alternation in participants 31-34.
The length of participation in the study for most participants did not exceed 9-12 months during
which they attended on 4-6 occasions. Study total length was from May 2015 to June 2018.
The extra clinic attendance required by this study (compared with the normal 2 check-ups per
year) was necessary because most participants were not familiar with SRGPcl and these lenses
needed to be fitted in the same way as to a new patient, which requires both lens collection and
lens handling instruction appointments as well as an early review to ensure that no adverse
effects occurred with these lenses. These additional check-ups as well as the two appointments
for outcome measures data collection were required in this study. All participants were
informed about these additional requirements during the informed consent procedure.
92
Experimental contact lenses
The experimental contact lens was the SRGPcl, Zenlens™ and the control contact lens was the
CRGPcl Rose K2™. Both lens types were fitted to achieve optimal contact lens fit on the ocular
surface according to recognised clinical criteria (see chapter 3) and manufacturers fitting
instructions. The CRGPcl Rose K2 lenses were fitted with the aim to achieve the most widely
recognised best fit of a divided support / three-point touch fitting relationship between the lens
and the cornea (Loft and Wolffsohn, 2016; Szczotka-Flyn et al., 2006; Woodward, 1989; Watts
and Colby, 2017).
The desired lens cornea fitting relationship was achieved with the Rose K2 lenses by utilising
a comprehensive fitting set, consisting of 26 lenses, with optical lens radius range 5.10 to
7.60mm (full range 4.30-8.59mm), in a variable lens diameter from 8.50 to 9.20mm (full range
7.90-10.40mm), with variable power to approximate the final lens power (range -2.00 to -
23.00DS). Lens adjustments were implemented following the recommended fitting guidelines
(Art Optical, 2013). Central fitting of cone clearance or feather cone touch was achieved by
selecting the appropriate central optic zone radius from the fitting set until the desired central
fit was achieved. Modification of the central lens radius and or diameter was possible if
required, when the fitting set lens central parameters did not achieve an acceptable fit.
Peripheral lens fitting was optimised by utilising the flexible edge lift system, with 5 levels of
symmetrical edge lift variation.
When necessary central and / or peripheral toric lens designs or quadrant specific asymmetrical
corneal technology were employed in moderate to high corneal asymmetry (Art Optical, 2013).
The CRGPcl mean OZR was 7.05mm, Mean lens diameter was 9.11mm, mean lens power was
-5.79DS, cylinder -1.92DC and axis 145°. Standard lens design was used in 32 lenses (57%).
The 24 (43%) of non-standard lenses used were 6 (11%) toric (central and /or peripheral), 1
(2%) was quadrant specific, the remaining 17 (30%) had adjusted, symmetrical, non-standard
peripheral lens curves. The CRGPcl were manufactured and supplied by the CE approved
British contact lens manufacturer Menicon David Thomas.
The SRGPcl were initially manufactured by the CE approved Dutch contact lens manufacturer
UCO-Lavec-BV and later by the Bausch and Lomb speciality contact lens manufacturing
division in Hastings UK. The desired fitting relationship between the eye and the SRGPcl was

93
achieved by following the published manufacturer fitting guidelines (Alden Optical, 2016) and
recognised standards of clinical experts (van der Worp, 2015). The lenses were fitted from 2
comprehensive fitting sets (26 lenses in each set), one with symmetrical peripheral (haptic)
design the other with a toric haptic design. The fitting sets contained lenses in 2 diameters,
16mm [n=54 (96%)] and 17mm [n=2 (4%)] and in two designs, prolate (flattening ellipse)
(n=56) and oblate (steepening ellipse, nil used in this research), with central SAG (lens height)
increments of 300µm, range 4100-5800µm, with a total, customisable SAG range of 3200 -
6700µm in 10µm micron steps. The customisable SAG range facilitated the achievement of
the required 200-300µm corneal clearance after lens settling. This was achieved by allowing
the best fitting trial lens to settle for a minimum of 60min and then comparing the tear layer
thickness, between the cornea and the lens, to the standard lens thickness across the fitting set
of 350µm (van der Worp, 2015).
The control of limbal clearance could be achieved separately from central corneal clearance by
modifying the lens SAG at the limbal area, without affecting the central clearance by the
utilisation of the smart curve, a design feature unique to the Zenlens, which enables the fitter
to achieve the desired central lens clearance from the cornea, with minimum effect from other
lens modifications (Alden Optical, 2016). The mean OZR of the 56 lenses fitted was 7.48mm,
mean SAG = 4627.7µm, mean lens power = -3.25DS and -1.61 cylinder with a mean axis of
120°.
The modification of the Alignment Peripheral Curve System facilitated appropriate scleral
alignment via symmetrical 360° modification or the utilisation of toric haptic curves. The toric
Alignment Peripheral Curve System fitting set facilitated the fitting of SRGPcl with toric haptic
or bi-toric lenses (toric haptic with front toric optics). Standard APS was used in 16 (29%)
lenses, in the non-standard APS in the 40 (71%) lenses, 36 (64%) were with a toric haptic
portion, 10 (18%) were bi-toric (toric haptic and toric front optics). Other custom features such
as front surface toric optics [n=1 (2%) with a standard APS] and pinguecula / pterygium
channels called MicroVaults [n=6 (11%)] were employed when required to optimise visual
acuity and lens sclera fitting relationship respectively.
Appropriate clinical guidelines and best practice were followed for the fitting and use of both
types of contact lenses (Appendix ID and IE). The chief investigator who is a hospital eye
service contact lens practitioner with over 20 years’ experience, personally fitted all the

94
experimental lenses. During the research, contact lens supply and after-care was carried out to
the usual standard adopted at CMH.
Once the fitting had been completed the lenses were checked by the chief investigator at
collection and rechecked one to three weeks after collection. All participants were
appropriately instructed regarding contact lens wear, care and safety and written information
was provided to them (Appendix ID and IE). The final check was performed 8-12 weeks post
initial lens collection. During the final check appointment, the visual performance was
measured and recorded by the research coordinator Mr Anthony Stanton or Mr Daniel Gorjian
in the hospital clinic and by Mr Daniel Gorjian in community practice, during this time both
were naive to the type of lenses worn by the participants (Appendix IIB). The visual quality of
life questionnaire completed by the participants during that appointment or a few days prior
was collected by the chief investigator.
After this check-up the other lens type was fitted by the chief investigator and ordered from the
manufacturer. The collection appointment was scheduled to a date in accordance with the
mandatory washout period at least one month later. During the washout period, participants
wore their original CRGPcl until the scheduled appointment to collect the crossover
intervention to start the second period. During the crossover phase, check-ups were performed
in an identical manner to the first phase. At the end of the crossover phase the participants were
informed that their participation in this research was completed and they asked to choose one
of the two experimental lenses as their lens of choice for continued habitual wear.
Research outcome-measures
The primary outcome measures of the RCT is ETDRS logMAR, monocular VA measurement
(see below). The secondary outcome measures were the CSF visual performance measured by
the CSV 1000E console (VectorVision, 2013), the validated NEI-VFQ (Mangione, 2000;
Mangione et al., 2001) and the SPV and SPC developed by the chief investigator, the Levit
subjective vision score (LSVS) and the Levit subjective comfort scores (LSCS).
95
The ETDRS logMAR VA is the most commonly used measure of high contrast visual
resolution in research and clinical practice (British Standards Institution., BS 4274-1:2003;
Arditi and Cagenello, 1993; Ferris et al., 1982). The ETDRS logMAR and the CSF scores were
measured by repeated, forced choice, letter by letter scoring for logMAR (Vanden Bosch and
Wall, 1997), and each of the eight pairs of gratings in each of the 4 CPD rows for CSF.
These outcome measures were assessed at the beginning of the study with the participants’
habitual CRGPcl for baseline and familiarisation purposes and at the end of the two
interventions. Both BCVA and CSF were measured using the commercially available
instruments: the CSV 1000E manufactured by Vector Vision (VectorVision, 2013) for the CSF
and the chart manufactured by Precision Vision http://www.precision-vision.com/ for the
logMAR BCVA at the CMH. The 1000E console was used for both CSV and logMAR BCVA
in the three participants recruited in the community practice. Both instruments are used
extensively in research and clinical trials worldwide, and are approved and recommended by
both the FDA and NEI (VectorVision, 2013). Chart illumination in this research was a
standardized uniform retro illumination of 85 cd/m², which is the ideal standard for research
(Ricci et al., 1998), generally in clinical practice there is insignificant change in performances
above 80 cd/m2 (Sheedy et al., 1984).
The other secondary outcome measure was the NEI-VFQ validated by Mangione (2000). This
is a vision related Qol instrument designed to assess subjective perception of visual function
and quality of life. This instrument, which has been used by other researchers investigating
keratoconus (Kymes et al., 2008c; Kymes et al., 2004; Tatematsu-Ogawa et al., 2008) was
applied to give baseline values at the beginning of the study and repeated the completion of the
period of use of each intervention.
Further secondary outcome measures were the SPV and SPC assessed with LSVS and LSCS
respectively, which are Likert-like scales from 1-10 (worse- best) grading of the participants’
perception of their own vision and comfort in each experimental lens.
The final outcome measure of this research was the participants’ choice of one of the two
experimental lenses for future habitual wear. This choice was correlated to other outcome
measures to establish if there are possible clinical reasons for that choice.
The tertiary outcome measure, which was not expected to differ with the two lens types but
was measured as a precaution, was the ocular integrity post contact lens wear. The integrity of

96
the cornea and the conjunctiva was examined on lens removal and was accurately recorded
utilising the validated scales of contact lens induced corneal fluorescein staining scales (Efron,
1996; Efron, 1998; Efron et al., 2001). For the conjunctiva the validated scale of conjunctival
hyperaemia was used (Efron, 1997a). These measurements of contact lens wear induced
complications are a mandatory part of standard clinical practice and as such their accurate
assessment and recording in this research enabled an objective comparison of the effects of the
two lens types on the ocular status of the participants.
Data
Visual outcome measures
It was considered that in this clinical trial the measurement of both BCVA and CS, whilst
wearing contact lenses may provide a more complete understanding of the effects of treatment
on the quality of vision than either measure alone (Rubin, 2013). ETDRS logMAR BCVA and
CSF numeric and logCS values were measured at baseline and at the completion of each period.
Detailed discussion of these outcome measures is presented in the chapter 1.
Visual acuity (VA)
VA is the most widely used measure of visual function both in optometric clinical practice and
in vision research and is routinely used for evaluating the effectiveness of refractive, medical
and surgical treatments (British Standards Institution., BS 4274-1:2003). The preferable
forced-choice testing, with letter counting scoring procedure were used in this research (Ricci
et al., 1998). A difference of 1 line (5 letters or 0.10 logMAR) was considered significant, with
95% confidence that a real change has occurred (Bailey et al., 1991).
97
Contrast sensitivity
The CSV-1000E provides a full contrast sensitivity curve, which is very useful for the
evaluation of ocular disease, particularly cataracts (Shandiz et al., 2011), glaucoma (Gandolfi
et al., 2005), optic neuritis in multiple sclerosis (Sisto et al., 2005), diabetes (Sadeghpour et
al., 2015), macular degeneration (Richer et al., 2004), visual performance in contact lenses
(Porisch, 2007; Wachler et al., 1999) and after refractive surgery (Tuan and Liang, 2006). Two
different charts versions were used in this research to provide apparently randomised locations
for the grating targets (Ginsburg, 1984; VectorVision, 2013). The forced choice testing
procedure was implemented for CSF testing as well.
The NEI-VFQ
The validated NEI-VFQ (Mangione, 2000; Mangione et al., 2001) was used in this research as
a subjective measure of the participant’s perceptions of their visual wellbeing during the
periods of use of both the experimental and control contact lenses. The first time this
questionnaire was completed by the participants as a baseline was in the beginning of the study,
describing the visual Qol in their habitual CRGPcl. The following two times this questionnaire
was completed were at the end of each treatment period.
NEI-VFQ was developed as a survey which measures various aspects of self-reported vision-
targeted health status in individuals with chronic eye diseases. The survey measures the
influence of visual symptoms and disability on health issues such as emotional well-being and
social functioning, as well as task-oriented visual functions. The survey contents were based
on issues which were identified during a series of condition-specific focus groups, using
patients who had variety of ocular pathologies (Mangione et al., 1998). The NEI-VFQ
represents a shortened version of the 51-item version, it consists of 25 questions representing
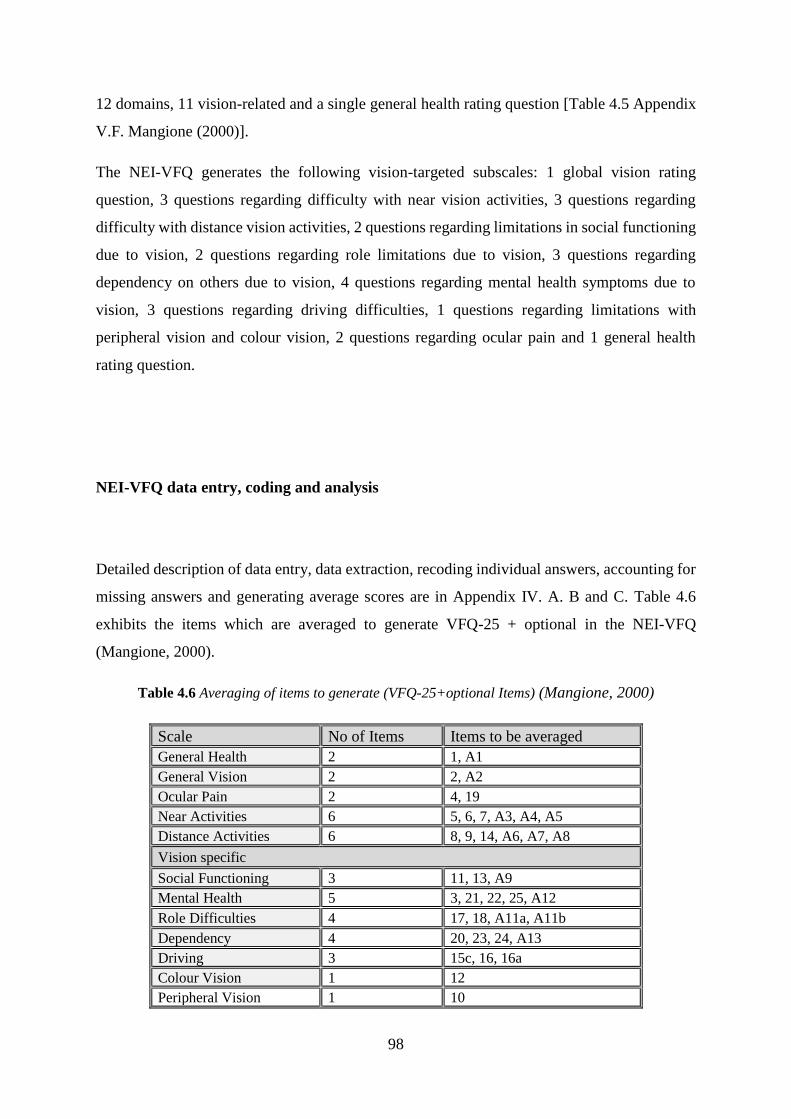
98
12 domains, 11 vision-related and a single general health rating question [Table 4.5 Appendix
V.F. Mangione (2000)].
The NEI-VFQ generates the following vision-targeted subscales: 1 global vision rating
question, 3 questions regarding difficulty with near vision activities, 3 questions regarding
difficulty with distance vision activities, 2 questions regarding limitations in social functioning
due to vision, 2 questions regarding role limitations due to vision, 3 questions regarding
dependency on others due to vision, 4 questions regarding mental health symptoms due to
vision, 3 questions regarding driving difficulties, 1 questions regarding limitations with
peripheral vision and colour vision, 2 questions regarding ocular pain and 1 general health
rating question.
NEI-VFQ data entry, coding and analysis
Detailed description of data entry, data extraction, recoding individual answers, accounting for
missing answers and generating average scores are in Appendix IV. A. B and C. Table 4.6
exhibits the items which are averaged to generate VFQ-25 + optional in the NEI-VFQ
(Mangione, 2000).
Table 4.6 Averaging of items to generate (VFQ-25+optional Items) (Mangione, 2000)
Scale No of Items Items to be averaged
General Health 2 1, A1
General Vision 2 2, A2
Ocular Pain 2 4, 19
Near Activities 6 5, 6, 7, A3, A4, A5
Distance Activities 6 8, 9, 14, A6, A7, A8
Vision specific
Social Functioning 3 11, 13, A9
Mental Health 5 3, 21, 22, 25, A12
Role Difficulties 4 17, 18, A11a, A11b
Dependency 4 20, 23, 24, A13
Driving 3 15c, 16, 16a
Colour Vision 1 12
Peripheral Vision 1 10
99
Subjective perception of comfort (SPC) and subjective perception of vision (SPV)
The assessment of the SPC and SPV in contact lenses is an integral part of symptoms and
history examination in optometric practice. Typically, these variables are assessed in an
informal, binary way: “Are your contact lenses comfortable?” and “Is your vision with the
contact lenses clear?”. For this research, a numerical rating scale was used as described below.
Numerical rating scales and visual analogue scales are considered equally useful tools in the
assessment of subjective quality of vision in contact lenses (Gullon and Schock, 1991; Papas
and Schultz, 1997) and comfort during contact lens wear (La Hood, 1988). Grading scales are
commonly used in clinical research, particularly in relation to the grading of pain. Williamson
and Hoggart (2005) reviewed the literature regarding the visual analogue, verbal, and
numerical pain rating scales and concluded that, “all three pain-rating scales were valid,
reliable and appropriate for use in clinical practice”, further, they reported that “the
Numerical Rating Scale has good sensitivity and generates data that can be statistically
analysed for audit purposes” (Williamson and Hoggart, 2005).
In this research the subjective measures of comfort and vision with the two experimental
lenses were elicited after each period of lens wear and graded on a specially designed Likert-
like scales from 1-10, with 1 constituting the worst and 10 the best vision and comfort scores
(Appendix IIA and IIB). These grading scales were designed by the chief investigator and
are routinely used by the chief investigator in his contact lens practice and have been found to
be useful for decision making in contact lens management. These instruments however, were
never validated. It was nevertheless considered appropriate to use these instruments alongside
the other validated outcomes and apply statistical analyses to establish their significance in
this research.

100
Final lens choice
The final outcome was the participants’ lens choice to use as their habitual lens. The plan was
to find out whether a correlation could be established between the final lens choice and any
statistically significant differences between the primary and secondary outcomes in the two
experimental lenses.
Recommendation for validation of significant findings and their implementation in specialist
and general optometric practice to aid in the decision-making processes would be made
regarding the appropriateness of CRGPcl and SRGPcl and the likelihood of success when
refitting from one type to another.
Ocular integrity
The integrity of the cornea and the conjunctiva were examined on lens removal at each stage
of the research, at baseline, after wear of the randomised lens and after wear of the crossover
lens, as required in standard clinical practice. Although not an outcome measure in this
research, it was decided that should any unusual or adverse effects have occurred, these would
be reported.
Wolffsohn et al., (2015) performed an international survey of eye care practitioners regarding
their anterior eye health recording practices to formulate guidelines for best practice. They
recommended specifying the grading scales used and record scores to 1 decimal place. They
advised that the following conditions are graded in every contact lens examination; bulbar and
limbal conjunctiva hyperaemia, limbal neovascularisation, conjunctival papillary redness and
roughness, both in white light and with sodium fluorescein (NaFl). They recommended
recording the grades of blepharitis, meibomian gland dysfunction and NaFl staining of both the
cornea and conjunctiva (Wolffsohn et al., 2015). These recommendations were followed in this
research, using the validated grading scale for contact lens complications developed and

101
validated by Efron et al., (1996), (1997), (1998) and (2001) (Efron et al., 2001; Efron, 1998;
Efron, 1997b; Efron, 1996).
There are 16 sets of grading images; these represent the key anterior ocular complications of
contact lens wear. The conditions are illustrated in five stages of increasing severity from 0-4,
with ‘traffic light’ colour coding from green (normal) to red (severe) (Table 4.7. Appendix
IV.D).
Sample size calculation
For the purpose of sample size calculation in this research the primary outcome measure of
ETDRS logMAR BCVA was selected. The calculation was carried out considering the worst-
case scenario. This is that a differential carryover effect and / or significant period effect were
found, in which case the data would have to be analysed as a parallel group trial instead of a
crossover trial. Therefore, the sample size calculation was based on the most conservative
approach, calculating the number of participants required if it were just a parallel group trial
without crossover. For the calculation, data from previous work by Marsack et al., (2007),
Nejabat et al., (2012), Davis et al., (2006), Sabesan et al., (2013), Gumus et al., (2011) were
used to provide the information of BCVA in CRGPcl and SRGPcl (Table 4.8, Figure 4.4).
Table 4.8 Research used to establish mean and standard deviation for sample size
calculation (Marsack et al., 2007; Nejabat et al., 2012; Davis et al., 2006; Sabesan et al.,
2013; Gumus et al., 2011)
Authors CRGPcl logMAR mean (StdDev) SRGPcl logMAR mean (StdDev)
Gumus et al., (2011) 0.09 (±0.10)
Marsack et al., (2007) 0.15 (±0.11)
Nejabat et al., (2012) 0.04 (±0.04)
Sabesan et al., (2013) 0.40 (±0.18)
Davis et al., (2006) 0.12 (±0.16)
Total mean and StdDev 0.10 (±0.10) 0.25 (±0.14)

102
The required number of subjects (n) can be calculated from the following formula: (Armitage
and Berry, 1987); N > 2 {(Z2α + Z2β) Ϭ /δ0}2
The value Z2α represents the level of result that will be taken as being statistically significant.
This will be a two-tailed (p=0.05), giving Z2α=1.96. Z2β represents the desired statistical power,
set at 0.80, giving Z2β=0.842. δ0 represents the clinically significant difference and Ϭ is the
standard deviation of the population.
The key variable in the sample size calculation is high contrast logMAR BCVA, the most
widely used and quantitatively rigorous measure of visual performance. The figures were taken
from the aforementioned studies in which BCVA with CRGPcl was measured. The studies
with CRGPcl only were used for the sample size calculation as these were performed on large
numbers of participants with keratoconus who wear CRGPcl as required by the eligibility
criteria in the current RCT. Furthermore, the SRGPcl study: Sabesan et al., (2013) was a pilot
study with only 11 eyes of 6 participants, and the larger SRGPcl study by Gumus et al., (2011),
exhibited similar logMAR BCVA scores to those found in the CRGPcl studies. A single line
change (0.10 logMAR) was taken as representing a clinically significant change in logMAR
BCVA (Bailey et al., 1991; Brown and Yap, 1995).
Davis et al., (2006) showed a mean logMAR visual acuity with CRGPcl in participants with
keratoconus of 0.12 (±0.16), Marscack et al., (2007); 0.15 (±0.11), Nejabat et al., (2012); 0.036
(±0.04). From these studies the average standard deviation obtained was 0.10. The variance of
both values was calculated and averaged and the square root of the mean variance calculated
to give the common standard deviation. This was used in the above formula with an alpha of
0.05 and for power of 80% to give a required sample size of 15 in each group (Table 4.9). This
was checked with an online calculator www.stat.ubc.ca/~rollin/stats/ssize/n2.html, which also
gave a sample size of 15 in each group. The plan was therefore to continue the study until at
least 30 participants have completed the study, 15 starting with CRGPcl and 15 with SRGPcl.
Recruitment continued until 30 participants had finished both periods.
Table 4.9 Sample size calculation
For power of 80% Mean SD Variance Mean variance Common SD N
CRGPcl 0.10 0.10 0.01 0.01 0.10 15.70
SRGPcl 0.20 0.10 0.01

103
The fact that the ratio of participants in the 2 experimental groups changed from the planned
15 in each group to 13 in group 1 and 17 in group 2, should have a minimal effect on the
significance and power of the study, see discussion in strengths and limitations.
Minimising measurement bias
Blinding is more difficult to achieve in non-pharmacologic trials (Boutron et al., 2004), and
participants knew what type of contact lens they inserted every morning. To minimise possible
investigator-bias the outcome measures of VA and CS were performed by the research
coordinator and the chief investigator’s clinical optometrist assistant Mr Daniel Gorjian, both
naive to the type of contact lenses worn by the participant at the time of measurement. This
was achieved by the chief investigator performing the initial examination of symptoms and
history, grading of comfort and vision, visual acuity, over-refraction and contact lens condition
and fit evaluation. The visual acuity and contrast sensitivity were measured and recorded by a
naïve examiner in a different room. After the completion of these procedures the chief
investigator copied the recorded results into the computer-based research database program.
Statistical analysis
The chief investigator ensured that all relevant data were collected and recorded, data from
participants who did not participate in both arms of this research were not included in the
statistical analysis.
The IBM-SPSS version 21 was used for all statistical calculations, Microsoft Excel 2010 was
used for data storage as well as the generation of some graphs and tables, the data was recorded

104
in a specially designed database in LibreOffice version 5.0.4, prior to being transferred to the
Excel files (see below and Appendix IVA, B and C).
The chief investigator carried out all statistical analyses under the guidance and supervision of
the research supervisors Prof. Bruce Evans and Dr Martin Benwell. A preliminary statistical
analysis was carried out after 12 participants had fully completed their participation; this was
done to assess the significance of the carryover effect in this research. The complete statistical
analysis was carried out after the data were collected for all participants who completed the
research.
Pooling of data
Following the recommendation of Armstrong (2013) and personal communications with
Armstrong, experimental data were collected from both eyes in most (Armstrong, 2013).
Keratoconus is a bilateral disease (Gomes et al., 2015), with significant asymmetry between
the two eyes (Zadnik et al., 2002), it was therefore hypothesised that it may be appropriate to
use the visual scores of each eye as an independent sample to increase sample size and
maximally utilise the available data.
The counter argument for pooling the data are that measurements obtained from right and left
eyes are usually correlated (Katz et al., 1994), and therefore may not be treated as if they are
independent samples, an assumption made in statistical procedures, such as t-tests, analysis of
variance, confidence intervals and linear regression. When testing hypotheses, the use of
inappropriately pooled data from both eyes increases the possibility of a type 1 error because
the variance between the eyes of the same subject is usually less than that between subjects,
the overall variance of a sample of measurements combined from both eyes is therefore likely
to be an underestimate of the true variance. Hence, data collected from both eyes from a sample
of subjects cannot be combined without taking the correlation into account (Armstrong, 2013).
In order to avoid this problem, data from one eye only may be analysed, which would lead to
rejection of the valid data from the fellow eye, reduction of the potential power of the study,
and may raise ethical questions of subjecting patients to measurements that were not used in a
subsequent analysis (Armstrong, 2013).

105
The decision was taken in this experiment to perform a correlation analysis of the baseline
logMAR scores of the right and left eyes of each participant, and a separate analysis of
correlation between the scores of the right eye and randomised scores of the left eye. The
significantly higher correlation found between the right and left scores taken from the same
subject compared with the random correlation, indicated that treating the right and left eyes as
independent samples and pooling the data from both eyes would be inappropriate. The
statistical analyses for the carryover, period and treatment effects were therefore performed on
the mean of the right and left eye’s scores of each participant.
Inferential Statistics
In normally distributed data the skewness and kurtosis z values, which are the ratio of skewness
and kurtosis values and their respective standard error value, should be between -1.96 to +1.96
and the visual analysis of the data histogram, quantile-quantile plots and box plots should
indicate that the data are approximately normally distributed (Cramer, 1998; Doane and
Seward, 2011). Analysis for normality was performed on all data and appropriate statistical
tests for parametric and non-parametric data were employed in the descriptive and inferential
statistics, results sections
Crossover trials have sometimes been analysed using repeated-measures statistical tests,
although this approach has been criticised by Wellek and Blettner (2012). A similar point is
made in the respected text book on the analysis of crossover trials by Jones and Kenward
(2015). Therefore, the inferential statistical analyses of the outcome measures were performed
as recommended by the above authors.
Preliminary checks were carried out to ensure that there was no carryover effect from the first
to the second treatment periods, as recommended in the literature (Jones and Kenward, 2015;
Wellek and Blettner, 2012; Haynes et al., 2006). It was considered unlikely that a significant
differential carryover effect would be found because contact lenses do not cure but only
manage the optical distortions caused by corneal ectasiae. Furthermore, measurements of visual
performance are not affected by previous visual experiences in adult visual systems (Bailey,
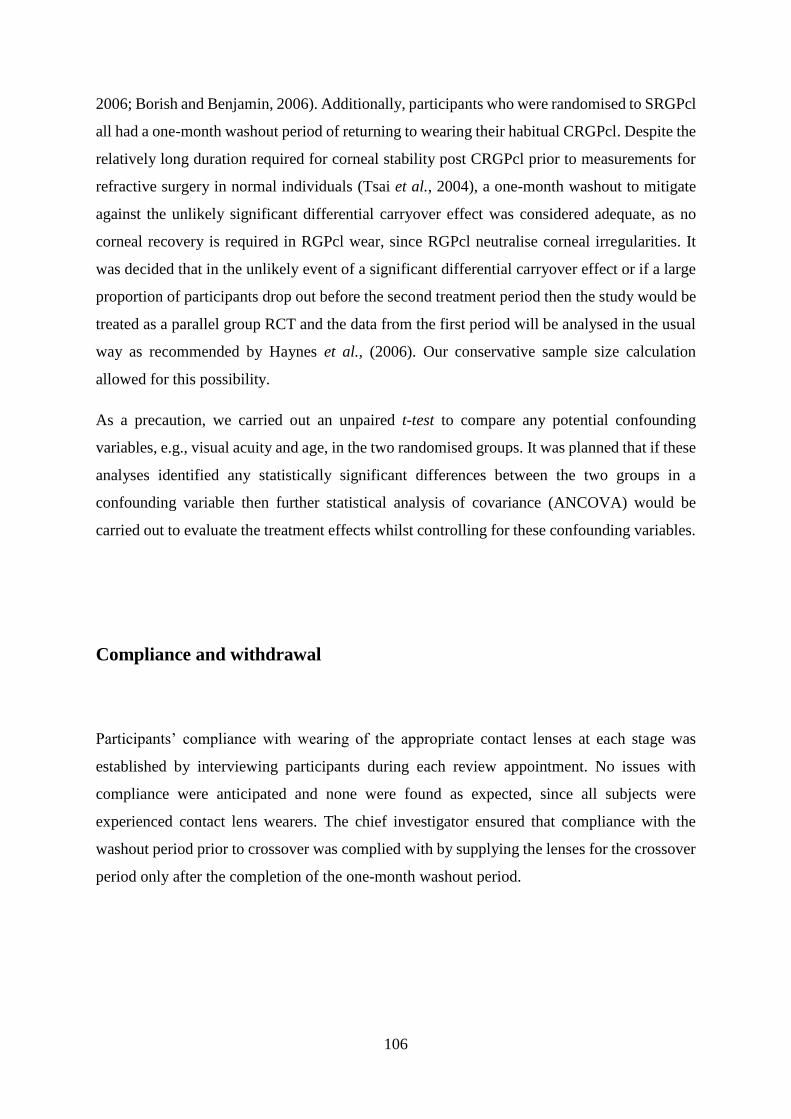
106
2006; Borish and Benjamin, 2006). Additionally, participants who were randomised to SRGPcl
all had a one-month washout period of returning to wearing their habitual CRGPcl. Despite the
relatively long duration required for corneal stability post CRGPcl prior to measurements for
refractive surgery in normal individuals (Tsai et al., 2004), a one-month washout to mitigate
against the unlikely significant differential carryover effect was considered adequate, as no
corneal recovery is required in RGPcl wear, since RGPcl neutralise corneal irregularities. It
was decided that in the unlikely event of a significant differential carryover effect or if a large
proportion of participants drop out before the second treatment period then the study would be
treated as a parallel group RCT and the data from the first period will be analysed in the usual
way as recommended by Haynes et al., (2006). Our conservative sample size calculation
allowed for this possibility.
As a precaution, we carried out an unpaired t-test to compare any potential confounding
variables, e.g., visual acuity and age, in the two randomised groups. It was planned that if these
analyses identified any statistically significant differences between the two groups in a
confounding variable then further statistical analysis of covariance (ANCOVA) would be
carried out to evaluate the treatment effects whilst controlling for these confounding variables.
Compliance and withdrawal
Participants’ compliance with wearing of the appropriate contact lenses at each stage was
established by interviewing participants during each review appointment. No issues with
compliance were anticipated and none were found as expected, since all subjects were
experienced contact lens wearers. The chief investigator ensured that compliance with the
washout period prior to crossover was complied with by supplying the lenses for the crossover
period only after the completion of the one-month washout period.

107
Data handling and record keeping
Data were collected manually on pre-prepared research clinical records files (CRF) (Appendix
IIIA, IIIB, IIIc). These were kept in the CMH in a locked cabinet, with no access except for the
chief investigator. The results were later entered into a password protected digital database
computer program (see below) which was stored on a password protected computer.
The relevant clinical information contained in these research records was added to the
participants’ hospital records during the various consultations.
The anonymised data were used for the writing of the doctoral thesis and may be used in
professional publications. The only details used in publications may include the participants'
gender, age and allocated research serial number, but no personal data. The ethics committee
had approved that the anonymised data may be kept for five years after the completion of the
research and may be used for further analysis and publications.
The chief investigator is responsible for data collection, recording and data analysis. All
research data were collected by the chief investigator the research coordinator and clinical
assistant during the scheduled consultations at the hospital eye department’s contact lens clinic
and community practice. The chief investigator ensured that all data recorded was legible and
stored in the correct CRF.
The chief investigator personally double-checked all entries and ensured that correct entries
were made into the appropriate sections of the database program.
The database software for research data recording
A customised database was created using the Base component of LibreOffice version 5.0.4
configured by a software specialist commissioned by the chief investigator for data collection
in this research (Appendix IVA, B and C).
108
When a query is run the output is in the form of a table of data. This is copied and pasted into
Excel, for example, and it can then be saved to disk and/or used for basic analysis in Excel.
Although Excel is not the right tool for complex data analysis, some basic data manipulation
is possible.
An Excel spreadsheet was used for processing NEI-VFQ data. An Excel template spreadsheet
has been created, and raw data from a database query is pasted into this template. Cell
calculations then flow from these data and the last worksheet of the spreadsheet shows the
average scores for each participant, with the raw answers recoded according to Version 2000
of the NEI-VFQ.
Monitoring, quality control and assurance
This research adhered to the tenets of the Declaration of Helsinki and was approved by the
NRES Committee London-Camden & Kings Cross NHS Health Research Authority, via the
Integrated Research Application System (IRAS) (Appendix IIIB) as well as LSBU REC and
Institute of Optometry REC. This research was also reviewed and approved by the North
London Hospitals research and development department and has been registered and updated
throughout with clinicaltrials.gov. The chief investigator and the research coordinator have
received Good Clinical Practice accreditation by examination prior to starting this clinical trial
(Appendix IIIA). This accreditation course and examination cover all ethical aspects of clinical
research so that researchers possess the knowledge to comply with the requirements for
conducting research ethically.

109
Adverse Events
Although it was considered that adverse events would be unlikely to occur, the potential
adverse events which infrequently can occur in individuals with keratoconus when fitted with
contact lenses were carefully looked for during the review appointments. These adverse events
can be summarised as related to contact lens wear or related to the conditions treated / managed
which in this research is mostly keratoconus.
It was considered unnecessary to report the non-serious, commonly encountered contact lens
related complications, which include allergic / toxic reactions to contact lens materials and care
products and normal resident bacteria as well as minor physical corneal insult during contact
lens handling and wear.
Infrequently condition related complications may be the more serious and may result in disease
progression or rarely in corneal infection. Corneal abrasion is another possible event which is
usually minor but could be extensive and potentiality serious and may lead to complications
such as corneal infection and / or scarring. In the unlikely event of the occurrence of a serious
adverse event like corneal infection, which requires hospitalisation, immediate clinical action
would take place and the event was to be reported to the sponsor within 7 days. This was to be
followed to resolution and reported in the annual safety report of the sponsor as well as in
publications describing the research. In the unlikely event of serious unexpected suspected
adverse reactions reports to the NHS ethics committee, NHS trust and MHRA were to be
generated within 15 days. These were to be followed until total resolution and reported in the
annual safety report as well as in publications describing the research.
To minimise the risk of adverse events best practice protocols of lens fitting, participant
education and instructions in aspects of hygiene, contact lens handling and care as well as
appropriate follow up schedules were followed. The participants were carefully instructed
regarding the signs and symptoms of these adverse events as well as the actions to take in the
event of these occurring. Protocols from Moorfields eye hospital and association of optometrist
were used (Appendix ID and IE).
Serious adverse events like corneal infection and the non-serious events were to be treated at
the ophthalmology department, CMH and if occurred, were to be reported by the chief

110
investigator in the participants’ clinical record as well as the research records. The consultant
ophthalmic surgeon, Mr Simon Levy was the onsite research supervisor and was consulted
regarding all aspects of safety issues in this research prior to and during the research process.
The natural progression of keratoconus and related conditions were monitored during this
research more vigilantly than during the normal contact lens practice as during this research
the participants were reviewed more frequently than during their standard care.
Safety monitoring committee
The persons responsible for the trial safety monitoring, were the chief investigator, the
optometrist Anthony Stanton, the onsite supervisor; consultant ophthalmic surgeon Mr Simon
Levy and the academic supervisors.
Communication of urgent matters
The protocol was that should any urgent issues arise, which might influence participants’
continued participation, it would be conveyed to all participants by e-mail, telephone or by a
written letter with appropriate urgency. The participants’ contact details are kept on the
password protected computers at the hospital clinic. Routine information was to be conveyed
to the participants during their routine check-ups.

111
Summary
This chapter outlined the research design and its rationale in the context of the current
research. Important aspects of participants recruitment, informed consent and the ethical
accreditation of this research were discussed. The experimental lenses used and the outcome
measures to evaluate their performance were outlined and discussed. The sample size
calculation and the important statistical considerations pertinent to this research were
outlined. Important aspects relating to confidentiality, data handling, record keeping and
participants’ safety were outlined and discussed.

112
Chapter 5: Results
Overall 124 patients were approached for consideration of participating in this research. Forty-
seven patients did not meet the inclusion criteria, the majority of whom (n=36), did not satisfy
the criterion of adequate satisfaction with or performance of CRGPcl: and 43 declined to
participate. Thirty-four patients completed the consent procedure, underwent baseline
measurements, and randomised to the first arm of the study. Four participants were lost to after-
care and were not included in the data analysis. Overall 56 eyes of 30 participants were
analysed, 4 participants who required management to one eye only were included in this
research because it was considered an appropriate representation of the keratoconus population
presenting for contact lens management (Gomes et al., 2015; Zadnik et al., 2002).
During the randomisation 17 participants were randomised to each study arm / group. Group
1, sequence AB, started with CRGPcl and crossed over to SRGPcl and group 2, sequence
BA, started with SRGPcl and crossed over to CRGPcl. In group 2 all 17 participants crossed
over to CRGPcl, completed their participation and were analysed for primary outcome
measures. In group 1, 13 out of the 17 recruited participants crossed over to SRGPcl,
completed their participation and were analysed for primary outcome measures (Figure 5.1).
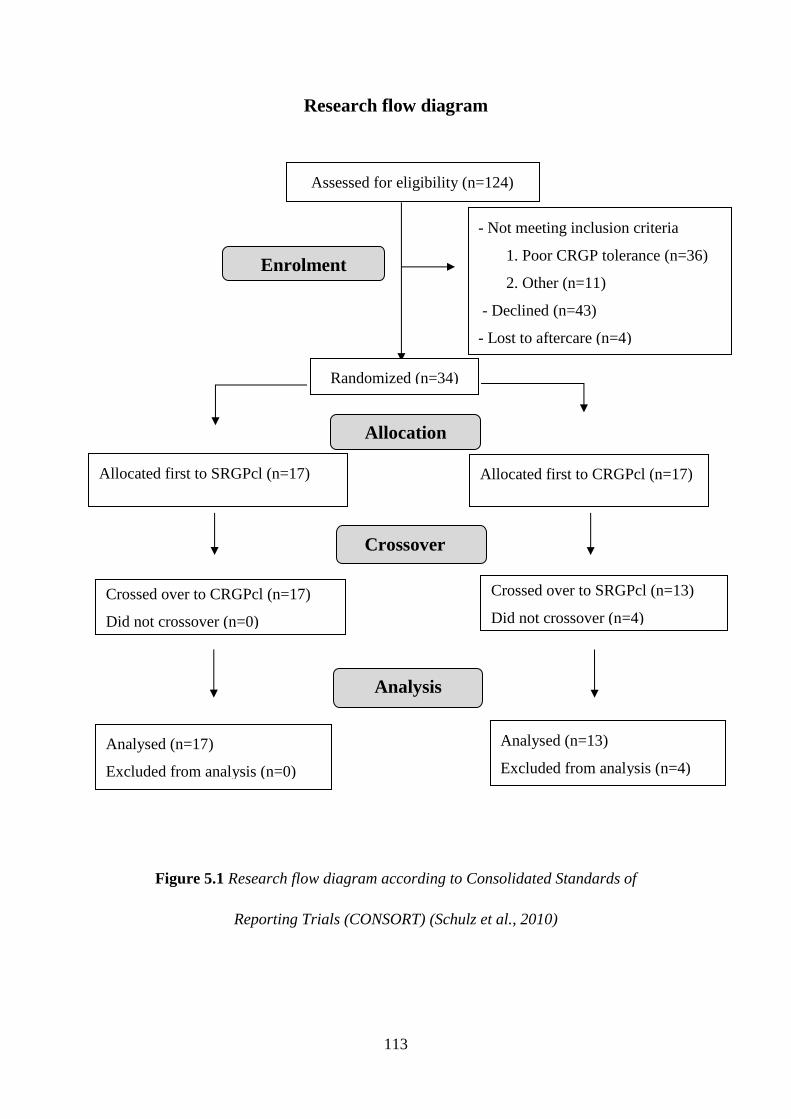
113
Research flow diagram
Figure 5.1 Research flow diagram according to Consolidated Standards of
Reporting Trials (CONSORT) (Schulz et al., 2010)
Assessed for eligibility (n=124)
- Not meeting inclusion criteria
1. Poor CRGP tolerance (n=36)
2. Other (n=11)
- Declined (n=43)
- Lost to aftercare (n=4)
Declined to participate (n= 41)
Other reasons (n=50)
Analysed (n=17)
Excluded from analysis (n=0)
Allocated first to SRGPcl (n=17) Allocated first to CRGPcl (n=17)
Analysed (n=13)
Excluded from analysis (n=4)
Allocation
Analysis
Randomized (n=34)
Enrolment
Crossover
Crossed over to CRGPcl (n=17)
Did not crossover (n=0)
Crossed over to SRGPcl (n=13)
Did not crossover (n=4)

114
Baseline Demographics
Gender
Out of the total population of 30 participants entering the study, 77% (n=23) were males and
23% (n=7) were females. The male participants outnumbered the female participants by 3:1.
Age
The population age was not normally distributed; Shapiro-Wilk (p=0.039), with a range of 46
years (22-68). The median age was 36.0, (IQR=16.0) years, skewness of 0.8 (SE 0.434, z=1.91)
and kurtosis of -0.01 (SE 0.845, z=-0.02) (Table 5.1 and Figure 5.2).
Table 5.1 Population age demographics.
Age Shapiro-Wilk (p=0.039) Statistic Std. Error
Median 36.0
Interquartile Range 16.0
Mean 39.1 2.1
95% CI for Mean 34.8 - 43.3
Std. Deviation 11.5
Minimum 22.0
Maximum 68.0
Range 46.0
Skewness 0.8 0.4 (z = 1.91)
Kurtosis 0.0 0.8 (z = -0.02)
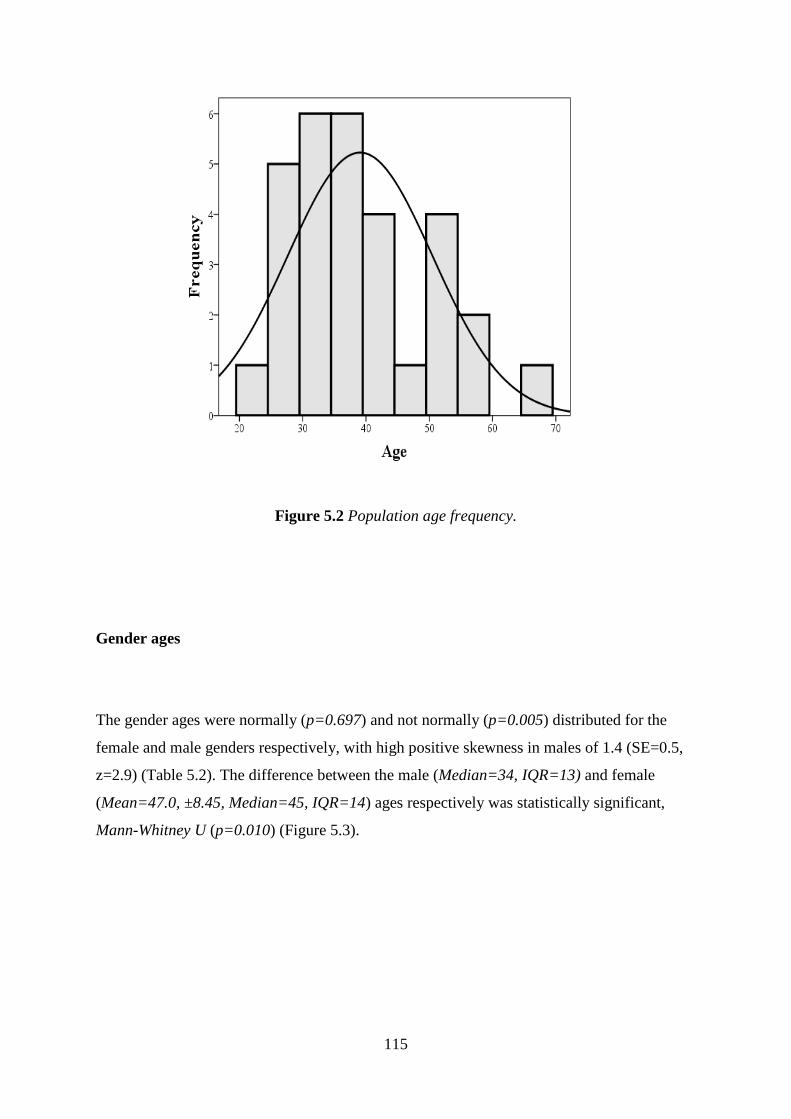
115
Figure 5.2 Population age frequency.
Gender ages
The gender ages were normally (p=0.697) and not normally (p=0.005) distributed for the
female and male genders respectively, with high positive skewness in males of 1.4 (SE=0.5,
z=2.9) (Table 5.2). The difference between the male (Median=34, IQR=13) and female
(Mean=47.0, ±8.45, Median=45, IQR=14) ages respectively was statistically significant,
Mann-Whitney U (p=0.010) (Figure 5.3).
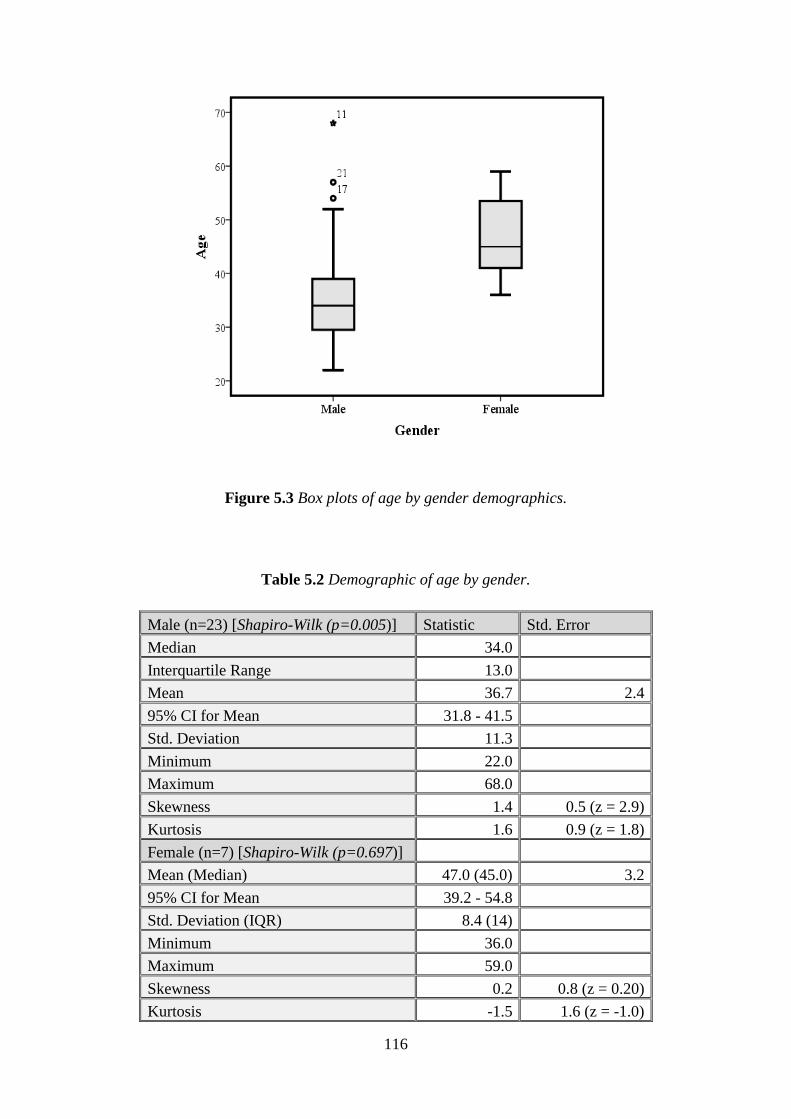
116
Figure 5.3 Box plots of age by gender demographics.
Table 5.2 Demographic of age by gender.
Male (n=23) [Shapiro-Wilk (p=0.005)] Statistic Std. Error
Median 34.0
Interquartile Range 13.0
Mean 36.7 2.4
95% CI for Mean 31.8 - 41.5
Std. Deviation 11.3
Minimum 22.0
Maximum 68.0
Skewness 1.4 0.5 (z = 2.9)
Kurtosis 1.6 0.9 (z = 1.8)
Female (n=7) [Shapiro-Wilk (p=0.697)]
Mean (Median) 47.0 (45.0) 3.2
95% CI for Mean 39.2 - 54.8
Std. Deviation (IQR) 8.4 (14)
Minimum 36.0
Maximum 59.0
Skewness 0.2 0.8 (z = 0.20)
Kurtosis -1.5 1.6 (z = -1.0)

117
Age at diagnosis (AAD)
The AAD was not normally distributed; Shapiro-Wilk (p=0.010), with significant positive
skewness of 1.1 (SE 0.4, z=2.6) and a kurtosis of 1.1 (SE 0.8, z=1.3). The median AAD for the
population was 22 (IQR=8.0) years [Mean=22.7 (± 6.6)] (Table 5.3, Figure 5.4).
Table 5.3 AAD population demographics.
AAD [Shapiro-Wilk (p=0.010)] Statistic Std. Error
Median 22.0
Interquartile Range 8.0
Mean 22.7 1.2
95% CI for Mean 20.2 - 25.1
Std. Deviation 6.6
Minimum 13.0
Maximum 40.0
Range 27.0
Skewness 1.1 0.4 (z=2.6)
Kurtosis 1.1 0.8 (z=1.3)
Figure 5.4 AAD population distribution histogram.

118
AAD by gender
The AAD was also not normally (p=0.016) and normally (p=0.541) distributed in the male and
female populations respectively. The male participants exhibited significant positive skewness
of 1.3 (SE 0.5, z=2.7) and kurtosis of 1.9 (SE 0.9, z=2.1) (Table 5.4). The gender AAD were
not statistically significantly different Mann-Whitney U (p=0.190) (Figures 5.5 and 5.6).
Table 5.4. AAD by Gender Demographics.
AAD by Gender Mann-Whitney U (p=0.190)
Male AAD [Shapiro-Wilk (p=0.016)] Statistic Std. Error
Median 20.0
Interquartile Range 7.0
Mean 21.8 1.3
95% CI for Mean 19.1 - 24.5
Std. Deviation 6.2
Minimum 13.0
Maximum 40.0
Skewness 1.3 0.481 (z=2.7)
Kurtosis 1.9 0.935 (z=2.1)
Female AAD [Shapiro-Wilk (p=0.541)]
Mean 25.6 2.8
95% CI for Mean 18.8 - 32.3
Std. Deviation 7.3
Minimum 16.0
Maximum 39.0
Skewness 0.9 0.794 (z=1.2)
Kurtosis 1.5 1.587 (z=1.0)

119
Figure 5.5 Box plot AAD by gender.
Figure 5.6 Mean age and age at diagnosis (AAD) by gender, with standard deviations.
47.0
36.7
25.621.8
0.0
10.0
20.0
30.0
40.0
50.0
60.0
F M
Mean age
Mean AAD*

120
Participants’ reported duration of CRGPcl wear at enrolment
The AAD was taken as the date when each participant presented for first hospital consultation
and fitting of CRGPcl. The duration of the CRGPcl wear period from the original fitting to the
time of enrolment to this study may therefore be estimated from the difference of the age at
enrolment and AAD. The estimated length of CRGPcl wear was not normally distributed;
Shapiro-Wilk (p=0.014), had a median length of 14.5 years with an IQR of 12 years, significant
positive skewness of 1.2 (SE 0.4, z=2.8) and kurtosis of 1.6 (SE 0.8, z=1.9) (Table 5.5, Figure
5.7).
Table 5.5 Participant reported duration of CRGPcl wear at enrolment.
Duration of CRGPcl Wear [Shapiro-Wilk (p=0.014)]
Statistic Std. Error
Median 14.5
Interquartile Range 12.0
Mean 16.4 1.8
95% CI for Mean 12.7 - 20.1
Std. Deviation 10.0
Minimum 4.0
Maximum 47.0
Range 43.0
Skewness 1.2 0.4 (z=2.8)
Kurtosis 1.6 0.8 (z=1.9)
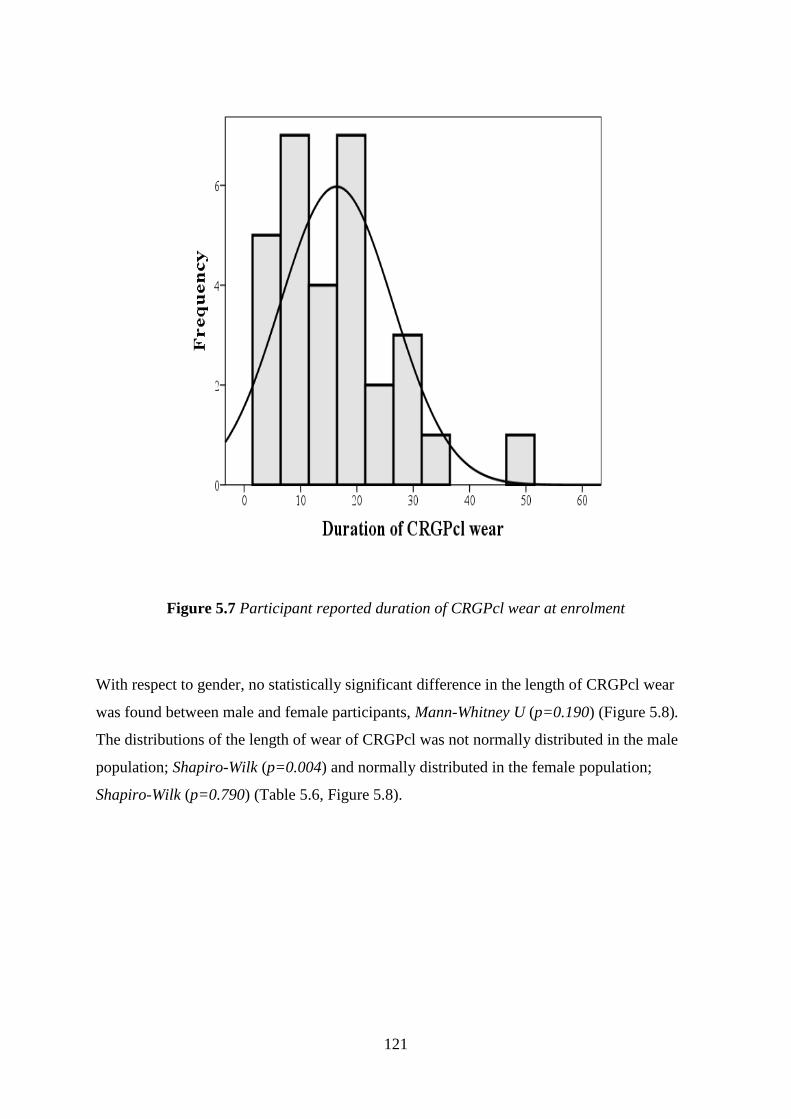
121
Figure 5.7 Participant reported duration of CRGPcl wear at enrolment
With respect to gender, no statistically significant difference in the length of CRGPcl wear
was found between male and female participants, Mann-Whitney U (p=0.190) (Figure 5.8).
The distributions of the length of wear of CRGPcl was not normally distributed in the male
population; Shapiro-Wilk (p=0.004) and normally distributed in the female population;
Shapiro-Wilk (p=0.790) (Table 5.6, Figure 5.8).

122
Table 5.6 Gender duration of estimated time of where of CRGPcl at enrolment.
Duration of CRGPcl wear by Gender [Mann-Whitney U (p=0.190)] Statistic Std. Error
Male [Shapiro-Wilk (p=0.004)] Median 12.0
IQR 11.0
Mean 14.9 2.1
95% CI for Mean 10.5 - 19.2 Std. Deviation 10.1 Minimum 4.0 Maximum 47.0 Range 43.0 Skewness 1.6 0.5 (z=3.4)
Kurtosis 3.5 0.9 (z=3.8)
Female [Shapiro-Wilk (p=0.790)] Mean 21.4 3.3
95% CI for Mean 13.5 - 29.4 Std. Deviation 8.6 Minimum 10.0 Maximum 34.0 Range 24.0 Skewness 0.4 0.8 (z=0.5)
Kurtosis -1.0 1.6 (z=-0.6)
Figure 5.8 Box plot of duration of CRGPcl wear by gender

123
Participant’s occupations / education
The number of participants with university education was 17, which constituted 56.7% of the
total research population (Table 5.7).
Table 5.7 The occupations of research participants.
Participant No Gender Occupation University Education
1 M Company director Yes
2 F Office worker No
3 M TV market research Yes
4 M Finance Yes
5 M Retired sales assistant No
6 M Computer programmer Yes
7 M Finance Yes
8 M Graphic designer Yes
9 F Office administrator No
10 M Finance Yes
11 M Finance, student Yes
12 M Engineer Yes
13 M Driving instructor No
14 M Teacher Yes
15 F Book keeper Yes
16 M Teacher Yes
17 M Administration No
19 M Actor No
20 F Medical secretary No
21 M Business No
23 M Customer service No
24 M Train station manager No
26 F Entertainment Consultant Yes
27 F Mother No
28 M Manager at MacDonald’s No
30 F Investment management Yes
31 M Accountant Yes
32 M Student Yes
33 M Truck driver No
34 M Electrical engineer Yes

124
No of participants with university education 17
Percentage of participants with university education 56.7%
Race / ethnicity
Although racial / ethnic differences were not the subject of this investigation, the role of
ethnicity is significant in both the prevalence and incidence of keratoconus (Georgiou et al.,
2004; Pearson et al., 2000). Broad race classification was included in this research, in line with
the recommendation of the Office of National Statistics, census 2011, which stipulates that:
“Ethnic group classifies people according to their own perceived ethnic group and cultural
background” (Office for National Statistics, ONS., 2013). To broadly classify participant’s
race, the participants themselves chose, from the office of national statistics listing, their
national/geographical origin combined with colour, in groups which were considered relevant
for research in which epidemiology of ectatic corneal disorders was important (Senior and
Bhopal, 1994). This resulted in 4 groups (Table 5.8, Figure 5.9).
The multiracial profile of the participants is typical of the diverse ethnicity of a London based
population. Tables 6 and Figures 9 and 10 exhibit details of race distribution and the
relationship between participant’s race, age and age at diagnosis.
Figure 5.9 Race frequencies: a number and percentage of participant’s ethnicities.
16.7%
n=5
43.3%
n=1310%
n=3
30%
n=9
African
Asian Indian
Black Afro Caribbean
Caucasian white
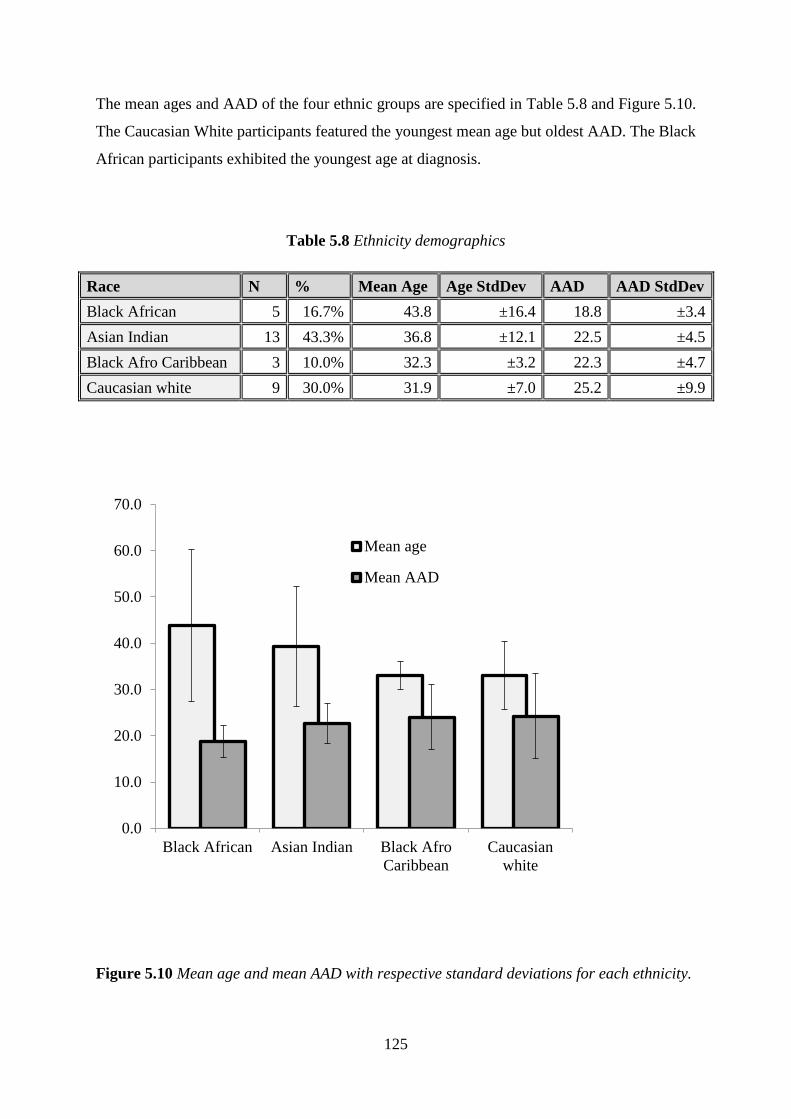
125
The mean ages and AAD of the four ethnic groups are specified in Table 5.8 and Figure 5.10.
The Caucasian White participants featured the youngest mean age but oldest AAD. The Black
African participants exhibited the youngest age at diagnosis.
Table 5.8 Ethnicity demographics
Race N % Mean Age Age StdDev AAD AAD StdDev
Black African 5 16.7% 43.8 ±16.4 18.8 ±3.4
Asian Indian 13 43.3% 36.8 ±12.1 22.5 ±4.5
Black Afro Caribbean 3 10.0% 32.3 ±3.2 22.3 ±4.7
Caucasian white 9 30.0% 31.9 ±7.0 25.2 ±9.9
Figure 5.10 Mean age and mean AAD with respective standard deviations for each ethnicity.
0.0
10.0
20.0
30.0
40.0
50.0
60.0
70.0
Black African Asian Indian Black Afro
Caribbean
Caucasian
white
Mean age
Mean AAD

126
Corneal characteristics
Keratoconus was the most prevalent corneal ectatic disorder in the study population, featuring
in 54 (93.1%) out of the 58 eyes. Two eyes (3.4%) exhibited pellucid marginal degeneration
(PMD) and 2 (3.4%) eyes had Deep Lamellar Keratoplasty (DLK) treatments [corneal
transplant due to advanced keratoconus]. Of the 54 eyes with keratoconus, 33 eyes (56.9%)
featured a nipple type cone, 21 (36.2%) eyes featured the oval type (Perry et al., 1980).
Collagen cross-linking (CXL) treatment has been applied to 6 eyes (10.3%), 4 (6.9%) of which
featured a nipple shaped keratoconus and 2 eyes (3.4%) an oval type. Two eyes (3.4%) with
the oval type cone had been treated with intra-stromal rings (INTACS), eyes with DLK were
present in one eye of 2 participants and were not included in this research (Figure 5.11).
Figure 5.11 Corneal pathology frequencies, including CXL and INTACS treatments
33
21
2 2
4
2 2
0
5
10
15
20
25
30
35
Nipple KC Oval PMD DLK
No of eyes
CXL
INTACS

127
Corneal metrics
Ectatic corneal disorders feature corneal metrics which are outside the expected range of
normal corneae. Three corneal parameters, which reflect the degree of corneal normality were
measured,
1. Corneal curvature, specifically maximal radius of curvature: Kmax.
2. Corneal thickness: pachymetry.
3 Corneal Surface Regularity Index (SRI).
Maximum corneal curvature (Kmax)
The Kmax, represents the steepest corneal curvature/radius of the area measured by corneal
topography, Kmax values (in millimetres) of the research population (Table 5.9) were normally
distributed, Shapiro-Wilk (p=0.882) (Figure 5.12).
Table 5.9 Research participant’s Kmax metrics in mm.
Kmax (Shapiro-Wilk p=0.882) N=56
Statistic Std. Error
Mean 6.2 0.1
95% CI for Mean 6.0 - 6.3
Std. Deviation 0.6
Minimum 5.0
Maximum 7.0
Range 2.0
Skewness 0.0 0.3 (z=-0.1)
Kurtosis -0.6 0.6 (z=-0.9)

128
Figure 5.12 Research participant’s Kmax corneal curvature distribution.
Corneal thickness (pachymetry)
Corneal pachymetry, measured in micrometres (µm), exhibited normal distribution, Shapiro-
Wilk (p=0.569) [1000µm=1mm] (Table 5.10, Figure 5.13).
Table 5.10 corneal thickness (pachymetry in µm) metrics of the research population.
Pachymetry (Shapiro-Wilk p=0.569) N=56
Statistic Std. Error
Mean 445.11 6.51
95% Confidence Interval for Mean 432 - 458
Std. Deviation 48.72
Minimum 309
Maximum 556
Range 247
Skewness 0.02 0.32 (z=0.6)
Kurtosis 0.43 0.63 (z=0.7)

129
Figure 5.13 Research population corneal thickness (pachymetry in µm) histogram.
Corneal surface regularity index
Corneal surface regularity index (SRI) describes corneal optical regularity in the central 4.5
mm area of the cornea. SRI measures the dioptric (DS) optical power differences between
adjacent corneal areas in 256 equidistant locations in the central 4.5mm (Cavas-Martinez et al.,
2016). SRI correlates well with the measure of BCVA (r = 0.80, p <0.001), with normal values
below 0.56DS (Wilson et al., 1991; Cavas-Martinez et al., 2016; Liu and Pflugfelder, 1999).
The SRI of the research population was not normally distributed: Shapiro-Wilk’s (p=0.001)
(Table 5.11 and Figure 5.14).
Table 5.11 Research population corneal surface regularity index (in dioptres) metrics.
Surface Regularity Index (n=56) (Shapiro-Wilk p=0.001)
Statistic Std. Error
Median 1.53
Interquartile Range 0.40
Mean 1.55 0.05
95% CI for Mean 1.45 - 1.65
Std. Deviation 0.36
Minimum/Maximum 1.00/3.00
Skewness 1.00 0.32 (z=3.14)
Kurtosis 4.07 0.63 (z=6.48)

130
Figure 5.14 Corneal surface regularity index (in dioptres) of the research population.
The corneal metrics were normally distributed in the right and left eyes of the study participants
with the exception of the right eye SRI index which was not normally distributed; Shapiro-
Wilk (p=0.001). Despite the difference in the mode of distribution, the SRI means of the right
(Median =1.450) and left (Median =1.590) eyes were not statistically significantly different;
Mann-Whitney U (p=0.168). Independent samples t-test demonstrated no statistically
significant differences between means of the right and left eyes pachymetry and Kmax,
(p=0.481) and (p=0.119) respectively.

131
Randomisation demographics
The participants in this research were randomised to the two treatment groups (Table 5.13).
The following section presents the analysis and comparison of participant demographics in
the two randomised groups (summary Table 5.43a, Appendix V.J).
Table 5.13 Participant randomisation into the two treatment groups and crossover.
Crossover study design Treatment periods AB/BA
Randomisation to treatment groups 1&2 Period 1 Period 2 (Crossover)
Participant
Allocation
Group 1 / Sequence AB A = CRGPcl B = SRGPcl
Group 2 / Sequence BA B = SRGPcl A= CRGPcl
Gender, age and age at diagnosis
The gender frequencies after randomisation were as follows: 2 females and 11 males versus 5
females and 12 males in Groups 1 and 2 respectively (Figure 5.15). The Chi-square goodness
of fit analysis revealed no significant difference in gender allocation between the 2 groups: χ2
(1, n=17) = 2.570, (p=0.109).

132
Figure 5.15 Gender numbers in group 1 (AB) and group 2 (BA).
The ages of participants randomised to group 1 [Mean=39.5 (±14.2)] and group 2
[Mean=38.8 (±9.3)] were normally distributed, Shapiro-Wilk (p=0.188) and (p=0.147)
respectively (Table 5.14, Figures 5.16 and 5.17). A two tailed independent samples t-test
showed no statistically significant difference in the means of the ages between the two
randomised groups [p=0.872, 95% CI -8.093 – 9.487].
Table 5.14 Descriptive statistics of the ages of the randomised groups.
Age (t-test p=0.872)
Randomised to Statistic Std. Error
CRGPcl (Shapiro-Wilk p=0.188)
Mean 39.5 3.9
95% CI for Mean 30.8 - 48.1
Std. Deviation 14.2
Minimum 22.0
Maximum 68.0
Range 46.0
Variance 201.9
Skewness 0.8 0.6 (z=1.3)
Kurtosis -0.4 1.2 (z=-0.3)
SRGPcl (Shapiro-Wilk p=0.147)
Mean 38.8 2.2
2
5
1112
Group 1 (AB) Group 2 (BA)
F M

133
95% CI for Mean 34.0 - 43.5
Std. Deviation 9.3
Minimum 26.0
Maximum 57.0
Range 31.0
Variance 85.9
Skewness 0.7 0.6 (z=1.3)
Kurtosis -0.2 1.1 (z=-0.2)
The AAD of participants randomised to Group 1 [Mean=23.2 (±5.0)] was normally
distributed, Shapiro-Wilk (p=0.439), the AAD in group 2 (Median =20.0) was not normally
distributed, Shapiro-Wilk (p=0.008) (Table 5.15 and Figures 5.16 and 5.17). There was no
statistically significant difference in the AAD between group 1 (Median =22), and group 2
(Median =20.0), Mann-Whitney U test: (p=0.363), U=88.50 (z=-0.924).
Table 5.15 Descriptive statistics of AAD of the randomised groups
AAD (Mann-Whitney U test p=0.363) Statistic Std. Error
Group 1(Shapiro-Wilk p=0.43) Mean 23.2 1.4
95% CI for mean 20.1 - 26.2
Variance 25.0
Std. Deviation 5.0
Median 22.0
Minimum/maximum 16.0/31.0
Skewness 0.3 0.6 (z=0.5)
Kurtosis -1.0 1.2 (z=-0.9)
Group 2 (Shapiro-Wilk p=0.008) Median 20.0
Interquartile range 8.0
Mean 22.3 1.9
95% CI for mean 18.3 - 26.3
Variance 59.2
Std. Deviation 7.7
Minimum/maximum 13/40
Skewness 1.4 0.6 (z=2.5)
Kurtosis 1.4 1.1 (z=1.3)

134
Figure 5.16 Mean age and AAD and StdDev of the 2 randomised groups. The vertical axis is
age in years.
Figure 5.17 Boxplots of age and AAD in group 1(AB) and group 2 (BA).
39.5 38.810
15
20
25
30
35
40
45
50
55
60
Group 1 Group 2
Age
23.2 22.310
15
20
25
30
35
40
45
50
55
60
Group 1 Group 2
AAD
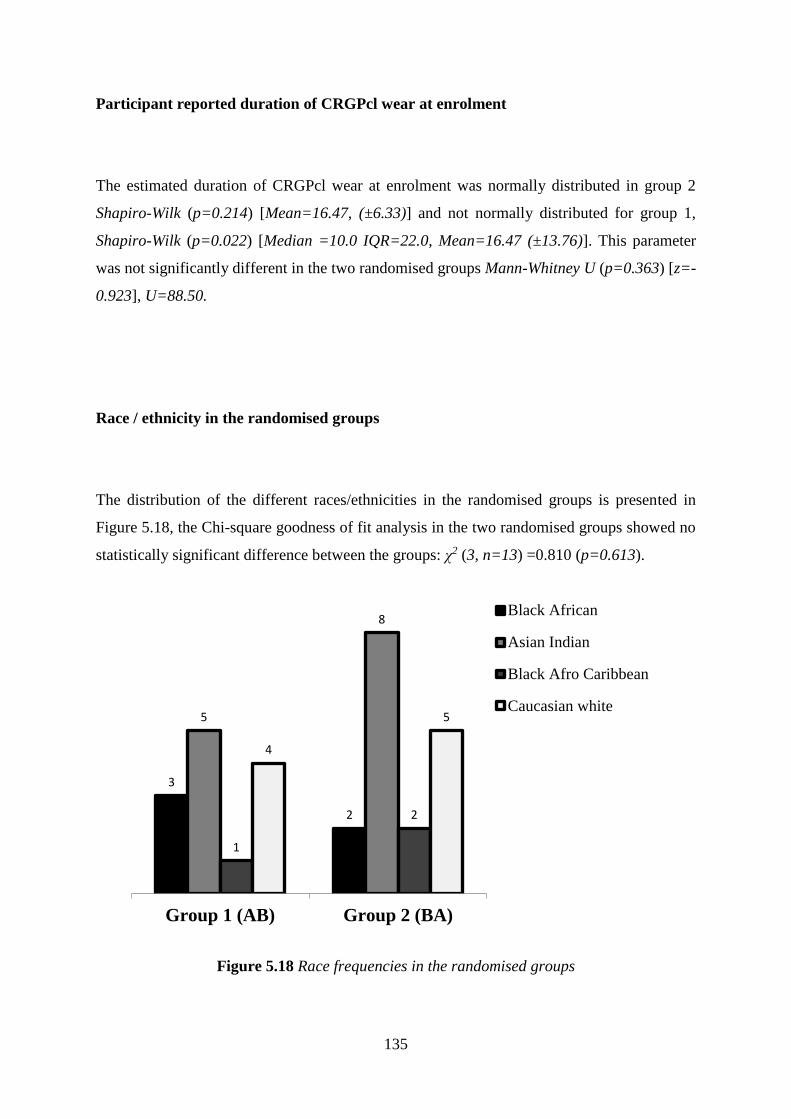
135
Participant reported duration of CRGPcl wear at enrolment
The estimated duration of CRGPcl wear at enrolment was normally distributed in group 2
Shapiro-Wilk (p=0.214) [Mean=16.47, (±6.33)] and not normally distributed for group 1,
Shapiro-Wilk (p=0.022) [Median =10.0 IQR=22.0, Mean=16.47 (±13.76)]. This parameter
was not significantly different in the two randomised groups Mann-Whitney U (p=0.363) [z=-
0.923], U=88.50.
Race / ethnicity in the randomised groups
The distribution of the different races/ethnicities in the randomised groups is presented in
Figure 5.18, the Chi-square goodness of fit analysis in the two randomised groups showed no
statistically significant difference between the groups: χ2 (3, n=13) =0.810 (p=0.613).
Figure 5.18 Race frequencies in the randomised groups
3
2
5
8
1
2
4
5
Group 1 (AB) Group 2 (BA)
Black African
Asian Indian
Black Afro Caribbean
Caucasian white

136
Corneal metrics in the randomised groups
The corneal metrics in this research were measured, analysed and compared to the expected
parameters in normal disease free corneae and between the two randomised groups.
Kmax
The Kmax values of the corneae in the research population as a whole and in the 2 randomised
groups were normally distributed (Table 5.16, Figure 5.19).
Of the Kmax means analysis of the randomised groups by an independent samples t-test
showed that the two groups exhibited no statistically significant difference: t (30) =1.898,
(p=0.068), d =-0.699, 95% CI [-0.0617–0.0235].
Table 5.16 Kmax descriptive statistics.
Corneal Kmax (t-test p=0.068)
Randomised to Statistic Std. Error
Group 1 (Shapiro-Wilk p=0.301) Mean 6.04 0.09 95% CI for Mean 5.84-6.23
Variance 0.22
Std. Deviation 0.47
Min/Max 5.13/6.72
Range 1.59
Skewness -0.12 0.46 (z=0.26)
Kurtosis -0.98 0.90 (z=1.09)
Group 2 (Shapiro-Wilk p=0.773) Mean 6.31 0.11 95% CI for Mean 6.10-6.53
Variance 0.35
Std. Deviation 0.59
Min/Max 5.0/7.28
Range 2.28
Skewness -0.26 0.42 (z=0.62)
Kurtosis -0.43 0.82 (z=0.52)

137
Figure 5.19 a. Box plot of the Kmax in the randomised groups.
Surface regularity index (SRI)
The surface regularity index values of the corneae in group 1 were normally distributed,
Shapiro-Wilk (p=0.991), but not normally distributed in group 2, Shapiro-Wilk (p=0.009),
these variables are summarised in Table 5.17 and Figure 5.19b.
Mann-Whitney U test for independent samples, revealed that the corneal SRI index was not
statistically significantly different in the 2 randomised groups, (p=0.252) (z=-1.146),
U=318.00.
Table 5.17 Surface Regularity Index descriptive statistics in the two randomised groups.
Corneal SRI (Mann-Whitney U p=0.252)
Randomised to Statistic Std. Error
CRGPcl (Shapiro-Wilk p=0.991) Mean 1.59 0.05 95% CI for Mean 1.49-1.69
Variance 0.06
Std. Deviation 0.24
Min/Max 1.11/2.12
Range 1.01
Skewness 0.2 0.46 (z=0.44)

138
Kurtosis -0.15 0.90 (z=-0.17)
SRGPcl (Shapiro-Wilk p=0.009) Median 1.47
Interquartile Range 0.48 Mean 1.52 0.08 95% CI for Mean 1.36-1.68
Variance 0.19
Std. Deviation 0.44
Min/Max 0.69/2.96
Range 2.27
Skewness 1.19 0.42 (z=2.83)
Kurtosis 3.46 0.82 (z=4.22)
Figure 5.19 b. SRI Box plot of the randomised groups 1 and 2

139
Corneal pachymetry
The analysis of pachymetry values in the corneae of the two randomised groups revealed
normal distribution, Shapiro-Wilk (p=0.560) and (p=0.227) in group1 and group 2
respectively, the variables are summarised in Table 5.18 and Figure 5.20.
An independent samples t-test, pachymetry means comparison, indicated that the two
randomised groups did differ significantly: t (54) = -3.279, (p = 0.002), d = -0.881, 95% CI
[-63.77 – -15.38], with group 1 [Mean= 423.20 (±45.10)] exhibiting a mean pachymetry
thinner than the mean in group 2 [Mean=462.77 (±44.73)].
Table 5.18 Corneal pachymetry descriptive statistics.
Corneal Pachymetry (t test p=0.002)
Randomised to Statistic Std. Error
CRGPcl (Shapiro-Wilk p=0.560) Mean 423.2 9.02 95% CI for Mean 404.6-441.8
Variance 2034.5
Std. Deviation 45.1
Minimum 309
Maximum 498
Range 189
Skewness -0.44 0.46 (z=-0.96)
Kurtosis 0.05 0.9 (z=0.06)
SRGPcl (Shapiro-Wilk p=0.227) Mean 462.8 8.03
95% CI for Mean 446.4-479.2
Variance 2001.1
Std. Deviation 44.7
Minimum 389
Maximum 556
Range 167
Skewness 0.46 0.42 (z=1.10)
Kurtosis -0.17 0.82 (z=-0.21)

140
Figure 5.20 Randomised pachymetry Box and whiskers plot, groups 1 and 2
The main outcome measures
Thirty participants completed the study. The data collected were analysed for hypothesis
testing with respect to the primary and secondary outcome measures (summary Table 5.43b
Appendix V.K).
Visual performance, ETDRS logMAR
The logMAR scores of all the measurements [baseline, period 1 and period 2] of the
individual eyes of the research population, (n=504) were not normally distributed Shapiro-
Wilk (p<0.0001), positively skewed and leptokurtic, with a median logMAR score of 0.02
and IQR=0.14. These repeated measures data are presented as a demographic of interest and
were not used in any other statistical analyses (Figure 5.21, Table 5.19).

141
Figure 5.21 ETDRS logMAR scores all eyes and measurements of the research population
Table 5.19 ETDRS logMAR scores of all eyes and measurements of the research population
ETDRS logMAR BCVA (Shapiro-Wilk p<0.0001)
Statistic Std. Error
Mean 0.04 0.01
95% CI for mean 0.03-0.05
Median 0.02
Variance 0.01
Interquartile Range 0.14
Minimum -0.2
Maximum 0.48
Range 0.68
Skewness 1.08 0.11 (z=9.92)
Kurtosis 1.49 0.22 (z=6.88)
The distributions of the average OD/OS logMAR scores of groups 1(AB) and 2 (BA) were
not normally distributed in group 2, Shapiro-Wilk (p<0.0001), and normally distributed in
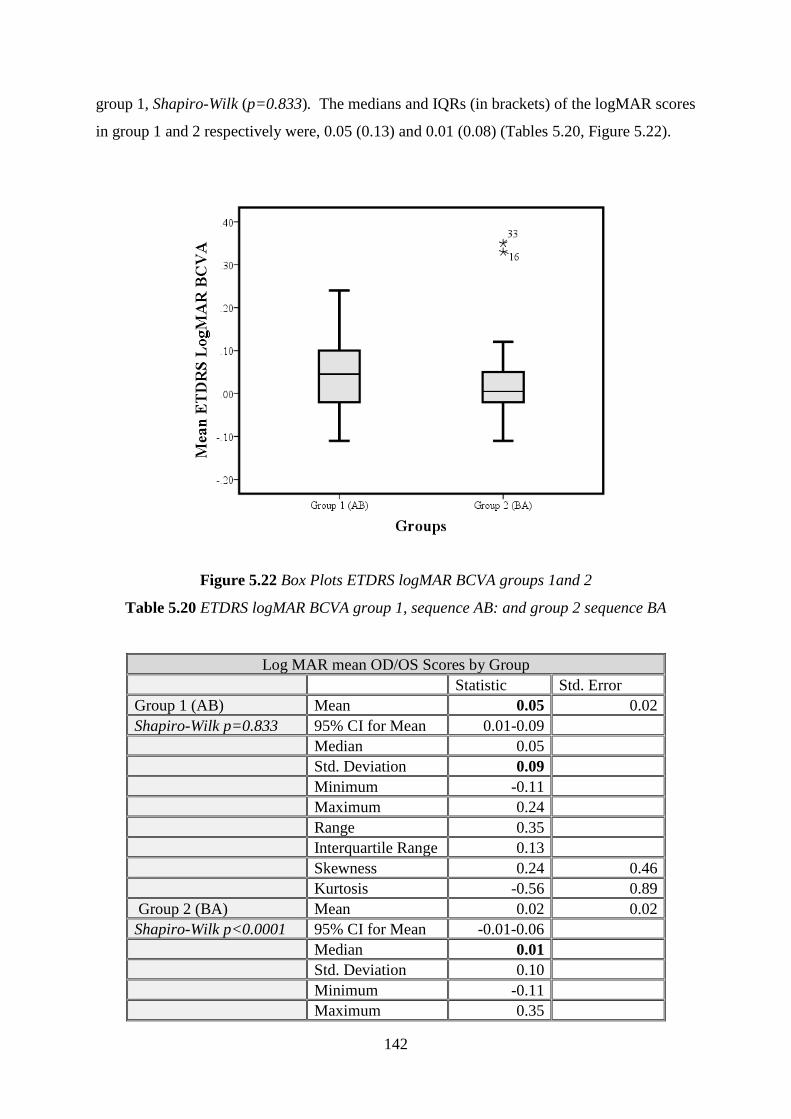
142
group 1, Shapiro-Wilk (p=0.833). The medians and IQRs (in brackets) of the logMAR scores
in group 1 and 2 respectively were, 0.05 (0.13) and 0.01 (0.08) (Tables 5.20, Figure 5.22).
Figure 5.22 Box Plots ETDRS logMAR BCVA groups 1and 2
Table 5.20 ETDRS logMAR BCVA group 1, sequence AB: and group 2 sequence BA
Log MAR mean OD/OS Scores by Group
Statistic Std. Error
Group 1 (AB) Mean 0.05 0.02
Shapiro-Wilk p=0.833 95% CI for Mean 0.01-0.09
Median 0.05
Std. Deviation 0.09
Minimum -0.11
Maximum 0.24
Range 0.35
Interquartile Range 0.13
Skewness 0.24 0.46
Kurtosis -0.56 0.89
Group 2 (BA) Mean 0.02 0.02
Shapiro-Wilk p<0.0001 95% CI for Mean -0.01-0.06
Median 0.01
Std. Deviation 0.10
Minimum -0.11
Maximum 0.35
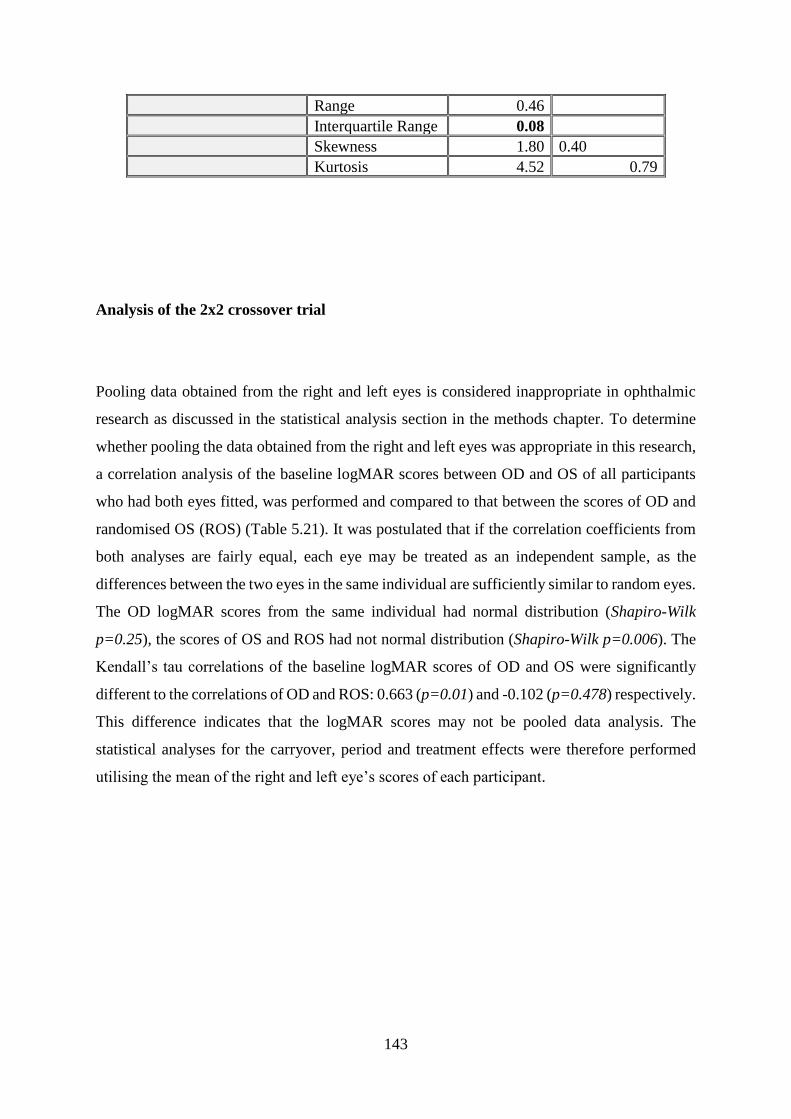
143
Range 0.46
Interquartile Range 0.08
Skewness 1.80 0.40
Kurtosis 4.52 0.79
Analysis of the 2x2 crossover trial
Pooling data obtained from the right and left eyes is considered inappropriate in ophthalmic
research as discussed in the statistical analysis section in the methods chapter. To determine
whether pooling the data obtained from the right and left eyes was appropriate in this research,
a correlation analysis of the baseline logMAR scores between OD and OS of all participants
who had both eyes fitted, was performed and compared to that between the scores of OD and
randomised OS (ROS) (Table 5.21). It was postulated that if the correlation coefficients from
both analyses are fairly equal, each eye may be treated as an independent sample, as the
differences between the two eyes in the same individual are sufficiently similar to random eyes.
The OD logMAR scores from the same individual had normal distribution (Shapiro-Wilk
p=0.25), the scores of OS and ROS had not normal distribution (Shapiro-Wilk p=0.006). The
Kendall’s tau correlations of the baseline logMAR scores of OD and OS were significantly
different to the correlations of OD and ROS: 0.663 (p=0.01) and -0.102 (p=0.478) respectively.
This difference indicates that the logMAR scores may not be pooled data analysis. The
statistical analyses for the carryover, period and treatment effects were therefore performed
utilising the mean of the right and left eye’s scores of each participant.

144
Table 5.21 Baseline logMAR scores of OD OS and ROS
ETDRS logMAR Baseline Scores
SN OD OS R OS
1 -0.10 -0.10 0.09
2 -0.05 -0.04 -0.02
3 0.03 0.03 0.07
6 -0.02 -0.02 0.10
7 0.03 0.10 0.09
9 0.11 0.11 -0.12
10 0.10 0.07 0.15
11 0.29 0.15 -0.07
12 -0.02 -0.02 -0.04
13 -0.05 -0.04 0.09
14 0.10 0.09 -0.03
15 -0.11 -0.15 -0.04
16 -0.17 -0.12 0.11
17 -0.06 0.09 -0.02
19 0.05 -0.03 -0.10
20 -0.05 -0.04 0.07
21 0.05 0.09 -0.15
23 0.14 -0.01 0.25
24 -0.03 -0.02 0.35
27 -0.03 -0.07 -0.03
28 0.02 0.02 -0.04
30 0.03 0.07 -0.01
31 0.01 -0.03 0.03
32 0.27 0.35 0.45
33 0.16 0.25 -0.02
34 0.05 0.45 0.02
A linear model for the data may be used to derive two-sample t-tests or a non-parametric
equivalent for testing hypotheses about the direct treatment and carry-over effects (Jones and
Kenward, 2015; Wellek and Blettner, 2012).
The general notation to be used in this section is as follows. The participants were randomised
into two groups of sizes n1=13 and n2=17. The n1 subjects in group 1 received the lenses in
the order CRGPcl-SRGPcl: sequence AB and the n2 subjects in group 2 received the lenses in
the order SRGPcl-CRGPcl: sequence BA. The outcome of subject k in period j of group i is
denoted by yijk. The group-by-period means for the ETDRS logMAR BCVA data are given in
Table 5.22 and Figure 5.23.

145
Table 5.22 Group by period means for the mean ETDRS logMAR BCVA
Group Mean logMAR Period 1 Mean logMAR Period 2 Mean logMAR
1 (AB) n1=13 ȳ11. =0.06 ȳ12 =0.04 ȳ.1 total = 0.05
2 (BA) n2=17 ȳ21. =0.01 ȳ22 =0.01 ȳ.2 total. = 0.01
Mean logMAR ȳ.1. = 0.04 ȳ.2. =0.03 ȳ.. total = 0.03
Figure 5.23 Boxplots of group by period for the mean OD/OS ETDRS logMAR BCVA
The boxplot in Figure 5.24 exhibits the OD/OS means of the logMAR scores of the 2
experimental lenses of the whole research population. The logMAR scores for CRGPcl
[Mean=0.04, (±0.11)] were normally distributed; Shapiro-Wilk (p=0.0654), the SRGPcl
logMAR scores [Mean=0.03, (±0.09), Median=0.02, IQR=0.09] were not normally
distributed; Shapiro-Wilk (p=0.016).

146
Figure 5.24 Mean OD/OS logMAR scores of CRGPcl vs SRGPcl
Group by Period analysis
The plots of the means of OD/OS, ETDRS logMAR scores for each participant in period 1 vs
period 2 for group 1(AB) and group 2(BA) are illustrated below (Figures 5.25 and 5.26). The
Kendall’s tau correlations between the periods were 0.517 and 0.331 for groups 1 and 2
respectively.

147
Figure 5.25 and 5.26 Mean OD/OS ETDRS logMAR BCVA period 1 versus period 2 in both
groups
To determine evidence for a direct treatment effect, Figure 5.27 exhibits the mean OD/OS
logMAR scores from both groups on a single graph and indicates the centroid of each group
with a solid enlarged character [centroid is the mean position of all the points/objects in a
cluster]. Kendall’s tau correlation between ETDRS logMAR BCVA of period 1 and period 2
of both groups is 0.464 (p<0.01).
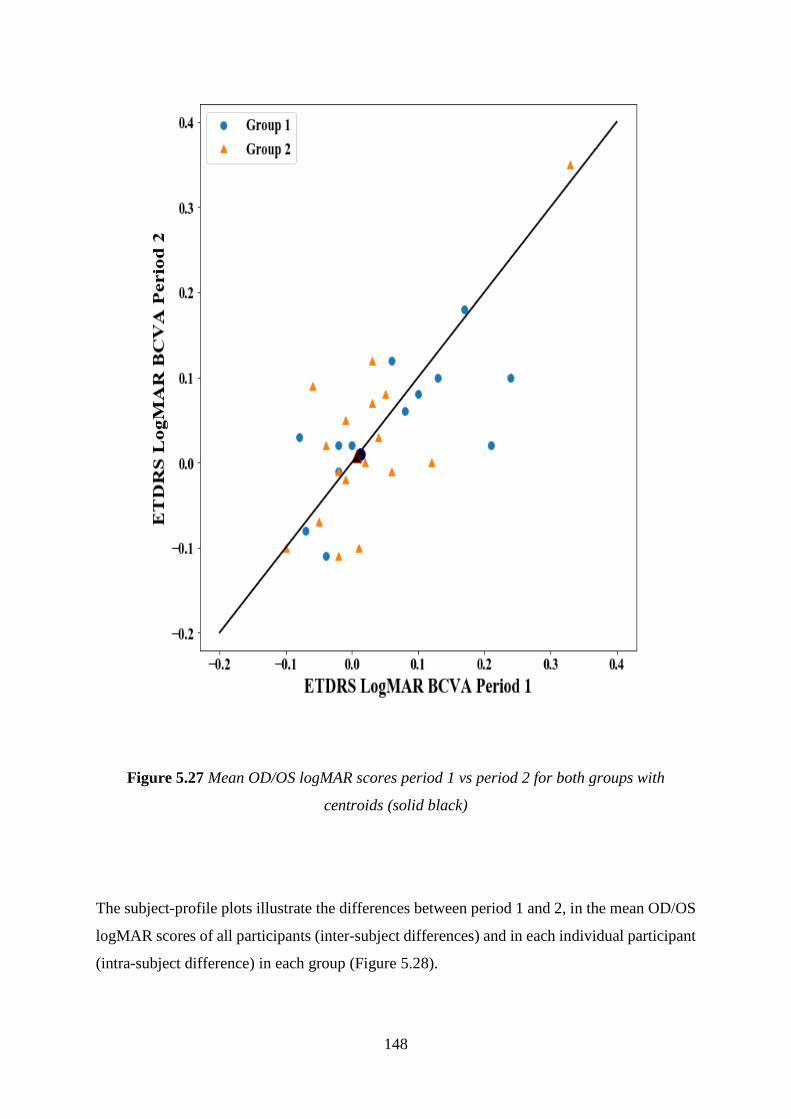
148
Figure 5.27 Mean OD/OS logMAR scores period 1 vs period 2 for both groups with
centroids (solid black)
The subject-profile plots illustrate the differences between period 1 and 2, in the mean OD/OS
logMAR scores of all participants (inter-subject differences) and in each individual participant
(intra-subject difference) in each group (Figure 5.28).

149
Group 1(AB) Group 2(BA)
Figure 5.28 Profiles Plots for ETDRS logMAR by Group intra-participant period difference
Having looked at the logMAR scores from individual participants, a group-by-period plot,
which compares the average logMAR scores of each group in each period, was generated. The
four group by period means ȳ11, ȳ12, ȳ21 and ȳ22 were plotted against their corresponding
period labels and joined the means of period 1 of group 1 and period 2 of group 2 [1A and 2A]
and period 2 of group 1 with period 1 of group 2 [1B and 2B] (Figure 5.29). The blue and red

150
circles represent the mean logMAR scores of participants in groups 1 and 2 wearing CRGPcl
in periods 1 and 2 respectively and the red and blue triangles represent mean logMAR scores
of participants in groups 2 and 1 wearing SRGPcl in periods 1 and 2 respectively.
Figure 5.29 Group-by-period plot for mean ETDRS logMAR data.

151
Crossover and treatment effect analysis
A general technique for analysing 2x2 crossover designs [two treatments with two sequence
groups], involves reducing the two responses / scores of each subject to a single value and
comparing the mean of this derived variate between the two groups (Jones and Kenward, 2015).
For normally distributed data, an independent two-sample t-test is used to compare the group
means, for data that are not normally distributed; the Mann-Whitney U test for independent
samples can be used. The logMAR scores, sums and differences by period in each group are
exhibited in Tables 5.23a and 5.23b.
Table 5.23a. Group 1 ETDRS logMAR scores, sums and differences periods 1 & 2
Group 1 (Sequence AB)
SN Period 1 Period 2 Sum of Periods P1+P2 Δ of Periods (P2-P1) Crossover Δ (A-B)
1 -0.02 0.02 0.00 0.04 -0.04
2 0.00 0.02 0.02 0.02 -0.02
5 0.13 0.10 0.23 -0.03 0.03
7 0.06 0.12 0.18 0.06 -0.06
10 0.24 0.10 0.34 -0.14 0.14
11 0.17 0.18 0.35 0.01 -0.01
13 -0.08 0.03 -0.05 0.11 -0.11
14 0.10 0.08 0.18 -0.02 0.02
20 -0.07 -0.08 -0.15 -0.01 0.01
23 0.08 0.06 0.14 -0.02 0.02
28 -0.02 -0.01 -0.03 0.01 -0.01
31 -0.04 -0.11 -0.15 -0.07 0.07
33 0.21 0.02 0.23 -0.19 0.19

152
Table 5.23b. Group 2 ETDRS logMAR scores, sums and differences periods 1 & 2
Group 2
SN Period 1 Period 2 Sum of Periods P1+P2 Δ of Periods (P2-P1) Crossover Δ (A-B)
3 0.04 0.03 0.07 -0.01 -0.01
4 -0.01 0.05 0.04 0.06 0.06
6 -0.01 -0.02 -0.03 -0.01 -0.01
8 -0.06 0.09 0.03 0.15 0.15
9 0.02 0.00 0.02 -0.02 -0.02
12 0.03 0.07 0.10 0.04 0.04
15 0.01 -0.10 -0.09 -0.11 -0.11
16 -0.02 -0.11 -0.13 -0.09 -0.09
17 -0.10 -0.10 -0.20 0.00 0.00
19 0.06 -0.01 0.05 -0.07 -0.07
21 0.05 0.08 0.13 0.03 0.03
24 0.12 0.00 0.12 -0.12 -0.12
26 -0.05 -0.07 -0.12 -0.02 -0.02
27 -0.04 0.02 -0.02 0.06 0.06
30 -0.02 -0.01 -0.03 0.01 0.01
32 0.33 0.35 0.68 0.02 0.02
34 0.03 0.12 0.15 0.09 0.09
Carryover and period effects analysis
A preliminary analysis, after the first 12 participants completed their participation, for
carryover effect was performed as recommended by Wellek and Blettner (2012) and Jones and
Kenward (2015), by an independent sample t-test. The results exhibited no significant
difference: t (12) = 2.228, df = 10, (p=0.056), 95% CI [-0.29087, 0.0042] NS, Cohen’s d = -
1.250. The mean sum of BCVA, of the better eye for participants randomised to SRGPcl [Mean
=0.10, ±0.112] was not significantly different to that of participants randomised to CRGPcl
[Mean =0.04, ±0.048]. This finding does not support the presence of a significant carry over
effect in that group of participants, indicating that it is appropriate to progress with analysing
for treatment effects based on the crossover data.

153
A similar analysis was carried out once the study was completed for the full study population.
The comparison of the sums of the mean OD/OS logMAR scores of the 2 periods between
groups 1 and 2 of the whole population, by the Mann-Whitney U test indicated that there was
no statistically significant difference between the period sums of group 1 (Median=0.14, IQR=
0.27) and group 2 (Median=0.03, IQR=0.17), U=84.5 (p=0.281) [z=-1.089], which confirmed
the absence of a carryover effect (Table 5.24a. and b).
Table 5.24 Carryover effect statistics Mann-Whitney U test
Sum P1+P2
Group N Mean Rank Sum of Ranks
Group 1 (AB) 13 17.5 227.5
Group 2 (BA) 17 13.97 237.5
Total 30 a.
Test Statistics Sum of Means
Mann-Whitney U 84.5
Wilcoxon W 237.5
Z -1.089
Exact. Sig. [2-(1-tailed Sig.)] 0.281
b.
To calculate the period effect as recommended by Wellek and Blettner (2012) and Jones and
Kenward (2015), the crossover period differences [Crossover Δ (A-B), Tables 5.23 a and b]
were compared between the two randomised groups. The crossover period differences were
normally distributed, Shapiro-Wilk (p=0.417) and (p=0.853) group 1 and 2 respectively. An
independent samples t-test means comparison of the period crossover differences between
group 1 [Mean=0.0177, (±0.08)] and 2 [Mean=0.0006, (±0.07)] revealed no significant
difference between the two groups, t (0.62), df 28, (p=0.541), 95% CI (-0.04 -0.07), d=0.23.
This finding indicated that there was no significant period effect in the logMAR scores in this
research.
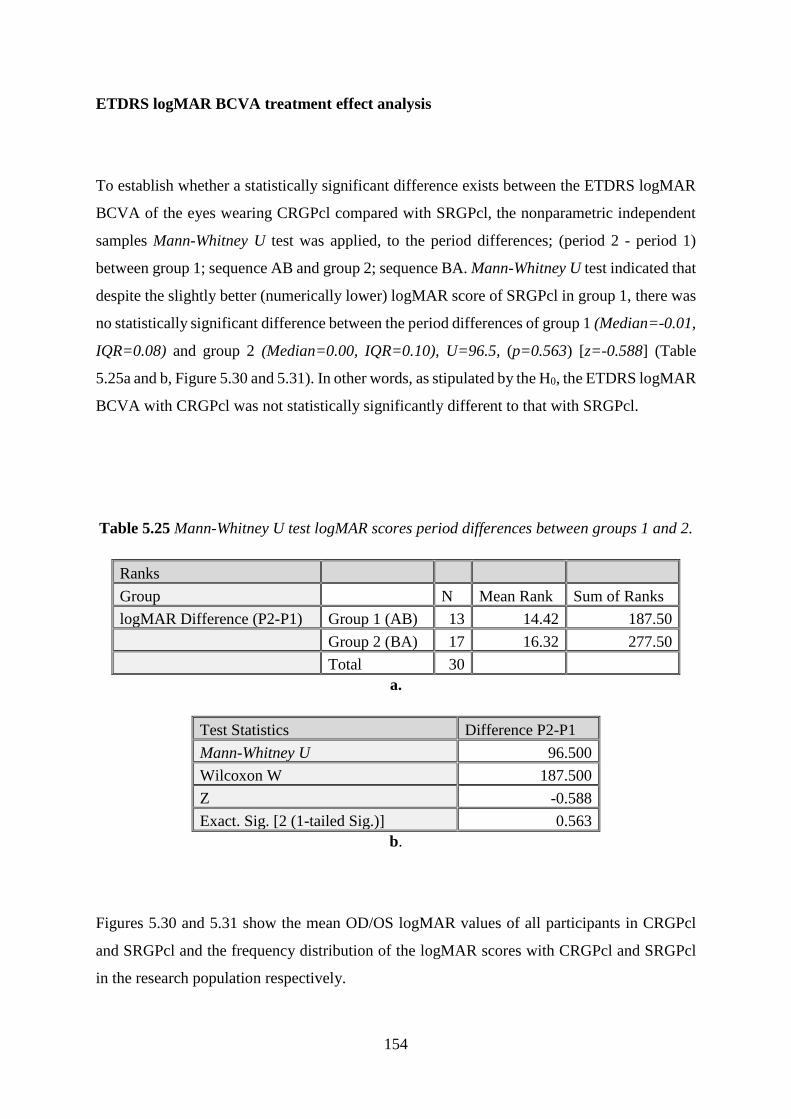
154
ETDRS logMAR BCVA treatment effect analysis
To establish whether a statistically significant difference exists between the ETDRS logMAR
BCVA of the eyes wearing CRGPcl compared with SRGPcl, the nonparametric independent
samples Mann-Whitney U test was applied, to the period differences; (period 2 - period 1)
between group 1; sequence AB and group 2; sequence BA. Mann-Whitney U test indicated that
despite the slightly better (numerically lower) logMAR score of SRGPcl in group 1, there was
no statistically significant difference between the period differences of group 1 (Median=-0.01,
IQR=0.08) and group 2 (Median=0.00, IQR=0.10), U=96.5, (p=0.563) [z=-0.588] (Table
5.25a and b, Figure 5.30 and 5.31). In other words, as stipulated by the H0, the ETDRS logMAR
BCVA with CRGPcl was not statistically significantly different to that with SRGPcl.
Table 5.25 Mann-Whitney U test logMAR scores period differences between groups 1 and 2.
Ranks
Group N Mean Rank Sum of Ranks
logMAR Difference (P2-P1) Group 1 (AB) 13 14.42 187.50
Group 2 (BA) 17 16.32 277.50
Total 30 a.
Test Statistics Difference P2-P1
Mann-Whitney U 96.500
Wilcoxon W 187.500
Z -0.588
Exact. Sig. [2 (1-tailed Sig.)] 0.563
b.
Figures 5.30 and 5.31 show the mean OD/OS logMAR values of all participants in CRGPcl
and SRGPcl and the frequency distribution of the logMAR scores with CRGPcl and SRGPcl
in the research population respectively.

155
Figure 5.30a. Individual logMAR scores in CRGPcl and SRGPcl of the research population
Figure 5.30b. Frequency distribution logMAR BCVA with CRGPcl and SRGPcl
-0.2
-0.1
0
0.1
0.2
0.3
0.4lo
gM
AR
BC
VA
Individual Participants
CRGPcl
SRGPcl

156
Contrast sensitivity function (CSF) visual performance outcomes
The OD/OS mean numerical CS scores of the four CPD tests of the research population were
not normally distributed and are exhibited in Table 5.26 (Appendix V.H) and Figure 5.31b.
The CSF per CPD data for all eyes is exhibited in Figure 5.31a.
Figure 5.31a. Numeric values of experimental CS scores distribution by CPD of OD and OS
of the research population

157
The OD/OS averages of the CS numerical scores for CRGPcl and SRGPcl are shown in table
5.27.a (Appendix V.A), total means per CPD in Table 5.27.b. and Figure 5.31b and 5.33.
Table 5.27.b CS numerical means and StdDev. for averages of OD/OS scores in CRGPcl and
SRGPcl for the research population
Mean 3 CPD Mean 6 CPD Mean 12 CPD Mean 18 CPD Total Mean
CRGPcl 5.39 (±1.46) 4.79 (±1.58) 5.00 (±1.96) 4.61 (±1.98) 4.95 (±1.75)
SRGPcl 5.57 (±1.01) 5.18 (±1.47) 4.79 (±1.92) 4.96 (±1.73) 5.13 (±1.53)
Mean Population 5.48 (±1.25) 4.98 (±1.53) 4.89 (±1.93) 4.79 (±1.86) 5.03 (±1.64)
Figure 5.31b. OD/OS means of numeric CSF scores and standard deviations; CRGPcl vs
SRGPcl of the research population
0
1
2
3
4
5
6
7
8
3 CPD 6 CPD 12 CPD 18 CPD
CSF CRGPcl ~vs~SRGPcl
CRGPcl SRGPcl

158
The normative means of the general population (Table 5.28) for photopic light conditions are
exhibited below; these data were collected as base-line in an FDA clinical trial for refractive
surgery [unpublished data quoted in (VectorVision, 2013)]. These results are based on the
evaluation of 79 patients with an age range of 21–55 years, mean 36.6 (±9.02) years. Mean
pre-operative acuity for these patients was logMAR -0.10 (±0.06). Another population-based
study, evaluated 370 subjects with normal 20/20 [logMAR 0.00] visual acuity (Hashemi et al.,
2012). A comparison of CSF values of the research population to participants with keratoconus
from a study by Wei et al., (2011) is exhibited in Figure 5.32c.
Table 5.28 Normative data ages 21-51 FDA study and Hashemi et al., (2012) italicised.
Spatial Frequency Log Average (Contrast Level Numeric) Standard Deviation
Row A (3 CPD) 1.84 (6.38) / 1.63 (5.0) 0.14 (0.93) / 0.18 (1.2)
Row B (6 CPD) 2.09 (6.67) / 1.90 (5.4) 0.16 (1.08) / 0.20 (1.3)
Row C (12 CPD) 1.76 (6.46) / 1.58 (5.3) 0.17 (1.15) / 0.23 (1.5)
Row D (18 CPD) 1.33 (6.50) / 1.14 (5.3) 0.19 (1.31) / 0.24 (1.6)
Plotting the CSF of the whole research population together with normative data from the
sources described above is presented in Table 5.29 and Figure 5.32a-c.
Table 5.29 CS normative vs research population data
3 CPD 6 CPD 12 CPD 18 CPD
Normative data (FDA) 6.38 (±0.93) 6.67 (±1.08) 6.46 (±1.15) 6.50 (±1.31)
Hashemi et al., (2012) 5.00 (±1.20) 5.40 (±1.30) 5.30 (±1.30) 5.30 (±1.60)
Research population data 5.48 (±1.25) 4.98 (±1.53) 4.89 (±1.93) 4.79 (±1.86)

159
a
b.
0
1
2
3
4
5
6
7
8
9
3 CPD 6 CPD 12 CPD 18 CPD
CSF Normative ~ vs ~ Research Population
Normative Data Mean
Research Population
Mean
0
1
2
3
4
5
6
7
8
CPD 3 CPD 6 CPD 12 CPD 18
CSF Normative ~ vs ~ Research Population
Research Population
Hashemi et al., (2012)
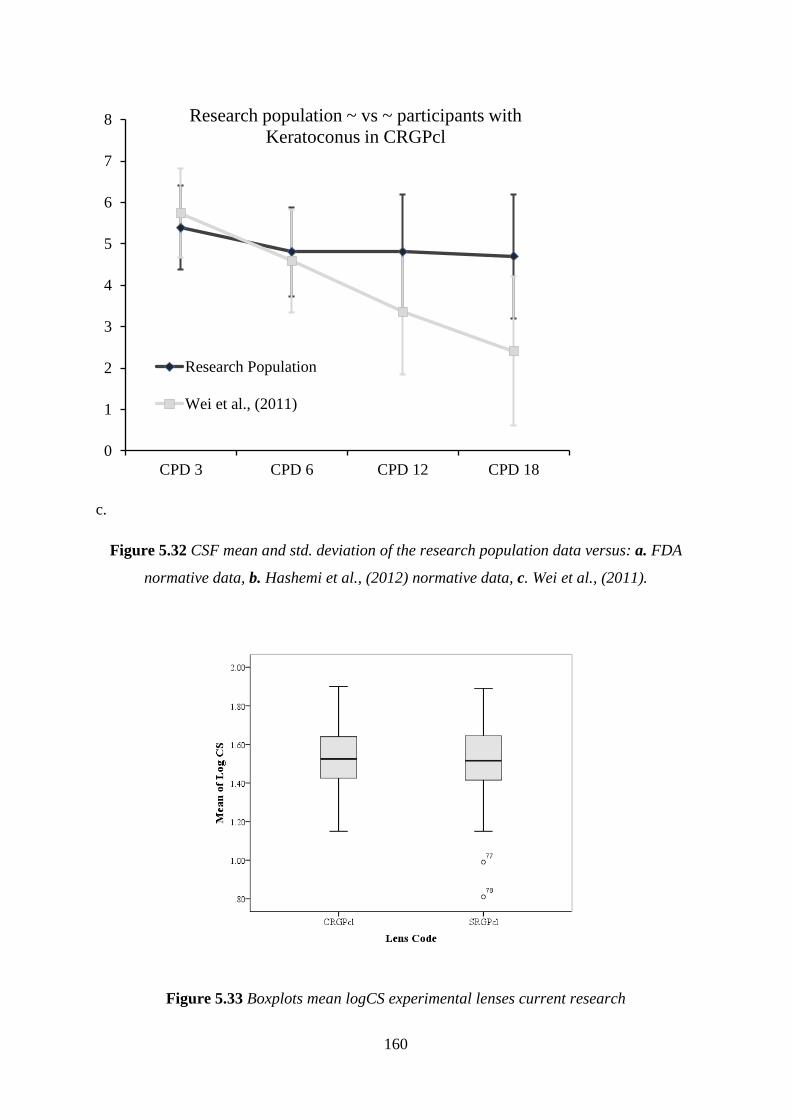
160
c.
Figure 5.32 CSF mean and std. deviation of the research population data versus: a. FDA
normative data, b. Hashemi et al., (2012) normative data, c. Wei et al., (2011).
Figure 5.33 Boxplots mean logCS experimental lenses current research
0
1
2
3
4
5
6
7
8
CPD 3 CPD 6 CPD 12 CPD 18
Research population ~ vs ~ participants with
Keratoconus in CRGPcl
Research Population
Wei et al., (2011)

161
The average OD/OS mean of 3,6,12,18 CPD, logCS scores in the experimental lenses were
normally distributed, Shapiro-Wilk (p=0.731) and (p=0.144) in CRGPcl and SRGPcl
respectively. The logCS scores for CRGPcl were [Mean 1.53, (±0.14)] and SRGPcl
[Mean=1.50, (±0.20)] (Figure 5.33).
Crossover data analysis
The summary of the average OD/OS mean of the 4 CPD scores logCS, by group and period
are exhibited in Table 5.30. The sums and differences of the mean OD/OS logCS scores for the
2 groups are exhibited in Table 5.31. The descriptive statistics of the periods in the two groups
are exhibited in Table 5.32. The logCS period data are normally distributed, Shapiro-Wilk
p>0.30 in periods 1 and 2 of groups 1(AB) and 2(BA) respectively.
Table 5.30 Summary of CS scores by group and period
Group Mean logCS Period 1 Mean logCS Period 2 Mean logCS
1 (AB) n1=13 ȳ11. =1.46 ȳ12 =1.42 ȳ.1 total = 1.44
2 (BA) n2=17 ȳ21. =1.56 ȳ22 =1.59 ȳ.2 total. = 1.58
Mean logCS ȳ.1. = 1.51 ȳ.2. =1.51 ȳ.. total = 1.51

162
Table 5.31 logCS all CPD period scores, sums and differences of OD/OS means, group
1(AB) and 2 (BA)
Group 1 (AB) Mean OD/OS logCS Group 2(BA) Mean OS/OS logCS
SN P1(A) P2(B) P1+P2 ΔP2/P1 ΔA/B SN P1(B) P2(A) P1+P2 ΔP2/P1 ΔA/B
1 1.53 1.47 3.00 -0.06 0.06 3 1.42 1.40 2.81 -0.02 -0.02
2 1.62 1.63 3.25 0.01 -0.01 4 1.63 1.49 3.12 -0.14 -0.14
5 1.40 1.28 2.67 -0.12 0.12 6 1.50 1.53 3.03 0.02 0.02
7 1.43 1.68 3.12 0.25 -0.25 8 1.58 1.52 3.10 -0.06 -0.06
10 1.27 1.27 2.54 -0.01 0.01 9 1.44 1.55 2.99 0.11 0.11
11 1.51 1.21 2.73 -0.30 0.30 12 1.47 1.40 2.87 -0.07 -0.07
13 1.54 1.49 3.03 -0.05 0.05 15 1.77 1.78 3.55 0.01 0.01
14 1.38 1.30 2.68 -0.08 0.08 16 1.57 1.58 3.14 0.01 0.01
20 1.63 1.52 3.15 -0.11 0.11 17 1.80 1.80 3.61 0.00 0.00
23 1.42 0.90 2.32 -0.52 0.52 19 1.52 1.57 3.09 0.05 0.05
28 1.41 1.57 2.97 0.16 -0.16 21 1.59 1.53 3.12 -0.06 -0.06
31 1.64 1.72 3.36 0.08 -0.08 24 1.72 1.69 3.40 -0.03 -0.03
33 1.21 1.48 2.69 0.27 -0.27 26 1.75 1.70 3.46 -0.05 -0.05
27 1.41 1.65 3.06 0.24 0.24
30 1.68 1.68 3.37 0.00 0.00
32 1.33 1.41 2.74 0.08 0.08
34 1.32 1.76 3.08 0.44 0.44
Table 5.32 Descriptive statistics of Mean OD/OS logCS in the 2 periods in both groups
Group 1(AB) Group 2(BA)
Period 1 Period 2 Period 1 Period 2
Statistic StdEr Statistic StdEr Statistic StdEr Statistic StdEr
Shapiro-Wilk p 0.522 0.35 0.632 0.348
Mean 1.46 0.04 1.42 0.06 1.56 0.04 1.59 0.03
95% CI 1.38-1.54 1.29-0.56 1.48-1.64 1.52-1.66
Std. Deviation 0.13 0.23 0.15 0.13
Minimum 1.21 0.90 1.32 1.4
Maximum 1.64 1.72 1.80 1.8
Range 0.43 0.82 0.48 0.4
Skewness -0.33 0.62 -0.91 0.62 0.05 0.55 0.1 0.6
Kurtosis -0.51 1.19 0.96 1.19 -1.07 1.06 -1.1 1.1

163
Average OD/OS, mean of CPDs: 3,6,12 and 18, logCS scores of period 1 versus period 2 in
groups 1 and 2 separately and together with centroids are exhibited in Figures 5.34 and 5.35
respectively. Individual participant scores in both periods are exhibited in Figure 5.36
[noticeable outlier in group 1, with poor logCS scores in period 2, results confirmed in
participant 23].
Figure 5.34 Mean OD/OS logCS period 1 versus period 2 in both groups

164
Figure 5.35 Average OD/OS logCS mean of CPD 3,6,12,18 scores period 1 vs period 2 for
both groups with centroids (solid black)
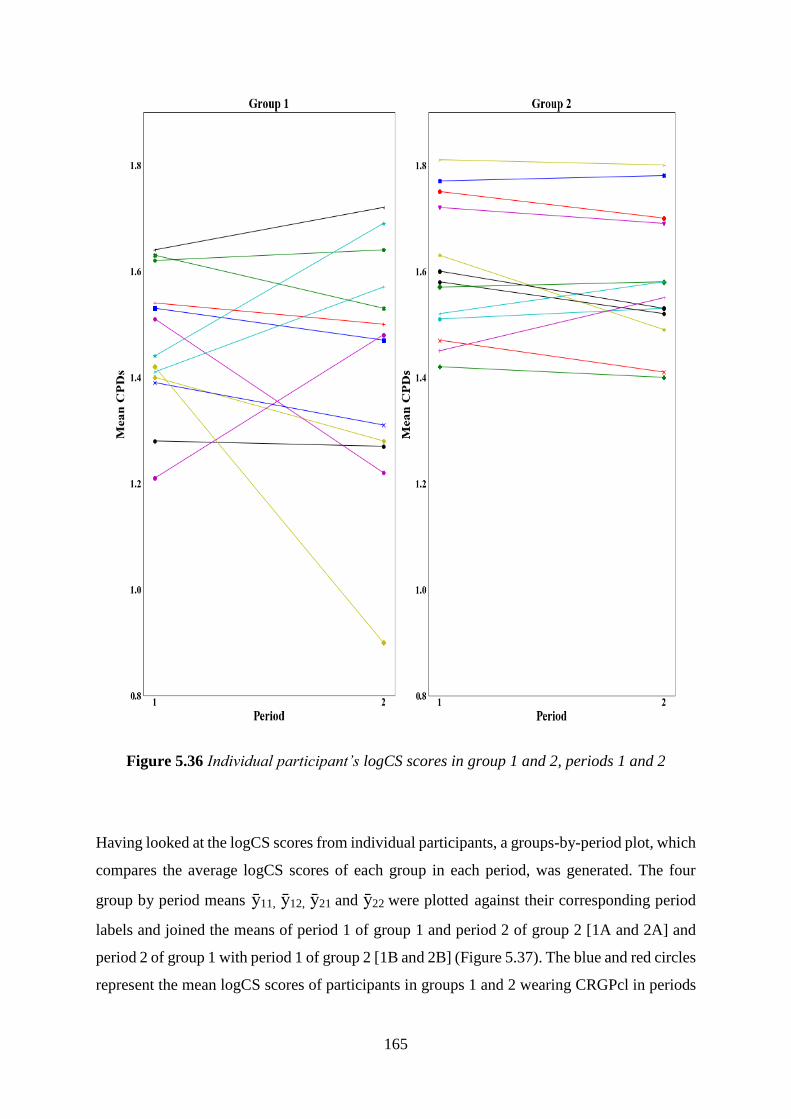
165
Figure 5.36 Individual participant’s logCS scores in group 1 and 2, periods 1 and 2
Having looked at the logCS scores from individual participants, a groups-by-period plot, which
compares the average logCS scores of each group in each period, was generated. The four
group by period means ȳ11, ȳ12, ȳ21 and ȳ22 were plotted against their corresponding period
labels and joined the means of period 1 of group 1 and period 2 of group 2 [1A and 2A] and
period 2 of group 1 with period 1 of group 2 [1B and 2B] (Figure 5.37). The blue and red circles
represent the mean logCS scores of participants in groups 1 and 2 wearing CRGPcl in periods

166
1 and 2 respectively and the blue and red triangles represent mean logCS scores of participants
in groups 1 and 2 wearing SRGPcl in periods 2 and 1 respectively.
Figure 5.37 Group-by-periods plot for mean logCS data.
Carryover and period effect analysis
Independent samples t-test comparing the means of the period sums of the two groups found
a statistically significant difference between the period sums in group 1 [Mean=2.89,
(±0.31)] and the period sums in group 2 [Mean=3.15, (±0.25)], (p=0.019), 95% CI [-0.45 -

167
-0.47]. This result indicates that because the mean of period sums in group 2 is significantly
higher than that in group 1, there is a possibility of the presence of a differential carryover
effect. Owing to this finding, the analysis of the data with respect to the treatment effect was
performed in two ways: as a crossover trial, using data from both periods and as a parallel
group trial, using data from the first period only.
To calculate the period effect as recommended by Wellek and Blettner (2012) and Jones and
Kenward (2015), the crossover period differences [Crossover Δ (A-B), Tables 5.31] of the
logCS scores were compared between the two randomised groups. The crossover period
differences were normally distributed in group 1 and not normally in group 2, Shapiro-Wilk
(p=0.464) and (p=0.002) respectively. A Man-Whitney U test comparison of the period
crossover differences between group 1 [Mean=0.369, (±0.214), Median=0.050, IQR=0.24]
and group 2 [Median=0.00, IQR=0.12)] revealed no significant difference between the two
groups, U=101.50, (p=0.711). This finding indicated that despite the significant carryover
effect, there was no significant period effect in the logCS scores in this research.
Crossover analysis of the treatment effect
The determination whether there was a difference between the two experimental lenses in the
visual performance with respect to logCS scores, analysis was performed as recommended by
Wellek and Blettner (2012) and Jones and Kenward (2015), by comparing the period score
differences of the two randomised groups with an independent samples t-test.
The mean OD/OS logCS mean of the four CPD period difference of groups 1 and 2 [Mean=-
0.0354, SD=0.21469] and [Mean=0.0300, SD=0.13500] respectively, showed that the higher
scores of logCS achieved with CRGPcl in both groups did not reach statistical significance:
(p=0.316), t(30)=-1.022, df=28, d=-0.258, 95% CI [-0.1965-0.0657] (Figure 5.38). This result
indicates that there was no statistically significant difference between the two experimental
lenses with respect to the logCS scores achieved with each contact lens as stipulated by the H0.
Due to the indication of a differential carryover effect in the analysis of the period sums of both
groups, the study protocol required a treatment effect analysis by an independent samples t-test

168
comparing the logCS mean of the four CPDs scores of the two contact lens types in the two
groups in period 1only (without the crossover scores), as performed in a parallel group RCT.
This means comparison also supported the H0, as it showed no statistically significant
difference between the logCS mean scores of the two lens types (p=0.070), t(30)=-1.881,
df=28, 95% CI [-0.20739 - 0.00884]. The SRGPcl exhibited a higher mean logCS score
[Mean=1.5624, SD ±0.5127] than the CRGPcl [Mean=1.4631, SD ±0.13181], a difference of
0.10 logCS, which is less than the smallest; 0.15 logCS score increment.
Figure 5.38 Average OD/OS logCS mean of all CPDs distribution CRGPcl ~vs~ SRGPcl
The logCS scores at 6 CPD are of interest because normative data suggests that the highest
scores are achieved at 6 CPD compared with the other three, because it represents visual
detail of a relatively large size: x2 and x3 larger than 12 and 18 CPD respectively and

169
because the score difference between the two experimental lenses of the research population
was largest at 6 CPD (Figure 5.31b). It was therefore decided to compare by an independent
samples t-test, the means of the period differences of the average OD/OS logCS scores at 6
CPD in the two randomised groups (Table 5.33, Appendix V. G). Group 1 [Mean=-0.0285,
SD ±0.1579] and group 2 [Mean=0.0641, SD ± 0.1431], showed that the higher levels of
logCS at 6 CPD achieved with CRGPcl in both groups did not reach statistical significance: t
(30) = -1.68, df =28, d = -0.435, (p = 0.104), 95% CI [-0.2055 – 0.0203]. This therefore
indicates that there was no statistically significant difference in the performance of the two
experimental lenses, supporting the H0.
Due to the indication of a differential carryover effect in the analysis of the period sums of both
groups, the study protocol required a treatment effect analysis by an independent samples t-test
comparing the logCS mean of 6 CPD scores of the two contact lens types in the two groups in
period 1only, as performed in a parallel group RCT. This means comparison also showed no
statistically significant difference between the two lens types with respect to the logCS mean
scores at 6 CPD, supporting the H0. The higher scores of SRGPcl [Mean=1.84, SD ±0.16]
compared with CRGPcl [Mean=1.75, SD ±0.17] in period 1 did not reach statistical
significance: t (30) =-1.651, df=28, d=-0.435, (p=0.110), 95% CI [-0.2069–0.0222].
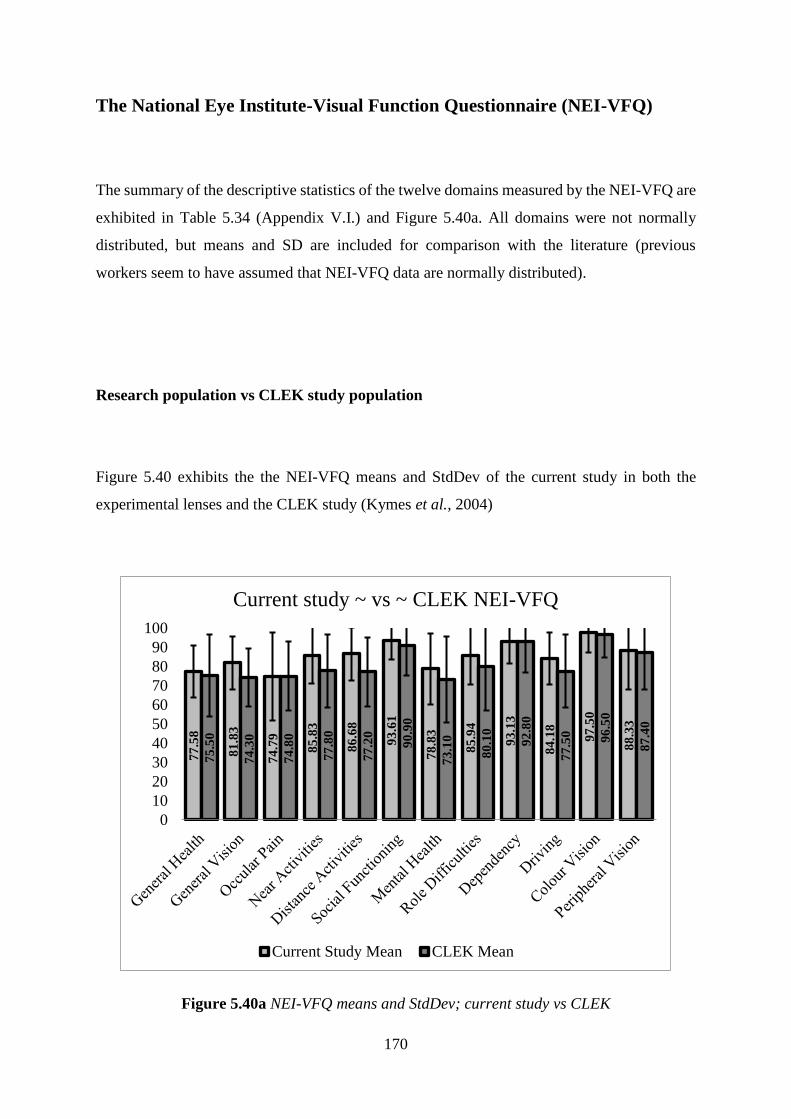
170
The National Eye Institute-Visual Function Questionnaire (NEI-VFQ)
The summary of the descriptive statistics of the twelve domains measured by the NEI-VFQ are
exhibited in Table 5.34 (Appendix V.I.) and Figure 5.40a. All domains were not normally
distributed, but means and SD are included for comparison with the literature (previous
workers seem to have assumed that NEI-VFQ data are normally distributed).
Research population vs CLEK study population
Figure 5.40 exhibits the the NEI-VFQ means and StdDev of the current study in both the
experimental lenses and the CLEK study (Kymes et al., 2004)
Figure 5.40a NEI-VFQ means and StdDev; current study vs CLEK
77
.58
81
.83
74
.79
85
.83
86
.68
93
.61
78
.83
85
.94
93
.13
84
.18
97
.50
88
.33
75
.50
74
.30
74
.80
77
.80
77
.20
90
.90
73
.10
80
.10
92
.80
77
.50 96
.50
87
.40
0
10
20
30
40
50
60
70
80
90
100
Current study ~ vs ~ CLEK NEI-VFQ
Current Study Mean CLEK Mean

171
Figure 5.40b NEI-VFQ current study vsNormative CRGPcl wearers Walline et al., (2000)
(Kymes et al., 2004)
CRGPcl vs SRGPcl
The means and standard deviations of the mean scores of the NEI-VFQ 12 domains for CRGPcl
vs SRGPcl for the whole research population are shown in Figure 5.41a. The NEI-VFQ scores
were not normally distributed, Shapiro-Wilk (p=<0.0001) and (p=0.014) for CRGPcl and
SRGPcl respectively, the medians and IQRs of all 12 domains in CRGPcl and SRGPcl were
[Median=89.53, IQR=17.38], [Median=88.35, IQR=14.04] respectively (Figure 5.41b).
84
.4 88
85
.4 94
.2
94
.7 99
.7
92
.1
95
.1
99
.7
91
.3 99
.6
98
.3
79
.59
82
.45
77
.55
87
.84
87
.96
94
.56
82
.25
87
.88
95
.54
84
.18 97
.96
91
.84
0
10
20
30
40
50
60
70
80
90
100
Normative CRGPcl ~ vs ~ Research population
Normative data Walline et al., (2000) Research population

172
a.
b.
Figure 5.41. a NEI-VFQ 12 domains means and StdDev, CRGPcl vs SRGPcl. b. Boxplots
CRGPcl vs SRGPcl.
78
.25
83
.50
75
.83
85
.97
87
.25
93
.89
80
.83
87
.29
95
.21
83
.67 98
.33
89
.17
77
.50
80
.36
74
.55
85
.71
86
.31
93
.45
77
.14
85
.04
90
.85
84
.85
96
.43
88
.39
0
10
20
30
40
50
60
70
80
90
100
CRGPcl ~ vs ~ SRGPcl across all domains NEI-VFQ
Means CRGPcl Means SRGPcl

173
NEI-VFQ group 1 vs group 2
The means and standard deviations of the scores of the NEI-VFQ 12 domains of group 1 vs
group 2 are exhibited in Figure 5.42.
Figure 5.42. NEI-VFQ 12 domains group 1 vs group 2 with means and standard deviations
82
.31
81
.73
80
.29
89
.58
89
.74
93
.91
81
.73
86
.54
92
.31
85
.61 97
.12
91
.35
74
.30
82
.19
71
.09 82
.81
84
.40
93
.49
76
.88
85
.94
93
.75
83
.00 9
7.6
6
86
.72
0
10
20
30
40
50
60
70
80
90
100
Group 1 ~ vs ~ Group 2 all Domains NEI-VFQ
Means Group1 Means Group 2

174
Carryover and treatment effects
The mean scores of the 12 domains of NEI-VFQ of groups 1 and 2 in periods 1 and 2, as well
as the period sums and differences for the purpose of calculation of period and treatment effects
are exhibited in Table 5.35 (Appendix V B).
The comparison of the period sums between group 1 (Median=182.0, IQR=20.23) and group
2 (Median= 178.1, IQR=32.97) by Mann-Witney U test, indicated that there was no statistically
significant difference between the two groups; U=82.0, (p=0.245) [z=-1.193] (Table 5.36a, b).
Table 5.36 Statistics of Sum of periods, carryover effect.
Sum P1P2
Group N Mean Rank Sum of Ranks
Group 1 (AB) 13 17.69 230
Group 2 (BA) 17 13.82 235
Total 30 a.
Test Statistics Sum P1P2
Mann-Whitney U 82
Wilcoxon W 235
Z -1.193
Exact Sig. [2(1-tailed Sig.) 0.245
b.
This indicates that there was no evidence for a carryover effect with respect to visual quality
of life levels measured by the NEI-VFQ.
To calculate the period effect as recommended by Wellek and Blettner (2012) and Jones and
Kenward (2015), the crossover period differences [Crossover Δ (A-B), Tables 5.35] of the NEI-
VFQ scores were compared between the two randomised groups. The crossover period
differences were normally distributed, Shapiro-Wilk (p=0.442) and (p=0.082) group 1 and 2
respectively. An independent samples t-test means comparison of the period crossover
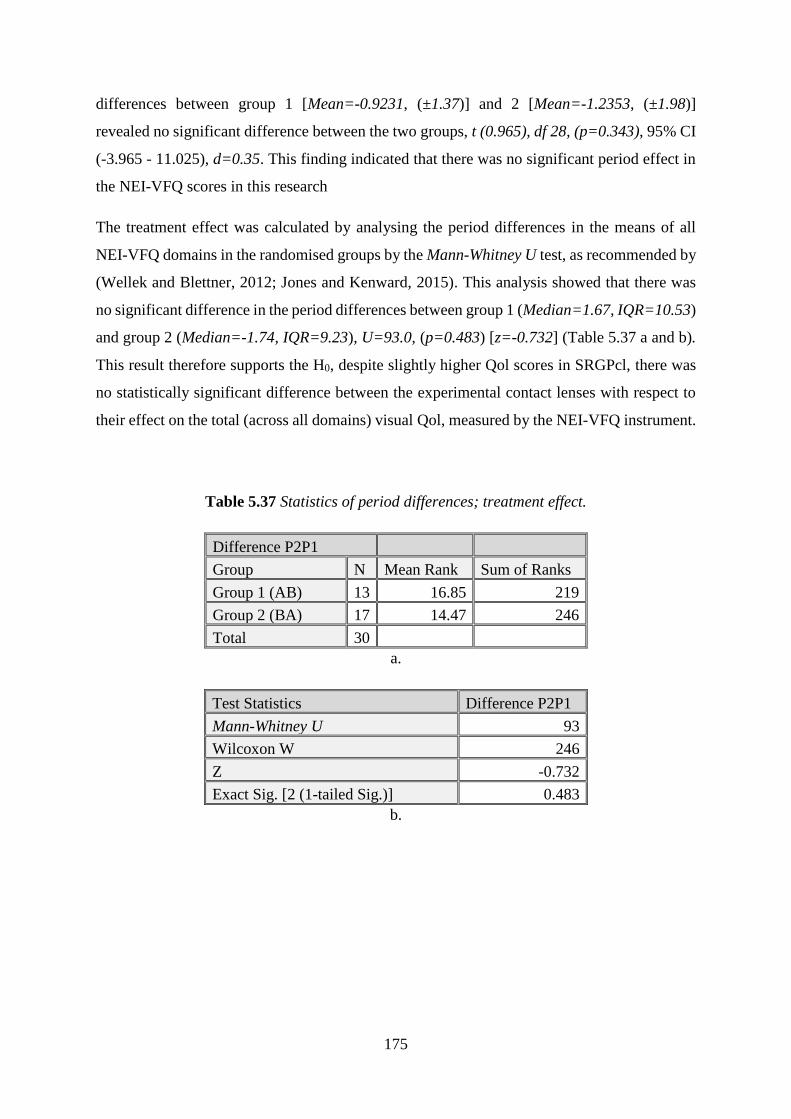
175
differences between group 1 [Mean=-0.9231, (±1.37)] and 2 [Mean=-1.2353, (±1.98)]
revealed no significant difference between the two groups, t (0.965), df 28, (p=0.343), 95% CI
(-3.965 - 11.025), d=0.35. This finding indicated that there was no significant period effect in
the NEI-VFQ scores in this research
The treatment effect was calculated by analysing the period differences in the means of all
NEI-VFQ domains in the randomised groups by the Mann-Whitney U test, as recommended by
(Wellek and Blettner, 2012; Jones and Kenward, 2015). This analysis showed that there was
no significant difference in the period differences between group 1 (Median=1.67, IQR=10.53)
and group 2 (Median=-1.74, IQR=9.23), U=93.0, (p=0.483) [z=-0.732] (Table 5.37 a and b).
This result therefore supports the H0, despite slightly higher Qol scores in SRGPcl, there was
no statistically significant difference between the experimental contact lenses with respect to
their effect on the total (across all domains) visual Qol, measured by the NEI-VFQ instrument.
Table 5.37 Statistics of period differences; treatment effect.
Difference P2P1
Group N Mean Rank Sum of Ranks
Group 1 (AB) 13 16.85 219
Group 2 (BA) 17 14.47 246
Total 30 a.
Test Statistics Difference P2P1
Mann-Whitney U 93
Wilcoxon W 246
Z -0.732
Exact Sig. [2 (1-tailed Sig.)] 0.483
b.
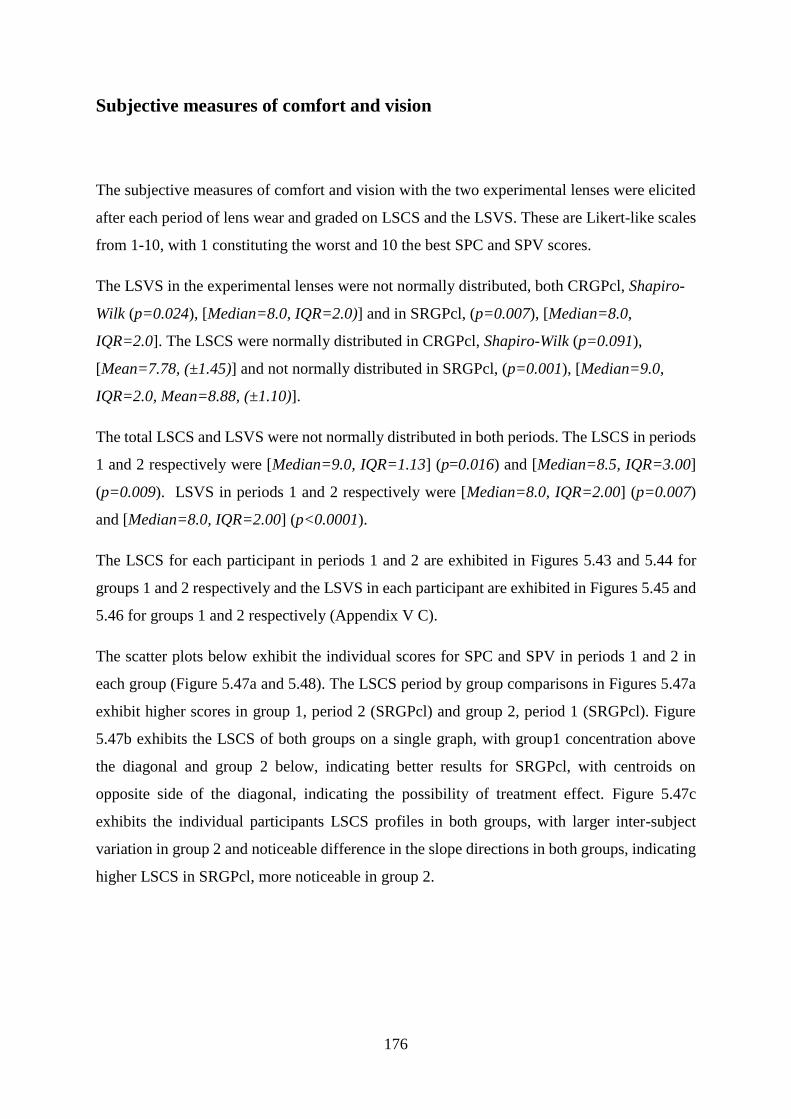
176
Subjective measures of comfort and vision
The subjective measures of comfort and vision with the two experimental lenses were elicited
after each period of lens wear and graded on LSCS and the LSVS. These are Likert-like scales
from 1-10, with 1 constituting the worst and 10 the best SPC and SPV scores.
The LSVS in the experimental lenses were not normally distributed, both CRGPcl, Shapiro-
Wilk (p=0.024), [Median=8.0, IQR=2.0)] and in SRGPcl, (p=0.007), [Median=8.0,
IQR=2.0]. The LSCS were normally distributed in CRGPcl, Shapiro-Wilk (p=0.091),
[Mean=7.78, (±1.45)] and not normally distributed in SRGPcl, (p=0.001), [Median=9.0,
IQR=2.0, Mean=8.88, (±1.10)].
The total LSCS and LSVS were not normally distributed in both periods. The LSCS in periods
1 and 2 respectively were [Median=9.0, IQR=1.13] (p=0.016) and [Median=8.5, IQR=3.00]
(p=0.009). LSVS in periods 1 and 2 respectively were [Median=8.0, IQR=2.00] (p=0.007)
and [Median=8.0, IQR=2.00] (p<0.0001).
The LSCS for each participant in periods 1 and 2 are exhibited in Figures 5.43 and 5.44 for
groups 1 and 2 respectively and the LSVS in each participant are exhibited in Figures 5.45 and
5.46 for groups 1 and 2 respectively (Appendix V C).
The scatter plots below exhibit the individual scores for SPC and SPV in periods 1 and 2 in
each group (Figure 5.47a and 5.48). The LSCS period by group comparisons in Figures 5.47a
exhibit higher scores in group 1, period 2 (SRGPcl) and group 2, period 1 (SRGPcl). Figure
5.47b exhibits the LSCS of both groups on a single graph, with group1 concentration above
the diagonal and group 2 below, indicating better results for SRGPcl, with centroids on
opposite side of the diagonal, indicating the possibility of treatment effect. Figure 5.47c
exhibits the individual participants LSCS profiles in both groups, with larger inter-subject
variation in group 2 and noticeable difference in the slope directions in both groups, indicating
higher LSCS in SRGPcl, more noticeable in group 2.
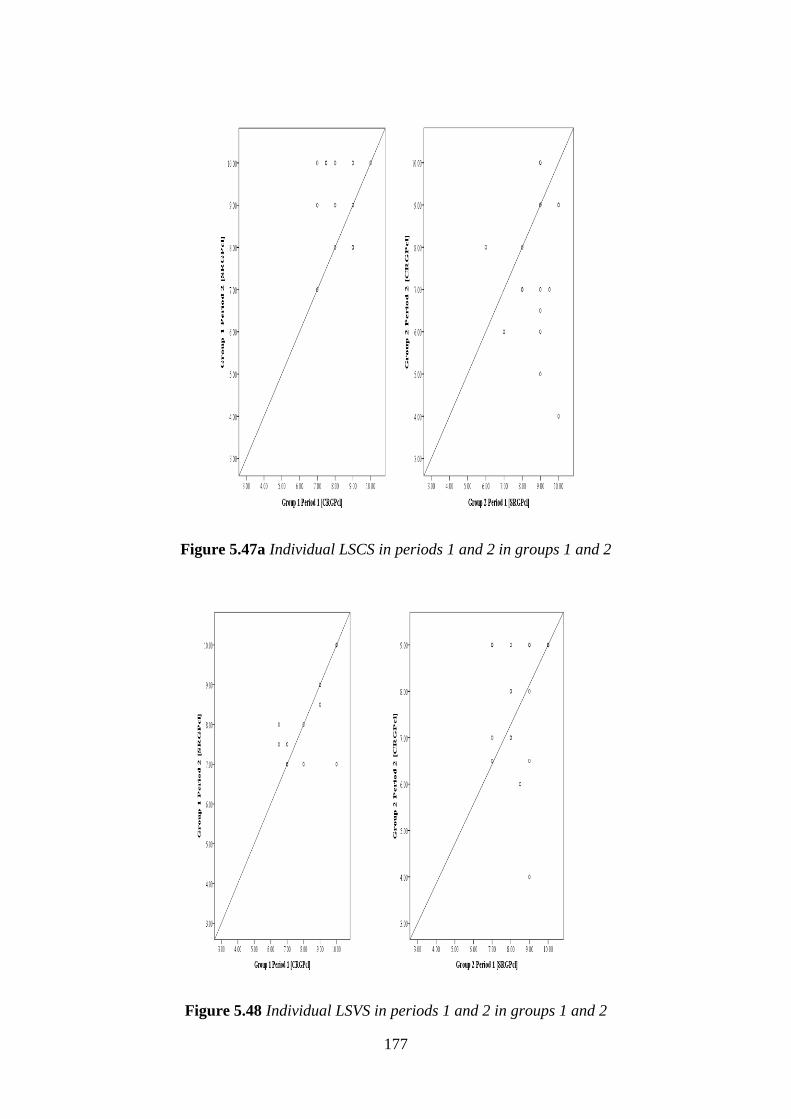
177
Figure 5.47a Individual LSCS in periods 1 and 2 in groups 1 and 2
Figure 5.48 Individual LSVS in periods 1 and 2 in groups 1 and 2

178
Figure 5.47b. LSCS both groups with centroids
Figure 5.47c. LSCS individual profiles groups 1 and 2

179
To calculate the likelihood of a period carryover effect and the treatment effect, the scores for
the SPC and SPV as well as the sums of periods and period differences of these scores for each
participant were calculated and are exhibited in Tables 5.38 and 5.39.
Table 5.38 LSCS by period and sums and differences of periods in both groups
Comfort Quality
Group 1 Group 2
SN P1 P2 P1+P2 P2-P1 A-B SN P1 P2 P1+P2 P2-P1 A-B
1.0 8.0 9.0 17.0 1.0 -1.0 3.0 9.0 7.0 16.0 -2.0 -2.0
2.0 8.0 8.0 16.0 0.0 0.0 4.0 6.0 8.0 14.0 2.0 2.0
5.0 9.0 8.0 17.0 -1.0 1.0 6.0 10.0 4.0 14.0 -6.0 -6.0
7.0 7.0 7.0 14.0 0.0 0.0 8.0 10.0 9.0 19.0 -1.0 -1.0
10.0 7.5 10.0 17.5 2.5 -2.5 9.0 9.0 5.0 14.0 -4.0 -4.0
11.0 8.0 10.0 18.0 2.0 -2.0 12.0 8.0 7.0 15.0 -1.0 -1.0
13.0 9.0 9.0 18.0 0.0 0.0 15.0 9.0 9.0 18.0 0.0 0.0
14.0 9.0 8.0 17.0 -1.0 1.0 16.0 9.0 6.5 15.5 -2.5 -2.5
20.0 7.0 10.0 17.0 3.0 -3.0 17.0 9.0 10.0 19.0 1.0 1.0
23.0 7.5 10.0 17.5 2.5 -2.5 19.0 9.0 10.0 19.0 1.0 1.0
28.0 7.0 9.0 16.0 2.0 -2.0 21.0 9.0 6.0 15.0 -3.0 -3.0
31.0 9.0 10.0 19.0 1.0 -1.0 24.0 8.0 8.0 16.0 0.0 0.0
33.0 10.0 10.0 20.0 0.0 0.0 26.0 7.0 6.0 13.0 -1.0 -1.0
27.0 8.0 7.0 15.0 -1.0 -1.0
30.0 10.0 9.0 19.0 -1.0 -1.0
32.0 9.5 7.0 16.5 -2.5 -2.5
34.0 9.0 9.0 18.0 0.0 0.0
Table 5.39 LSVS by period and sums and differences of periods in both groups.
Vision Quality
Group 1 Group 2
SN P1 P2 P1+P2 P2-P1 A-B SN P1 P2 P1+P2 P2-P1 A-B
1.0 10.0 7.0 17.0 -3.0 3.0 3.0 8.0 -8.0 0.0 -16.0 -16.0
2.0 8.0 8.0 16.0 0.0 0.0 4.0 7.0 7.0 14.0 0.0 0.0
5.0 8.0 7.0 15.0 -1.0 1.0 6.0 7.0 9.0 16.0 2.0 2.0
7.0 7.0 7.5 14.5 0.5 -0.5 8.0 9.0 9.0 18.0 0.0 0.0
10.0 9.0 9.0 18.0 0.0 0.0 9.0 8.5 6.0 14.5 -2.5 -2.5
11.0 6.5 8.0 14.5 1.5 -1.5 12.0 8.0 7.0 15.0 -1.0 -1.0
13.0 10.0 10.0 20.0 0.0 0.0 15.0 9.0 4.0 13.0 -5.0 -5.0
14.0 7.0 7.0 14.0 0.0 0.0 16.0 9.0 6.5 15.5 -2.5 -2.5
20.0 10.0 10.0 20.0 0.0 0.0 17.0 9.0 9.0 18.0 0.0 0.0

180
23.0 7.0 7.0 14.0 0.0 0.0 19.0 8.0 9.0 17.0 1.0 1.0
28.0 10.0 10.0 20.0 0.0 0.0 21.0 10.0 9.0 19.0 -1.0 -1.0
31.0 9.0 8.5 17.5 -0.5 0.5 24.0 7.0 9.0 16.0 2.0 2.0
33.0 6.5 7.5 14.0 1.0 -1.0 26.0 8.0 8.0 16.0 0.0 0.0
27.0 8.0 8.0 16.0 0.0 0.0
30.0 10.0 9.0 19.0 -1.0 -1.0
32.0 9.0 8.0 17.0 -1.0 -1.0
34.0 7.0 6.5 13.5 -0.5 -0.5
Subjective perception of comfort and vision carryover and period effects
The analyses to establish the presence of period and differential carryover effects were
performed as recommended by Wellek and Blettner (2012) and Jones and Kenward (2015), by
the comparison of the LSCS period sums between group 1 (Median=17.0, IQR=1.50) and
group 2 (Median=16.0, IQR=4). A Mann-Witney U test indicated that with respect to SPC
there was no statistically significant difference between the two groups; U=78.5, (p=0.183)
[z=-1.349].
With respect to LSVS the comparison of the period sums between group 1 (Median=16.0,
IQR=4.75) and group 2 (Median=16.0, IQR=3.25) by Mann-Witney U test, indicated that with
respect to SPV there was no statistically significant difference between the two groups;
U=97.0, (p=0.592) [z=-0.568].
This indicates that there is no evidence for the presence of a differential carryover effect with
respect to the scores of these outcomes.
To calculate the period effect as recommended by Wellek and Blettner (2012) and Jones and
Kenward (2015), the crossover period differences [Crossover Δ (A-B), Tables 5.38, 5.39] of
the subjective comfort and vision scores were compared between the two randomised groups.
The crossover period differences of the LSCS were normally distributed, Shapiro-Wilk
(p=0.204) and (p=0.526) group 1 and 2 respectively. An independent samples t-test means
comparison of the period crossover differences between group 1 [Mean=-0.9231, (±1.37)] and

181
2 [Mean=-1.2353, (±1.98)] revealed no significant difference between the two groups, t
(0.486), df 28, (p=0.630), 95% CI (-1.003 - 1.627), d=0.18. This finding indicated that there
was no significant period effect in the LSCS in this research.
The crossover period differences of the vision scores were not-normally distributed, Shapiro-
Wilk (p=0.009) and (p=0.000) group 1 and 2 respectively. A Man-Whitney U test comparison
of the period crossover differences in subjective vision scores between group 1 [Median=0.00,
IQR=0.50] and 2 [Median=-0.50, IQR=1.75)] revealed no significant difference between the
two groups, U=76.500, (p=0.157). This finding indicated that there was no significant period
effect in the SPV scores in this research.
Subjective comfort and vision treatment effect
The comparison of the two groups with respect to the treatment effect was performed as
recommended by (Wellek and Blettner, 2012; Jones and Kenward, 2015) by the analysis of the
difference in the period scores of the two randomised groups. This was performed by the Mann-
Whitney U test, which revealed that with respect to subjective comfort, the period difference in
group 1 (Median=1.0, IQR=2.25) and the period difference in group 2 (Median=-1.0,
IQR=2.50), were significantly different, (p=0.002) [z=-2.993], U=40.0. This result rejects the
H0 and indicates that the higher subjective comfort score achieved with SRGPcl was
statistically significant (Figure 5.49a).

182
Figure 5.49a. Boxplots of subjective comfort scores in CRGPcl and SRGPcl
With respect to the subjective vision score, the comparison of the score differences in the two
periods in group 1 (Median=0.0, IQR=0.50) and group 2 (Median=-0.5, IQR=1.75), by Mann-
Whitney U test indicates that there was no significant difference, (p=0.213) [z=-1.301],
U=80.50. This result therefore supports the H0 with respect to the subjective perception of the
participant’s quality of vision (Figure 5.49b).
Figure 5.49b. Boxplots of subjective vision scores in CRGPcl and SRGPcl

183
NEI-VFQ ocular pain domain
Due to the statistically significant difference between the two experimental lenses in the SPC,
an analysis of the period and treatment effects of the NEI-VFQ ocular pain domain was
performed. The only normally distributed scores in this domain were of group 1 period 1;
Shapiro-Wilk (p=0.095), the rest of the scores were not normally distributed; (p=0.019, 0.005
and 0.034) in Group 1 period 2, group 2 period 1 and period 2 respectively.
The analyses of the two groups with respect to period carryover and treatment effects were
performed as recommended by (Wellek and Blettner, 2012; Jones and Kenward, 2015). The
Mann-Whitney U analysis of the period sums of group 1 (Median=175.0, IQR=56.25) and
group 2 (Median=150.0, IQR=75.0) indicated that here was no differential carryover effect
(p=0.263), [z=-1.141] U=83.50. The crossover differences were normally distributed in group
2 (p=0.015) and not normally in group 1 (p=0.467). The Mann-Whitney U analysis of the
crossover differences of group 1 (Median=0.02, IQR=0.21) and group 2 (Median=0.04,
IQR=0.16) indicated that there was no significant period effect (p=0.563).
The treatment effect analysis by Mann-Whitney U test of the period differences of group 1
(Median=12.5, IQR=37.5) and group 2 (Median=0.00, IQR=25.0), indicated that the better
ocular pain scores with SRGPcl in group 1, did not reach statistical significance (p=0.170)
[z=-1.423], U=77.00, which supports the H0.
Final lens choice
At the end of the second experimental sequence participants were asked to choose either
CRGPcl or SRGPcl as their habitual contact lens. Fourteen (46.7%) participants chose SRGPcl
and 16 (53.3%) chose CRGPcl as their preferred habitual lens.
The only statistically significant outcome in this experiment was the better SPC in SRGPcl
compared to CRGPcl, which was supported by the better scores in the ocular pain domain of
the NEI-VFQ (statistical significance not reached). Therefore, it was decided to determine

184
whether there is a significant correlation between the scores of SPC in the experimental lenses
and final lens choice.
The participants’ SPC and SPV in the experimental CRGPcl and the final lens choice are
presented in table 5.40 (Appendix V D).
The LSCS approximated a normal distribution Shapiro-Wilk (p=0.091), with a mean of 7.78
(±1.45), range of 6.0 [4.0 – 10], 95 CI for mean 7.24–8.33 (Figure 5.51).
Figure 5.51. Distribution of the scores of SPC in experimental CRGPcl
The LSCS in CRGPcl means / medians and SD / IQR for the participants who selected CRGPcl
and SRGPcl were 8.44 (±1.03) / 9.00 (1.75) and 7.04 (±1.54) / 7.00 (1.54) respectively, with
non-normal distribution of the scores of CRGPcl selectors and normal distribution of scores of
SRGPcl selectors, Shapiro-Wilk (p=0.019) and (p=0.980) respectively. A means comparison
between the subjective comfort scores (Table 5.41) of those participants who selected CRGPcl

185
and SRGPcl as their habitual lenses, was performed by the independent samples t-test, due to
the non-significant variance between the scores [Levene’s test for equality (p=0.426)].
Due to the not-normal distribution of the SPC scores of the 16 participants who selected
CRGPcl an additional analysis was performed by the non-parametric Mann-Whitney U test, to
confirm agreement between the parametric and non-parametric analyses regarding this
important outcome (Figure 5.52).
Table 5.41 Mean, median, StdDev and IQR scores of subjective comfort for final lens choice
Final Lens choice CRGPcl SRGPcl
Comfort in CRGPcl mean and (StdDev) 8.44 (±1.03) 7.04 (±1.54)
Comfort in CRGPcl median and (IQR) 9.00 (1.75) 7.00 (2.00)
Figure 5.52 Subjective comfort scores in CRGPcl in participants who chose CRGPcl and
SRGPcl

186
Both these analyses showed a significant difference in the CRGPcl SPC scores between the
participants who chose CRGPcl and those who chose SRGPcl; t=2.967, (df=28), (p=0.006),
d=1.086, 95% CI [0.434-2.37]. Mann-Whitney U test: (p=0.009), (z=-2.605), U=50.5,
Wilcoxon W=155.5.
The expected better LSCS in SRGPcl in participants who chose SRGPcl [Median=9.750,
IQR=1.3] compared to participants who chose CRGPcl [Median=9.00, IQR=1.0], did not
reach statistical significance regarding the LSCS difference (p=0.052).
These results indicate that the subjective score of perceived comfort in the experimental
CRGPcl was significantly lower in the participants who selected SRGPcl [Mean=7.04,
(±1.54)] than those who selected CRGPcl [Mean=8.44, (±1.03)], (p=0.006) and (p=0.009) by
independent samples t-test and Mann-Whitney U test respectively, thus rejecting the H0. It is
of note that no participant who selected to remain in CRGPcl scored their SPC lower than 7.0.
Despite the absence of statistically significant carryover effect in the subjective comfort, it was
decided to explore whether the sequence of contact lens wear had an effect on the subjective
comfort in CRGPcl. Such an effect could for example occur in group 2, after wearing the first
sequence SRGPcl. It is possible that some loss of tolerance to CRGPcl could occur, which may
have contributed to the lower score in the washout period and sequence 2, when the habitual
and experimental CRGPcl were worn.
Group 1 [Mean=8.15, (±0.97)] and group 2 [Mean=7.5, (±1.71)] were normally distributed
with respect to subjective comfort scores in the experimental CRGPcl, Shapiro-Wilk (p=0.139)
and (p=0.481) respectively. An independent samples t-test comparison of means exhibited no
statistically significant difference in the subjective score of comfort of the two groups: t=1.322,
(df= 26), (p=0.198), d= 0.454, 95% CI [-0.363 – 1.670]. This result indicates that the sequence
of wear did not have a significant effect on the subjective score of comfort reported by the
participants in two randomised groups.
A χ2 analysis was performed to also establish whether the sequence of lens wear had any effect
on the final lens choice for the same reason as stipulated regarding the subjective comfort
scores. The results of this analysis (Table 5.42) indicate that there was no significant difference
between the participants in the 2 groups in their choice of preferred habitual lens χ2=0.475,
(n=30), (p=0.713).

187
Table 5.42 χ2 analysis of final lens choice by randomised groups
Final lens choice
Group CRGPcl SRGPcl Total
Group 1 (AB) Count of participants 6 7 13
% within group 46.20% 53.80% 100.00%
% within final lens choice 37.50% 50.00% 43.30%
Group 2 (BA) Count of participants 10 7 17
% within group 58.80% 41.20% 100.00%
% within final lens choice 62.50% 50.00% 56.70%
Total Count 16 14 30
% within group 53.30% 46.70% 100.00%
% within final lens choice 100.00% 100.00% 100.00%
188
Chapter 6: Discussion
In this RCT with a 2x2 crossover, 34 participants entered the study and 17 participants were
randomised to each of the 2 experimental groups. The participants randomised to group 1
(sequence AB), started with CRGPcl (lens A) in period 1 and after completing period 1 and a
1-month washout period, crossed over to wear SRGPcl (lens B) in period 2 (Figure 4.1).
Participants in group 2 (sequence BA), started with SRGPcl (lens B) in period 1 and after
completing period 1 and a 1-month washout period, crossed over to wear CRGPcl in period 2
(lens A). All 17 participants in group 2 completed their participation, whereas in group 1,
thirteen participants completed the study (see limitations) (Figure 5.1). Data collected from 56
eyes of the 30 participants who completed this research were analysed, with right and left eye
data averaged for participants who wore lenses in both eyes. The inclusion of 4 participants
who were fitted in one eye only, was considered appropriate representation of the population
in the clinic, as keratoconus is a bilateral disease (Gomes et al., 2015) and patients may present
for contact lens management with significant asymmetry between the two eyes (Zadnik et al.,
2002).
Descriptive statistics of the study population
Gender
Epidemiological studies regarding keratoconus gender preponderance are inconclusive, with
reported female dominance of 53% (Jonas et al., 2009), 65% (Amsler, 1961) and 66%
(Hammerstein, 1972) and reported male dominance of 62% (Ertan and Muftuoglu, 2008),
53% (Fatima et al., 2010), 57% (Pouliquen et al., 1981) and 59% (Owens and Gamble,
2003). Others have demonstrated no significant gender differences (Kennedy et al., 1986).

189
The overall consensus appears to be that keratoconus has similar prevalence in both genders
(Ramez et al., 2017).
The progression of keratoconus in the CLEK study was found to be equivalent in both genders;
however, gender differences were found in patient history, vision and ocular symptoms (Fink
et al., 2010). Women were older, more likely to report symptoms of dryness, reported less
hours per day of contact lens wear and more hours of near work and scored significantly lower
with respect to driving (p<0.0001), distance activities (p=0.0001) and general health (p=0.003)
domains of the NEI-VFQ (Fink et al., 2010).
The male population in this research, n=23 (77%) outnumbered the female population n=7
(23%), 3:1. This ratio is different to the expected 1:1 gender ratio of individuals affected by
keratoconus (Feder and Gan, 2011; Ramez et al., 2017). The reason for this discrepancy is
unclear.
Gender ages
The 10-year age difference between the genders, male (Median=34.0) and female
(Median=45) (Table 5.2, Figure 5.3) was significant: Mann-Whitney U (p=0.010), with older
females, as found by (Fink et al., 2010).
The gender numbers and age imbalance in this research may be important, because female
gender, estrogen therapy in postmenopausal women, androgen deficiency and older age are all
risk factors in dry eye disease (DED) (Stapleton et al., 2015). Dry eye symptoms, especially in
DED have a detrimental effect on contact lens tolerance, and SRGPcl may be indicated to
alleviate these symptoms and increase contact lens tolerance in patients with keratoconus
(Visser et al., 2016). This could bias the female participants to choose SRGPcl over CRGPcl
due to improved comfort, which may increase the scores of the SPC and the scores of the NEI-
VFQ. This potential bias however, may have been minimised in this study by the relatively
small number of female participants and by the fact that at the time of enrolment all participants
were successful CRGPcl wearers and were therefore unlikely to suffer significantly from DED.
The crossover study design is another important aspect which minimises bias due to inter-
subject variability, as each participant acts as his or her own control.

190
Age and age at diagnosis (AAD)
Keratoconus is a disease with a typical onset at adolescence and young adulthood (Feder and
Gan, 2011), with some delay between onset and time of diagnosis and management with
RGPcl. Keratoconus is typically diagnosed between the ages of 20 and 30 years (Galvis et al.,
2015) and rarely after age 35 (Krachmer et al., 1984). The age of the research population
[Median=36.0, IQR=16.0, Mean=39.1 (±11.5)] was not normally distributed (p=0.039), due
to skewness towards younger age [0.8 (SE 0.4)] normally found in individuals with keratoconus
(Feder and Gan, 2011; Ramez et al., 2017).
It has been hypothesised that the surprisingly low numbers of patients diagnosed with
keratoconus over the age of 50 years, given the chronic nature of this disorder (Gordon-Shaag
et al., 2015), may be due to association of keratoconus with such conditions as mitral valve
prolapse (Beardsley and Foulks, 1982), obesity, obstructive sleep apnoea (Pihlblad and
Schaefer, 2013) and Down syndrome, although the mortality rate in individuals with
keratoconus is similar to that of the general population (Moodaley et al., 1994). The reason for
this is therefore unclear, but could in my opinion be because significant keratoconus is
diagnosed early in life and if keratoconus remains insignificant, it is unlikely to progress and
therefore unlikely to be diagnosed later in life.
The non-normal distribution of the AAD of the research population (Figure 5.4), is most likely
due to the significant positive skewness (1.1, SE 0.4), with 80% of participants diagnosed
before age 30, as expected in a population affected by keratoconus (Krachmer et al., 1984).
The female AAD was normally distributed, the male AAD featured positive skewness and
kurtosis and had a non-normal distribution (Table 5.4). The research population did not exhibit
a statistically significant difference between the genders in the AAD (Figure 5.5), Mann-
Whitney U (p=0.190), which is consistent with the impression that keratoconus exhibits no
clear gender preponderance (Alio, 2017; Fink et al., 2010).

191
Participants’ reported duration of CRGPcl wear at enrolment
An essential selection criterion in this study required that all participants were experienced and
successful CRGPcl wearers. The length of CRGPcl wear prior to enrolment was not normally
distributed, with a total range of 43 years, a minimum of 4 and a maximum of 47 years
[Median=14.5, IQR=12, (mean=16.4, ±10)]. There was no statistically significant difference
between the genders in the duration of CRGPcl wear at enrolment (Figure 5.8); Mann-Whitney
U test: (p=0.190).
The duration of contact lens wear may have implications on the visual acuity scores because in
the longitudinal assessment of visual acuity in 925 CLEK subjects over a seven-year period,
high-contrast and low-contrast visual acuity decreased by 10 or more letters (logMAR ≥0.2) in
19.0% and 30.8% of subjects, respectively (Davis et al., 2006). The NEI-VFQ scores also
reduced over a 7 year follow up in all domains except ocular pain and mental health (Kymes
et al., 2008).
Occupation / education
All participants were either employed or in an education programme, with 56% of the
participants having university education (Table 5.7).
Ethnicity
Ethnicity may be an important factor in this research since aspects of keratoconus such as
disease incidence, may vary from 25 cases per 100,000, per year for Asians compared with 3.3
cases per 100,000, per year for Caucasians (p < 0.001) (Georgiou et al., 2004). In the UK

192
keratoconus incidence in Asians Indians vs white Caucasians is respectively: 19.6 vs 4.5 cases
per 100,000 population, per year (Pearson et al., 2000).
Ethnicity also plays a role in the progression and severity of keratoconus; with the Asian Indian
ethnicity presenting at a significantly younger age and progressing to more severe levels than
the Caucasian white population (Georgiou et al., 2004). The 13 Asian Indian participants
constituted 43.3% of all participants and exhibited an earlier mean AAD of 22.5 (±4.5),
compared with the 30% (n=9) of white Caucasian participants, whose mean AAD was 25.2
(±9.9), consistent with Georgiou et al., 2004. The 10% (n=3) black Afro Caribbean
participants, whose AAD was 22.3 (±4.7), were second only to the black African participants
14.7% (n=5) of the sample, who exhibited the earliest mean AAD of 18.8 (±3.4) and who also
featured the oldest mean age of 43.8 (±16.4) years (Tale 5.8, Figures 5.9, 5.10).
The confounding aspects of age, gender and ethnicity were also minimised in this research by
participant randomisation and the crossover research design (Wellek and Blettner, 2012; Jones
and Kenward, 2015).
Corneal characteristics
As noted in the methods section of this thesis, this research was designed to study corneal
ectatic disorders in general, as would typically be encountered in a hospital “keratoconus
clinic”. It was anticipated that the vast majority of participants would have keratoconus because
this is the preeminent ectatic disorder. Other ectatic disorders such as keratoglobus and pellucid
marginal degeneration (PMD) are considered variations of keratoconus. In a pilot for the global
consensus on ectasias, there was a 94% agreement among experts that these are ectatic corneal
disorders and 100% agreed that the only aspects that distinguish between keratoconus, PMD
and keratoglobus were the thinning location and pattern (Ambrósio et al., 2014).
The purpose of the present research was to study a population which is managed with CRGPcl
as a consequence of being affected by corneal ectatic disorders. Analysis revealed that
keratoconus was indeed the main corneal ectatic disorder in the study population affecting 93%

193
(n=54) of the eyes, 2 eyes (1 participant) exhibited PMD. Two eyes had previously undergone
deep lamellar keratoplasty (DLK) [corneal transplant surgery] due to severe keratoconus.
Minor treatments such as collagen crosslinking (CXL) and intra-stromal corneal ring segments
(INTACS) were previously applied to 6 eyes and 2 eyes respectively, more than 1 year prior to
participation in this research (Figure 5.11). Individuals with keratoconus commonly undergo
the various treatments such as CXL to slow down / arrest the disease progression, INTACS to
improve the optical integrity and DLK to replace severely distorted corneae (Bao et al., 2017;
Kılıç et al., 2017; O’Brart, 2017; del Barrio et al., 2017). These treatments were not expected
to materially affect contact lens management of the participants, all of whom were successful
CRGPcl wearers. Although INTACS may be indicated to contact lens intolerant individuals,
they are not contraindicative to contact lens wear, and have even been reported in previous
studies to facilitate contact lens fitting and comfortable wear (Ertan and Colin, 2007; Hladun
and Harris, 2004). Contact lens wear post CXL is indicated for the management of the visual
disability caused by keratoconus (Michaud and Breton, 2018) and significant regular and
irregular astigmatism post keratoplasty may often be best managed with RGPcl (van Dijk et
al., 2014).
Research Population Corneal Metrics
Pathological corneal irregularity was an inclusion criterion in this research. Objective measures
of corneal topography indices confirmed that the research population exhibited pathological
levels of corneal irregularity. The three indices measured are now discussed in turn.
Kmax
Kmax represents the maximum (steepest) corneal radius of curvature, which in keratoconus
would normally exhibit values below 7.03mm (above 48D), significantly steeper [shorter

194
radius of curvature in mm and larger magnitude in dioptres] than the value of 7.85mm (±0.31)
expected in a normal cornea (Sorbara et al., 2010).
Sorbara et al., (2010) analysed the corneae of 40 normal eyes and found corneal curvature to
be normally distributed with a mean radius of 7.85mm (±0.31), 95% CI: 8.70-7.24 mm (Sorbara
et al., 2010). Corneal radius values between 7.03mm (48D) and 6.75mm (50D) are considered
suspect for keratoconus, and values below 6.75mm denote abnormally steep corneal curvature
(Cavas-Martinez et al., 2016; Pinero et al., 2010). The analysis of Kmax in the research
population exhibited a normal distribution (p=0.882), [Mean=6.20mm (±0.6)] (Table 5.9,
Figure 5.12), which is more than 3 standard deviations steeper than the steepest value of the
95% CI of normal corneae found in Sorbara et al., (2010). Means comparison by an
independent sample t-test with the normative data presented in Sorbara et al., (2010) confirmed
that the research population exhibited a statistically significantly steeper radius of curvature
than normal corneae (p<0.0001), with a mean difference of 1.62mm, 95% CI 1.43–1.80mm.
Pachymetry
Corneal ectasiae, such as keratoconus are by definition associated with corneal thinning. Pinero
et al., (2010) evaluated 51 eyes with various degrees of keratoconus and 20 normal eyes, of 29
male and 22 female patients, aged 16-54. Pachymetry readings were progressively lower in
eyes with subclinical, early, or moderate keratoconus compared with the normal mean value of
549.90µm (±28.48) (p<0.01) (Pinero et al., 2010). In the moderate to advanced keratoconus
they found a mean pachymetry value of 457.61µm (±38.77).
The central corneal thickness in the research population (Table 5.10, Figure 5.13) was normally
distributed, (p=0.569) and an independent samples t-test comparison with the mean
pachymetric values reported in Pinero et al., (2010), confirmed that this research population
exhibited significantly thinner values than both the normal; Mean=544.74, ±42.42),
(p<0.0001) and the moderate and advanced keratoconus groups; Mean=475.19, ±48.4
(p=0.020).

195
Surface regularity index (SRI)
SRI describes central corneal optical regularity; it is a measure of the dioptric optical power
differences in 256 equidistant locations in the 4.5mm central corneal area. SRI correlates well
with the measure of BCVA (r=0.80, p<0.001), with normal values below 0.56DS (Wilson et
al., 1991; Cavas-Martinez et al., 2016; Liu and Pflugfelder, 1999). The SRI index in a normal
cornea is expected to be below 0.56DS (Wilson et al., 1991; Cavas-Martinez et al., 2016). Liu
and Pflugfelder (1999) confirmed this assertion in their comparison of the SRI index in 64 eyes
of 33 normal and 42 dry eye subjects (Liu and Pflugfelder, 1999). Burns et al., (2004) analysed
a total of 13 different corneal topographic indices in 73 patients with keratoconus and found
mean SRI indices in the right and left eyes of 1.24 (±0.83) [range 0.10-4.59] and 1.24 (±0.82)
[range 0.02-4.02] respectively (Burns et al., 2004).
The SRI of the research population (Table 5.11 , Figure 5.14) is almost 3 times higher than the
SRI value of 0.56DS expected in normal corneae (Wilson et al., 1991; Cavas-Martinez et al.,
2016; Liu and Pflugfelder, 1999).
Right eye vs left eye corneal metrics
Keratoconus is a bilateral disease (Gomes et al., 2015), with significant asymmetry between
the two eyes (Zadnik et al., 2002), the SRI index difference between the right and left eyes in
the population of this study exhibited no significant difference, Mann-Whitney U (p=0.168).
Independent samples t-test analysis of the means of the right and left eye’s pachymetry and
Kmax values also showed no statistically significant difference between the two eyes, (p=0.481)
and (p=0.119) respectively.
In summary all three corneal indices were consistent with the abnormal indices found in
populations with pathological, ectatic corneal disorders such as keratoconus and were
statistically significantly different to the indices found in populations with normal corneae.
These objective measures of corneal topography parameters confirm the presence of corneal
196
pathology consistent with keratoconus in the research participants and the appropriateness of
the optical management with rigid contact lenses, of the visual disability caused by this
pathology.
Randomisation demographics
Gender
The gender allocation to the two groups did not exhibit gender bias with 2 versus 5 females
and 11 versus 12 males randomised to group 1and 2 respectively (Figure 5.15). The Chi-square
(χ2) goodness of fit analysis confirmed that there was no statistically significant difference
between the two randomised groups with respect to gender allocation (p=0.109).
Age
The age distributions in the two randomised groups (Table 5.14, Figures 5.16 and 5.17) were
normal and the mean ages of 39.82 and 28.12 years in Group 1 and 2 respectively, were not
statistically significantly different when compared by an independent samples t-test,
(p=0.872).
AAD
The research participants’ 95% CI for mean age spanned a substantially larger time period:
30.8-48.1 than that of the 95% CI for mean AAD: 18.3-26.3 (Figures 5.16 and 5.17). This is

197
consistent with the nature of keratoconus, which is normally diagnosed in early life and persists
throughout life (Ramez et al., 2017; Galvis et al., 2015).
Estimated duration of CRGPcl wear at the time of enrolment
The estimated duration of CRGPcl wear at enrolment was not statistically significantly
different between the randomised groups (Mann-Whitney U test p=0.363). This aspect of the
population demographics is important because both visual acuity and quality of life scores may
significantly reduce in a substantial proportion of keratoconic contact lens wearers over a
period of 7 years (Davis et al., 2006; Kymes et al., 2008a). The equivalence of the estimated
duration of CRGPcl wear was therefore unlikely to reduce the validity of the visual and NEI-
VFQ outcomes in this study.
Ethnicity
The race/ethnicity frequency in the two randomised groups exhibited a balanced distribution
(Figure 5.18) and the χ2 goodness of fit test indicated that there was no significant difference
between the two randomised groups with respect to the distribution of ethnicities (p=0.613).
The validity of this analysis however, is sub-optimal because of the small number of
participants: less than 5, in 3 of 4 ethnic groups. The possibility of some bias in the
randomisation groups with respect to ethnicity was considered insignificant due to the
crossover research design, as discussed above.

198
Corneal metrics in the randomised groups
Kmax and SRI did not differ significantly in group 1 and 2 (Figures 5.19a and 5.19b). An
independent samples t-test revealed a significantly thinner mean corneal thickness in group 1
than in group 2 (p=0.019), (Figure 5.20). The actual difference between the means was 37µm,
which is unlikely to be clinically significant, because both groups mean values are higher than
400µm. Estrada et al., (2017) described grading systems of keratoconus, which include more
than one corneal feature for characterizing the disease (Estrada et al., 2017). They reviewed
the anatomical grading system of Amsler-Krumeich and the optical grading of Alio-Shabayek,
both systems stipulate that corneal thickness >400µm is considered as grade II; early to
moderate keratoconus. This indicates that the means of both randomised groups fall into the
same grade category of keratoconus. The more recent visual function-based grading system
developed by Estrada et al., (2017) uses narrower pachymetry bands of 20µm from grade I to
IV and 80µm for the most severe keratoconus grade IV plus, which based on pachymetry alone
may allocate a different grade to group 1 and 2. However, with respect to the other 6 parameters
of this grading system, one of which is corneal radius, the 2 groups are not statistically
significantly different.
The difference in the pachymetry values may suggest that the level of the ectatic disease in
group 1 was somewhat more advanced despite statistical equivalence with respect to the other
2 indices; Kmax and SRI. This possible difference in the severity of keratoconus between the
two groups may be a confounding element in the data analysis of a parallel groups RCT.
However, the crossover RCT design of this research should minimise the effect of this
difference, as each participant performs as his own control with respect to confounding
parameters including disease severity. Furthermore, the selection criterion of good tolerance of
CRGPcl of all participants supports the premise that there was no clinical indication for
refitting with SRGPcl due to disease severity in any of the participants.
The four participants who had one eye fitted were 3 males and 1 female, three fitted eyes were
right and one eye left. Two participants SN 4 and 8 had a corneal transplant in the other eye,
due to severe keratoconus and wore daily SRGPcl and glasses, with intermittent SRGPcl
respectively. The other two, SN 5 and 26 wore CRGPcl and soft disposable lenses respectively.
Randomisation was 1 to group 1 and 3 to group 2, resulting in 25 eyes fitted in group 1 and 31
eyes in group 2.

199
Summary of demographics in the randomised groups
In summary with respect to the effectiveness of randomisation it could be concluded that
overall there were no marked differences in the demographics of the 2 randomised groups and
the randomisation achieved its purpose.
Main outcome measures
Visual acuity, ETDRS logMAR BCVA
It is well established that visual quality may be significantly improved in individuals with
irregular corneal disorders such as keratoconus, with both CRGPcl and SRGPcl compared to
unaided vision, spectacle and regular soft contact lenses corrections. These improvements may
be demonstrated by subjective logMAR scores of improved visual resolution at 100% contrast
and improved contrast sensitivity scores at progressively reduced levels of contrast (Zhou et
al., 2003; Wei et al., 2011; Chaudhary et al., 2017; Visser et al., 2013b; Sabesan et al., 2013;
Picot et al., 2015; Ozek et al., 2018).
LogMAR demographics
The mean and standard deviation of the logMAR scores in CRGPcl and SRGPcl in this study
were similar to the published research used for the sample size calculations. This equivalence
200
confirms the appropriateness of the sample size calculation and the reliability of the logMAR
data collection in this research.
The ETDRS logMAR demographics of the 2 groups are exhibited in Figure 5.21 and Table
5.19. ETDRS logMAR BCVA scores in individuals with keratoconus are expected to show
good repeatability of measurements. Gordon et al., (1998) examined the repeatability of
ETDRS logMAR scores of 134 participants (74.6% CRGPcl wearers) from the CLEK study,
who exhibited a wide range of keratoconus. Good test retest repeatability, especially for same
examiners, was demonstrated in both low and high contrast visual acuities, measured
monocularly and binocularly, with inter-class correlation coefficient range of 0.757-0.853
(Gordon et al., 1998).
Pooling the data obtained from the right and left eyes could, in theory not only increase the
power and significance of a study, but also optimally use the data obtained from the study
population. However, in this research population, the significantly higher correlation of the
logMAR scores of the two eyes from same individuals compared to randomised eyes means
that pooling the data from both eyes as independent samples was inappropriate (table 5.21).
The statistical analyses for the carryover and treatment effects of the visual outcome measures
was therefore performed using the mean scores of the right and left eyes of each participant.
Differential carryover and period effects analyses
In a 2x2 crossover RCT the efficacy of treatments A and B is assessed on the basis of the
comparisons of the within-subject difference between the two treatments with regard to the
outcome variable. The recommended approach (Wellek and Blettner, 2012; Jones and
Kenward, 2015) is to use a standard independent samples t-test for normally distributed data
or a non-parametric equivalent such as the Mann-Whitney U test, using the within-subject
differences between the outcomes in both periods as the raw data (Wellek and Blettner, 2012;
Jones and Kenward, 2015).
Prior to the analysis of the treatment effect, the possibility of a differential carryover and period
effect must be tested for (discussion in the methods chapter). In the current research a carryover

201
effect was considered unlikely because visual acuity, which is the spatial resolving capacity of
the visual system, is limited mainly by optical and neural factors or their combination (Bailey,
2006). The neural factors are subject (eye) specific and are expected to be well controlled by
randomisation, especially with a crossover, which controls for individual idiosyncrasy. The
only significant variables to visual performance in this research are therefore the integrity and
quality of the optical correction at the time of the examination. In a fully developed, adult visual
system, when the quality of the visual correction is sub-optimal visual performance will be
impaired irrespectively of the quality and timescale of previous visual experiences as may be
demonstrated by the blur confirmation test performed during normal refraction. When the
quality of the visual correction at the time of examination is optimised, the visual performance
will be optimised irrespectively of the previous visual experience (Borish and Benjamin, 2006).
Despite this accepted clinical wisdom, to conform to the crossover design analysis, it was
considered prudent to perform the appropriate statistical analysis for a differential carryover
and period effects, prior to performing the analysis of the treatment effect, as recommended in
the literature (Wellek and Blettner, 2012; Jones and Kenward, 2015).
The analysis of a carryover effect should include a pre-test confirmatory analysis, which
consists of comparing the sums of means of the 2 periods for each subject in the two groups /
sequences by means of another appropriate test for independent samples (Wellek and Blettner,
2012; Jones and Kenward, 2015). If this test yields a statistically significant result, the usual
crossover analysis which compares the intra-subject differences of the effects of the two
treatments between the randomised groups, should not be applied and the analysis should be
performed as in a parallel study using the data from the first period only, in each randomised
group (Wellek and Blettner, 2012).
A preliminary assessment was performed on the logMAR data as soon as the first 12
participants completed the study. An independent sample t-test comparing the sums of the
logMAR period scores revealed no significant difference, (p=0.056), which indicated an
absence of a significant carry over effect. At the end of the study, a similar analysis of the full
dataset (Table 5.23a and 5.23b), also revealed no statistically significant difference between
the period sums of the two randomised groups, (p=0.281) (Table 5.24). This result indicates
that there was no evidence for a carryover effect and enables the utilisation of the full crossover
data in the analysis for treatment effect on visual performance measured by the ETDRS
logMAR.

202
The period effect was also considered unlikely due to the relatively short period of the research.
Period effect was calculated by an independent samples t-test means comparison of the period
crossover differences (A-B) between the randomised groups (Tables 5.23 a and b), this finding
indicated that there was no significant period effect in the logMAR scores in this research
(p=0.541).
Treatment effect, ETDRS logMAR
The objective of a crossover trial is to determine whether within-subject treatment effect
differences exist. This may be achieved by the comparison of the within participant score
differences in periods 1 and 2, between the two randomised groups (Wellek and Blettner, 2012;
Jones and Kenward, 2015).
The summary table of the period means of the mean OD/OS logMAR scores in the two groups
(Table 5.22) and the box plots of group by period logMAR scores (Figure 5.23) illustrate the
similarity in the means of the scores and the differences in the interquartile range and total
range in the two periods of the two groups. The logMAR scores with CRGPcl [group 1 period
1, group 2 period 2] exhibit a larger interquartile range then the SRGPcl [group 1 period 2,
group 2 period 1]. The wider interquartile and total range of the logMAR scores with CRGPcl
compared with SRGPcl is also apparent in Figure 5.24, which exhibits the box plots of the
whole population mean OD/OS logMAR scores in CRGPcl versus SRGPcl.
The group by period analysis exhibited in Figures 5.25 and 5.26 highlights the logMAR score
differences between participants and the subtle differences between the two groups, by the
spread of scores along the diagonal (Jones and Kenward, 2015). Group 1 exhibits a larger inter-
subject variability, group 2 exhibits a single low scoring outlier (top of the graph), which is
responsible for the lower Kendall’s tau_b correlation of 0.331 in group 2 versus 0.517 in group
1. The majority (7 versus 6) of the plotted scores in group 1 are below the diagonal, which
indicates a tendency for better logMAR scores (lower values) in period 2 (SRGPcl). The
periods in group 2 exhibits more equal scores, 8 under and above the diagonal. The fairly
203
symmetrical distribution of the plotted scores in relation to the diagonal in both groups
indicates an absence of a significant period effect (Jones and Kenward, 2015).
To illustrate treatment effect, both groups were plotted on the same graph with their respective
centroids plotted in Figure 5.27. The fact that both centroids are on the diagonal, at essentially
the same position, indicates an absence of a significant treatment effect, or period score
equivalence in both groups (centroids on the diagonal) and equivalence in the logMAR scores
between group 1 and 2 (same position of centroids) (Jones and Kenward, 2015).
A good plot for displaying within-participant treatment / period differences is the subject-
profiles plot (Figure 5.28) (Jones and Kenward, 2015). These plots exhibit the logMAR scores
in the two periods for each participant. Larger inter-subject variability is apparent in group 1,
with an obvious outlier with poorer scores in group 2 (top of the graph). The majority of
logMAR score changes (slopes) are relatively small, 3 participants in each group exhibited
significant changes of five or more letters. There is no clear trend (direction of slopes) which
also indicates an absence of a significant treatment effect.
Plotting the four groups by period means ȳ11, ȳ12, ȳ21 and ȳ22 against their corresponding
period labels and joining the mean logMAR scores achieved in CRGPcl [periods 1 group 1
with period 2 group 2] and joining the scores achieved in SRGPcl [period 2 group 1 with period
1 group 2] (Figure 5.29) exhibits the difference in the mean logMAR scores between
participants in groups 1 and 2 wearing CRGPcl and the difference between participants in
groups 2 and 1 wearing SRGPcl (Jones and Kenward, 2015). In period 1 the mean logMAR
score difference (A vs B) is 0.03 (1.5 letters) in period 2 (B vs A) is 0.02 (one letter), the
crossing of the graph lines indicates that the participants in group 2 (red triangle and dot)
exhibited lower logMAR scores (better visual acuity) in both CRGPcl and SRGPcl than the
participants in group 1.
To establish whether a statistically significant difference existed between the ETDRS logMAR
scores of participants wearing CRGPcl compared with participants wearing SRGPcl a
comparison of the logMAR score period differences between the two experimental groups
(Table 5.23a and 5.23b) was performed by the non-parametric Mann-Whitney U test. This
analysis confirmed the null hypothesis (H0) that despite the slightly better logMAR score in
SRGPcl in group 1, there was no significant difference between group 1 (Median=-0.01) and

204
group 2 (Median=0.00), period differences: U=96.5, (p=0.563) [z=-0.588] (Tables 5.25 a, b,
Figures 5.30 and 5.31).
Summary of the ETDRS logMAR outcome measure
The ETDRS logMAR results indicate that in patients with irregular cornea disorders such as
keratoconus, who are successful CRGPcl wearers, with no clinical indications for refitting with
alternative contact lenses such as SRGPcl, the logMAR visual acuity is expected to be
equivalent in both CRGPcl and SRGPcl. With respect to logMAR visual acuity, no advantage
is expected in refitting a successful CRGPcl wearer with SRGPcl and no disadvantage in
refitting with SRGPcl, if and when this is clinically indicated.
Contrast sensitivity measure of visual performance
The second aspect of visual performance measured and compared in CRGPcl versus SRGPcl
was the contrast sensitivity function (CSF), which measures the visual system’s resolution of
4 different grating spatial frequencies, expressed in cycles per degree (CPD), at 8 levels of
gradual contrast reduction. These scores may be expressed by a numerical value of contrast on
a scale from 0-8, for each grating size, which may be plotted on a contrast sensitivity chart and
also expressed in log contrast sensitivity (logCS) for statistical analysis.
The research population’s numerical scores of CS (Table 5.26, Figure 5.31a) were lower at all
four spatial frequencies (poorer performance) than normative data collected by the FDA
researchers [unpublished data quoted in (VectorVision, 2013)] (Table 5.28, Figure 5.32a) and
also poorer performance in CPD 6, 12 and 18 compared with the published normative data by
Hashemi et al., (2012) (Table 5.29, Figure 5.32b). The reduced CSF of keratoconic CRGPcl
wearers was found in other research; (Wei et al., 2011) (Figure 5.32c). The mean numerical

205
CS scores in this research (Tables 5.27.a (Appendix IV.A) and 5.27b) were similar to the Wei
et al., (2011) scores at 3 and 6 CPD. However, at 12 and 18 CPD, the mean scores in this
research were higher (≥1.0 CS scores) than in Wei et al., (2011). The reason for this difference
is not clear, it is possible that in the Wei et al., (2011) study there were more eyes with advanced
keratoconus, which negatively affected the higher resolution demands (Zadnik et al., 2002;
Wagner et al., 2007; Wei et al., 2011) at 12 and 18 CPD [logMAR 0.5 and 0.20 respectively
(Sukha and Rubin, 2013)].
Numerical average OD/OS CSF scores means at 3, 6, 12 and 18 CPD in CRGPcl and SRGPcl
and whole population are presented in Tables 5.27a and b and Figure 5.32. The two
experimental lenses exhibit similar mean and StdDev numeric CSF scores at all four CPD
(Figure 5.31b).
Crossover data analysis
The analysis of the CS data was performed in a similar manner to that of the ETDRS logMAR
scores, the logCS scores of the right and the left eyes were averaged and a mean CPD score
was calculated for each participant in periods 1 and 2, in group 1 (AB) and group 2 (BA)
(Tables 5.30, 5.31 and 5.32).
Plotting the logCS scores in periods 1 and 2, in groups 1 and 2 (Figure 5.34), highlights the
larger inter-subject logCS score variation (spread of the scores along the diagonal) in group 1
and the overall slightly higher (better) logCS scores in group 2 (higher concentration of scores
in the upper part of the graph). In group 1 the logCS scores were higher in period 1 (CRGPcl)
(more points under the diagonal) and in group 2 the scores were higher above the diagonal,
period 2 (CRGPcl). Group 1 exhibited a single outlier (participant 23), with a significantly
better score in period 1 (CRGPcl). The fairly symmetrical distribution of the plotted points in
relation to the diagonal in both groups is an indication for the absence of a period effect (Jones
and Kenward, 2015).
To illustrate evidence of treatment effect both groups were plotted on the same graph with their
respective centroids (Figure 5.35). The centroids are close to and on the opposite sides of the

206
diagonal, which indicates that there was a slight (proximity to diagonal) difference between the
two periods in both groups and that in both groups, participants had higher logCS scores with
CRGPcl (group 1 period 1, group 2 period 2). The higher overall performance was in group 2,
indicated by the higher location of the group 2 centroid, is not indicative of a period carryover
effect since the lens in period 1 in that group was SRGPcl, which had lower scores than
CRGPcl. The fact that the centroids are placed either side of the diagonal line with some
vertical separation may be an evidence of a direct treatment effect. (Jones and Kenward, 2015).
The subject-profiles plot displays within-participant treatment / period differences, by
displaying and connecting the logCS scores in the two periods for each participant (Figure
5.36). Larger inter-subject variability is apparent in group 1 compared with group 2, with an
outlier with poorer scores in group 1 period 2 (participant 23). The majority of logCS score
changes are relatively small (less than 0.1 log units), four participants in group 1 and two
participants in group 2, exhibited significant logCS score changes of ≥0.10 log units. The trend
for higher logCS scores in period 1 of group 1 can be detected in the general direction of slopes,
in group 2, no obvious trend is apparent.
Plotting the four group by period means ȳ11, ȳ12, ȳ21 and ȳ22 against their corresponding period
labels and joining the mean logCS scores achieved in CRGPcl [period 1 group 1 with period 2
group 2] and joining the scores achieved in SRGPcl [period 2 group 1 with period 1 group 2]
(Figure 5.37), illustrates the small difference in the mean logCS scores between participants in
groups 1 and 2 wearing CRGPcl and the difference between participants in groups 1 and 2
wearing SRGPcl. In period 1 the mean logCS score difference (A vs B) is 0.10 logCS; better
scores for SRGPcl: [CRGPcl Mean=1.46, SRGPcl Mean=1.56]. In period 2 (B vs A) the
difference is 0.17 logCS, better scores for CRGPcl [CRGPcl Mean=1.59, SRGPcl
Mean=1.42]. The crossing of the graph lines highlights the higher logCS of participants in
group 2 in both lenses (red triangle and a red circle). A significant difference between the scores
of groups may be indicative of a treatment-by-period interaction (carryover effect) (Jones and
Kenward, 2015).

207
Carryover and period effects analysis
Analysis of period carryover effect by an independent samples t-test indicated that due to the
significantly higher mean of period sums in group 2 there is a possibility of a period carryover
effect (p=0.019). The most likely explanation for this finding may be related to the absolute
differences in the logCS scores between the two groups and not due to period interaction. As
discussed above regarding carryover effect in the logMAR scores these arguments are equally
applicable to the logCS scores (Bailey, 2006; Borish and Benjamin, 2006). However, despite
this accepted clinical wisdom and the absence of a statistically significant difference in the
period sums of the logMAR visual scores, it was decided to analyse the treatment effect both
according to a crossover study protocol (ignoring the statistically significant finding regarding
the sum of periods) and more conservatively as a parallel group RCT protocol, in which the
results of period 1 only in both groups will be compared (Wellek and Blettner, 2012).
The period effect was calculated by a Mann-Whitney U test comparison of the period crossover
differences between the randomised groups (Tables 5.31), this finding indicated that there was
no significant period effect in the logCS scores in this research (p=0.711).
LogCS treatment effect
An independent samples t-test comparing the means of the period differences between group 1
and group 2 confirmed the H0, that the higher logCS scores achieved in CRGPcl in both groups
were not significantly different to the logCS scores achieved in SRGPcl (p=0.316), (Figure
5.38).
The parallel group analysis was performed by an independent samples t-test comparing the
logCS means of the four CPD scores achieved with the two contact lens types in period 1 of
group 1 and period 1 in group 2. The 0.10 logCS higher scores achieved in SRGPcl (<0.15,
single logCS increment, Figure 6.1) did not reach statistical significance and therefore also
supported the H0, (p=0.070).
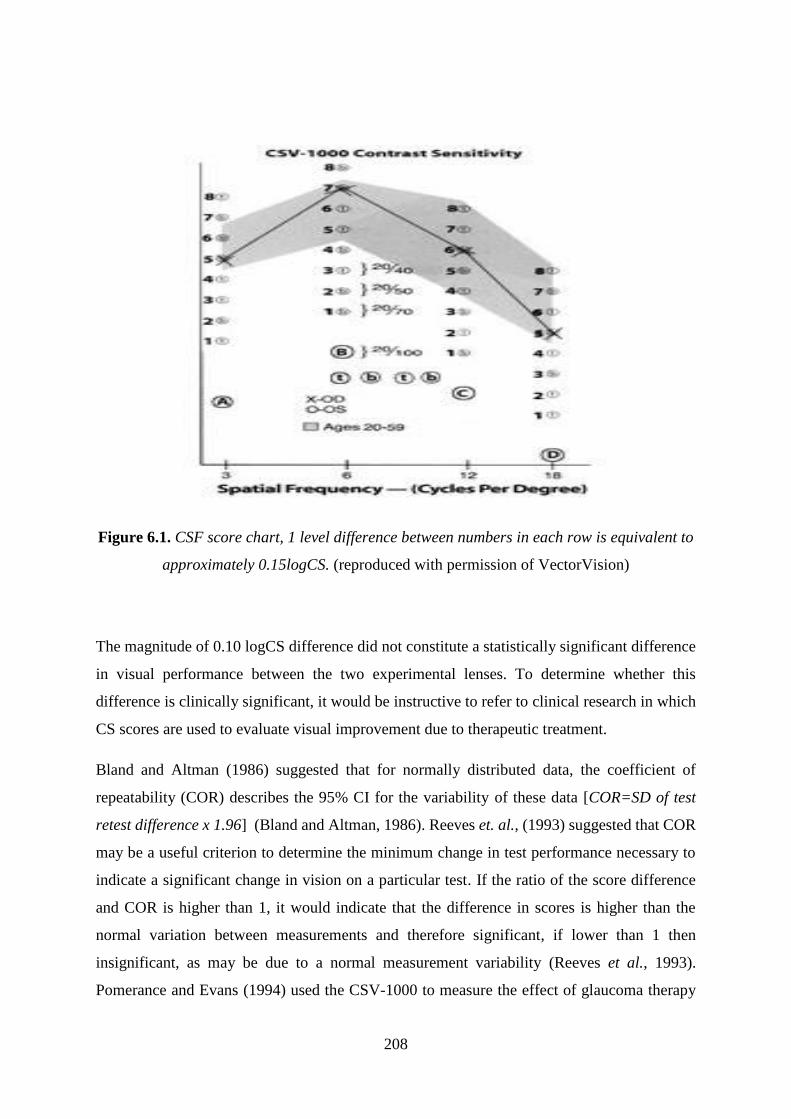
208
Figure 6.1. CSF score chart, 1 level difference between numbers in each row is equivalent to
approximately 0.15logCS. (reproduced with permission of VectorVision)
The magnitude of 0.10 logCS difference did not constitute a statistically significant difference
in visual performance between the two experimental lenses. To determine whether this
difference is clinically significant, it would be instructive to refer to clinical research in which
CS scores are used to evaluate visual improvement due to therapeutic treatment.
Bland and Altman (1986) suggested that for normally distributed data, the coefficient of
repeatability (COR) describes the 95% CI for the variability of these data [COR=SD of test
retest difference x 1.96] (Bland and Altman, 1986). Reeves et. al., (1993) suggested that COR
may be a useful criterion to determine the minimum change in test performance necessary to
indicate a significant change in vision on a particular test. If the ratio of the score difference
and COR is higher than 1, it would indicate that the difference in scores is higher than the
normal variation between measurements and therefore significant, if lower than 1 then
insignificant, as may be due to a normal measurement variability (Reeves et al., 1993).
Pomerance and Evans (1994) used the CSV-1000 to measure the effect of glaucoma therapy
209
on vision. They compared the normative COR for each spatial frequency to the change in vision
before and after therapy in glaucoma patients (Pomerance and Evans, 1994). They found that
the average COR of normal subjects was 0.191 and that vision differences / COR ratios, were
significant for CPDs 3, 6 and 12: 1.98, 1.15, 1.30, respectively and not significant for 18 CPD:
0.64. Using the same normative data to establish the clinical significance of the logCS
difference in the current research, the ratio of the mean score difference between the two
groups: 0.10 and normative COR: 0.191 from Pomerance and Evans (1994), was lower than 1:
[0.1/0.191=0.52], which confirms that this difference is unlikely to be clinically significant.
LogCS scores at 6 CPD
It was decided to compare the logCS scores of CRGPcl and SRGPcl at 6 CPD specifically,
because the score difference between the experimental lenses was largest at 6 CPD (Figure
5.31b) and because the resolution required for 6 CPD target is 6/30 / logMAR 0.70 (Sukha and
Rubin, 2013). This level of resolution is relatively low and has been achieved by all eyes in
this research. Another reason for choosing 6 CPD was that normative data indicate that the
highest CS scores are achieved at 6 CPD compared with the other three and therefore could
provide useful insight into visual performance in addition to that provided by the mean logCS
and ETDRS logMAR.
Due to the possibility of a period carryover effect the treatment effect analysis was again
performed for the whole data of the crossover and the data from period 1 of both groups, (p=
0.104) and (p=0.110) respectively. Analyses by both these methods supports H0.

210
Summary of subjective visual outcomes
Both methods of assessing visual performance in this research, the ETDRS logMAR and the
logCS, indicated that there was no statistically significant difference between the two
experimental lenses with respect to the research participants’ visual performance. Similar
results may be found in published research, such as was used in the sample size calculation
(Davis et al., 2006; Marsack et al., 2007; Nejabat et al., 2012; Gumus et al., 2011; Sabesan et
al., 2013). Other research exploring CSF visual performance in both lens types, Wei et al.,
(2011) in CRGPcl and Ozek et al., (2018) in 28 keratoconic, 4 PMD and 8 corneal grafts
SRGPcl wearers, reported an identical mean logCS to this study, in CRGPcl and SRGPcl
respectively (Wei et al., 2011; Ozek et al., 2018).
In summary, no statistically or clinically significant differences were found in the visual
performance, measured by logMAR and LogCS, between CRGPcl and SRGPcl in the
participants in this research. The visual outcomes in this research therefore do not support the
findings in other studies such as Baran et al., (2012) and Bergmanson et al., (2016), who found
superior visual performance in SRGPcl compared with CRGPcl.
The most likely explanation for this difference is the study design and the population
demographics. The present research is a crossover RCT, whereas Baran et al., (2012) and
Bergmanson et al., (2016) are retrospective analyses of participants who were refitted with
SRGPcl due to clinical needs and therefore may have had more advanced levels of keratoconus.
The suggestion that:
“Given the here reported comfort and vision advantage, it may be argued that the
scleral contact lenses should be tried at an earlier stage and possibly be the first rigid
lens prescribed for keratoconus cases” (Bergmanson et al., 2016).
is not supported by this research at least with respect to achieving better visual performance,
when no other clinical indication for refitting CRGPcl wearers with SRGPcl are present.
The visual outcome results in this research also indicate that patients who may require a
refitting from CRGPcl to SRGPcl due to nonvisual clinical indications, such as reduced lens
tolerance, should not be disadvantaged with respect of their vision from being refitted with
SRGPcl.

211
National Eye Institute Visual Function Questionnaire (NEI-VFQ)
The third outcome analysed was the National Eye Institute Visual Function Questionnaire
(NEI-VFQ). Assessment of visual quality of life has been widely used in the monitoring of
treatment efficacy in ocular disorders. The NEI-VFQ developed and validated by Mangione et
al., (1998) evaluates the vision-related health status, and the impact of ocular diseases on
individuals’ social function, emotional well-being and daily routine activities (Mangione et al.,
1998; (Mangione, 2000).
Keratoconus has a significant detrimental effect on quality of life (Qol), which is equivalent in
its severity to categories 3 and 4 (advanced stages) macular degeneration (Kymes et al., 2004).
Baran et al., (2012) re-fitted 49 selected participants (43 with keratoconus) with SRGPcl from
their habitual CRGPcl and found 27.6/100 points improvement in NEI-VFQ scores, across the
12 domains (p < 0.001).
Changes in the NEI-VFQ scores of 925 keratoconus patients were evaluated by the CLEK
study over a 7-year follow-up period. The researchers reported a decrease in scores of all NEI-
VFQ domains, except ocular pain and mental health. These decreases in vision related Qol
were associated with exacerbation of keratoconus and reduction in visual quality (Kymes et
al., 2008). Nevertheless, Aydin Kurna et al., (2014) suggested that the higher visual acuity
afforded by RGPcl may improve vision related Qol, which was supported by the finding that
patients with keratoconus expressed higher levels of satisfaction after being fitted with CRGPcl
than patients with normal corneae, who were fitted with CRGPcl for myopia correction (Lee
et al., 2017).
NEI-VFQ demographics
From the 12 domains of the NEI-VFQ in this research (Table 5.34) ocular pain featured the
lowest (worst) mean score of 77.6 (±21.19) followed by the participant perception of their
212
general health 79.55 (±12.45). These results were similar to the CLEK study by Kymes at al.,
(2004), the 1166 participants with keratoconus reported mean scores of 74.8 (±18.0) and 75.5
(±21.4) for ocular pain and general health respectively. Both these populations graded the
ocular pain and general health status lower than the normative population of CRGPcl wearers
reported in Kymes et al., (2004); 85.4 (± 13.7) and 84.4 (±18.5) respectively (Figures 5.40a.
and 5.40b).
The NEI-VFQ score differences between the keratoconic participants and the normative
CRGPcl participants, reach statistical significance for all 12 domains, (p<0.05), in the Kymes
et al., (2004) study. The current study exhibited slightly higher (better) NEI-VFQ scores
compared with Kymes et al., (2004), except in the domain of ocular pain (Figure 5.40a).
However, the results in the current study were also lower in all domains than the normative
data published by Kymes et al., (2004) taken form Walline et al., (2000) (Kymes et al., 2004;
Walline et al., 2000) (Figure 35b).
Kymes et al., (2008) followed the 1166 participants for 7 years and found a modest decline in
all NEI-VFQ domains except ocular pain and mental health. The drop in these scores was
associated with a significant decline of 10 letters in logMAR scores and a 3.00D increase in
corneal curvature (0.6mm steeper). This finding is significant for the current research because
of the association of contact lens wear duration with decline in logMAR scores and
exacerbation of keratoconus, both of which may be associated with reductions in NEI-VFQ
scores. This aspect however, should have been well controlled in this research due to
randomisation and the overall equivalence between the two randomised groups with respect to
age at diagnosis and equivalence with respect to the estimated reported duration of CRGPcl
wear at enrolment (Figure 5.16 and 5.17).
Summary NEI-VFQ demographics
The comparison of the mean scores of individual domains between the two experimental lenses
(Figures 5.41a and 5.41b) shows that the participants reported slightly higher scores in CRGPcl

213
[Median=89.53, IQR=17.38], than in SRGPcl [Median=88.35, IQR=14.04], except in the
driving domain, in which SRGPcl featured slightly higher scores.
Carryover and period effects analysis of NEI-VFQ
The mean of the scores of the 12 domains of NEI-VFQ for each participant, in each period was
calculated as well as period sums and crossover differences in the two groups [Table 5.35,
(Appendix IV B)]. The absence of carryover effect was confirmed by Mann-Whitney U test
(p=0.245). An independent samples t-test means comparison of the period crossover
differences between the randomised groups confirmed the absence of a period effect (p=0.343)
in the NEI-VFQ scores in this research.
Treatment effect analysis
The two randomised groups exhibited similar scores in all 12 domains of the NEI-VFQ with
slightly higher mean scores in group 1, in 9 of 12 domains (Figure 5.42). To establish the
treatment effect of the experimental lenses on the VFQ scores, data analysis was conducted as
in previous outcome measures according to recommendations of Wellek and Blettner (2012)
and Jones and Kenward (2015). The mean of the scores of the 12 domains of NEI-VFQ for
each participant, in each period was calculated as well as period sums and differences in the
two groups [Table 5.35, (Appendix IV B)].
The absence of carryover effect was confirmed by Mann-Whitney U test (p=0.245).
The treatment effect analysis revealed that the higher scores reported by the participants in
SRGPcl did not reach statistical significance (p=0.483). These results indicated that with
respect to the mean score of the 12 domains of the NEI-VFQ there was no statistically
significant difference between the experimental lenses, confirming H0.
214
The NEI-VFQ results in this research did not support the findings of other research which
found higher NEI-VFQ scores in participants wearing SRGPcl compared with CRGPcl, such
as Baran et al., (2012). This difference in results is most likely due to the difference in the
research design with Baran et al., (2012) being a retrospective analysis of participants who
were refitted with SRGPcl for clinical reasons. The current research design is a crossover RCT,
of participants who had no clinical indications for refitting with SRGPcl.
Summary of NEI-VFQ outcome measure
The conclusion which may be drawn from the NEI-VFQ results of the current research are, that
there would most likely be no significant improvement in the vision related Qol if patients with
keratoconus and other irregular cornea disorders, who are successful CRGPcl wearers, with no
clinical indications for refitting, are refitted with SRGPcl. There would also be no likelihood
of a disadvantage with respect to vision related Qol if patients who wear CRGPcl are refitted
with SRGPcl and vice versa, when clinically indicated.
Subjective measures of comfort and vision
Optometrists use grading scales in their daily practice for a variety of purposes. A study by
Efron et al., (2011) concluded that grading scales for contact lens complications may “be
considered as an expected norm in contact lens practice”, they further advocated “the
incorporation of such grading scales into professional guidelines and standards for good
optometric clinical practice” (Efron et al., 2011). Grading scales are also used in optometric
practice for the recording of symptoms such as comfort levels due to ocular dryness (Begley et
al., 2001). Numerical rating scales were found to be useful, repeatable and accurate when the
visual quality is generally high (Papas and Schultz, 1997), as in the current research.
215
The measurement of contact lens discomfort is complex; the sensation experienced is
inherently variable, and existing measurement scales may not be optimal. Appropriately
designed questionnaires undergo a rigorous process of item development and validation.
Interval scales (e.g. numerical rating scale and visual analogue scale) are frequently used to
measure temporal characteristics of contact lens discomfort and remain useful in assessing
qualities such as duration, onset and chronicity. Jalbert et al., (2015) reviewed the instruments
used to assess contact lens comfort and stipulated that the majority of studies have used
questionnaires designed and validated for use in dry eye patients, most commonly the ocular
surface disease index (Schiffman et al., 2000) was used in 13 studies, the contact lens dry eye
questionnaire (Begley et al., 2001) was used in 7 studies. The authors pointed out the
questionable nature of such practice as the characteristics; epidemiology and underlying
mechanisms of contact lens wearers differ from those reported by dry eye patients. They
recommended that improved instruments need to be developed, but until then, interval scales
and the short version of the contact lens dry eye questionnaire are the best validated instruments
available for measuring contact lens discomfort (Jalbert et al., 2015).
Wirth et al., (2016) initiated the development of the Contact Lens User Experience system.
They interviewed 86 healthy adult, soft disposable contact lens wearers and identified three
key areas patients consider important when describing their experience with contact lenses.
These were: comfort, vision and contact lens handling. The authors claim that these instruments
exhibit excellent psychometric properties (Wirth et al., 2016). To my best knowledge these
instruments have not to date been used in research and because they were developed for healthy
soft lens wearers are unlikely to be suitable for the current research.
It was therefore decided to follow the advice of Jalbert et al., (2015) and develop a Likert-like
interval scale from 1-10, (1=worst comfort and vision, 10= perfect comfort and vision) to grade
personal perception of vision and comfort in the experimental contact lenses. This instrument
was designed for this study by the chief investigator, with a view that if appropriate, it may
after further validation be used in both specialist and standard contact lens practice.
The individual scores for SPC and vision of each participant in periods 1 and 2 in both groups
are presented in Figures 5.43, 5.44, 5.45 and 5.46 (Appendix IVC). Significant differences are
apparent in some individuals in their scores of the subjective comfort such as in group 1;
participants 10, 11, 20, 23, 28; scoring their comfort in SRGPcl higher by 2.5, 2, 3, 2.5 and 2
points respectively. In group 2 smaller differences in subjective comfort scores were apparent

216
with participants 6 and 34 reporting a 3 and 2-point better comfort in SRGPcl, with the rest
reporting differences of less than 2-points. Subjective grading of vision showed less obvious
differences between the two experimental lenses in group 1: participant 1 reporting a 3 points
better vision in CRGPcl, with the rest of the participants in that group reporting equivalence or
differences smaller than 2 points. Participants in group 2 also reported equivalent results except
participant 15, who reported 5-point better vision in SRGPcl, and participants 9, 16 and 24
reporting differences of 2.5, 2.5 and 2-points respectively, the first 2 reported better vision with
SRGPcl and the latter with CRGPcl.
Crossover analysis of subjective scores of vision and comfort
The analyses of the subjective scores of vision and comfort were performed in the same manner
as the other outcome measures, as recommended by Wellek and Blettner (2012) and Jones and
Kenward (2015).
The period by group comparisons in Figures 5.47 and 5.48 highlight an important finding
which shows that subjective comfort was better in period 2 in group 1 and period 1 in group 2,
this finding indicates that overall participants reported better comfort in SRGPcl.
Subjective grading of vision was fairly equally symmetrical around the diagonal in group 1,
with 3 participants reporting better vision in period 2 (SRGPcl) and 3 participants reporting
better vision in period 1 (CRGPcl), 7 participants reported equal SPV. In group 2, five
participants reported better vision in period 1 (SRGPcl) and 6 reported better vision in period
2 (CRGPcl), the remaining 5 participants reported equal vision.
The Mann-Whitney U tests indicated that there was no statistically significant carryover effect
in SPC and vision scores reported by the participants (p=0.183) and (p=0.592) respectively.
The period effect analysis by an independent samples t-test means comparison of the period
crossover differences between the randomised groups (Tables 5.38, 5.39), indicated that there
was no significant period effect in the SPC and SPV scores in this research (p=0.630),
(p=0.157) respectively.

217
The comparison of the two groups with respect to the treatment effect of the two experimental
lenses was performed as recommended by Wellek and Blettner (2012) and Jones and Kenward
(2015). The Mann-Whitney U tests indicated that the slightly higher (better) SPV scores
achieved with SRGPcl did not reach statistical significance, (p=0.213), which supports the H0,
(Figure 5.49b). The participants’ subjective grading of their own vision is also in agreement
with the experimental visual findings that there was no significant difference between the two
experimental lenses with respect to the visual performance measured by logMAR and logCS.
Participants’ perception of their subjective comfort in the two experimental lenses, was also
evaluated for treatment effect by the Mann-Whitney U test comparing the period difference in
group 1 (Median = 1.0) to the period difference in group 2 (Median = -1.0). The group by
period and individual profile plots reveal higher scores with SRGPcl (Figures 5.47a, b and c)
and were confirmed as statistically significant (p=0.002). This result rejects the H0 and
indicates that in this research population significantly higher subjective comfort scores were
achieved with SRGPcl (Figure 5.49a).
After establishing the statistically significantly higher SPC scores in SRGPcl, it was decided
to explore whether other factors, unrelated to the lens type could have influenced the
participants’ scoring of subjective comfort. The sequence of contact lens wear was considered
as a possibility, because the loss of adaptation to CRGPcl after wearing SRGPcl [group 2,
sequence: BA] could have detrimental effects on the perception of comfort on resumption of
CRGPcl wear in the washout and experimental periods. If this assumption is true, the comfort
score of the experimental CRGPcl in group 2 would be lower (worse) than in group 1 [CRGPcl
worn first, sequence: AB]. An independent samples t-test comparing the means of the
subjective comfort in experimental CRGPcl between group 1 and group 2 revealed no
statistically significant difference between two groups: (p=0.198). This excluded the sequence
of wear as a factor with significant influence on the subjective comfort scores.
The other outcome measure which assesses participants’ comfort in this experiment may be
found in the ocular pain domain of the NEI-VFQ. It was decided to evaluate this domain in
isolation to determine whether a statistically significant difference between the two
experimental lenses might be found with respect to ocular pain as well. The analysis was
performed as recommended by Wellek and Blettner (2012) and Jones and Kenward (2015),
after establishing the absence of significant period and differential carryover effects, the higher
(better) ocular pain scores achieved with SRGPcl, supported the finding of the subjectively

218
reported levels of comfort in the experimental lenses, but this difference did not reach statistical
significance (p=0.170). Therefore, still supported the H0 in this regard.
Final lens choice
Lens choice for future habitual use was the final outcome measure. Fourteen (47%) of
participants chose the SRGPcl and 16 participants chose the CRGPcl (53%) as their habitual
lens. The chosen habitual lenses of the four participants who had one eye fitted were:
participants 4, 5 and 8 chose to remain in CRGPcl and participant 26 chose SRGPcl.
Interestingly, participants 4 and 8 chose to remain in CRGPcl despite successfully wearing a
SRGPcl in the other, non-experimental eye.
Based on the absence of statistically significant differences in the participants’ visual
performance or in their scores across the 12 domains of the QoL, it was of interest that almost
50% of participants chose to abandon their habitual CRGPcl and wear SRGPcl, despite
exhibiting no statistically significant visual or Qol advantages in these lenses.
The only statistically significant difference found in this experiment was in the participants’
perception of comfort in the two experimental lenses, with better comfort scores in SRGPcl. It
may be postulated that the significantly better perception of comfort in SRGPcl was the main
reason for 47% of the participants to switch to SRGPcl from their habitual lens design, CRGPcl.
The participants’ SPC and SPV together with the final lens choice are presented in Table 5.40
(Appendix IV D) and Figure 5.51.
To try and understand why a high proportion (47%) of successful CRGPcl wearers chose to
change to SRGPcl, it was decided to analyse and compare the scores of the perceived subjective
comfort in the experimental CRGPcl between the participants who chose CRGPcl and those
who chose SRGPcl.

219
A means comparison of the subjective comfort scores reported in the experimental CRGPcl of
the participants who selected CRGPcl [Mean=8.44 (±1.03)] and SRGPcl [Mean=7.04 (±1.54)]
was performed by two independent samples methods, the t-test and Mann-Whitney U test
(Figure 5.52).
Both analyses revealed significantly higher scores of reported subjective comfort by the
participants who selected CRGPcl as their habitual lens compared with participants who
selected SRGPcl, (p=0.006) and (p=0.009) by independent samples t-test and Mann-Whitney
U test respectively, thus rejecting the H0.
These results indicate that there is a significant difference in the subjective comfort perception
in CRGPcl between the participants who chose CRGPcl and those who chose SRGPcl as the
preferred habitual contact lenses. This significance indicates that the difference in the
subjective comfort in CRGPcl may be an important measure of the performance of CRGPcl in
the wider population of patients with keratoconus managed by these lenses.
After establishing the statistically significantly higher score of SPC in participants who chose
CRGPcl as their future habitual lenses, it was decided to explore whether other factors, such as
the sequence of contact lens wear could influence the final lens choice. Sequence was
considered important due to the possibility of loss of adaptation to CRGPcl after wearing
SRGPcl in group 2 [sequence BA]. Alternatively, the possibility of preferring the latest lens
worn; SRGPcl in group 1 [sequence: AB] and CRGPcl in group 2 [sequence BA]. This analysis
compared the number of participants selecting CRGPcl and SRGPcl in the two randomised
groups. The non-significant χ2 results, (p=0.713), indicate that neither lens wear sequence nor
the final lens worn by the participants had a significant influence on the choice of the final
habitual lens (Table 5.42).
It is of note that 12 (75%) of the 16 participants who chose CRGPcl scored their subjective
comfort in these lenses as ≥8 and none scored their comfort level in these lenses at < 7, which
seems reasonable for successful contact lens wear. Nevertheless, 8 (57%) out of the 14
previously successful CRGPcl wearers scored their comfort level in these lenses at ≤7, and
given an alternative choice selected SRGPcl. The other 6 (43%) participants, who chose
SRGPcl, scored their subjective comfort in CRGPcl at ≥7.5, switched to SRGPcl most likely
due to a combination of other factors, such as improved vision and equal or better comfort.
220
Summary of statistically significant results
This research revealed statistically significantly higher subjective comfort scores in SRGPcl
than in CRGPcl and also found that participants who chose CRGPcl as their habitual lenses,
had statistically significantly higher subjective comfort scores in CRGPcl. Furthermore, no
participant chose to remain in CRGPcl with subjective comfort scores <7. These findings
indicate that for some wearers SRGPcl afford superior comfort to CRGPcl and habitual wearers
of CRGPcl are likely to prefer SRGPcl if their subjective comfort score with CRGPcl are lower
than 7.
These results indicate that the LSCS instrument may be appropriate for use in patients with
keratoconus and other irregular cornea disorders managed by CRGPcl, to determine the degree
of their perceived comfort. Based on the findings of this research a comfort score <7 may
indicate that despite reported satisfaction, and no clinical indications for refitting with
alternative lenses, the contact lens experience may be improved with alternative contact lenses,
such as SRGPcl. If the findings of this research regarding preference of SRGPcl by CRGPcl
wearers with subjective comfort scores <7 are replicated and validated, the LSCS instrument
may be used routinely to establish whether an alternative lens management may be appropriate
to further improve contact lens tolerance of successful CRGPcl wearers, by refitting with
SRGPcl.
Strengths and limitations
The main strength of this research is the RCT with a crossover design, employed to answer the
research questions regarding the performance of the two experimental lenses in the specific
research population. The causal inferences afforded by an RCT provide the strongest empirical
evidence of a treatment’s efficacy. The randomisation of participants and concealment of their
allocation ensured that allocation bias and confounding of unknown variables were minimised.
This was further enhanced by minimisation of the detection bias by performing visual data
221
collection by practitioners who were naive to the type of lenses worn at the time, this masking
was possible for all participants assessed, with both experimental lens types.
The chronicity of the corneal pathology and the non-curative nature of the experimental lenses
evaluated were appropriate for the crossover aspect of this research (Armitage and Hills, 1982),
which minimised the confounding of individual idiosyncrasies such as gender, age, race,
disease severity et cetera (Wellek and Blettner, 2012; Jones and Kenward, 2015).
It is inevitable with research of this type that participants cannot be masked to the lens type.
However, the research team took care to use neutral language in describing the lens options
and not to make any comment that could lead participants to expect that one of the lens types
may be preferable to the other.
The potential disadvantages of RCT were not significant in this research, dropout / attrition
rate was low (4 participants; 12%), the ethical considerations were appropriately addressed
prior to the study commencement and there was sufficient prior knowledge about the clinically
meaningful levels of improvement and expected variation of improvement in the sample size
calculation (Levin, 2007). The sample size was calculated conservatively to allow for the
possibility of analysing the results from period 1 only (50% of data) as in a parallel RCT, in
the unlikely event of discovering a significant differential carryover effect.
The imbalance between the two randomised groups in the number of participants who
completed the study (13 and 17 participants, in group 1 and 2, respectively) occurred by chance
and not due to any inherent differences between the two lens types. Two participants SN 18
and 25 have emigrated. Participant 29 underwent a corneal cross-linking intervention after
enrolling to this research and therefore could not continue participation. Participant 22, did not
return to the CMH clinic and could not be reached by the clinic staff, therefore presumed to
have moved away.
The fact that the ratio of participants in the 2 experimental groups changed from the planned
15 in each group to 13 in group 1 and 17 in group 2, should have no effect on the significance
and power of the study because the sample size was calculated conservatively to enable
analysis of results from period 1 only as in a parallel RCT design, if a significant differential
carryover effect was established. The statistical power in this scenario, assigning group 2 as
experimental (n=17) and group 1as control (n=13), the power of the study would change from
0.80 to 0.75, α=0.05. However, in this research all outcomes except logCS, demonstrated no

222
significant differential carryover effect and were therefore analysed as a crossover RCT, which
is considered more powerful than a parallel group analysis (Wellek and Blettner, 2012; Jones
and Kenward, 2015).
The specialist clinical setting of this research has both strengths and limitations. The strengths
of such a setting are, the access to the specific population required for this research and
minimisation of bias associated with non-specialist clinical settings with respect to disease
severity range and experience of the treating professionals. The limitations of this setting are
the challenges of allocating the extra time required for the additional examinations stipulated
by the research protocol and the reliance on the contact lens fitting skills of a single practitioner,
the chief investigator.
Other limitations of this study are the inequality between the genders in the population, which
may be significant due to poorer contact lens tolerance by older female participants (Stapleton
et al., 2015; Fink et al., 2010) and alleviation of these symptoms by SRGPcl (Visser et al.,
2016).
The variation / range of the scores of the reported subjective comfort in CRGPcl in the research
population, although probably reflecting the different contact lens experience to that expected
in normal myopic individuals (Kymes et al., 2004; Walline et al., 2000), may have contributed
to the high proportion (47%) of participants who chose SRGPcl as their final habitual lens.
Furthermore, the LSCS instrument has not been validated and the conclusions regarding
participants’ comfort may be applied only to successful CRGPcl wearers and may not be
applicable to neophytes. Other factors such as the relatively limited period of SRGPcl wear by
the participants in this research and the relatively moderate severity of keratoconus, amenable
to successful management with CRGPcl, may also have influenced the outcomes.

223
Conclusions
The use of SRGPcl to manage patients with corneal disorders such as keratoconus who progress
to advanced disease and /or fail to tolerate CRGPcl is well recognised and described in the
literature (Tan et al., 1995; Pullum and Buckley, 1997; Segal et al., 2003; Pullum et al., 2005;
Baran et al., 2012; Severinsky et al., 2014; Schornack, 2015; Bergmanson et al., 2016;
Maharana et al., 2016).
Due to significant advances in technology the use of SRGPcl has undergone a revival in
specialist contact lens practice in recent years (van der Worp et al., 2014; Schornack, 2015).
However, their use remains mainly in the realm of management of advanced keratoconus and
as a problem-solving modality when CRGPcl and other lens options fail to appropriately
manage the visual disability caused by the various irregular cornea disorders (Visser et al.,
2007b; Bergmanson et al., 2016).
This research attempted to determine whether the role of SRGPcl may be expanded beyond the
important but limited scope of current use to, as suggested by Bergmanson et al., (2016) a first-
choice lens for a neophyte keratoconic and/or a better option for a successful CRGPcl wearer.
To address this question the participants in this research were successful CRGPcl wearers,
which is considered the gold standard contact lens management of the visual disability caused
by ectatic corneal disorders such as keratoconus (Robertson and Cavanagh, 2011). Refitting
this population with SRGPcl in this experiment was not a problem-solving exercise but an
exposure of experienced contact lens wearers to a significantly different, alternative contact
lens type. The importance of successful CRGPcl wear experience was that it ensured a
relatively straightforward transition and adaptation to the alternative contact lens wear and care
and with the help of randomisation and crossover research design, facilitated a comparison of
performance of these two lenses, in a non-problem-solving clinical scenario.
The crossover RCT method was considered ideal due to the chronic nature of the disorder and
the non-curative management of contact lenses. Additionally, it afforded the control of
confounding variables such as gender, age, race, disease severity and other personal
idiosyncrasies of contact lens wearers, because the comparisons in a crossover analysis are of
the within-subject differences between the two randomised groups.

224
The analysis of the demographics of the research population confirmed that the population was
consistent with that expected in a specialist contact lens clinic in a metropolitan city such as
London. The demographics of the two randomised groups confirmed that the randomisation
achieved its purpose with respect to age, gender, race and disease severity in the two
randomised groups.
The only statistically significant outcome in this research was a better subjective perception of
comfort in SRGPcl compared to comfort in CRGPcl, measured by the LSCS. This finding was
supported by the significantly lower LSCS in CRGPcl in participants who chose CRGPcl as
their final habitual lens, compared with those who chose to remain in CRGPcl.
The analysis of the main outcome measure, the ETDRS logMAR BCVA revealed no
statistically significant difference between the two experimental lenses.
The analysis of the CSF, revealed no statistically significant differences between the two
experimental lenses in the logCS scores across the 4 CPD range and no significant difference
in the logCS at specifically 6 CPD.
The analysis of the NEI-VFQ revealed that the two experimental lenses did not differ in a
statistically significant manner across the 12 domains investigated by this Qol tool, nor did the
two experimental lenses exhibit a statistically significant difference in the specific domain of
ocular pain.
The score of SPV in the two experimental lenses, revealed no significant differences in the
participants’ subjective score of their vision between the two experimental lenses.
The score of the SPC revealed significantly higher (better) comfort scores in SRGPcl. This
finding is of significance because although SRGPcl are better tolerated by patients who are
unable to tolerate CRGPcl (Schornack, 2015; Bergmanson et al., 2016; Yan et al., 2017), this
research indicates that 47% of successful CRGPcl wearers, who demonstrate equivalent visual
and Qol outcomes in both experimental lenses, preferred SRGPcl for their future habitual use.
The most likely explanation for this, is that even in individuals who are successful and well
adapted CRGPcl wearers, the particular SRGPcl fitting features, corneal clearance and
therefore absence of lens cornea interaction, minimal lens mobility and eyelid interaction and
the continued lubrication of the ocular surface covered by the lens, may all contribute to the
significantly better comfort and high participant proportion choice of SRGPcl as their habitual
lens.

225
The final outcome measure in this research was the participants’ choice of one of the two
experimental lenses as their habitual lens for future use. Sixteen participants chose to remain
in CRGPcl and 14 chose to switch to SRGPcl. The finding that 47% preferred SRGPcl to their
habitual well performing CRGPcl, may indicate that a significant proportion of keratoconic
patients who are satisfied with CRGPcl, may prefer SRGPcl, most likely if they experience
superior comfort levels in these lenses.
The clinical conundrum of how to effectively identify those successful CRGPcl wearers who
are most likely to benefit from being refitted with SRGPcl may to some degree have been
answered by the findings in this research. The analysis of the subjective comfort scores in
experimental CRGPcl indicated that participants who chose to remain in CRGPcl had
significantly higher comfort scores of ≥7.0, than those participants who switched to SRGPcl.
These findings indicate that a routine use of the LSCS tool designed for this research, may
identify those patients who would benefit from a refit with SRGPcl even if no other clinical
indications for refitting are apparent. If this research’s results can be replicated and the LSCS
is validated, then this method may be considered appropriate for the selection of patients for
refitting with SRGPcl if their LSCS score in CRGPcl is < 7, even if no other indication for
refitting is apparent.
The findings in this research that SRGPcl are significantly more comfortable than CRGPcl and
that the two experimental lenses perform equally with respect to vision and visual quality of
life, may support a practitioner’s decision to refit an existing CRGPcl wearer with SRGPcl or
to fit a neophyte with either contact lens type, knowing that lens performance should be
equivalent with respect to vision and quality of life and may be better with respect to comfort
and therefore base their choice of lens on other clinical aspects. In a neophyte such clinical
aspects may include an existing high ocular sensitivity, the presence or absence of allergies,
ocular surface disorders, dry eye disease, environmental dryness or other idiosyncratic features
of ocular sensitivity or factors which may adversely affect it.
This research also demonstrates that there are unlikely to be visual or visual Qol advantages or
disadvantages in refitting existing successful CRGPcl wearers with SRGPcl, or fitting a
neophyte with SRGPcl even if CRGPcl are also appropriate.
This research further supports a practitioners’ clinical decision to refit a CRGPcl wearer with
SRGPcl and vice versa, by the indication that there should be no significant disadvantage in
226
either scenario with respect to their visual performance and visual Qol, provided that CRGPcl
demonstrate equivalent comfort levels when patients are refitted from SRGPcl.
The above conclusions and recommendations may extend the scope of SRGPcl fitting not only
beyond the role of a problem solver but also in addition to the recommendations by Visser et
al., (2016) who developed a flowchart for contact lens selection in a specialist contact lens
practice. The authors recommended that SRGPcl may achieve better vision and longer wearing
time / comfort when factors which cause reduced lens tolerance, such as advanced corneal
irregularity, significant tear film deficiency or elevated corneal scar, are present (Visser et al.,
2016). This may be extended to include reduced subjective comfort in CRGPcl to a level <7
on the LSCS.
The equivalence of the two lens types with respect to visual performance and visual Qol is
important considering the challenge of fitting CRGPcl in a way that does not risk
compromising corneal integrity in corneal ectatic disorders (Chapter 3). Over a number of
years, it may not be possible to avoid a flat CRGPcl fit, which may cause or exacerbate corneal
scarring resulting in visual loss due to corneal morbidity. Alternatively, a steep, cone vaulting
CRGPcl fit, attempted to prevent corneal damage associated with excessive cone bearing, can
cause progression of keratoconus. Due to complete corneal vaulting it is reasonable to expect
that SRGPcl will be more likely to avoid these problems. If there are long-term physiological
advantages to SRGPcl, then the short-term equivalence in visual performance and visual Qol
of SRGPcl and CRGPcl demonstrated in the present research may lead to the conclusion that
SRGPcl may indeed be considered as the lens option of first choice in corneal ectatic disorders
management.
An additional recommendation which may be formulated from the results of this research is
that existing well adapted and satisfied CRGPcl wearers, may benefit from routine, quick and
straightforward assessment of their SPC with the LSCS instrument. If no clinical indications
for a refitting exist, it would be an evidence-based conclusion that it is appropriate to continue
wearing CRGPcl if comfort level on the LSCS are ≥7.0. However, if comfort level is <7, the
evidence in this research suggests that refitting with SRGPcl may be of benefit, even when no
other indications are present.
Other considerations when fitting with or re-fitting to SRGPcl, with respect to patients, are the
higher cost of lenses and additional care products and the considerable dexterity required for
lens handling. From the perspective of the treating clinicians a consideration of the steep

227
learning curve required to achieve competence in this complex field of contact lens practice
and the appreciation of the potential for complications associated with long term SRGPcl wear
is also necessary. Recent research raised concerns regarding compromised corneal physiology
due to reduced tear exchange in the sealed, post lens fluid reservoir and the considerable barrier
to oxygen posed by the thickness of SRGPcl and the post lens tear layer (Michaud et al., 2012;
Vincent et al., 2019). Concerns have also been raised regarding the physical pressure exerted
by the haptic portion on the sclera causing increased intra-ocular pressure increasing the risk
of glaucomatous optic neuropathy (Fadel and Kramer, 2019; Michaud et al., 2019).
Further research is suggested to validate the LSCS in CRGPcl wearers, managed for corneal
ectatic disorders. In addition, due to the significantly better comfort achieved in SRGPcl in the
population of this research, a crossover RCT comparing CRGPcl to SRGPcl in neophytes
requiring contact lens management for corneal ectatic disorders, would more specifically
clarify the viability of using SRGPcl as a lens of first choice.
228
References
Aguayo, J. B., McLennan, I. J., Graham, C., Jr and Cheng, H. M. (1988) Dynamic monitoring
of corneal carbohydrate metabolism using high-resolution deuterium NMR spectroscopy,
Experimental Eye Research, 47 (2), pp. 337-343.
Alden Optical. (2016) Zenlens, Zenlens the Enlightened Scleral Lens.
Alio, J. L. (ed.) (2017) Keratoconus. Recent Advances in Diagnosis and Treatment Essentials
in ophthalmology series, ed. Singh, A.D. 1st ed. Switzerland: Springer, pp. 1-371.
Alio, J. L., Shabayek, M. H., Belda, J. I., Correas, P. and Feijoo, E. D. (2006) Analysis of
results related to good and bad outcomes of Intacs implantation for keratoconus correction,
Journal of Cataract and Refractive Surgery, 32 (5), pp. 756-761.
Ambrósio, R., Belin, M. W., Perz, V. L., Abad, J. C. and Gomes, J. A. (2014) Definitions and
Concepts on Keratoconus and Ectatic Corneal Diseases: Pan-American Delphi Consensus—
A Pilot for the Global Consensus on Ectasias, International Journal of Keratoconus and
Ectatic Corneal Diseases, 3 (3), pp. 99-106.
Ambrósio, R., Correia, F. F. and Belin, M. W. (2017) Analysing Tomographic Thickness for
Detecting Corneal Ectatic Diseases, in: Alio, J. L. (ed.) Keratoconus, 1st ed. Switzerland:
Springer, pp. 53-86.
Amsler, M. (1961) The "forme fruste" of keratoconus, Wiener Klinische Wochenschrift, 73,
pp. 842-843.
Arditi, A. and Cagenello, R. (1993) On the statistical reliability of letter-chart visual acuity
measurements, Investigative Ophthalmology & Visual Science, 34 (1), pp. 120-129.
Armitage, P. and Berry, G. (1987) Statistical Methods in Medical Research. 2nd ed. Oxford:
Blackwell.
Armitage, P. and Hills, M. (1982) The two-period cross-over trial, The Statistician, 31 (2).
Armstrong, R. A. (2013) Statistical guidelines for the analysis of data obtained from one or
both eyes, Ophthalmic & Physiological Optics: The Journal of the British College of
Ophthalmic Opticians (Optometrists), 33 (1), pp. 7-14.
Art Optical. (2013) Rose K, Rose K Practitioners Fitting Guide.
Aydin Kurna, S., Altun, A., Gencaga, T., Akkaya, S. and Sengor, T. (2014) Vision related
quality of life in patients with keratoconus, Journal of Ophthalmology, 2014, pp. 694542.
Bailey, I. L. (2006) Visual Acuity, in: Benjamin, W. J. (ed.) Borish's Clinical Refraction, 2nd
ed. USA: Elsevier, pp. 217-246.
229
Bailey, I. L., Bullimore, M. A., Raasch, T. W. and Taylor, H. R. (1991) Clinical grading and
the effect of Scaling, Invest Ophthalmol Vis Sci, 32, pp. 422-432.
Bailey, I. L. and Lovie, J. E. (1976) New design principles for visual acuity letter charts,
American Journal of Optometry and Physiological Optics, 53 (11), pp. 740-745.
Balasubramanian, S. A., Pye, D. C. and Willcox, M. D. (2013) Effects of eye rubbing on the
levels of protease, protease activity and cytokines in tears: relevance in keratoconus, Clinical
& Experimental Optometry, 96 (2), pp. 214-218.
Bao, F. J., Geraghty, B., Wang, Q. M. and Elsheikh, A. (2017) Role of Corneal Biomechanics
in the Diagnosis and Management of Keratoconus, in: Alio, J. L. (ed.) Keratoconus Recent
Advances in Diagnosis and Treatment, 1st ed. Switzerland: Springer, pp. 141-150.
Baran, I., Bradley, J. A., Alipour, F., Rosenthal, P., Le, H. G. and Jacobs, D. S. (2012)
PROSE treatment of corneal ectasia, Contact Lens & Anterior Eye: The Journal of the British
Contact Lens Association, 35 (5), pp. 222-227.
Barnett, M., Lien, V., Li, J. Y., Durbin-Johnson, B. and Mannis, M. J. (2016) Use of Scleral
Lenses and Miniscleral Lenses After Penetrating Keratoplasty, Eye & Contact Lens, 42 (3),
pp. 185-189.
Barr, J. T., Zadnik, K., Wilson, B. S., Edrington, T. B., Everett, D. F., Fink, B. A. et al.
(2000) Factors associated with corneal scarring in the Collaborative Longitudinal Evaluation
of Keratoconus (CLEK) Study, Cornea, 19 (4), pp. 501-507.
Beardsley, T. L. and Foulks, G. N. (1982) An association of keratoconus and mitral valve
prolapse, Ophthalmology, 89 (1), pp. 35-37.
Begley, C. G., Chalmers, R. L., Mitchell, G. L., Nichols, K. K., Caffery, B., Simpson, T. et
al. (2001) Characterization of ocular surface symptoms from optometric practices in North
America, Cornea, 20 (6), pp. 610-618.
Belin, M. W. and Khachikian, S. S. (2011) Surgery of the cornea and conjunctiva, in:
Krachmer, J. H., Mannis, M. J. and Holland, E. J. (eds.) Cornea, 3rd ed. St Louis: Mosby
Elsevier, pp. 1781-1792.
Benjamin, W. J. (2006) Clinical optics of contact lens prescription, in: Benjamin, W. J. (ed.)
Borish's Clinical Refraction, 2nd ed. USA: Butterworth Heinemann Elsevier, pp. 1246-1273.
Bergmanson, J. P., Walker, M. K. and Johnson, L. A. (2016) Assessing Scleral Contact Lens
Satisfaction in a Keratoconus Population, Optometry and Vision Science: Official Publication
of the American Academy of Optometry, 93 (8), pp. 855-860.
Bier, N. and Lowther, G. E. (1977) Contact lens correction. 1st ed. London: Butterworth.
Birk, D. E. and Trelstad, R. L. (1984) Extracellular compartments in matrix morphogenesis:
collagen fibril, bundle, and lamellar formation by corneal fibroblasts, The Journal of Cell
Biology, 99 (6), pp. 2024-2033.

230
Black, C. J. and in Girard, L. J. (1967) Corneal and Scleral Contact Lenses, in: Corneal and
Scleral Contact Lenses, in: 1st ed. St. Louis: Mosby, pp. 135-136.
Bland, J. M. and Altman, D. G. (1986) Statistical methods for assessing agreement between
two methods of clinical measurement, Lancet (London, England), 1 (8476), pp. 307-310.
Bogan, S. J., Waring, G. O.,3rd, Ibrahim, O., Drews, C. and Curtis, L. (1990) Classification
of normal corneal topography based on computer-assisted videokeratography, Archives of
Ophthalmology (Chicago, Ill.: 1960), 108 (7), pp. 945-949.
Borish, M. I. and Benjamin, W. J. (2006) Monocular and Binocular Subjective Refraction, in:
Benjamin, W. J. (ed.) Borish's Clinical Refraction, 3rd ed. St. Louis: Butterworth
Heinemann, Elsevier, pp. 790-872.
Boutron, I., Tubach, F., Giraudeau, B. and Ravaud, P. (2004) Blinding was judged more
difficult to achieve and maintain in nonpharmacologic than pharmacologic trials, Journal of
Clinical Epidemiology, 57 (6), pp. 543-550.
British Standards House. (BS 4274-1:2003) Visual acuity test types. Test charts for clinical
determination of distance visual acuity. Specification BS 4274-1:2003. London: UK.
Brown, B. and Yap, M. K. (1995) Differences in visual acuity between the eyes:
determination of normal limits in a clinical population, Ophthalmic & Physiological Optics:
The Journal of the British College of Ophthalmic Opticians (Optometrists), 15 (3), pp. 163-
169.
Burns, D. M., Johnston, F. M., Frazer, D. G., Patterson, C. and Jackson, A. J. (2004)
Keratoconus: an analysis of corneal asymmetry, The British Journal of Ophthalmology, 88
(10), pp. 1252-1255.
Burns, P. B., Rohrich, R. J. and Chung, K. C. (2011) The levels of evidence and their role in
evidence-based medicine, Plastic and Reconstructive Surgery, 128 (1), pp. 305-310.
Carracedo, G., Blanco, M. S., Martin-Gil, A., Zicheng, W., Alvarez, J. C. and Pintor, J.
(2016) Short-term Effect of Scleral Lens on the Dry Eye Biomarkers in Keratoconus,
Optometry and Vision Science: Official Publication of the American Academy of Optometry,
93 (2), pp. 150-157.
Carracedo, G., Serramito-Blanco, M., Martin-Gil, A., Wang, Z., Rodriguez-Pomar, C. and
Pintor, J. (2017) Post-lens tear turbidity and visual quality after scleral lens wear, Clinical &
Experimental Optometry, 100 (6), pp. 577-582.
Carracedo, G., Wang, Z., Serramito-Blanco, M., Martin-Gil, A., Carballo-Alvarez, J. and
Pintor, J. (2017) Ocular Surface Temperature During Scleral Lens Wearing in Patients with
Keratoconus, Eye & Contact Lens, 43 (6), pp. 346-351.
Cavas-Martínez, F., De la Cruz Sánchez, E., Martínez, J. N., Cañavate, F. J. F. and
Fernández-Pacheco, D. G. (2017) Diagnostic Approach of Corneal Topography Maps, in:
Alió, J. L. (ed.) Keratoconus, 1st ed. Switzerland: Springer, pp. 87-102.
231
Cavas-Martinez, F., De la Cruz Sanchez, E., Nieto Martinez, J., Fernandez Canavate, F. J.
and Fernandez-Pacheco, D. G. (2016) Corneal topography in keratoconus: state of the art,
Eye and Vision (London, England), 3, pp. 5-016-0036-8. e-collection 2016.
Chahal, H. S., Estrada, M., Sindt, C. W., Boehme, J. A., Greiner, M. A., Nerad, J. A. et al.
(2017) Scleral Contact Lenses in an Academic Oculoplastics Clinic: Epidemiology and
Emerging Considerations, Ophthalmic Plastic and Reconstructive Surgery.
Chahal, J. S., Heur, M. and Chiu, G. B. (2017) Prosthetic Replacement of the Ocular Surface
Ecosystem Scleral Lens Therapy for Exposure Keratopathy, Eye & Contact Lens, 43 (4), pp.
240-244.
Chaudhary, M., Kandel, H. and Adhikari, P. (2017) Visual outcome in Keratoconus with
spherical rigid gas permeable contact lens, Journal of Institute of Medicine, 39 (3), pp. 8-11.
Christie, C. l. (1999) Therapeutic Contact Lenses, Contact Lens Anterior Eye, 22
(supplement), pp. S20-A25.
Chung, C. W., Santim, R., Heng, W. J. and Cohen, E. J. (2001) Use of SoftPerm contact
lenses when rigid gas permeable lenses fail, The CLAO Journal: Official Publication of the
Contact Lens Association of Ophthalmologists, Inc, 27 (4), pp. 202-208.
Cohen, E. J. (2011) Complications of Contact Lens Wear, in: Krachmer JH, Mannis MJ,
Holland EJ (ed.) Cornea Fundamentals, Diagnosis and Management, 3rd ed. USA: Mosby
Elsevier, pp. 1231-1241.
Cotsarelis, G., Cheng, S. Z., Dong, G., Sun, T. T. and Lavker, R. M. (1989) Existence of
slow-cycling limbal epithelial basal cells that can be preferentially stimulated to proliferate:
implications on epithelial stem cells, Cell, 57 (2), pp. 201-209.
Cramer, D. (1998) Fundamental statistics for social research Step–by–step calculations and
computer techniques using SPSS for Windows. 1st ed. London, New York: Routledge.
Critchfield, J. W., Calandra, A. J., Nesburn, A. B. and Kenney, M. C. (1988) Keratoconus: I.
Biochemical studies, Experimental Eye Research, 46 (6), pp. 953-963.
Davis, L. J., Schechtman, K. B., Wilson, B. S., Rosenstiel, C. E., Riley, C. H., Libassi, D. P.
et al. (2006) Longitudinal changes in visual acuity in keratoconus, Investigative
Ophthalmology & Visual Science, 47 (2), pp. 489-500.
Daxer, A. and Fratzl, P. (1997) Collagen fibril orientation in the human corneal stroma and
its implication in keratoconus, Investigative Ophthalmology & Visual Science, 38 (1), pp.
121-129.
del Barrio, J. L. A., Montiel, F. A. and Alió, J. L. (2017) Surgical Correction of Keratoconus:
Different Modalities of Keratoplasty and Their Clinical Outcomes, in: Alio, J. L. (ed.)
Keratoconus
Recent Advances in Diagnosis and Treatment, 1st ed. Switzerland: Springer, pp. 265-287.

232
Diaz-Uriarte, R. (2002) Incorrect analysis of crossover trials in animal behaviour research,
Animal Behaviour, 63 (4), pp. 815-8.22.
Doane, P. D. and Seward, L. D. (2011) Measuring skewness. A forgotten statistic? Journal of
Statistics Education, 19 (2).
Downie, L. E. and Lindsay, R. G. (2015) Contact lens management of keratoconus, Clinical
& Experimental Optometry, 98 (4), pp. 299-311.
Dua, H. S., Faraj, L. A., Said, D. G., Gray, T. and Lowe, J. (2013) Human corneal anatomy
redefined: a novel pre-Descemet's layer (Dua's layer), Ophthalmology, 120 (9), pp. 1778-
1785.
Duncan, J. K., Belin, M. W. and Borgstrom, M. (2016a) Assessing progression of
keratoconus: novel tomographic determinants, Eye and Vision (London, England), 3, pp. 6-
016-0038-6. e-Collection 2016.
Duncan, J. K., Belin, M. W. and Borgstrom, M. (2016b) Assessing progression of
keratoconus: novel tomographic determinants, Eye and Vision (London, England), 3, pp. 6-
016-0038-6. e-Collection 2016.
Edrington, T. B., Barr, J. T., Zadnik, K., Davis, L. J., Gundel, R. E., Libassi, D. P. et al.
(1996) Standardized rigid contact lens fitting protocol for keratoconus, Optometry and Vision
Science: Official Publication of the American Academy of Optometry, 73 (6), pp. 369-375.
Edrington, T. B., Gundel, R. E., Libassi, D. P., Wagner, H., Pierce, G. E., Walline, J. J. et al.
(2004) Variables affecting rigid contact lens comfort in the collaborative longitudinal
evaluation of keratoconus (CLEK) study, Optometry and Vision Science: Official Publication
of the American Academy of Optometry, 81 (3), pp. 182-188.
Edrington, T. B., Szczotka, L. B., Barr, J. T., Achtenberg, J. F., Burger, D. S., Janoff, A. M.
et al. (1999) Rigid contact lens fitting relationships in keratoconus. Collaborative
Longitudinal Evaluation of Keratoconus (CLEK) Study Group, Optometry and Vision
Science: Official Publication of the American Academy of Optometry, 76 (10), pp. 692-699.
Edwards, M., McGhee, C. N. and Dean, S. (2001) The genetics of keratoconus, Clinical &
Experimental Ophthalmology, 29 (6), pp. 345-351.
Efron, N. (1997a) Clinical application of grading scales for contact lens complications,
Optician, 213 (5604), pp. 26-34.
Efron, N. (1998) Grading scales for contact lens complications, Ophthalmic & Physiological
Optics: The Journal of the British College of Ophthalmic Opticians (Optometrists), 18 (2),
pp. 182-186.
Efron, N. (1997b) Contact lens-induced conjunctival, Optician, 213 (5591), pp. 22-27.
Efron, N. (1996) Contact lens-induced corneal staining, Optician, 212 (5558), pp. 18-26.
233
Efron, N., Morgan, P. B. and Katsara, S. S. (2001) Validation of grading scales for contact
lens complications, Ophthalmic & Physiological Optics: The Journal of the British College
of Ophthalmic Opticians (Optometrists), 21 (1), pp. 17-29.
Efron, N., Pritchard, N., Brandon, K., Copeland, J., Godfrey, R., Hamlyn, B. et al. (2011) A
survey of the use of grading scales for contact lens complications in optometric practice,
Clinical & Experimental Optometry, 94 (2), pp. 193-199.
Ehsaei, A., Chisholm, C. M., MacIsaac, J. C., Mallen, E. A. and Pacey, I. E. (2011) Central
and peripheral visual performance in myopes: contact lenses versus spectacles, Contact Lens
& Anterior Eye: The Journal of the British Contact Lens Association, 34 (3), pp. 128-132.
Elliott, D. B. (2006) Contrast Sensitivity and Glare Testing, in: Benjamin, W. J. (ed.) 2nd ed.
St Louise: Butterworth Heinemann, Elsevier, pp. 247-288.
Ertan, A. and Colin, J. (2007) Intracorneal rings for keratoconus and keratectasia, Journal of
Cataract and Refractive Surgery, 33 (7), pp. 1303-1314.
Ertan, A. and Muftuoglu, O. (2008) Keratoconus clinical findings according to different age
and gender groups, Cornea, 27 (10), pp. 1109-1113.
Esco, M. A., Wang, Z., McDermott, M. L. and Kurpakus-Wheater, M. (2001) Potential role
for laminin 5 in hypoxia-mediated apoptosis of human corneal epithelial cells, Journal of Cell
Science, 114 (Pt 22), pp. 4033-4040.
Esen, F. and Toker, E. (2017) Influence of Apical Clearance on Mini-Scleral Lens Settling,
Clinical Performance, and Corneal Thickness Changes, Eye & Contact Lens, 43 (4), pp. 230-
235.
Estil, S., Primo, E. J. and Wilson, G. (2000) Apoptosis in shed human corneal cells,
Investigative Ophthalmology & Visual Science, 41 (11), pp. 3360-3364.
Estrada, A. V., Diez, P. S. and Alio, J. (2017) Keratoconus Grading and Its Therapeutic
Implications, in: Alio, J. L. (ed.) Keratoconus, Essentials in Ophthalmology, 1st ed.
Switzerland: Springer International Publishing, pp. 177-184.
Fadel, D. and Kramer, E. (2019) Potential contraindications to scleral lens wear, Contact
Lens & Anterior Eye: The Journal of the British Contact Lens Association, 42 (1), pp. 92-
103.
Fatima, T., Acharya, M. C., Mathur, U. and Barua, P. (2010) Demographic profile and visual
rehabilitation of patients with keratoconus attending contact lens clinic at a tertiary eye care
centre, Contact Lens & Anterior Eye: The Journal of the British Contact Lens Association, 33
(1), pp. 19-22.
Fatt, I. (1996) New physiological paradigms to assess the effect of lens oxygen
transmissibility on corneal health, The CLAO Journal: Official Publication of the Contact
Lens Association of Ophthalmologists, Inc, 22 (1), pp. 25-29.
234
Fatt, I. (1986) Some comments on methods used for measuring oxygen permeability (Dk) of
contact lens materials, The CLAO Journal: Official Publication of the Contact Lens
Association of Ophthalmologists, Inc, 12 (1), pp. 36-38.
Feder, R. S. and Gan, T. J. (2011) Noninflammatory ectatic disorders, in: Krachmer JH,
Mannis MJ, Holland EJ (ed.) Cornea, 3rd ed. St Louis: Mosby Elsevier, pp. 865-878.
Ferris, F. L.,3rd, Kassoff, A., Bresnick, G. H. and Bailey, I. (1982) New visual acuity charts
for clinical research, American Journal of Ophthalmology, 94 (1), pp. 91-96.
Fink, B. A., Sinnott, L. T., Wagner, H., Friedman, C., Zadnik, K. and CLEK Study Group
(2010) The influence of gender and hormone status on the severity and progression of
keratoconus, Cornea, 29 (1), pp. 65-72.
Freegard, T. J. (1997) The physical basis of transparency of the normal cornea, Eye (London,
England), 11 (Pt 4) (Pt 4), pp. 465-471.
Galvis, V., Sherwin, T., Tello, A., Merayo, J., Barrera, R. and Acera, A. (2015) Keratoconus:
an inflammatory disorder? Eye (London, England), 29 (7), pp. 843-859.
Gandolfi, S. A., Cimino, L., Sangermani, C., Ungaro, N., Mora, P. and Tardini, M. G. (2005)
Improvement of spatial contrast sensitivity threshold after surgical reduction of intraocular
pressure in unilateral high-tension glaucoma, Investigative Ophthalmology & Visual Science,
46 (1), pp. 197-201.
Gasset, A. R., Hinson, W. A. and Frias, J. L. (1978) Keratoconus and atopic diseases, Annals
of Ophthalmology, 10 (8), pp. 991-994.
Gemoules, G. (2008) A novel method of fitting scleral lenses using high resolution optical
coherence tomography, Eye Cont Lens, 34 (2), pp. 80-83.
Georgiou, T., Funnell, C. L., Cassels-Brown, A. and O’Connor, R. (2004) Influence of ethnic
origin on the incidence of keratoconus and associated atopic disease in Asians and white
patients, Eye (London, England), 18 (4), pp. 379-383.
Giacomin, N. T., Netto, M. V., Torricelli, A. A., Marino, G. K., Bechara, S. J., Espindola, R.
F. et al. (2016) Corneal Collagen Cross-linking in Advanced Keratoconus: A 4-Year Follow-
up Study, Journal of Refractive Surgery (Thorofare, N.J.: 1995), 32 (7), pp. 459-465.
Giasson, C. J., Morency, J., Melillo, M. and Michaud, L. (2017) Oxygen Tension Beneath
Scleral Lenses of Different Clearances, Optometry and Vision Science: Official Publication
of the American Academy of Optometry, 94 (4), pp. 466-475.
Gifford, P., Alharbi, A. and Swarbrick, H. A. (2011) Corneal thickness changes in hyperopic
orthokeratology measured by optical pachymetry, Investigative Ophthalmology & Visual
Science, 52 (6), pp. 3648-3653.
Ginsburg, A. P. (1984) A new contrast sensitivity vision test chart, American Journal of
Optometry and Physiological Optics, 61 (6), pp. 403-407.

235
Gomes, J. A., Rapuano, C. J., Belin, M. W., Ambrosio, R., Jr and Group of Panellists for the
Global Delphi Panel of Keratoconus and Ectatic Diseases (2015) Global Consensus on
Keratoconus Diagnosis, Cornea, 34 (12), pp. e38-9.
Gordon, M. O., Schechtman, K. B., Davis, L. J., McMahon, T. T., Schornack, J. and Zadnik,
K. (1998) Visual acuity repeatability in keratoconus: impact on sample size. Collaborative
Longitudinal Evaluation of Keratoconus (CLEK) Study Group, Optometry and Vision
Science: Official Publication of the American Academy of Optometry, 75 (4), pp. 249-257.
Gordon-Shaag, A., Millodot, M., Essa, M., Garth, J., Ghara, M. and Shneor, E. (2013) Is
consanguinity a risk factor for keratoconus? Optometry and Vision Science: Official
Publication of the American Academy of Optometry, 90 (5), pp. 448-454.
Gordon-Shaag, A., Millodot, M., Kaiserman, I., Sela, T., Barnett Itzhaki, G., Zerbib, Y. et al.
(2015) Risk factors for keratoconus in Israel: a case-control study, Ophthalmic &
Physiological Optics: The Journal of the British College of Ophthalmic Opticians
(Optometrists), 35 (6), pp. 673-681.
Gordon-Shaag, A., Millodot, M., Shneor, E. and Liu, Y. (2015) The genetic and
environmental factors for keratoconus, BioMed Research International, 2015, pp. 795738.
Gorskova, E. N. and Sevost'ianov, E. N. (1998) Epidemiology of keratoconus in the Urals,
Vestnik Oftalmologii, 114 (4), pp. 38-40.
Goto, E., Ishida, R., Kaido, M., Dogru, M., Matsumoto, Y., Kojima, T. et al. (2006) Optical
aberrations and visual disturbances associated with dry eye, The Ocular Surface, 4 (4), pp.
207-213.
Griffiths, M., Zahner, K., Collins, M. and Carney, L. (1998) Masking of irregular corneal
topography with contact lenses, The CLAO Journal: Official Publication of the Contact Lens
Association of Ophthalmologists, Inc, 24 (2), pp. 76-81.
Gullon, M. and Schock, S. E. (1991) Soft contact lens visual performance: a multicentre
study, Optometry and Vision Science : Official Publication of the American Academy of
Optometry, 68 (2), pp. 96-103.
Gumus, K., Gire, A. and Pflugfelder, S. C. (2011) The impact of the Boston ocular surface
prosthesis on wavefront higher-order aberrations, American Journal of Ophthalmology, 151
(4), pp. 682-690.e2.
Gundel, R. E., Libassi, D. P., Zadnik, K., Barr, J. T., Davis, L., McMahon, T. T. et al. (1996)
Feasibility of fitting contact lenses with apical clearance in keratoconus, Optometry and
Vision Science: Official Publication of the American Academy of Optometry, 73 (12), pp.
729-732.
Hammerstein, W. (1972) Keratoconus concurrent in identical twins, Ophthalmologica.
Journal International D'Ophtalmologie. International Journal of Ophthalmology. Zeitschrift
Fur Augenheilkunde, 165 (5), pp. 449-452.

236
Hanna, C., Bicknell, D. S. and O'Brien, J. E. (1961) Cell turnover in the adult human eye,
Archives of Ophthalmology (Chicago, Ill.: 1960), 65, pp. 695-698.
Hartstein, J. and Becker, B. (1970) Research into the pathogenesis of keratoconus. A new
syndrome: low ocular rigidity, contact lenses, and keratoconus, Archives of Ophthalmology,
84 (6), pp. 728-729.
Hashemi, H., Khabazkhoob, M., Jafarzadehpur, E., Emamian, M. H., Shariati, M. and
Fotouhi, A. (2012) Contrast sensitivity evaluation in a population-based study in Shahroud,
Iran, Ophthalmology, 119 (3), pp. 541-546.
Haynes, R. B., Sackett, D. L., Guyatt, G. H. and Tugwell, P. (2006) The tactics of performing
therapeutic trials, in: The tactics of performing therapeutic trials, in: Clinical Epidemiology;
How to do Clinical Research, 3rd ed. Lippincott, Williams and Wilkins, pp. 123-137.
Higgins, K. E., Jaffe, M. J., Coletta, N. J., Caruso, R. C. and de Monasterio, F. M. (1984)
Spatial contrast sensitivity. Importance of controlling the patient's visibility criterion,
Archives of Ophthalmology (Chicago, Ill.: 1960), 102 (7), pp. 1035-1041.
Hill, J. F. and Rengstorff, R. H. (1974) Relationship between steeply fitted contact lens base
curve and corneal curvature changes, American Journal of Optometry and Physiological
Optics, 51 (5), pp. 340-342.
Hladun, L. and Harris, M. (2004) Contact lens fitting over intrastromal corneal rings in a
keratoconic patient, Optometry (St. Louis, Mo.), 75 (1), pp. 48-54.
Holden, B. A. and Mertz, G. W. (1984) Critical oxygen levels to avoid corneal edema for
daily and extended wear contact lenses, Investigative Ophthalmology & Visual Science, 25
(10), pp. 1161-1167.
Holden, B. A., Sweeney, D. F., Vannas, A., Nilsson, K. T. and Efron, N. (1985) Effects of
long-term extended contact lens wear on the human cornea, Investigative Ophthalmology &
Visual Science, 26 (11), pp. 1489-1501.
Holden, B. A. and Zantos, S. G. (1981) On the conformity of soft lenses to the shape of the
cornea, American Journal of Optometry and Physiological Optics, 58 (2), pp. 139-143.
Holly, F. J. and Lemp, M. A. (1977) Tear physiology and dry eyes, Survey of Ophthalmology,
22 (2), pp. 69-87.
Jalbert, I., Golebiowski, B. and Stapleton, F. (2015) Measuring Contact Lens Discomfort,
Current Ophthalmology Reports, 3.
Jaynes, J., Weissman, B. A. and Edrington, T. (2015) Predicting scleral GP lens entrapped
tear layer oxygen tensions, Contact Lens & Anterior Eye: The Journal of the British Contact
Lens Association, 38 (5), pp. 392.
Jinabhai, A., O'Donnell, C., Tromans, C. and Radhakrishnan, H. (2014) Optical quality and
visual performance with customised soft contact lenses for keratoconus, Ophthalmic &

237
Physiological Optics: The Journal of the British College of Ophthalmic Opticians
(Optometrists), 34 (5), pp. 528-539.
Jonas, J. B., Nangia, V., Matin, A., Kulkarni, M. and Bhojwani, K. (2009) Prevalence and
associations of keratoconus in rural Maharashtra in central India: the central India eye and
medical study, American Journal of Ophthalmology, 148 (5), pp. 760-765.
Jones, B. and Kenward, M. G. (2015) Design and Analysis of Crossover Trials. 3rd ed. USA:
Taylor & Francis Group.
Jones-Jordan, L. A., Walline, J. J., Sinnott, L. T., Kymes, S. M. and Zadnik, K. (2013)
Asymmetry in keratoconus and vision-related quality of life, Cornea, 32 (3), pp. 267-272.
Katz, J., Zeger, S. and Liang, K. Y. (1994) Appropriate statistical methods to account for
similarities in binary outcomes between fellow eyes, Investigative Ophthalmology & Visual
Science, 35 (5), pp. 2461-2465.
Keller, P. and van Saarloos, P. (1997) Fourier transformation of corneal topography data,
Australian and New Zealand Journal of Ophthalmology, 25 Suppl 1, pp. S53-5.
Kennedy, R. H., Bourne, W. M. and Dyer, J. A. (1986) A 48-year clinical and epidemiologic
study of keratoconus, American Journal of Ophthalmology, 101 (3), pp. 267-273.
Kenney, C. M. and Brown, D. J. (2003) The cascade hypothesis of keratoconus, Contact Lens
& Anterior Eye: The Journal of the British Contact Lens Association, 26 (3), pp. 139-146.
Key, J. E. (2007) Development of contact lenses and their worldwide use, Eye & Contact
Lens, 33 (6 Pt 2), pp. 343-5; discussion 362-3.
Kim, W. J., Helena, M. C., Mohan, R. R. and Wilson, S. E. (1999) Changes in corneal
morphology associated with chronic epithelial injury, Investigative Ophthalmology & Visual
Science, 40 (1), pp. 35-42.
Kılıç, A., del Barrio, J. L. A. and Estrada, A. V. (2017) Intracorneal Ring Segments: Types,
Indications and Outcomes, in: Alio, J. L. (ed.) Keratoconus Recent Advances in Diagnosis
and Treatment, 1st ed. Switzerland: Springer, pp. 195-208.
Kojima, R., Caroline, P., Graff, T., Kinoshita, B., Copilevitz, L., Achong-Coan, R. et al.
(2013) Eye Shape and Scleral Lenses. Understanding the shape of the anterior segment can
help improve success with lens design and fitting. Contact Lens Spectrum, 28 (April 2013,),
pp. 38-43.
Kok, J. H. and Visser, R. (1992) Treatment of ocular surface disorders and dry eyes with high
gas-permeable scleral lenses, Cornea, 11 (6), pp. 518-522.
Koppen, C., Kreps, E. O., Anthonissen, L., Van Hoey, M., Dhubhghaill, S. N. and
Vermeulen, L. (2017) Scleral Lenses Reduce the Need for Corneal Transplants in Severe
Keratoconus, American Journal of Ophthalmology.
238
Korb, D. R., Finnemore, V. M. and Herman, J. P. (1982) Apical changes and scarring in
keratoconus as related to contact lens fitting techniques, Journal of the American Optometric
Association, 53 (3), pp. 199-205.
Krachmer, J. H., Feder, R. S. and Belin, M. W. (1984) Keratoconus and related
noninflammatory corneal thinning disorders, Survey of Ophthalmology, 28 (4), pp. 293-322.
Kymes, S. M., Walline, J. J., Zadnik, K., Gordon, M. O. and Collaborative Longitudinal
Evaluation of Keratoconus study group (2004) Quality of life in keratoconus, American
Journal of Ophthalmology, 138 (4), pp. 527-535.
Kymes, S. M., Walline, J. J., Zadnik, K., Sterling, J., Gordon, M. O. and Collaborative
Longitudinal Evaluation of Keratoconus Study Group (2008) Changes in the quality-of-life of
people with keratoconus, American Journal of Ophthalmology, 145 (4), pp. 611-617.
La Hood, D. (1988) Edge shape and comfort of rigid lenses, American Journal of Optometry
and Physiological Optics, 65 (8), pp. 613-618.
Lee, S., Jung, G. and Lee, H. K. (2017) Comparison of Contact Lens Corrected Quality of
Vision and Life of Keratoconus and Myopic Patients, Korean Journal of Ophthalmology:
KJO, 31 (6), pp. 489-496.
Lema, I., Sobrino, T., Duran, J. A., Brea, D. and Diez-Feijoo, E. (2009) Subclinical
keratoconus and inflammatory molecules from tears, The British Journal of Ophthalmology,
93 (6), pp. 820-824.
Lemp, M. A. and Beuerman, R. W. (2011) Tear Film, in: Krachmer, J. H., Mannis, M. J. and
Holland, E. J. (eds.) Cornea, 3rd ed. USA: Mosby Elsevier, pp. 33-40.
Levin, K. A. (2007) Study design VII. Randomised controlled trials, Evidence-Based
Dentistry (2007) 8, 22-23., 8, pp. 22-23.
Liu, Z. and Pflugfelder, S. C. (1999) Corneal surface regularity and the effect of artificial
tears in aqueous tear deficiency, Ophthalmology, 106 (5), pp. 939-943.
Ljubimov, A. V. and Saghizadeh, M. (2015) Progress in corneal wound healing, Progress in
Retinal and Eye Research, 49, pp. 17-45.
Loft, K. R. G. and Wolffsohn, J. S. (2016) Rigid gas-permeable contact lenses for
keratoconus: lens-eye interactions and optimal fitting approach. Optometry in Practice, 17
(4), pp. 159-168.
Lopes, B. T., Ramos, I. C., Dawson, D. G., Belin, M. W. and Ambrosio, R., Jr (2016)
Detection of ectatic corneal diseases based on Pentacam, Zeitschrift Fur Medizinische Physik,
26 (2), pp. 136-142.
Lui, W. O., Edwards, M. H. and Cho, P. (2000) Contact lenses in myopia reduction - from
orthofocus to accelerated orthokeratology, Contact Lens & Anterior Eye: The Journal of the
British Contact Lens Association, 23 (3), pp. 68-76.
239
Ma, X. and Bazan, H. E. (2001) Platelet-activating factor (PAF) enhances apoptosis induced
by ultraviolet radiation in corneal epithelial cells through cytochrome c-caspase activation,
Current Eye Research, 23 (5), pp. 326-335.
Mackiewicz, Z., Maatta, M., Stenman, M., Konttinen, L., Tervo, T. and Konttinen, Y. T.
(2006) Collagenolytic proteinases in keratoconus, Cornea, 25 (5), pp. 603-610.
Maguire, L. J., Singer, D. E. and Klyce, S. D. (1987) Graphic presentation of computer-
analyzed keratoscope photographs, Archives of Ophthalmology (Chicago, Ill.: 1960), 105 (2),
pp. 223-230.
Maharana, P. K., Dubey, A., Jhanji, V., Sharma, N., Das, S. and Vajpayee, R. B. (2016)
Management of advanced corneal ectasias, The British Journal of Ophthalmology, 100 (1),
pp. 34-40.
Mandathara, P. S., Stapleton, F. J. and Willcox, M. D. P. (2017) Outcome of Keratoconus
Management: Review of the Past 20 Years' Contemporary Treatment Modalities, Eye &
Contact Lens, 43 (3), pp. 141-154.
Mangione, C. M. (2000) Version 2000 The National Eye Institute 25 item visual function
questionnaire. 1st. The National Eye Institute.
Mangione, C. M., Berry, S., Spritzer, K., Janz, N. K., Klein, R., Owsley, C. et al. (1998)
Identifying the content area for the 51-item National Eye Institute Visual Function
Questionnaire: results from focus groups with visually impaired persons, Archives of
Ophthalmology (Chicago, Ill.: 1960), 116 (2), pp. 227-233.
Mangione, C. M., Lee, P. P., Gutierrez, P. R., Spritzer, K., Berry, S., Hays, R. D. et al. (2001)
Development of the 25-item National Eye Institute Visual Function Questionnaire, Archives
of Ophthalmology, 119 (7), pp. 1050-1058.
Marsack, J. D., Parker, K. E., Pesudovs, K., Donnelly, W. J.,3rd and Applegate, R. A. (2007)
Uncorrected wavefront error and visual performance during RGP wear in keratoconus,
Optometry and Vision Science: Official Publication of the American Academy of Optometry,
84 (6), pp. 463-470.
Martinez, C. E. and Klyce, S. D. (2011) Keratometry and Topography, in: Krachmer, J. H.,
Mannis, M. J. and Holland, E. J. (eds.) Cornea, 3rd ed. USA: Mosby Elsevier, pp. 161-175.
Maseedupally, V., Gifford, P., Lum, E. and Swarbrick, H. (2013) Central and paracentral
corneal curvature changes during orthokeratology, Optometry and Vision Science: Official
Publication of the American Academy of Optometry, 90 (11), pp. 1249-1258.
Maurice, D. M. (1984) The Cornea and Sclera, in: Davson, H. (ed.) The Eye, 1st ed. USA:
Academic Press Orlando, pp. 1-158.
McMonnies, C. W. (2005) The biomechanics of keratoconus and rigid contact lenses, Eye &
Contact Lens, 31 (2), pp. 80-92.

240
McMonnies, C. W. (2016) Eye rubbing type and prevalence including contact lens 'removal-
relief' rubbing, Clinical & Experimental Optometry, 99 (4), pp. 366-372.
McMonnies, C. W. (2004) Keratoconus fittings: apical clearance or apical support? Eye &
Contact Lens, 30 (3), pp. 147-155.
Michaud, L. and Breton, L. (2018) Contact Lens Fitting Post Corneal Cross-Linking, Contact
Lens Spectrum, 33 (March 2018), pp. 30-34, 51.
Michaud, L., Samaha, D. and Giasson, C. J. (2019) Intra-ocular pressure variation associated
with the wear of scleral lenses of different diameters, Contact Lens & Anterior Eye: The
Journal of the British Contact Lens Association, 42 (1), pp. 104-110.
Michaud, L., van der Worp, E., Brazeau, D., Warde, R. and Giasson, C. J. (2012) Predicting
estimates of oxygen transmissibility for scleral lenses, Contact Lens & Anterior Eye: The
Journal of the British Contact Lens Association, 35 (6), pp. 266-271.
Mishima, S. (1968) Corneal thickness, Survey of Ophthalmology, 13 (2), pp. 57-96.
Mishima, S., Gasset, A., Klyce, S. D., Jr and Baum, J. L. (1966) Determination of tear
volume and tear flow, Investigative Ophthalmology, 5 (3), pp. 264-276.
Moodaley, L. C., Woodward, E. G., Liu, C. S., Buckley, R. J. and Bloomfield, D. S. (1994)
Life expectancy in keratoconus--correction to data used, The British Journal of
Ophthalmology, 78 (6), pp. 511.
Morgan, P. B. and Efron, N. (2006) A decade of contact lens prescribing trends in the United
Kingdom (1996-2005). Contact Lens and Anterior Eye, 29 (2), pp. 59-68.
Muller, L. J., Marfurt, C. F., Kruse, F. and Tervo, T. M. (2003) Corneal nerves: structure,
contents and function, Experimental Eye Research, 76 (5), pp. 521-542.
Muntz, A., Subbaraman, L. N., Sorbara, L. and Jones, L. (2015) Tear exchange and contact
lenses: a review, Journal of Optometry, 8 (1), pp. 2-11.
Nau, A. C. (2008) A comparison of synergeyes versus traditional rigid gas permeable lens
designs for patients with irregular corneas, Eye & Contact Lens, 34 (4), pp. 198-200.
Nejabat, M., Khalili, M. R. and Dehghani, C. (2012) Cone location and correction of
keratoconus with rigid gas-permeable contact lenses, Contact Lens & Anterior Eye: The
Journal of the British Contact Lens Association, 35 (1), pp. 17-21.
Nelson, J. D. and Cameron, J. D. (2011) The Conjunctiva. Anatomy and Physiology, in:
Krachmer, J. H., Mannis, M. J. and Holland, E. J. (eds.) Cornea, 3rd ed. USA: Mosby
Elsevier, pp. 25-32.
Nicolson, P. C. and Vogt, J. (2001) Soft contact lens polymers: an evolution, Biomaterials,
22 (24), pp. 3273-3283.

241
Nishida, T. and Saika, S. (2011) Cornea and sclera anatomy and physiology, in: Krachmer
JH, Mannis MJ, Holland EJ (ed.) Cornea, 3rd ed. USA: Mosby Elsevier, pp. 3-24.
Nixon, A. D., Barr, J. T. and VanNasdale, D. A. (2017) Corneal epithelial bullae after short-
term wear of small diameter scleral lenses, Contact Lens & Anterior Eye: The Journal of the
British Contact Lens Association, 40 (2), pp. 116-126.
O’Brart, D. (2017) Corneal Collagen Cross-Linking for Corneal Ectasias, in: Alio, J. L. (ed.)
Keratoconus
Recent Advances in Diagnosis and Treatment, 1st ed. Switzerland: Springer, pp. 219-238.
O'Donnell, C. and Maldonado-Codina, C. (2004) A hyper-Dk piggyback contact lens system
for keratoconus, Eye & Contact Lens, 30 (1), pp. 44-48.
Office for National Statistics, ONS. (2013) DC2205EW - Country of birth by ethnic group by
sex. UK: Office for National Statistics. Available from:
http://www.nomisweb.co.uk/census/2011/dc2205ew.pdf [Accessed Jan 22 2019].
Oliveira, C. M., Ferreira, A. and Franco, S. (2012) Wavefront analysis and Zernike
polynomial decomposition for evaluation of corneal optical quality, Journal of Cataract and
Refractive Surgery, 38 (2), pp. 343-356.
Owens, H. and Gamble, G. (2003) A profile of keratoconus in New Zealand, Cornea, 22 (2),
pp. 122-125.
Ozbek, Z. and Cohen, E. J. (2006) Use of intralimbal rigid gas-permeable lenses for pellucid
marginal degeneration, keratoconus, and after penetrating keratoplasty, Eye & Contact Lens,
32 (1), pp. 33-36.
Ozek, D., Kemer, O. E. and Altiaylik, P. (2018) Visual performance of scleral lenses and
their impact on quality of life in patients with irregular corneas, Arquivos Brasileiros De
Oftalmologia, 81 (6), pp. 475-480.
Ozkurt, Y. B., Sengor, T., Kurna, S., Evciman, T., Acikgoz, S., Haboğlu, M. et al. (2008)
Rose K contact lens fitting for keratoconus, Int Ophthalmol, 28 (6), pp. 395-398.
Pantanelli, S., MacRae, S., Jeong, T. M. and Yoon, G. (2007) Characterizing the wave
aberration in eyes with keratoconus or penetrating keratoplasty using a high-dynamic range
wavefront sensor, Ophthalmology, 114 (11), pp. 2013-2021.
Papas, E. B. and Schultz, B. L. (1997) Repeatability and comparison of visual analogue and
numerical rating scales in the assessment of visual quality, Ophthalmic & Physiological
Optics: The Journal of the British College of Ophthalmic Opticians (Optometrists), 17 (6),
pp. 492-498.
Parker, J. S., van Dijk, K. and Melles, G. R. (2015) Treatment options for advanced
keratoconus: A review, Survey of Ophthalmology, 60 (5), pp. 459-480.
Pearson, A. R., Soneji, B., Sarvananthan. N and Sandford-Smith, J. H. (2000) Does ethnic
origin influence the incidence or severity of keratoconus? Eye (Lond), 14 (4), pp. 625-628.

242
Pecego, M., Barnett, M., Mannis, M. J. and Durbin-Johnson, B. (2012) Jupiter Scleral
Lenses: the UC Davis Eye Center experience, Eye & Contact Lens, 38 (3), pp. 179-182.
Perry, H. D., Buxton, J. N. and Fine, B. S. (1980) Round and oval cones in keratoconus,
Ophthalmology, 87 (9), pp. 905-909.
Picot, C., Gauthier, A. S., Campolmi, N. and Delbosc, B. (2015) Quality of life in patients
wearing scleral lenses, Journal Francais D'Ophtalmologie, 38 (7), pp. 615-619.
Pihlblad, M. S. and Schaefer, D. P. (2013) Eyelid laxity, obesity, and obstructive sleep
apnoea in keratoconus, Cornea, 32 (9), pp. 1232-1236.
Pinero, D. P., Alio, J. L., Aleson, A., Escaf Vergara, M. and Miranda, M. (2010) Corneal
volume, pachymetry, and correlation of anterior and posterior corneal shape in subclinical
and different stages of clinical keratoconus, Journal of Cataract and Refractive Surgery, 36
(5), pp. 814-825.
Plowright, A. J., Maldonado-Codina, C., Howarth, G. F., Kern, J. and Morgan, P. B. (2015)
Daily disposable contact lenses versus spectacles in teenagers, Optometry and Vision
Science: Official Publication of the American Academy of Optometry, 92 (1), pp. 44-52.
Pomerance, G. N. and Evans, D. W. (1994) Test-retest reliability of the CSV-1000 contrast
test and its relationship to glaucoma therapy, Investigative Ophthalmology & Visual Science,
35 (9), pp. 3357-3361.
Porisch, E. (2007) Football players' contrast sensitivity comparison when wearing amber
sport-tinted or clear contact lenses, Optometry (St. Louis, Mo.), 78 (5), pp. 232-235.
Pouliquen, Y., Forman, M. R. and Giraud, J. P. (1981) Evaluation of the rapidity of
progression of keratoconus by a study of the relationship between age when first detected and
age at operation (author's transl), Journal Francais D'Ophtalmologie, 4 (3), pp. 219-221.
Pullum, K. W. and Buckley, R. J. (1997) A study of 530 patients referred for rigid gas
permeable scleral contact lens assessment, Cornea, 16 (6), pp. 612-622.
Pullum, K. W., Whiting, M. A. and Buckley, R. J. (2005) Scleral contact lenses: the
expanding role, Cornea, 24 (3), pp. 269-277.
Rahi, A., Davies, P., Ruben, M., Lobascher, D. and Menon, J. (1977) Keratoconus and
coexisting atopic disease, The British Journal of Ophthalmology, 61 (12), pp. 761-764.
Ramez, B., Turnbull, A. M. J., Hossain, P., Anderson, D. and Adel, B. (2017) Epidemiology
of Keratoconus, in: Alio, J. L. (ed.) Keratoconus, 1st ed. Switzerland: Springer International
Publishing, pp. 13-24.
Rapuano, C. J. (1997) Excimer laser phototherapeutic keratectomy: long-term results and
practical considerations, Cornea, 16 (2), pp. 151-157.
Rathi, V. M., Mandathara, P. S. and Dumpati, S. (2013) Contact lens in keratoconus, Indian
Journal of Ophthalmology, 61 (8), pp. 410-415.

243
Rathi, V. M., Mandathara, P. S., Taneja, M., Dumpati, S. and Sangwan, V. S. (2015) Scleral
lens for keratoconus: technology update, Clinical Ophthalmology (Auckland, N.Z.), 9, pp.
2013-2018.
Rathi, V. M., Taneja, M., Dumpati, S., Mandathara, P. S. and Sangwan, V. S. (2017) Role of
Scleral Contact Lenses in Management of Coexisting Keratoconus and Stevens-Johnson
Syndrome, Cornea, 36 (10), pp. 1267-1269.
Reeves, B. C., Wood, J. M. and Hill, A. R. (1993) Reliability of high- and low-contrast letter
charts, Ophthalmic & Physiological Optics: The Journal of the British College of Ophthalmic
Opticians (Optometrists), 13 (1), pp. 17-26.
Ricci, F., Cedranes, C. and Cerulli, L. (1998) Standardized measurement of visual acuity,
Ophthalmic Epidemiology, 5 (1), pp. 41-53.
Richer, S., Stiles, W., Statkute, L., Pulido, J., Frankowski, J., Rudy, D. et al. (2004) Double-
masked, placebo-controlled, randomized trial of lutein and antioxidant supplementation in the
intervention of atrophic age-related macular degeneration: the Veterans LAST study (Lutein
Antioxidant Supplementation Trial), Optometry (St. Louis, Mo.), 75 (4), pp. 216-230.
Robertson, D. and Cavanagh, D. H. (2011) Contact Lens Applications in Corneal Disease, in:
Krachmer, J. H., Mannis, M. J. and Holland, E. J. (eds.) Cornea, 3rd ed. USA: Mosby
Elsevier, pp. 1217-1229.
Romero-Jimenez, M., Santodomingo-Rubido, J. and Gonzalez-Meijome, J. M. (2013) An
assessment of the optimal lens fit rate in keratoconus subjects using three-point-touch and
apical touch fitting approaches with the rose K2 lens, Eye & Contact Lens, 39 (4), pp. 269-
272.
Romero-Rangel, T., Stavrou, P., Cotter, J., Rosenthal, P., Baltatzis, S. and Foster, C. S.
(2000) Gas-permeable scleral contact lens therapy in ocular surface disease, American
Journal of Ophthalmology, 130 (1), pp. 25-32.
Rosenfeld, M. (2006) Refractive Status of the Eye, in: Benjamin, W. J. (ed.) Borish's Clinical
Refraction, 2nd ed. USA: Elsevier, pp. 3-34.
Ruben, M. (1975) Contact Lens Practice. 1st ed. Baltimore: Williams and Wilkins Co.
Rubin, G. S. (2013) Visual Acuity and Contrast Sensitivity, in: Ryan, J. S. (ed.) Retina, 5th
ed. USA: Elsevier Saunders, pp. 300-306.
Rubin, G. S., Bandeen-Roche, K., Huang, G. H., Munoz, B., Schein, O. D., Fried, L. P. et al.
(2001) The association of multiple visual impairments with self-reported visual disability:
SEE project, Investigative Ophthalmology & Visual Science, 42 (1), pp. 64-72.
Rubin, G. S., Roche, K. B., Prasada-Rao, P. and Fried, L. P. (1994) Visual impairment and
disability in older adults, Optometry and Vision Science: Official Publication of the American
Academy of Optometry, 71 (12), pp. 750-760.

244
Sabesan, R., Johns, L., Tomashevskaya, O., Jacobs, D. S., Rosenthal, P. and Yoon, G. (2013)
Wavefront-guided scleral lens prosthetic device for keratoconus, Optometry and Vision
Science: Official Publication of the American Academy of Optometry, 90 (4), pp. 314-323.
Sadeghpour, N., Alishiri, A. A., Adjani, R., Khosravi, M. H., Amiri, M. A. and Sadeghpour,
O. (2015) Quantity and Quality of Vision Using Tinted Filters in Patients with Low Vision
Due to Diabetic Retinopathy, Journal of Ophthalmic & Vision Research, 10 (4), pp. 429-432.
Sawaguchi, S., Fukuchi, T., Abe, H., Kaiya, T., Sugar, J. and Yue, B. Y. (1998) Three-
dimensional scanning electron microscopic study of keratoconus corneas, Archives of
Ophthalmology, 116 (1), pp. 62-68.
Schiffman, R. M., Christianson, M. D., Jacobsen, G., Hirsch, J. D. and Reis, B. L. (2000)
Reliability and validity of the Ocular Surface Disease Index, Archives of Ophthalmology
(Chicago, Ill.: 1960), 118 (5), pp. 615-621.
Schlatter, B., Beck, M., Frueh, B. E., Tappeiner, C. and Zinkernagel, M. (2015) Evaluation of
scleral and corneal thickness in keratoconus patients, Journal of Cataract and Refractive
Surgery, 41 (5), pp. 1073-1080.
Schmedt, T., Silva, M. M., Ziaei, A. and Jurkunas, U. (2012) Molecular bases of corneal
endothelial dystrophies, Experimental Eye Research, 95 (1), pp. 24-34.
Schornack, M. M. (2015) Scleral Lenses, A literature review, Eye Contact Lens, 4 (1), pp. 3-
11.
Schulz, K. F., Altman, D. G., Moher, D. and CONSORT Group (2010) CONSORT 2010
Statement: updated guidelines for reporting parallel group randomised trials, BMC Medicine,
8 , pp. 18-7015-8-18.
Scofield-Kaplan, S. M., Dunbar, K. E., Campbell, A. A. and Kazim, M. (2017) Utility of
PROSE Device in the Management of Complex Oculoplastic Pathology, Ophthalmic Plastic
and Reconstructive Surgery, .
Secker, G. A. and Daniels, J. T. (2008) Corneal epithelial stem cells: deficiency and
regulation, Stem Cell Reviews, 4 (3), pp. 159-168.
Segal, O., Barkana, Y., Hourovitz, D., Behrman, S., Kamun, Y., Avni, I. et al. (2003) Scleral
contact lenses may help where other modalities fail, Cornea, 22 (4), pp. 308-310.
Senior, P. A. and Bhopal, R. (1994) Ethnicity as a variable in epidemiological research, BMJ
(Clinical Research Ed.), 309 (6950), pp. 327-330.
Severinsky, B., Behrman, S., Frucht-Pery, J. and Solomon, A. (2014) Scleral contact lenses
for visual rehabilitation after penetrating keratoplasty: long term outcomes, Contact Lens &
Anterior Eye : The Journal of the British Contact Lens Association, 37 (3), pp. 196-202.
Shamir, R. R., Friedman, Y., Joskowicz, L., Mimouni, M. and Blumenthal, E. Z. (2016)
Comparison of Snellen and Early Treatment Diabetic Retinopathy Study charts using a
computer simulation, International Journal of Ophthalmology, 9 (1), pp. 119-123.

245
Shandiz, J. H., Derakhshan, A., Daneshyar, A., Azimi, A., Moghaddam, H. O., Yekta, A. A.
et al. (2011) Effect of cataract type and severity on visual acuity and contrast sensitivity,
Journal of Ophthalmic & Vision Research, 6 (1), pp. 26-31.
Shapiro, M. B., Rodrigues, M. M., Mandel, M. R. and Krachmer, J. H. (1986) Anterior clear
spaces in keratoconus, Ophthalmology, 93 (10), pp. 1316-1319.
Sheedy, J. E., Bailey, I. L. and Raasch, T. W. (1984) Visual acuity and chart luminance,
American Journal of Optometry and Physiological Optics, 61 (9), pp. 595-600.
Sherwin, T., Ismail, S., Ping-Loh, I. and McGee, J. J. (2017) Histopathology (from
Keratoconus Pathology to Pathogenesis), in: Alió, J. L. (ed.) Keratoconus, 1st ed.
Switzerland: Springer International Publishing, pp. 25-41.
Sisto, D., Trojano, M., Vetrugno, M., Trabucco, T., Iliceto, G. and Sborgia, C. (2005)
Subclinical visual involvement in multiple sclerosis: a study by MRI, VEPs, frequency-
doubling perimetry, standard perimetry, and contrast sensitivity, Investigative Ophthalmology
& Visual Science, 46 (4), pp. 1264-1268.
Sloan, L. L. (1959) New test charts for the measurement of visual acuity at far and near
distances, American Journal of Ophthalmology, 48, pp. 807-813.
Smolek, M. K. and Beekhuis, W. H. (1997) Collagen fibril orientation in the human corneal
stroma and its implications in keratoconus, Investigative Ophthalmology & Visual Science,
38 (7), pp. 1289-1290.
Sonsino, J. and Mathe, D. S. (2013) Central vault in dry eye patients successfully wearing
scleral lens, Optometry and Vision Science: Official Publication of the American Academy of
Optometry, 90 (9), pp. e248-51; discussion 1030.
Sorbara, L., Chong, T. and Fonn, D. (2000) Visual acuity, lens flexure, and residual
astigmatism of keratoconic eyes as a function of back optic zone radius of rigid lenses,
Contact Lens Anterior Eye, 23 , pp. 48-52.
Sorbara, L., Maram, J., Fonn, D., Woods, C. and Simpson, T. (2010) Metrics of the normal
cornea: anterior segment imaging with the Visante OCT, Clinical & Experimental
Optometry, 93 (3), pp. 150-156.
Stapleton, F. J. Q., G., Chan, C. and Craig, J. P. (2015) The Epidemiology of Dry Eye
Disease, in: C. Chan (ed.) Dry Eye: A Practical Approach, Sydney Australia: Springer-
Verlag Berlin Heidelberg, pp. 21-29.
Stason, W. B., Razavi, M., Jacobs, D. S., Shepard, D. S., Suaya, J. A., Johns, L. et al. (2010)
Clinical benefits of the Boston Ocular Surface Prosthesis, American Journal of
Ophthalmology, 149 (1), pp. 54-61.
Steiger, A. (ed.) (1913) Die Entstehung der Spharischen Refracktionen des Menschlichen
Auges. Berlin Germany: Karger.
246
Stenstrom, S. (1948) Investigation of the variation and the correlation of the optical elements
of human eyes, American Journal of Optometry and Archives of American Academy of
Optometry, 25 (10), pp. 496-504.
Suarez, C., Madariaga, V., Lepage, B., Malecaze, M., Fournie, P., Soler, V. et al. (2018) First
Experience With the ICD 16.5 Mini-Scleral Lens for Optic and Therapeutic Purposes, Eye &
Contact Lens, 44 (1), pp. 44-49.
Sukha, A. Y. and Rubin, A. (2013) Psychophysical aspects of contrast sensitivity, S Afr
Optom, 72 (2), pp. 76-85.
Swartz, T., Marten, L. and Wang, M. (2007) Measuring the cornea: the latest developments
in corneal topography, Current Opinion in Ophthalmology, 18 (4), pp. 325-333.
Szczotka, L. B., Barr, J. T. and Zadnik, K. (2001) A summary of the findings from the
Collaborative Longitudinal Evaluation of Keratoconus (CLEK) Study. CLEK Study Group,
Optometry (St. Louis, Mo.), 72 (9), pp. 574-584.
Szczotka-Flyn, L., Benjamin, W. J. and Lowter, G. E. (2006) Patients with keratoconus and
irregular astigmatism, in: Benjamin, W. J. (ed.) Borish's Clinical Refraction, 2nd ed. St.
Louis, Missouri: Butterworth Heinemann, Elsevier, pp. 1523-1544-1558.
Tan, D. T., Pullum, K. W. and Buckley, R. J. (1995a) Medical applications of scleral contact
lenses: 1. A retrospective analysis of 343 cases, Cornea, 14 (2), pp. 121-129.
Tan, D. T., Pullum, K. W. and Buckley, R. J. (1995b) Medical applications of scleral contact
lenses: 2. Gas-permeable scleral contact lenses, Cornea, 14 (2), pp. 130-137.
Tatematsu-Ogawa, Y., Yamada, M., Kawashima, M., Yamazaki, Y., Bryce, T. and Tsubota,
K. (2008) The disease burden of keratoconus in patients' lives: comparisons to a Japanese
normative sample, Eye & Contact Lens, 34 (1), pp. 13-16.
Taylor Kulp, M. A., Raasch, T. M. and Polasky, M. (2006) Patients with Anisometropia and
aniseikonia, in: Benjamin, W. J. (ed.) Borish's Clinical Refraction, 2nd ed. UAS: Butterworth
Heinemann Elsevier, pp. 1479-1508.
Thibos, L., Himebaugh, N. L. and Coe, C. D. (2006) Wavefront refraction, in: Benjamin, W.
J. (ed.) Borish's Clinical Refraction, 2nd ed. St. Louis: Butterworth-Heinemann, pp. 765-789.
Thoft, R. A. and Friend, J. (1975) Biochemical aspects of contact lens wear, American
Journal of Ophthalmology, 80 (1), pp. 139-145.
Tsai, P. S., Dowidar, A., Naseri, A. and McLeod, S. D. (2004) Predicting time to refractive
stability after discontinuation of rigid contact lens wear before refractive surgery, Journal of
Cataract and Refractive Surgery, 30 (11), pp. 2290-2294.
Tuan, K. M. and Liang, J. (2006) Improved contrast sensitivity and visual acuity after
wavefront-guided laser in situ keratomileusis: in-depth statistical analysis, Journal of
Cataract and Refractive Surgery, 32 (2), pp. 215-220.

247
van der Worp, E., Graf, T. and Caroline, P. J. (2010) Exploring beyond the corneal borders,
Contact Lens Spectrum, 25 (6), pp. 26-32.
van der Worp, E., Bornman, D., Ferreira, D. L., Faria-Ribeiro, M., Garcia-Porta, N. and
Gonzalez-Meijome, J. M. (2014) Modern scleral contact lenses: A review, Contact Lens &
Anterior Eye: The Journal of the British Contact Lens Association, 37 (4), pp. 240-250.
van Dijk, K., Baydoun, L., Konder, R. M. and Melles, G. R. J. (2014) Contact Lenses after
Keratoplasty. What to expect and what to look for with contact lens management in post-
keratoplasty corneas. Contact Lens Spectrum, 29 (August 1, 2014), pp. 36-38, 40, 42.
Vanden Bosch, M. E. and Wall, M. (1997) Visual acuity scored by the letter-by-letter or
probit methods has lower retest variability than the line assignment method, Eye (London,
England), 11 (Pt 3) (Pt 3), pp. 411-417.
VectorVision, (2013) CSV 1000E. Greenville Ohio: Vector Vision.
VectorVision, (2013) ETDRS. Greenville Ohio: Vector Vision.
Versaci, F. and Vestri, G. (2017) Instrumentation for Diagnosis of Keratoconus, in: Alió, J. L.
(ed.) Keratoconus, 1st ed. Switzerland: Springer, pp. 53-63.
Vincent, S. J., Alonso-Caneiro, D. and Collins, M. J. (2019) The time course and nature of
corneal oedema during sealed miniscleral contact lens wear, Contact Lens & Anterior Eye:
The Journal of the British Contact Lens Association, 42 (1), pp. 49-54.
Visser, E. S., Van der Linden, B. J., Otten, H. M., Van der Lelij, A. and Visser, R. (2013)
Medical applications and outcomes of bitangential scleral lenses, Optometry and Vision
Science: Official Publication of the American Academy of Optometry, 90 (10), pp. 1078-
1085.
Visser, E. S., Visser, R. and Van Lier, H. J. (2006) Advantages of toric scleral lenses,
Optometry and Vision Science: Official Publication of the American Academy of Optometry,
83 (4), pp. 233-236.
Visser, E. S., Visser, R., van Lier, H. J. and Otten, H. M. (2007a) Modern scleral lenses part
I: clinical features, Eye & Contact Lens, 33 (1), pp. 13-20.
Visser, E. S., Visser, R., van Lier, H. J. and Otten, H. M. (2007b) Modern scleral lenses part
II: patient satisfaction, Eye & Contact Lens, 33 (1), pp. 21-25.
Visser, E. S., Wisse, R. P., Soeters, N., Imhof, S. M. and Van der Lelij, A. (2016) Objective
and subjective evaluation of the performance of medical contact lenses fitted using a contact
lens selection algorithm, Contact Lens & Anterior Eye: The Journal of the British Contact
Lens Association, 39 (4), pp. 298-306.
Wachler, B. S., Phillips, C. L., Schanzlin, D. J. and Krueger, R. R. (1999) Comparison of
contrast sensitivity in different soft contact lenses and spectacles, The CLAO Journal:
Official Publication of the Contact Lens Association of Ophthalmologists, Inc, 25 (1), pp. 48-
51.

248
Wagner, H., Barr, J. T. and Zadnik, K. (2007) Collaborative Longitudinal Evaluation of
Keratoconus (CLEK) Study: methods and findings to date, Contact Lens & Anterior Eye: The
Journal of the British Contact Lens Association, 30 (4), pp. 223-232.
Walker, M. K., Bergmanson, J. P., Miller, W. L., Marsack, J. D. and Johnson, L. A. (2016)
Complications and fitting challenges associated with scleral contact lenses: A review,
Contact Lens & Anterior Eye : The Journal of the British Contact Lens Association, 39 (2),
pp. 88-96.
Walline, J. J., Bailey, M. D. and Zadnik, K. (2000) Vision-specific quality of life and modes
of refractive error correction, Optometry and Vision Science: Official Publication of the
American Academy of Optometry, 77 (12), pp. 648-652.
Wang, Y., Rabinowitz, Y. S., Rotter, J. I. and Yang, H. (2000) Genetic epidemiological study
of keratoconus: evidence for major gene determination, American Journal of Medical
Genetics, 93 (5), pp. 403-409.
Watson, P. G. and Young, R. D. (2004) Scleral structure, organisation and disease. A review,
Experimental Eye Research, 78 (3), pp. 609-623.
Watts, A. and Colby, K. (2017) Contact Lenses for Keratoconus, in: Alió, J. L. (ed.)
Keratoconus, 1st ed. Switzerland: Springer, pp. 187-194.
Weber, S. P., Hazarbassanov, R. M., Nasare, A., Gomes, J. A. P. and Hofling-Lima, A. L.
(2017) Conjunctival impression cytology evaluation of patients with dry eye disease using
scleral contact lenses, Contact Lens & Anterior Eye: The Journal of the British Contact Lens
Association, 40 (3), pp. 151-156.
Weed, K. H., McGhee, C. N. and MacEwen, C. J. (2005) Atypical unilateral superior
keratoconus in young males, Contact Lens & Anterior Eye: The Journal of the British
Contact Lens Association, 28 (4), pp. 177-179.
Wei, R. H., Khor, W. B., Lim, L. and Tan, D. T. (2011) Contact lens characteristics and
contrast sensitivity of patients with keratoconus, Eye & Contact Lens, 37 (5), pp. 307-311.
Wellek, S. and Blettner, M. (2012) On the proper use of the crossover design in clinical trials:
part 18 of a series on evaluation of scientific publications, Deutsches Arzteblatt International,
109 (15), pp. 276-281.
West, S. K., Rubin, G. S., Broman, A. T., Munoz, B., Bandeen-Roche, K. and Turano, K.
(2002) How does visual impairment affect performance on tasks of everyday life? The SEE
Project. Salisbury Eye Evaluation, Archives of Ophthalmology (Chicago, Ill.: 1960), 120 (6),
pp. 774-780.
Williams, C. E. (1960)
An interpretation of contact lens variables and a resultant keratoconus technique. , J Am
Optom Assoc, 31 (8), pp. 613-616.
Williamson, A. and Hoggart, B. (2005) Pain: a review of three commonly used pain rating
scales, Journal of Clinical Nursing, 14 (7), pp. 798-804.

249
Wilson, S. E., He, Y. G., Weng, J., Li, Q., McDowall, A. W., Vital, M. et al. (1996)
Epithelial injury induces keratocyte apoptosis: hypothesized role for the interleukin-1 system
in the modulation of corneal tissue organization and wound healing, Experimental Eye
Research, 62 (4), pp. 325-327.
Wilson, S. E. and Klyce, S. D. (1991a) Advances in the analysis of corneal topography,
Survey of Ophthalmology, 35 (4), pp. 269-277.
Wilson, S. E. and Klyce, S. D. (1991b) Quantitative descriptors of corneal topography. A
clinical study, Archives of Ophthalmology (Chicago, Ill.: 1960), 109 (3), pp. 349-353.
Wilson, S. E., Lin, D. T. and Klyce, S. D. (1991) Corneal topography of keratoconus,
Cornea, 10 (1), pp. 2-8.
Wirth, R. J., Edwards, M. C., Henderson, M., Henderson, T., Olivares, G. and Houts, C. R.
(2016) Development of the Contact Lens User Experience: CLUE Scales, Optometry and
Vision Science: Official Publication of the American Academy of Optometry, 93 (8), pp. 801-
808.
Wittig-Silva, C., Whiting, M., Lamoureux, E., Lindsay, R. G., Sullivan, L. J. and Snibson, G.
R. (2008) A randomized controlled trial of corneal collagen cross-linking in progressive
keratoconus: preliminary results, Journal of Refractive Surgery (Thorofare, N.J.: 1995), 24
(7), pp. S720-5.
Wojcik, K. A., Blasiak, J., Szaflik, J. and Szaflik, J. P. (2014) Role of biochemical factors in
the pathogenesis of keratoconus, Acta Biochimica Polonica, 61 (1), pp. 55-62.
Wolffsohn, J. S., Naroo, S. A., Christie, C., Morris, J., Conway, R., Maldonado-Codina, C. et
al. (2015) Anterior eye health recording, Contact Lens & Anterior Eye : The Journal of the
British Contact Lens Association, 38 (4), pp. 266-271.
Woodward, E. G. (1989) Contact lenses in abnormal ocular conditions: keratoconus. in:
Phillips, A. J. and Stone, J. (eds.) Contact Lenses. 2nd ed. London: Butterworths, pp. 753.
Woodward, E. G. (1981) Keratoconus: maternal age and social class, The British Journal of
Ophthalmology, 65 (2), pp. 104-107.
Wu, Y., Tan, Q., Zhang, W., Wang, J., Yang, B., Ma, W. et al. (2015) Rigid gas-permeable
contact lens related life quality in keratoconic patients with different grades of severity,
Clinical & Experimental Optometry, 98 (2), pp. 150-154.
Yan, P., Kapasi, M., Conlon, R., Teichman, J. C., Yeung, S., Yang, Y. et al. (2017) Patient
comfort and visual outcomes of mini-scleral contact lenses, Canadian Journal of
Ophthalmology. Journal Canadien D'Ophtalmologie, 52 (1), pp. 69-73.
Yeh, T. N., Green, H. M., Zhou, Y., Pitts, J., Kitamata-Wong, B., Lee, S. et al. (2013) Short-
term effects of overnight orthokeratology on corneal epithelial permeability and
biomechanical properties, Investigative Ophthalmology & Visual Science, 54 (6), pp. 3902-
3911.

250
Zadnik, K., Barr, J. T., Edrington, T. B., Everett, D. F., Jameson, M., McMahon, T. T. et al.
(1998) Baseline findings in the Collaborative Longitudinal Evaluation of Keratoconus
(CLEK) Study, Investigative Ophthalmology & Visual Science, 39 (13), pp. 2537-2546.
Zadnik, K., Barr, J. T., Edrington, T. B., Nichols, J. J., Wilson, B. S., Siegmund, K. et al.
(2000) Corneal scarring and vision in keratoconus: a baseline report from the Collaborative
Longitudinal Evaluation of Keratoconus (CLEK) Study, Cornea, 19 (6), pp. 804-812.
Zadnik, K., Barr, J. T., Steger-May, K., Edrington, T. B., McMahon, T. T., Gordon, M. O. et
al. (2005) Comparison of flat and steep rigid contact lens fitting methods in keratoconus,
Optometry and Vision Science: Official Publication of the American Academy of Optometry,
82 (12), pp. 1014-1021.
Zadnik, K., Mannis, M. J., Johnson, C. A. and Rich, D. (1987) Rapid contrast sensitivity
assessment in keratoconus, American Journal of Optometry and Physiological Optics, 64 (9),
pp. 693-697.
Zadnik, K. and Mutti, D. O. (1987) Contact lens fitting relation and visual acuity in
keratoconus, American Journal of Optometry and Physiological Optics, 64 (9), pp. 698-702.
Zadnik, K., Mutti, D. O., Friedman, N. E. and Adams, A. J. (1993) Initial cross-sectional
results from the Orinda Longitudinal Study of Myopia, Optometry and Vision Science:
Official Publication of the American Academy of Optometry, 70 (9), pp. 750-758.
Zadnik, K., Steger-May, K., Fink, B. A., Joslin, C. E., Nichols, J. J., Rosenstiel, C. E. et al.
(2002) Between-eye asymmetry in keratoconus, Cornea, 21 (7), pp. 671-679.
Zaki, V. (2017) A non-surgical approach to the management of exposure keratitis due to
facial palsy by using mini-scleral lenses, Medicine, 96 (6), pp. e6020.
Zhou, A. J., Kitamura, K. and Weissman, B. A. (2003) Contact lens care in keratoconus,
Contact Lens & Anterior Eye: The Journal of the British Contact Lens Association, 26 (4),
pp. 171-174.

251
Appendix
Appendix I
A. Participant Information
The Eye Department
Central Middlesex Hospital
Acton Lane
London NW10 7NS
Participant Information
Investigation of the performance of Scleral and Corneal Rigid Gas Permeable (RGP)
contact lenses in participants with keratoconus and other irregular cornea disorders
You are being invited to take part in a research study comparing different types of contact lenses for a condition
called keratoconus. Before you decide it is important for you to understand why the research is being done and
what it will involve. Please take time to read the following information and ask any questions before deciding
whether or not you wish to take part.
Introduction
The cornea is the transparent layer at the front of the eye. The cornea's shape should be regular for good vision.
Keratoconus is a condition in which the cornea gradually develops an irregular shape. This causes reduced
vision which cannot be effectively corrected by spectacles and soft contact lenses. The usual management of
keratoconus is Corneal RGP contact lenses (corneal lenses). Sometimes corneal lenses work well, but in other
cases wearers can develop discomfort and scarring of the cornea.
For many years people who experience problems with corneal lenses have been fitted with a different type of
lens, called scleral lenses. These are larger than corneal lenses and sit on the sclera (the white part of the eye) so
that they completely bridge over the cornea. Scleral lenses can be more comfortable and are thought to reduce
the risk of scarring of the cornea.
The Aim of the Research
The aim of this research is to compare the performance of scleral and corneal lenses in adults with keratoconus
who usually wear corneal lenses.
We want to discover whether modern scleral lenses should be considered not only if problems occur with corneal
lenses, but potentially as a lens of first choice in the management of keratoconus and related conditions.
What would taking part involve?
If you decide to take part in this research, you will be given additional information and be asked to sign a
consent form. You are free to withdraw any time without giving a reason. A decision to take part, withdraw or
not to take part, will not affect the level of care and treatment you receive.
During the trial you will wear a pair of corneal lenses and a pair of scleral lenses, one after the other. We will
decide (randomly) which pair you start with. We will ask you to attend for a fitting appointment so that both
types can be fitted, ordered, and manufactured.

252
During the collection session these lenses would both be assessed in your eyes and detailed training and
instructions in lens handling will be given.
After 6-8 weeks you will return to wearing your own original lenses for a period of one month after which you
will wear the other type of experimental lenses for 6-8 weeks.
After each 6-8 weeks period of experimental lens wear we will check your eyes and vision and a quality of life
questionnaire will be completed.
Your involvement in the study is anticipated to last for approximately 6-7 months.
Please note that compared with a new contact lens wearer, you will need 2-3 more appointments than would
usually be expected.
During the period of the study you will be able to contact the investigator Mr Levit directly (details below) if
you have any questions or concerns.
What are the possible advantages or disadvantages?
An advantage is that you will be able to try different types of contact lenses and keep any that work well for
you.
It is not anticipated that you will be at any disadvantage or suffer any risk from this study, as these lenses are of
high quality and are CE marked as well as approved for clinical use by the American Food and Drug Agency
(FDA). These lenses are used in specialist contact lens practice and are routinely fitted to patients with
keratoconus and other irregular corneal disorders.
If for any reason you pull out of the research, for example due to health issues unrelated to your eyes, the
research team would retain research data collected and continue to use it confidentially.
Please note all information received from you will be held until the publication of the doctoral thesis in 2017
and will be handled in a confidential manner and stored at the hospital premises and on a password protected
computer in an environment locked when not occupied.
At the completion of the study you may obtain a summary of the anonymous results from the Institute of
Optometry website: www.ioo.org.uk. Any participants who do not have web access can contact the researchers
for a paper version.
This study is being completed as part of a Professional Doctorate in Optometry at London South Bank
University and the Institute of Optometry. It has been reviewed and ethically approved by NHS Integrated
Research Ethics Committee, the London South Bank University Research Ethics Committee and the Institute of
Optometry Research Ethics Committee.
If you have a concern about any aspect of this study, you should ask to speak with the researcher (details below)
who will do his best to answer your questions.
Alex Levit Bsc. (Hons) FCOptom (CL CVP)
The Eye Department,
Central Middlesex Hospital.
Acton Lane
London NW10 7NS
Mobile 07813160631
e mail: [email protected]
If you wish for any further information regarding this study or have any complaints about the way you have
been dealt with during the study or other concerns you can contact: Professor Bruce Evans who is an Academic
Supervisor for this study, on 0207 7407 4183 or email [email protected].
Finally, if you remain unhappy and wish to complain formally, you can contact the Chair of the University
Research Ethics Committee, by phone, email or write a letter to: Professor Nicola Crichton
London south Bank University

253
103 Borough Road
London SE1 0AA
phone 02078156742, email [email protected]
Participants can also contact the Patients Advisory Liaison Service (PALS) 02084532569.
B. Participant Informed Consent
Corneal RGP contact lenses Versus Scleral RGP contact lenses for the
irregular cornea (e.g., keratoconus)
Invitation to Participate
You have been invited to participate in this study because you have keratoconus and habitually wear corneal
rigid Gas Permeable (RGP) contact lenses (corneal lenses). If you are a suitable candidate it is up to you to
decide whether or not to take part. If you do, you will be given this information sheet to keep and be asked to
sign a consent form. You are still free to withdraw anytime without giving a reason up to the time when the
dissertation is submitted. A decision to take part, withdraw or not to take part, will not affect the level of care
and treatment you receive. Before you decide I would like you to understand why the research is being done and
what it would involve for you. One of our team will go through the information sheet with you and answer any
questions you may have. This should take no longer than 10-15 minutes. Please talk to others about the study if
you wish.
Part 1 tells you about the purpose of this study and what will happen to you if you choose to take part.
Part 2 gives you more detailed information about the conduct of the study.
After the verbal discussion please take time to read the information below and to contact Mr Levit (details
below) if you have any further questions about this research.
What is the purpose of the study?
The aim is to investigate the visual quality and vision related quality of life whilst wearing scleral contact lenses
compared with corneal lenses in participants with keratoconus (or a similar condition) who wear corneal lenses.
Our objective is to discover whether modern scleral lenses should be considered not only as a problem solver
but potentially as a lens of first choice in the management of keratoconus and related conditions.
Why have I been invited?
You have been invited because you have keratoconus and wear corneal lenses successfully.

254
Do I have to take part?
It is up to you to decide whether to join the study. We will describe the study and go through this information
sheet. If you agree to take part, we will then ask you to sign a consent form. You are free to withdraw at any
time, without giving a reason. This would not affect the standard of care you receive.
What will happen to me if I take part?
If you are willing to participate your involvement in the study will last for approximately 8 months. The number
of participants required to complete this research is 30. Please note that the frequency and nature of the check-
ups is similar to that required in the first 6 months of wearing a new type of contact lens. The differences are
that the fitting appointments will last longer because two sorts of contact lens are being fitted and that additional
measurements of visual quality of life will be performed. This will involve completing a form prior to the
beginning of the study and at the end of the two lens wearing periods. This form takes 10-15 minutes to
complete.
You will be invited for contact lens fitting as well as the measurement of your vision with the contact lenses
worn. The whole procedure will last approximately 40-60 minutes. Two types of lenses will be ordered, the
corneal lens and the scleral lens.
A few weeks later the new lenses and your vision with them will be checked and you will be instructed on how
to insert, remove contact lenses and given one pair to wear. A review 3 weeks after this initial fitting
appointment will be booked which will take approximately 30 minutes.
Please note that this is a randomized experiment, which means that neither you nor the researcher will know
which lenses you will be given to start with. If your practitioner needs to find out for clinical reasons he can do
so. The type of lens given to you will be randomly allocated with a 50% chance of receiving the experimental
scleral lens and 50% the control corneal lens. The reason for this way of researching is because sometimes we
do not know which way of treating patients is best. To find out, we need to compare different treatments. We
put people into groups and give each group a different treatment. The results are compared to see if one is better.
To try to make sure the groups are the same to start with, each patient is put into a group by chance (randomly).
After 8-12 weeks of wear you will be asked to return to wearing the contact lenses that you wore before starting
in the research. About a month later you will be given the other research lenses to use for 8-12 weeks, this is the
crossover stage. The reason for the break between the different types of lenses is so that any effects of the first
type of lens are cleared before you start the new treatment.
What are the possible disadvantages and risks of taking part?
It is not anticipated that you will be at any disadvantage or suffer any risk specifically from taking part in this
study, as the lenses used are of the highest quality and are CE marked. There is a slight risk of complications
associated with contact lens wear, but as far as we know there is not any additional risk with the types of contact
lenses used in the research compared with the contact lenses you already wear. The opportunity of trying two
different types of lenses will allow you to choose which is better. But this opportunity involves more
appointments and inconvenience for you and this is a disadvantage.
What are the possible benefits of taking part?
255
If you prefer the comfort and vision of the experimental or the control lens you will be able to keep these lenses
for your continued personal use. Otherwise it is unlikely that you will gain any personal benefit from
participating in this research. However, the information gained from this research will help develop effective
approaches for people who suffer from visual difficulties due to Keratoconus or similar conditions.
What happens when the research study stops?
If you wish you will be allowed to keep the lenses used in the research free of charge and will continue to be
reviewed in the contact lens clinic in the regular manner.
Will my taking part in the study be kept confidential?
All information received from you will be handled in a confidential manner and stored in the hospital records
and on a password protected computer in an environment locked when not occupied. Only the researcher and
research supervisors will have direct access to the information. Any reference to you will be coded into a
number and your name and contact details will not be taken away from the hospital. The research data will be
held until the publication of the doctoral thesis, which is anticipated in 2017.
This study is being completed as part of a Professional Doctorate degree in Optometry at London South Bank
University and the Institute of Optometry. It has been reviewed and ethically approved by NHS Integrated
Research Ethics Committee and the London South Bank University Research Ethics Committee. We will follow
ethical and legal practice and all information about you will be handled in confidence. The details are included
in Part 2.
If you wish for any further information regarding this study or if you have a concern about any aspect of this
study, you should ask to speak with the researcher who will do his best to answer your questions.
Alex Levit Bsc. (Hons) FCOptom (CL CVP)
The Eye Department,
Central Middlesex Hospital.
Acton Lane
London NW10 7NS
Mobile 07813160631
e mail: [email protected]
What if there is a problem?
If you have a concern about any aspect of this study, you should ask to speak to the researcher who will do his
best to answer your questions.
Contact details: Alex Levit (details above)
If you have any complaints about the way you have been dealt with during the study or any possible harm you
might suffer will be addressed by the researcher Mr A. Levit, you can also contact the academic supervisor of
this research: Professor Bruce Evans on 0207 7407 4183.
If you remain unhappy and wish to complain formally, you can contact the Chair of the University Research
Ethics Committee. Details can be obtained from the university website:
http://www.lsbu.ac.uk/rbdo/external/index.shtml
Participants can also contact the Patients Advisory Liaison Service (PALS) 02084532569

256
If the information in Part 1 has interested you and you are considering participation, please read the additional
information in Part 2 before making any decision.
Part 2
What if relevant new information becomes available?
Sometimes new information becomes available about the treatment being studied. If this happens, your research
optometrist will tell you and discuss whether you should continue in the study. If you decide not to carry on,
your research optometrist will make arrangements for your care to continue. If you decide to continue in the
study, he may ask you to sign an agreement outlining the discussion he had with you.
Or your research optometrist might consider you should withdraw from the study. He will explain the reasons
and arrange for your care to continue.
Or if the study is stopped for any other reason, we will tell you and arrange your continuing care.
What will happen if I do not want to carry on with the study?
You are free to withdraw from the study at any time up to the time of the completion of the dissertation.
Information collected about you to the point when you decide to withdraw, will be retained and used by the
researcher. The information collected will not identify you in any way, confidentiality and anonymity will be
maintained at all times. You are free to withdraw at any time during the study without your normal standard of
care being affected.
Are there circumstances and/or reasons under which my participation in the trial may be terminated?
Your participation is unlikely to be terminated unless you do not comply with the study protocol of the correct
wear and care of your contact lenses and / or do not attend the required check up appointment without a good
reason for non-attendance. You will be allowed to keep the contact lenses prescribed during the study even if
your participation is terminated for any reason.
Harm
In the unlikely event that something does go wrong and you are harmed during the research and this is due to
someone’s negligence then you may have grounds for a legal action for compensation, but you may have to pay
your legal costs. The normal National Health Service complaints mechanisms will still be available to you.
Will my taking part in this study be kept confidential?
During the approximately 9 months of your participation, the data of visual performance and visual quality of
life will be collected during the consultations in the contact lens clinic.
For the proper maintenance of anonymity and confidentiality all research information will be recorded on
specially designed separate records which would be stored on a password protected computer. Hard copies
would be kept in the Hospital in a locked cabinet, with no access except for the research personnel. These
records will contain no personal data but only allocated research numbers.
The clinical information contained in these research records may be later added to the patients Hospital records.
257
The data will be used for the writing of the doctoral thesis and in professional publications. The only details
used will be the participants' gender, age and allocated research serial number.
Involvement of the General Practitioner/Family doctor (GP)
Your GP will be informed about the treatment you receive in the usual manner.
What will happen to the results of the research study?
The results of the research will be published in professional literature in a manner which does not in any way
identify the participants. Should you wish, you may have access to copies of the publications relating to this
research.
Who is organizing and funding the research?
This study is done as a part of professional doctorate in Optometry at the department of Allied Health Sciences
at the School of Health and Social Care London South Bank University and the Institute of Optometry. The
researcher and the Institutions involved have no conflicts of interests in this research.
Who has reviewed the study?
All research in the NHS is looked at by independent group of people, called a Research Ethics Committee, to
protect your interests.
Further information and contact details
1. General and specific information about research. Please see part 1 of this document or contact Mr A. Levit.
2. Advice as to whether they should participate: see information of personnel below as well as your own GP.
3. Emergency contact during the study: Mr A. Levit. Mobile 07813160631.
4. Other personnel: Sister in charge 020 8963 7195 Mon - Fri 9-5
Professor Bruce Evans on 0207 7407 4183.
Chair of the University Research Ethics Committee: http://www.lsbu.ac.uk/rbdo/external/index.shtml

258
C. Consent form
The Eye Department
Central Middlesex Hospital
Acton Lane
London NW10 7NS
CONSENT FORM
Title of Project: Corneal RGP vs. Scleral RGP contact lenses for the irregular cornea
Name of Researcher: Mr A. Levit
Ethics ref No: 11122014
Please initial box
1. I confirm that I have read and understand the information sheet dated 1/12/14 version 1, for the above study. I
have had the opportunity to consider the information, ask questions and have had these answered satisfactorily.
2. I understand that my participation is voluntary and that I am free to withdraw at any time without giving any
reason, without my medical care or legal rights being affected.
3. I understand that relevant sections of my medical notes and data collected during the study may be looked at
by responsible individuals from the London South Bank University, the Ophthalmology department at Central
Middlesex Hospital, from regulatory authorities or from the NHS Trust, and where it is relevant to my taking
part in this research. I give permission for these individuals to have access to my records.
4. I agree to my GP being informed of my participation in the study.
5. I agree to take part in the above study.
Name of Patient ..................................... Date.............. Signature............................
Name of researcher................................. Date................. Signature........................
CC copies to: 1. participant 2. participant's medical records.

259
D. Participant Information on Receipt of Contact Lenses
In this research we aim to investigate the effect of contact lenses on your vision and visual quality of life. These
lenses are of high quality and were fitted and manufactured with great precision to fit your eyes and correct their
optical anomalies.
If you are new to contact lenses or wore a different type of lenses, please note that a period of adaptation of 3-5
days may be required. If no contraindications are found by your contact lens practitioner, you may be able to wear
these lenses daily from 10-16 hours.
Contact lens wear is safe and comfortable if proper hygiene and lens care are followed meticulously. However, in
the unlikely event of developing any of the following symptoms;
-Eyes stinging, burning, itching (irritation), or other eye pain
-Lenses are less comfortable than when first placed on eye
-Feeling of something in the eye such as a foreign body or scratched area
-Excessive watering (tearing) of the eyes
-Unusual eye secretions
-Redness of the eyes
-Reduced sharpness of vision (poor visual acuity)
-Blurred vision, rainbows, or halos around objects
-Sensitivity to light (photophobia)
-Unusually dry eyes
REMOVE YOUR LENSES IMMEDIATELY.
If the discomfort or problem stops, then look closely at the lens. If the lens is in any way damaged, DO NOT put
the lens back on your eye. Place the lens in the storage case and contact Mr Levit. If the lens has dirt, an eyelash,
or other foreign objects on it, or the problem stops and the lens appears undamaged, you should thoroughly clean,
rinse and disinfect the lens; then reinsert it. If the problem continues, you should IMMEDIATELY remove it and
contact Mr Levit.
If you have any questions regarding any aspect of contact lens wear contact Mr Levit at; The Ophthalmology
Department, Central Middlesex Hospital, Acton Lane
London NW10 7NS. Tel 07813160631, e mail [email protected]
Please read and learn the written contact lens handling instructions enclosed. Please view the video of contact lens
handling and care on http://icdlens.com/icd-a&r-video.html
E. Handling and Care of Scleral Contact Lenses
You will be given full instruction by Alex Levit and plenty of time to practice handling under his supervision.
This document is intended to reinforce the verbal instructions that you receive.
As with all contact lenses, the maintenance of proper hygiene procedures is essential. The surface of gas permeable
scleral lenses is subject to deterioration with use and handling. Please take good care of your lenses in order to
maintain the optimal surface integrity as long as possible.

260
• Always wash your hands with antibacterial soap and dry your hands thoroughly with lint free towel or tissue,
before inserting or removing your lenses.
• Take care not to catch the lens or your eye with your fingernails – keep them short
• Work over a clean, flat surface, put in the plug if you are working over a wash basin
• Use saline solution to rinse your lenses – do not rinse them with tap water as this can cause serious eye infections.
• Remember Contact lens case hygiene is important as infections can occur due to poor lens case cleaning. The
rubber insert in the lens case and all rubber or plastic lens applicators should be scrubbed with a dedicated clean
toothbrush on a weekly basis with cooled boiled water and then left to air dry. Do not use soap in case it is not
fully rinsed away. The lens case should be replaced with a new one at least every six months
• To minimise the possibility of mixing your lenses up, it is a good practice to always insert and remove the same
lens first.
• Prior to lens application, remove the lens from its soaking / conditioning solution, rinse it well with non-
preserved saline.
• Fill the lens with non-preserved sterile saline and insert (see handling instructions below).
Lens Application / Insertion
• Rinse the lens well with preservative-free saline, never use tap water.
• Place the lens, bowl side up, on the large plunger supplied with your lenses.
• Fill the bowl of the lens completely with preservative-free sterile saline. It is important that the saline is non-
preserved and sterile as it will remain in contact with the cornea through the day. Tear circulation with a scleral
lens is minimal therefore, preservatives or contaminants in the bowl of the lens remain in contact with the cornea
for the duration of wear and this increases the chance of toxicity, infection and inflammation.
• Lean forward with your face parallel to the floor. Hold both lids open wide.
• Look at the hole in the plunger while guiding the lens on to the eye
• Apply the lens to the surface of the eye, take care to spill as little saline in the bowl of the lens as possible, in
order to avoid trapping an air bubble.
• If an air bubble gets under the lens, remove, rinse, refill with saline and reapply the lens as instructed above.
Lens removal:
Since the scleral lens is large, the capillary forces which hold the lens on the eye are powerful. Removal is always
best done by first lifting the edge to eliminate this force. Attempting to pull the lens from the centre will create
negative pressure and will rarely be successful.
• First, moisten the small plunger with a few drops of saline solution.

261
• Place the small plunger on the lens at the lower edge at the 6 o’clock position. (Near the bottom), so that the
plunger is just inside the lens.
• Lift or tilt the lens of the eye and remove. You may have to gently push on the eye or eyelid next to the lens to
break the seal.
Method 1. Plunger Method 2. Fingers
Alternatively, the lens may be removed as follows (Method 2);
Look down, but keep your chin upwards
• Take your upper lid on the side nearest your nose with your index finger so that the lid is above the upper rim
of the lens
• Press downwards, then tighten the lid by drawing your finger towards the temple. This action will push the lid
underneath the edge of the lens, relieving the suction. Now, look up to eject the lens from your eye and catch it
with your other hand, or do this over a table covered with a towel to prevent the lens from falling onto the floor
Lens Care and cleaning:
Always use the care system recommended to you by your contact lens practitioner
• Once the lens is removed from your eye, rinse the lens with saline
• Apply your contact lens cleaning solution (Eyeye Crystal cleaner) to the front and back surfaces, while gently
rubbing between your fingers
• Rinse again with saline until all of the cleaning solution is removed
• Store in fresh conditioning solution (Boston or Menicare plus) in the case provided taking care not to introduce
any water or residual cleaning solution into the case.
• Once every 2 weeks, after cleaning, soak in Progent (protein cleaner) for 30 minutes. Than in saline for 30-60
seconds. Clean once again with cleaning solutions, rinse well and store overnight in the conditioning solution.
General Information Regarding Scleral Lens Wear
If you are new to contact lenses or wore a different type of lenses, please note that a period of adaptation of 3-5
days may be required. If no contraindications are found by your contact lens practitioner, you may be able to wear
these lenses daily from 10-16 hours.
Contact lens wear is safe and comfortable if proper hygiene and lens care are followed meticulously. However, in
the unlikely event of developing any of the following symptoms;

262
-Eyes stinging, burning, itching (irritation), or other eye pain
-Lenses are less comfortable than when first placed on eye
-Feeling of something in the eye such as a foreign body or scratched area
-Excessive watering (tearing) of the eyes
-Unusual eye secretions
-Redness of the eyes
-Reduced sharpness of vision (poor visual acuity)
-Blurred vision, rainbows, or halos around objects
-Sensitivity to light (photophobia)
-Dry eyes
REMOVE YOUR LENSES IMMEDIATELY
If the discomfort or problem stops, then look closely at the lens. If the lens is in any way damaged, DO NOT put
the lens back on your eye. Place the lens in the storage case and contact Mr Levit. If the lens has dirt, an eyelash,
or other foreign objects on it, or the problem stops and the lens appears undamaged, you should thoroughly clean,
rinse and disinfect the lens; then reinsert it. If the problem continues, you should IMMEDIATELY remove it and
contact Mr Levit.
Contact Details
If you have any questions regarding any aspect of contact lens wear contact Mr Levit at;
The Ophthalmology Department
Central Middlesex Hospital
Acton Lane London NW10 7NS
Tel 07813160631, email; [email protected]
Appendix II
Appendix II. A. Baseline clinical information
Baseline information CRF
Scleral Vs Corneal RGP lenses
Date: Examiner: A. Levit
General Information
Participant's Serial Nr.
DOB Age
Gender
Occupation

263
Race
Condition Information
Cornea
irregularity type
OD
KC Nipple PMD Globus Post KC Graft DLK
KC oval Graft PK
KC mixed INTACS
Cornea
irregularity type
OS
KC Nipple Graft DLK
KC oval Graft PK
KC mixed INTACS
Diagnosis age:
Pachymetry: OD OS
K max OD OS
Surface Regularity Indices: OD OS
Lens Information of participants own lens
OD OS
Lens type Type
Material
Spherical
toric quadrant Type
Materi
al
Spherical
toric quadran
t
Lens parameters OZR OZD TD BVP edge custom OZR OZD TD BVP edge custom
Lens fit central bearing Alignment
clearance bearing alignment clearance
Lens fit periph inadequate Optimal
excessive inadequate Optimal
excessive
Lens Condition 0-
10
0-2
unaccept
able
3-4 Poor 5-6
adequate
7-8
good
9-10
New
1-2
unaccep
table
3-4
Poor
5-6
adequat
e
7-8
good
9-10
New

264
Comfort 0-10 1 unbearable,
10 cannot feel
1 unbearable,
10 cannot feel
Vision 0-10 1 very poor, 10 excellent 1 very poor, 10 excellent
Visual Acuity
Over refraction
sphere
cyl
axis
VA
Eye
OD OS
Visual Measures 1. 2. 3. Ø 1. 2. 3. Ø
LogMAR BCVA
CSF Row A 3cpd
CSF Row B 6cpd
CSF Row C 12cpd
CSF Row D 18cpd
Clinical findings on lens removal. Efron Scale from 0-5 in 0.1 steps
Condition OD OS
Blepharitis
MGD
SLK
Corneal Infiltrates
Corneal Ulcer

265
Endothelial Polymegathism
Endothelial Blebs
Corneal Distortion
Conjunctival Redness
Bulbar
Limbal
Conjunctival NaFl Staining
Bulbar
Limbal
Tarsal Conjunctival Papillae
Corneal NaFl Staining
central
Peripheral (limbal)
Limbal Vascularisation
Epithelial Microcysts
Corneal Oedema
Detail of QOL Questionnaire (1-10 scale in steps of 1)
Question
No Score
Appendix
Q No Score
1 A1
2 A2
3 A3
4 A4
5 A5
6 A6
7 A7
8 A8
9 A9

266
10 A10
11 A11a
12 A11b
13 A12
14 A13
15 Total
15a
15b
15c
16
16a
17
18
19
20
21
22
23
24
25
Total
Appendix II.B. Data collection CRF
Data Collection (naive data collector) CRF
Scleral Vs Corneal RGP lenses
Date: Examiner:
Participant's Serial No
Details
Average Days per week: Hours per day:

267
Eye OD OS
Visual Acuity
Over-Refraction
Sphere
Cylinder (-ve)
Axis
VA
Comfort 0-10 1 unbearable,
10 cannot feel
1 unbearable,
10 cannot feel
Vision 0-10 1 very poor, 10
excellent (perfect)
1 very poor, 10
excellent (perfect)
Visual Quality Outcome Measures
Eye OD OS
1. 2. 3. Ø 1. 2. 3. Ø
LogMAR BCVA
CSF A 3cpd
CSF B 6cpd
CSF C 12cpd
CSF D 18cpd
Clinical Findings on Lens Removal from 0-5 in 0.1 steps

268
Eye OD OS
Blepharitis
MGD
SLK
Corneal Infiltrates
Corneal Ulcer
Endothelial Polymegathism
Endothelial Blebs
Corneal Distortion
Conjunctival Redness
Bulbar
Limbal
Conjunctival Staining
Bulbar
Limbal
Tarsal Conjunctival Papillae
Corneal Staining
central
Peripheral (limbal)
Limbal Vascularisation
Epithelial Microcysts
Corneal Oedema

269
Appendix II. C. Fitted Lens Information
Patient Serial No Randomised to Fitter
Corneal RGP Scleral RGP
Lens Type RK2 date Material Zenlens date Material
OD OS OD OS
Type
OZR
OZR2 (toric)
SAG
Diameter
Power (Sphere)
Power (cyl)
Axis (negative cyl)
LCD (limbal sag)
APS (edge spec)
Edge lift
Custom Quadrant fit
Comfort 1-10
Vision 1-10
Over refract Sphere
OR cylinder
OR axis
VA
No fitted for best fit
No exchanged

270
Appendix III
Appendix III. A. Good clinical practice certificate

271
Appendix III.B. IRAS approval certificate

272

273
Appendix IV
Appendix IV. A. Database Libre Office, data entry, extraction and analysis
Data Entry Methodology
Introduction
The data generated by the experiments needs to be entered into a computer for statistical analysis, and it is
important to use a tool that makes it as simple as possible to enter the data correctly. The best tool to use for this
purpose is a database, using a graphical user interface to enter data into the underlying database tables.
We developed a simple database using the open-source LibreOffice office productivity software suite
(https://www.libreoffice.org/). This software provides a relational database (named ‘Base’), and includes tools
to create forms and queries – these are respectively windows that can be used to view and enter data, and
database commands that extract specific subsets of the data in the system. The various forms in the database are
managed by a small amount of programming using LibreOffice’s Basic macro language. This is required to
configure the forms to display the correct data when they are opened.
LibreOffice Base is very flexible – it can be configured so that the underlying data and forms/queries are stored
in separate files, and it can be used as the front-end to manipulate data stored in other vendors’ databases.
However, in this case the scope of the database is small enough that it makes sense to keep everything in a
single file – including the data, forms and queries. The database can be opened simply by double-clicking on
the file (provided the LibreOffice software is installed).
The LibreOffice suite is available for a wide range of platforms, including all recent versions of Microsoft
Windows, Apple Macintoshes, and common Linux distributions. Therefore, the database file is portable
between different systems simply by copying the file from one computer to another – and no special installation
is required to configure the database on a new machine.
Database Purpose
The function of the database is to simplify data entry, not to analyse the data. However, although visual acuity
data is entered into the database in Snellen format, the data is stored in the underlying tables using its equivalent
LogMAR value. This allows the user to enter data in the more intuitive Snellen format, and automatically
convert it to the LogMAR format which is more useful for statistical analysis.
Where possible the database uses drop-down selection boxes and tick boxes for data entry rather than allowing
manual typing. This reduces as far as possible the opportunity for typographical errors in the entered data.
Drop-down selections are used for fields such as Gender, Race, and lens fit information. Tick boxes are used
for all questions that are essentially Boolean in nature – i.e. yes/no or true/false data items.
Database Workflow
Data entry follows a simple workflow, starting from the main form used for entering data about each subject.
The data entry fields are laid out to match the format of the raw data captured in the handwritten forms used
during examinations.
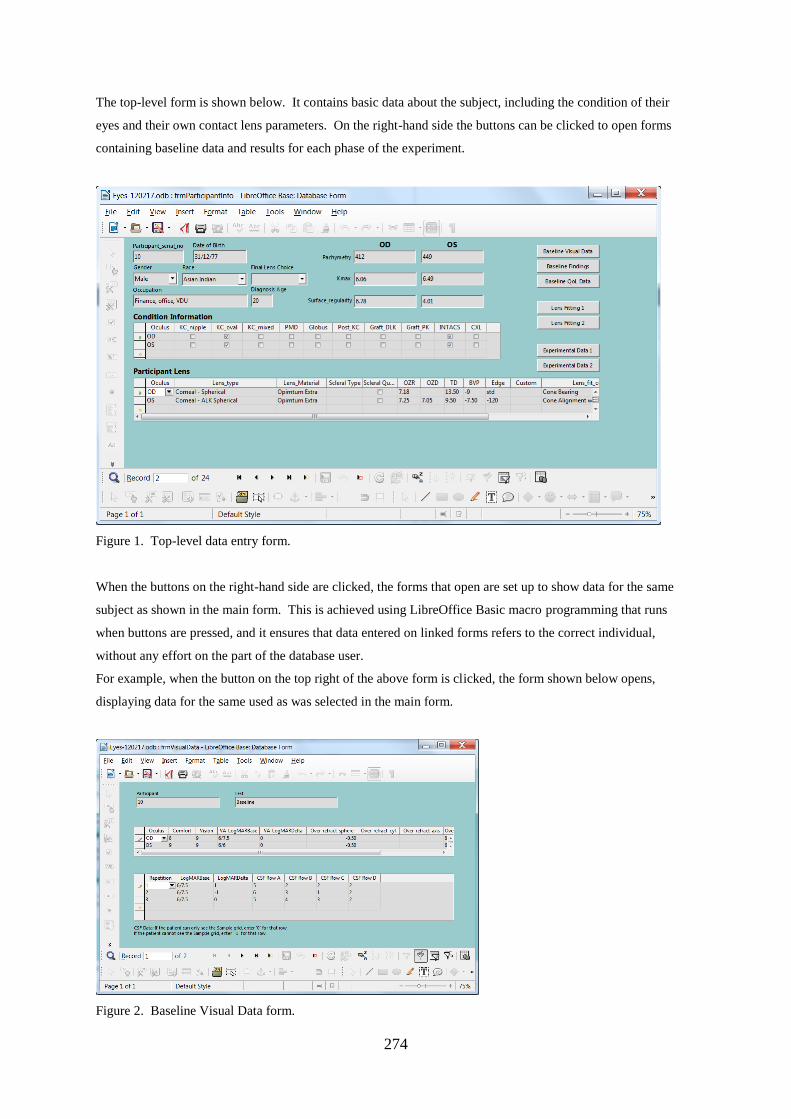
274
The top-level form is shown below. It contains basic data about the subject, including the condition of their
eyes and their own contact lens parameters. On the right-hand side the buttons can be clicked to open forms
containing baseline data and results for each phase of the experiment.
Figure 1. Top-level data entry form.
When the buttons on the right-hand side are clicked, the forms that open are set up to show data for the same
subject as shown in the main form. This is achieved using LibreOffice Basic macro programming that runs
when buttons are pressed, and it ensures that data entered on linked forms refers to the correct individual,
without any effort on the part of the database user.
For example, when the button on the top right of the above form is clicked, the form shown below opens,
displaying data for the same used as was selected in the main form.
Figure 2. Baseline Visual Data form.

275
Running Queries
Queries are run using the SQL database query language. Although this is fundamentally a text-based query
language, LibreOffice Base provides a graphical tool to automatically create the SQL commands required to
pull data out of the database. Queries can contain parameters to be entered by the user when the query runs, so a
single query can be used to extract equivalent data for different experimental phases, for example.
The figure below shows an example of the graphical tool used to create queries. The top half of the window
contains tables defined in the database, and the lines drawn between them indicate the relationships between the
tables (the key feature of this type of software, hence the name relational database). The bottom half of the
window shows the fields that will be present in the output data from this query, drawn from the three tables
included in the query. The database will automatically collate the correct data from the linked fields in the tables
to generate the result from the query.
Although the fundamental purpose of queries is to extract subsets of data from the database, some basic data
manipulation is also used. This includes:
splitting the date into separate day/month/year fields so that the date is not presented to analysis tools as a text
string that has to be processed to pull out the individual fields
Sorting the data in ascending order of participant ID.
Figure 3. Graphical tool for generating database queries.
Data Analysis
When a query is run the output is in the form of a table of data. This is copied and pasted into Excel, for
example, and it can then be saved to disk and/or used for basic analysis in Excel. Although Excel is not the
right tool for complex data analysis, some basic data manipulation is possible.
Currently an Excel spreadsheet is used for processing VFQ-25 Quality-of-Life data. An Excel template
spreadsheet has been created, and raw data from a database query is pasted into the top-left of the first
worksheet of this template. Cell calculations then flow from this data and the last worksheet of the spreadsheet
shows the average scores for each participant, with the raw answers recoded according to Version 2000 of the
VFQ-25.

276
Appendix IV. B. NEI-VFQ Spreadsheet information
QoL Spreadsheet Information
Introduction
The database contains raw data from the Quality-of-Life questionnaire, with individual answers scored in
different ranges. Reference [1] provides an algorithm for recoding these answers onto a scale of 0 to 100, and
for grouping individual questions together into “sub-scales”.
The Excel spreadsheet template “QoL Recode” is used to recode the results of Quality-of-Life questionnaire
according to reference [1]. The steps involved are as follows:
-Extract raw QoL data from the database and copy into the spreadsheet.
-Recode individual answers onto a scale of 0 to 100
-Count how many questions within each ‘sub-scale’ have been answered, so that missing answers can be
accounted for.
-Generate average scores for each ‘sub-scale’
Extracting Raw Data from the Database
The database has a query called qryQualityOfLife which is used to extract QoL data from the database. Double-
click the query to run it, and enter the experiment for which QoL data is required – one of Baseline,
Experimental_1, or Experimental_2.
Copy all the data that appears in the query results window, then paste it into the top-left cell of the first
worksheet of a new spreadsheet document created from the Excel template “QoL Recode”. This first worksheet
is called ‘Raw data’. It is important to paste the data correctly, as all calculations flow from this first page.
Recoding Individual Answers
Reference [1] defines how the scores from individual questions map onto the scale of 0 to 100. The second
worksheet in the spreadsheet (called ‘Recoded data’) implements this recoding, for individual questions.
The worksheet is split into two sections. The top section runs the recoding calculation for each question, setting
the result to zero if the answer to the question is missing (this is required as part of the algorithm specified in [1].
Accounting for Missing Answers
The lower section of the worksheet ‘Recoded data’ fills a table with one value for each question – a zero if the
data is missing for that question, and a one if the data is present. This data is used when calculating sub-scales,
so that missing data is handled correctly. The score for each sub-scale ignores missing data – i.e. the calculation
has to keep count of how many valid answers are present in each sub-scale.
Generating Average Scores
Each sub-scale score is the average of a number of individual questions – i.e. the sum of those individual scores
divided by the number of scores. The top section of the worksheet ‘Summed data’ contains the summed values,
taken from the ‘Recoded data’ worksheet.
Each cell in the top section of the worksheet contains the sum of the question scores for that sub-scale. If a
question is missing its value is zero in ‘Recoded data’, so it doesn’t affect the average. Therefore, there’s no
need to check at this point which individual questions are present.

277
The lower section of the worksheet ‘Summed data’ contains the count of valid answers present for each sub-
scale. This is done by summing the values for each sub-scale in the lower section of worksheet ‘Recoded data’
– where each cell contains a zero if the data is missing and a 1 if it’s present. Therefore, this sum of ones and
zeros adds up to the number of valid questions that make up the sub-scale.
The worksheet ‘Processed data’ pulls all the information together to give the final scores for each sub-scale. For
each sub-scale score, the worksheet checks whether there are any valid data for the sub-scale. If not, the cell is
left blank. If there is at least one valid answer, the sub-scale is calculated as the sum of the valid answers
divided by the number of valid answers.
References
[1] “The National Eye Institute 25-Item Visual Function Questionnaire (VFQ-25)”, Version 2000.
Appendix IV.C. NEI-VFQ data entry, coding and analysis
The scores from the NEI-VFQ questionnaire were entered into the specially prepared database
software as raw data, with individual answers scored in different ranges. The NEI-VFQ manual
(Mangione, 2000) provides an algorithm for recoding these answers onto a scale of 0-100, and
for grouping individual questions together into “sub-scales”.
The Excel spread sheet template “QoL Recode” was developed to recode the results of the
NEI-VFQ questionnaire according to (Mangione, 2000) as follows:
1. Extract raw QoL data from the database and copy into the spread-sheet.
2. Recode individual answers onto a scale of 0-100
3. Count how many questions within each ‘sub-scale’ have been answered, so that
missing answers can be accounted for.
4. Generate average scores for each ‘sub-scale’.
Data extraction
The database has a query called qryQualityOfLife which is used to extract NEI-FVQ data from
the database. The query is run by double-clicking it, entry of the required experimental QoL
data; one of Baseline, Experimental_1 (first lens in sequence), or Experimental_2 (second lens
in sequence). The data that appears in the query results window is copied and pasted into the
top-left cell of the first worksheet of a new spread sheet document created from the Excel
template “QoL Recode”. This first worksheet is called ‘Raw data’.
Recoding individual answers

278
Mangione (2000) defines how the scores from individual questions map onto the scale of 0-
100 (Mangione, 2000). The second worksheet in the spread-sheet (called ‘Recoded data’)
implements this recoding, for individual questions. The worksheet is split into two sections.
The top section runs the recoding calculation for each question, setting the result to zero if the
answer to the question is missing (this is required as part of the algorithm specified in Mangione
(2000).
Accounting for missing answers
The lower section of the worksheet ‘Recoded data’ fills a table with one value for each question
– a zero if the data are missing for that question, and a one if the data are present. These data
are used when calculating sub-scales, so that missing data are handled correctly. The score for
each sub-scale ignores missing data – i.e. the calculation has to keep count of how many valid
answers are present in each sub-scale.
Generating average scores
Each sub-scale score is the average of a number of individual questions (Table 4.6) – i.e., the
sum of those individual scores divided by the number of scores. The top section of the
worksheet ‘Summed data’ contains the summed values, taken from the ‘Recoded data’
worksheet. Each cell in the top section of the worksheet contains the sum of the question scores
for that sub-scale. If a question is missing its value is zero in ‘Recoded data’, so it doesn’t affect
the average. The lower section of the worksheet ‘Summed data’ contains the count of valid
answers present for each sub-scale. This is done by summing the values for each sub-scale in
the lower section of worksheet ‘Recoded data’ – where each cell contains a zero if the data are
missing and a 1 if it the data are present. Therefore, this sum of ones and zeros forms the
number of valid questions that make up the sub-scale. The worksheet ‘Processed data’ pulls all
the information together to give the final scores for each sub-scale. For each sub-scale score,
the worksheet checks whether there are any valid data for the sub-scale. If not, the cell is left
blank. If there is at least one valid answer, the sub-scale is calculated as the sum of the valid
answers divided by the number of valid answers.

279
Appendix IV. D. Table 4.7. The Efron grading scales contact lens complications (J&J
vision care institute)

280
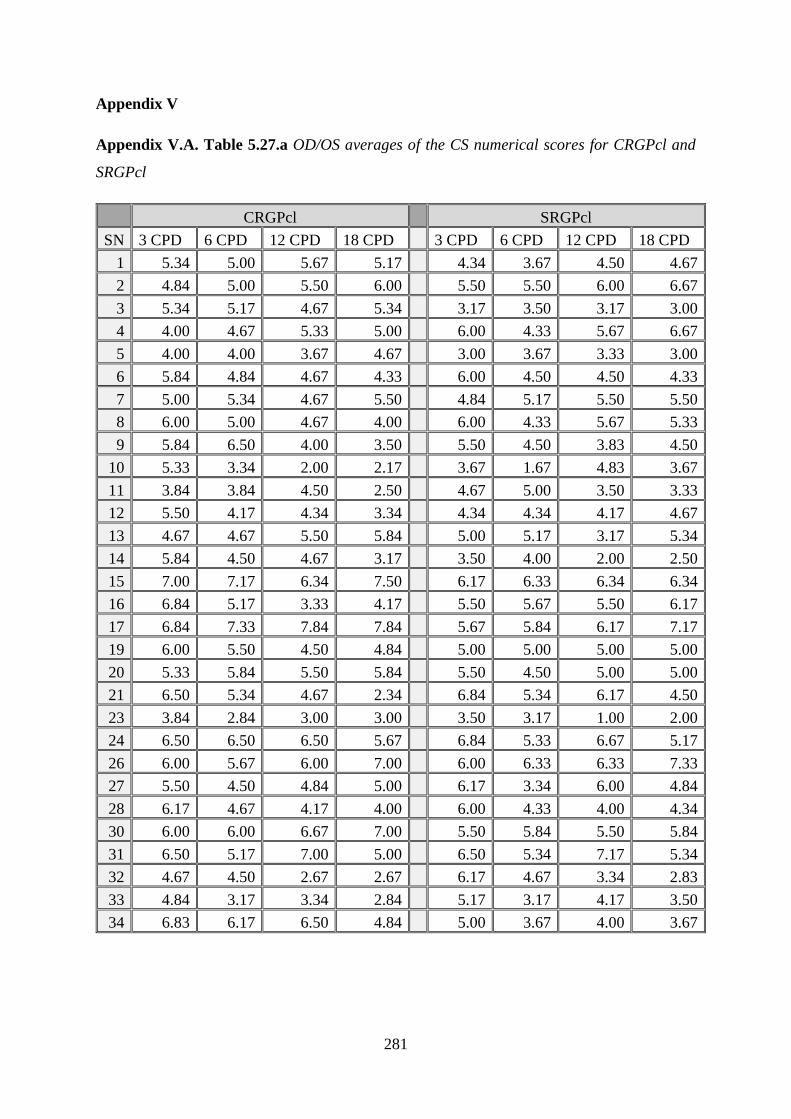
281
Appendix V
Appendix V.A. Table 5.27.a OD/OS averages of the CS numerical scores for CRGPcl and
SRGPcl
CRGPcl SRGPcl
SN 3 CPD 6 CPD 12 CPD 18 CPD 3 CPD 6 CPD 12 CPD 18 CPD
1 5.34 5.00 5.67 5.17 4.34 3.67 4.50 4.67
2 4.84 5.00 5.50 6.00 5.50 5.50 6.00 6.67
3 5.34 5.17 4.67 5.34 3.17 3.50 3.17 3.00
4 4.00 4.67 5.33 5.00 6.00 4.33 5.67 6.67
5 4.00 4.00 3.67 4.67 3.00 3.67 3.33 3.00
6 5.84 4.84 4.67 4.33 6.00 4.50 4.50 4.33
7 5.00 5.34 4.67 5.50 4.84 5.17 5.50 5.50
8 6.00 5.00 4.67 4.00 6.00 4.33 5.67 5.33
9 5.84 6.50 4.00 3.50 5.50 4.50 3.83 4.50
10 5.33 3.34 2.00 2.17 3.67 1.67 4.83 3.67
11 3.84 3.84 4.50 2.50 4.67 5.00 3.50 3.33
12 5.50 4.17 4.34 3.34 4.34 4.34 4.17 4.67
13 4.67 4.67 5.50 5.84 5.00 5.17 3.17 5.34
14 5.84 4.50 4.67 3.17 3.50 4.00 2.00 2.50
15 7.00 7.17 6.34 7.50 6.17 6.33 6.34 6.34
16 6.84 5.17 3.33 4.17 5.50 5.67 5.50 6.17
17 6.84 7.33 7.84 7.84 5.67 5.84 6.17 7.17
19 6.00 5.50 4.50 4.84 5.00 5.00 5.00 5.00
20 5.33 5.84 5.50 5.84 5.50 4.50 5.00 5.00
21 6.50 5.34 4.67 2.34 6.84 5.34 6.17 4.50
23 3.84 2.84 3.00 3.00 3.50 3.17 1.00 2.00
24 6.50 6.50 6.50 5.67 6.84 5.33 6.67 5.17
26 6.00 5.67 6.00 7.00 6.00 6.33 6.33 7.33
27 5.50 4.50 4.84 5.00 6.17 3.34 6.00 4.84
28 6.17 4.67 4.17 4.00 6.00 4.33 4.00 4.34
30 6.00 6.00 6.67 7.00 5.50 5.84 5.50 5.84
31 6.50 5.17 7.00 5.00 6.50 5.34 7.17 5.34
32 4.67 4.50 2.67 2.67 6.17 4.67 3.34 2.83
33 4.84 3.17 3.34 2.84 5.17 3.17 4.17 3.50
34 6.83 6.17 6.50 4.84 5.00 3.67 4.00 3.67
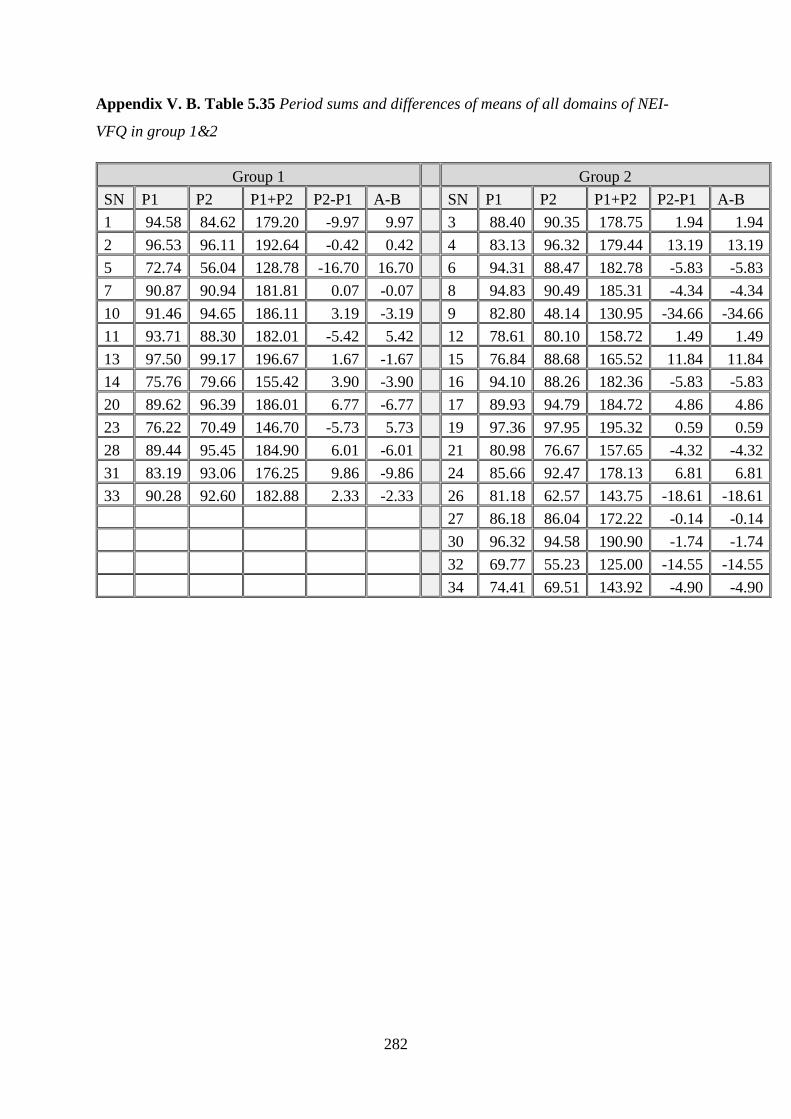
282
Appendix V. B. Table 5.35 Period sums and differences of means of all domains of NEI-
VFQ in group 1&2
Group 1 Group 2
SN P1 P2 P1+P2 P2-P1 A-B SN P1 P2 P1+P2 P2-P1 A-B
1 94.58 84.62 179.20 -9.97 9.97 3 88.40 90.35 178.75 1.94 1.94
2 96.53 96.11 192.64 -0.42 0.42 4 83.13 96.32 179.44 13.19 13.19
5 72.74 56.04 128.78 -16.70 16.70 6 94.31 88.47 182.78 -5.83 -5.83
7 90.87 90.94 181.81 0.07 -0.07 8 94.83 90.49 185.31 -4.34 -4.34
10 91.46 94.65 186.11 3.19 -3.19 9 82.80 48.14 130.95 -34.66 -34.66
11 93.71 88.30 182.01 -5.42 5.42 12 78.61 80.10 158.72 1.49 1.49
13 97.50 99.17 196.67 1.67 -1.67 15 76.84 88.68 165.52 11.84 11.84
14 75.76 79.66 155.42 3.90 -3.90 16 94.10 88.26 182.36 -5.83 -5.83
20 89.62 96.39 186.01 6.77 -6.77 17 89.93 94.79 184.72 4.86 4.86
23 76.22 70.49 146.70 -5.73 5.73 19 97.36 97.95 195.32 0.59 0.59
28 89.44 95.45 184.90 6.01 -6.01 21 80.98 76.67 157.65 -4.32 -4.32
31 83.19 93.06 176.25 9.86 -9.86 24 85.66 92.47 178.13 6.81 6.81
33 90.28 92.60 182.88 2.33 -2.33 26 81.18 62.57 143.75 -18.61 -18.61
27 86.18 86.04 172.22 -0.14 -0.14
30 96.32 94.58 190.90 -1.74 -1.74
32 69.77 55.23 125.00 -14.55 -14.55
34 74.41 69.51 143.92 -4.90 -4.90

283
Appendix V. C. Subjective comfort and vision of participants in group 1, period 1 vs period 2
C
Figure 5.43 Subjective comfort of each participant in group 1, period 1 vs period 2
Figure 5.44 Subjective comfort of each participant in group 2, period 1 vs period 2
8 8
9
7 7.5 8
9 9
7 7.5
7
9
10
9
8 8
7
10
10
9
8
10
10
9
10
10
0
1
2
3
4
5
6
7
8
9
10
1 2 5 7 10 11 13 14 20 23 28 31 33
Group 1; Individual participant's Subjective Comfort P1~vs~P2
P1 [CRGPcl] P2 [SRGPcl]
9
6
10
10
9
8
9 9 9 9 9
8
7
8
10
9.5
9
8
7 7
9
8.5
8
9 9 9
8
10
7
8 8
10
9
7
0
1
2
3
4
5
6
7
8
9
10
3 4 6 8 9 12 15 16 17 19 21 24 26 27 30 32 34
Group 2; Individual participant's Subjective Comfort P1~vs~P2
P1 [SRGP] P2 [CRGPcl]
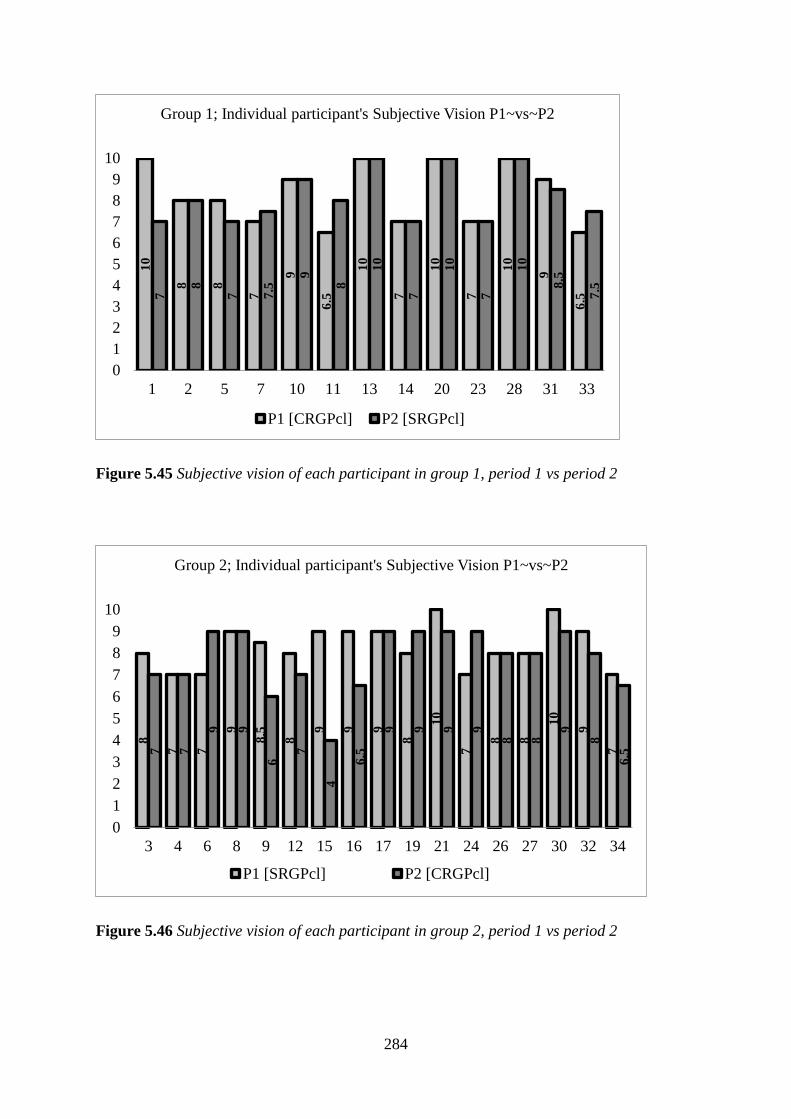
284
Figure 5.45 Subjective vision of each participant in group 1, period 1 vs period 2
Figure 5.46 Subjective vision of each participant in group 2, period 1 vs period 2
10
8 8
7
9
6.5
10
7
10
7
10
9
6.57
8
7 7.5
9
8
10
7
10
7
10
8.5
7.5
0
1
2
3
4
5
6
7
8
9
10
1 2 5 7 10 11 13 14 20 23 28 31 33
Group 1; Individual participant's Subjective Vision P1~vs~P2
P1 [CRGPcl] P2 [SRGPcl]
8
7 7
9
8.5
8
9 9 9
8
10
7
8 8
10
9
77 7
9 9
6
7
4
6.5
9 9 9 9
8 8
9
8
6.5
0
1
2
3
4
5
6
7
8
9
10
3 4 6 8 9 12 15 16 17 19 21 24 26 27 30 32 34
Group 2; Individual participant's Subjective Vision P1~vs~P2
P1 [SRGPcl] P2 [CRGPcl]

285
Appendix V. D. Table 5.40 SPC and vision CRGPcl and final lens choice
SN Comfort Vision Final lens choice
1 8 10 CRGPcl
2 8 8 SRGPcl
3 7 7 CRGPcl
4 8 7 CRGPcl
5 9 8 CRGPcl
6 4 9 SRGPcl
7 7 7 CRGPcl
8 9 9 CRGPcl
9 5 6 SRGPcl
10 7.5 9 SRGPcl
11 8 6.5 SRGPcl
12 7 7 SRGPcl
13 9 10 CRGPcl
14 9 7 CRGPcl
15 9 4 CRGPcl
16 6.5 6.5 SRGPcl
17 10 9 CRGPcl
19 10 9 CRGPcl
20 7 10 SRGPcl
21 6 9 SRGPcl
23 7.5 7 SRGPcl
24 8 9 CRGPcl
26 6 8 SRGPcl
27 7 8 CRGPcl
28 7 10 CRGPcl
30 9 9 CRGPcl
31 9 9 SRGPcl
32 7 8 SRGPcl
33 10 6.5 SRGPcl
34 9 6.5 CRGPcl

286
Appendix V. E Table 4.10. Randomisation order
Number Randomised to Comments
1 C
2 C
3 S
4 S
5 C
6 S
7 C
8 S
9 S
10 C
11 C
12 S
13 C
14 C
15 S
16 S
17 S
18 C Lost to aftercare
19 S
20 C
21 S
22 C Lost to aftercare
23 C
24 S
25 C Lost to aftercare
26 S
27 S
28 C
29 C Lost to aftercare
30 S
31 C Sequential
32 S Sequential
33 C Sequential
34 S Sequential

287
Appendix V. F. Table 4.5. Item number translation from the 51-Item field test version to the
VFQ 25 Mangione (2000).
Field Test Sub-scale Status VFQ-25 Field Test Sub-scale Status VFQ-25
1 General health S 1 29 Social Function ----- -----
2 General health A A1 30 Social Function A A9
3 General vision S 2 31 Social Function S 13
4 Expectations ----- ----- 32 Distance Vision A A8
5 Wellbeing/distress S 3 33 Distance Vision A A7
6 Wellbeing/distress ----- ----- 34 Distance Vision S 14
7 Ocular pain S 19 35 Driving (filter item) S 15
8 expectations ----- ----- 35a Driving (filter item) S 15a
9 expectations ----- ----- 35b Driving (filter item) S 15b
10 expectations ----- ----- 35c Driving S 15c
11 Wellbeing/distress S 25 36 Driving ----- -----
12 Ocular Pain S 4 37 Driving S 16
13 Wellbeing/distress ----- ----- 38 Driving S 16a*
14 General Vision A A2 39a Role limitations S 17
15 Near Vision S 5 39b Role limitations A A11a
16 Near Vision A A3 39c Well-being/distress ----- -----
17 Near Vision S 6 39d Role limitations ----- -----
18 Near Vision ----- ----- 39e Role limitations A A11b
19 Near Vision S 7 39f Role limitations S 18
20 Distance Vision S 8 40 Well-being/distress A A12
21 Distance Vision ----- ----- 41 Dependency S 20
22 Distance Vision S 9 42 Well-being/distress S 21
23 Peripheral Vision S 10 43 Well-being/distress S 22
24 Distance Vision A A6 44 Dependency ----- -----
25 Social Function S 11 45 Dependency A A13
26 Near Vision A A4 46 Dependency S 23
27 Colour Vision S 12 47 Dependency S 24
28 Near Vision A A5
Table 45. Terms: S=retained in the VFQ-25, A=retained in the appendix should be used for the
VFQ-39, -----=deleted from the VFQ-25 & VFQ-39. *=VFQ-25 item 16a was listed in previous
versions as part of the appendix of supplemental items (#A10).
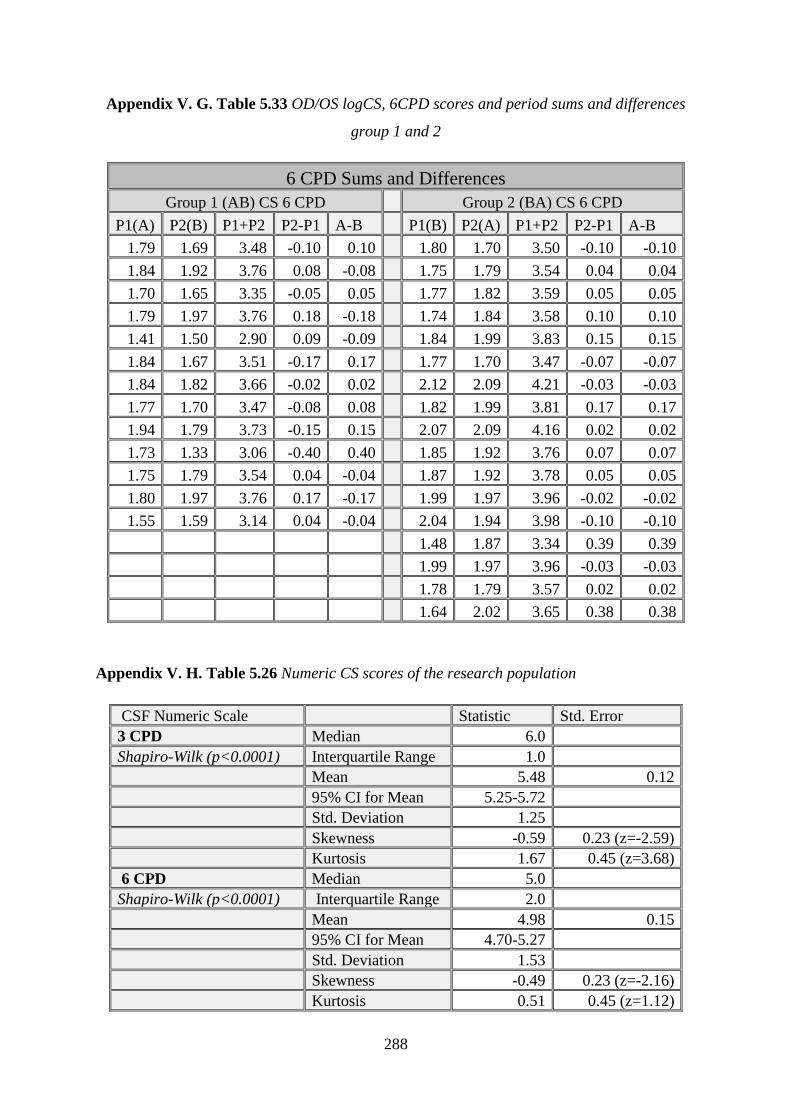
288
Appendix V. G. Table 5.33 OD/OS logCS, 6CPD scores and period sums and differences
group 1 and 2
6 CPD Sums and Differences
Group 1 (AB) CS 6 CPD Group 2 (BA) CS 6 CPD
P1(A) P2(B) P1+P2 P2-P1 A-B P1(B) P2(A) P1+P2 P2-P1 A-B
1.79 1.69 3.48 -0.10 0.10 1.80 1.70 3.50 -0.10 -0.10
1.84 1.92 3.76 0.08 -0.08 1.75 1.79 3.54 0.04 0.04
1.70 1.65 3.35 -0.05 0.05 1.77 1.82 3.59 0.05 0.05
1.79 1.97 3.76 0.18 -0.18 1.74 1.84 3.58 0.10 0.10
1.41 1.50 2.90 0.09 -0.09 1.84 1.99 3.83 0.15 0.15
1.84 1.67 3.51 -0.17 0.17 1.77 1.70 3.47 -0.07 -0.07
1.84 1.82 3.66 -0.02 0.02 2.12 2.09 4.21 -0.03 -0.03
1.77 1.70 3.47 -0.08 0.08 1.82 1.99 3.81 0.17 0.17
1.94 1.79 3.73 -0.15 0.15 2.07 2.09 4.16 0.02 0.02
1.73 1.33 3.06 -0.40 0.40 1.85 1.92 3.76 0.07 0.07
1.75 1.79 3.54 0.04 -0.04 1.87 1.92 3.78 0.05 0.05
1.80 1.97 3.76 0.17 -0.17 1.99 1.97 3.96 -0.02 -0.02
1.55 1.59 3.14 0.04 -0.04 2.04 1.94 3.98 -0.10 -0.10
1.48 1.87 3.34 0.39 0.39
1.99 1.97 3.96 -0.03 -0.03
1.78 1.79 3.57 0.02 0.02
1.64 2.02 3.65 0.38 0.38
Appendix V. H. Table 5.26 Numeric CS scores of the research population
CSF Numeric Scale Statistic Std. Error
3 CPD Median 6.0
Shapiro-Wilk (p<0.0001) Interquartile Range 1.0
Mean 5.48 0.12
95% CI for Mean 5.25-5.72 Std. Deviation 1.25 Skewness -0.59 0.23 (z=-2.59)
Kurtosis 1.67 0.45 (z=3.68)
6 CPD Median 5.0
Shapiro-Wilk (p<0.0001) Interquartile Range 2.0
Mean 4.98 0.15
95% CI for Mean 4.70-5.27 Std. Deviation 1.53 Skewness -0.49 0.23 (z=-2.16)
Kurtosis 0.51 0.45 (z=1.12)

289
12 CPD Median 5.0
Shapiro-Wilk (p=0.0001) Interquartile Range 2.0 Mean 4.89 0.18
95% CI for Mean 4.53-5.26 Std. Deviation 1.94 Skewness -0.38 0.23 (z=-1.68)
Kurtosis -0.37 0.45 (z=-0.83)
18 CPD Median 5.0
Shapiro-Wilk (p=0.0002) Interquartile Range 2.0
Mean 4.79 0.18
95% CI for Mean 4.44-5.13 Std. Deviation 1.86 Skewness -0.23 0.23 (z=-1.01)
Kurtosis -0.57 0.45 (z=-1.26)
Appendix V.I. Table 5.34 NEI-VFQ 12 domains measured in the research population
NEI-VFQ Descriptive Statistics
Shapiro-Wilk Median IQR Min Max Mean (StdDev)
General health p < 0.0001 77.50 5.00 45.00 100.00 79.59 (±12.45)
General vision p < 0.0001 80.00 20.00 30.00 100.00 82.45 (±14.37)
Ocular pain p < 0.0001 87.50 37.50 37.00 100.00 77.55 (±21.19)
Near activities p < 0.0001 91.67 18.75 50.00 100.00 87.84 (±12.89)
Distance activities p < 0.0001 91.67 20.83 50.00 100.00 87.96 (±12.38)
Social function p < 0.0001 100.00 8.33 66.67 100.00 94.56 (±9.40)
Mental health p < 0.0001 90.00 20.00 40.00 100.00 82.25 (±16.04)
Role difficulties P< 0.0001 93.75 21.88 43.75 100.00 87.88 (±14.51)
Dependency p < 0.0001 100.00 6.25 50.00 100.00 95.54 (±9.11)
Driving p < 0.0001 83.33 16.67 41.67 100.00 84.18 (±13.53)
Colour vision p < 0.0001 100.00 0.00 50.00 100.00 97.96 (±8.60)
Peripheral vision p < 0.0001 100.00 0.00 25.00 100.00 91.84 (±17.22)
Total 91.29 14.60 44.09 100.00 87.47 (±6.53)

290
Appendix V.J.
Table 5.43a Randomised demographics (*significant difference between the groups)
Measure Groups Difference
p value Group 1 Group 2
N Mean
(StdDev)
Median
(IQR)
N Mean
(StdDev)
Median
(IQR)
Gender Male 11 12
0.109 Female 2 5
Age
39.5 (14.2) 38.8 (9.3) 0.872
Age at
Diagnosis
23.2 (5.0) 20.0 (8.0) 0.363
Duration CRGPcl
wear 10.0 (22.0) 16.47 (6.63) 0.363
Black
African 3 2
0.613 Ethnicities Asian Indian 5 8
Black Afro
Caribbean 1 2
Caucasian
white 4 5
Corneal
metrics
Kmax
6.04 (0.47)
6.31 (0.59)
0.068
*Pachymetry
423.2 (45.1)
462.8 (44.7)
*0.002
SRI
1.59 (0.24)
1.47 (0.48) 0.252

291
Appendix V. K
Table 5.43b Inferential crossover statistics summary
Group 1 Group 2
Measure Mean (StdDev) Median (IQR) Mean (StdDev) Median (IQR) P
ETDRS logMAR
Treatment effect -0.01 (0.08) 0.00 (0.10) 0.563
Carryover effect 0.14 (0.27) 0.03 (0.17) 0.281
Period effect 0.0177 (0.08) 0.0006 (0.07) 0.541
CSF logCS all CPD
Treatment effect crossover -0.035 (0.215) 0.03 (0.135) 0.316
Treatment effect P1 (G1) 1.46 (0.13) 0.070
Treatment effect P1 (G2) 1.56 (0.51)
Carryover effect 2.89 (0.31) 3.15 (0.25) 0.019*
Period effect 0.05 (0.24) 0.00 (0.12) 0.711
CSF logCS 6 CPD
Treatment effect crossover -0.0285 (0.16) 0.0641 (0.14) 0.104
Treatment effect P1 (G1) 1.75 (0.17) 0.110
Treatment effect P1 (G2) 1.84 (0.16)
NEI-VFQ all Domains
Treatment effect 1.67 (10.53) -1.74 (9.23) 0.483
Carryover effect 182.0 (20.23) 178.1 (32.97) 0.245
Period effect -0.92 (1.37) -1.235 (1.98) 0.343
NEI-VFQ Ocular pain
Treatment effect 12.5 (37.5) 0.00 (25.0) 0.170
Carryover effect 175 (56.25) 150.0 (75.0) 0.263
Period effect 0.02 (0.21) 0.04 (0.16) 0.563
LSCS Treatment effect 1.0 (2.25) -1.0 (2.50) 0.002*
Carryover effect 17.0 (1.50) 16.0 (4.0) 0.183
Period effect -0.923 (±1.37) -1.235 (1.98) 0.63
LSVS
Treatment effect 0.00 (0.50) -0.50 (1.75) 0.213
Carryover effect 16.0 (4.75) 16.0 (3.25) 0.592
Period effect 0.00 (0.50) -0.50 (1.75) 0.157
Final lens choice CRGPcl 16 (53.3%)
SRGPcl 14 (46.7%)
LSCS CRGPcl CRGPcl chosen 16 (53%) Median (IQR) 9.0 (1.75)
0.009*
SRGPcl chosen 14 (46.7%) Median (IQR) 7.0 (1.54)
*Statistically significant p<0.05