a rational account of memory predicts left prefrontal activation
TRANSCRIPT

Cerebral Cortex November 2008;18:2674--2685
doi:10.1093/cercor/bhn027
Advance Access publication March 4, 2008
A Rational Account of Memory PredictsLeft Prefrontal Activation duringControlled Retrieval
Jared F. Danker, Pat Gunn and John R. Anderson
Department of Psychology and Center for the Neural Basis of
Cognition, Carnegie Mellon University, Pittsburgh, PA 15213,
USA
What is the role of the left prefrontal cortex in the controlledretrieval of learned information? We present a theory of declarativeretrieval that posits that the amount of control exerted by thisregion during retrieval is inversely proportional to 1) the frequencyand recency of previous experiences with the retrieved memoryand 2) the associative strength between the current context andthe retrieved memory. This theory is rational in the sense that itclaims that declarative retrieval is highly sensitive to the statisticalregularities in the environment. We demonstrate how our theoryproduces precise predictions of response time and neural activityduring recall and test these predictions in an experiment thatmanipulates the frequency of previous experiences and theassociative strength to the retrieval cues. Our findings suggestthat the control process performed by the left prefrontal cortexdirectly reflects the demands of the environment on memory.
Keywords: associative strength, cognitive modeling, competition, leftinferior frontal gyrus
Introduction
Controlled access to learned information is essential for the
adaptive, flexible behavior that is the hallmark of human
cognition. The ease with which information is accessed is
dependent upon both the frequency with which the in-
formation is encountered in the environment and the relevance
of the information to the current context (Anderson and
Schooler 1991). The left prefrontal cortex has been implicated
in this effortful retrieval process since the landmark positron
emission tomography studies of Petersen et al. (1988, 1989). In
the years since then, this region has been repeatedly implicated
in the controlled retrieval of semantic and episodic information
(Tulving et al. 1994; Buckner 1996; Buckner et al. 1998; Nolde
et al. 1998; Cabeza and Nyberg 2000; Buckner and Wheeler
2001; Wagner et al. 2001; Gold and Buckner 2002; Velanova
et al. 2003; Wheeler and Buckner 2003). Although it is generally
accepted that this region is somehow critical to the retrieval
process, substantial debate has surrounded the specific role
that this region plays in the retrieval of semantic information
(Thompson-Schill et al. 1997, 1998, 1999; Wagner et al. 2001;
Badre and Wagner 2002; Martin and Byrne 2006; Martin and
Cheng 2006; Thompson-Schill and Botvinick 2006). The task
that stimulated the most controversy was the verb generation
paradigm, in which participants provided appropriate verbs for
nouns that were strongly associated with either one (low
selection, e.g., APPLE-EAT) or multiple (high selection, e.g.,
DOOR-OPEN/CLOSE) verbs (Thompson-Schill et al. 1997). Out
of this debate sprung 2 competing accounts of the role of the
left prefrontal cortex in retrieval. On the one side, Thompson-
Schill et al. (1997, 1998, 1999) provided evidence in support of
the selection hypothesis. According to the selection hypothe-
sis, this region is not involved in the retrieval attempt per se but
rather the selection of information among competing alter-
natives (e.g., OPEN vs. CLOSE). On the other side, Wagner et al.
(2001; Badre and Wagner 2002) and later Martin and Cheng
(2006) argued that the data of Thompson-Schill et al. (1997)
could be explained in terms of associative strength rather than
selection (the controlled retrieval hypothesis). According to
Wagner et al., the left prefrontal region was responsible for
controlled retrieval of information, and selection among com-
peting alternatives is just one factor that influences this process.
Martin and Cheng compared the stimuli of Thompson-Schill
et al. (1997) with verb norms and found that associative strength
was confounded with selection in the verb generation task. For
example, APPLEwasmore strongly associated to EAT thanDOOR
was to either OPEN or CLOSE. In addition, Martin and Cheng
found that associative strength accounted for the majority of
the behavioral effect in the verb generation task in a variation of
the paradigm in which associative strength and selection were
isolated.
In a recent reply to Martin and Cheng (2006), Thompson-
Schill and Botvinick (2006) claimed that the perennial debate
rested upon a false dichotomy between associative strength
and selection and proposed one mechanism to unite these 2
processes in a Bayesian ‘‘competition model’’ in the tradition of
Usher and McClelland (2001). This model relied crucially on
the strength of cue-response associations (e.g., APPLE-EAT) as
well as inhibitory connections between competing responses
(e.g., OPEN vs. CLOSE). This apparent end to the debate
between the selection hypothesis and the controlled retrieval
hypothesis has heightened the demand for parsimonious
models of the role of the left prefrontal cortex in retrieval. In
response to Thompson-Schill and Botvinick (2006), Martin and
Byrne (2006) proposed a model that explained the same range
of data without the necessity of a true competitive mechanism
(i.e., direct inhibition between responses). According to Martin
and Byrne, the results of Martin and Chen could be explained
solely by the spread of activation across associative connec-
tions between cue and response. Martin and Byrne claimed that
their model should be preferred to the competition model on
the basis of parsimony.
In the style of Martin and Byrne (2006), we propose
a framework for understanding the left prefrontal cortex that
accounts for a variety of retrieval phenomena without pro-
posing a direct inhibitory mechanism. This framework, first
proposed in Anderson et al. (2003), is an extension of the
adaptive control of thought--rational (ACT-R) cognitive archi-
tecture (Anderson 2007) and maps modules in ACT-R onto
regions of the brain. Specifically, ACT-R proposes a general
� The Author 2008. Published by Oxford University Press. All rights reserved.
For permissions, please e-mail: [email protected] from https://academic.oup.com/cercor/article-abstract/18/11/2674/295316by gueston 16 February 2018

retrieval module that is responsible for maintaining control
over the retrieval process during semantic and episodic
retrieval and maps this module onto the left prefrontal cortex.
The amount of time this module must exert control is precisely
determined by the availability of the memory as calculated by
its activation value, which is the sum of the base-level activation
of the memory (i.e., the amount of previous experience) and
the spreading activation from the cues (i.e., the context).
A handful of studies have already made some progress in
characterizing this model of left prefrontal activity. For
example, activity in this region increases as the number of
math fact retrievals required to solve an algebra problem
increases (Anderson et al. 2003; Qin et al. 2003, 2004; Danker
and Anderson 2007). In addition, a paired associate paradigm
that manipulated the number of associations, or fan (Anderson
1974), of the retrieval cue found that both response time and
prefrontal activity increase as a function of fan (Sohn et al.
2003, 2005). Within the ACT-R architecture, the fan effect is
explained much in the same way as Martin and Byrne explained
effects in the verb generation paradigm: by a reduction in
associative strength between the cue and each associate as the
number of associates is increased (Anderson and Reder 1999).
Although the fan task is technically an episodic memory
paradigm, it bears some semblance to the verb generation
paradigm. The primary difference between the 2 paradigms is
that the number of competing associations is experimentally
manipulated in the fan paradigm and selected from among
preexisting associations in the verb generation paradigm. We
believe the fan paradigm is a better choice for studying precise
theories of left prefrontal cortex because of the lack of
preexisting confounding factors.
In the following paper, we present ourmodel of left prefrontal
cortex activity along with an experiment that demonstrates the
sensitivity of this model to a pair of theoretically orthogonal task
manipulations. We adopt a recall paradigm in which both the
fan of the retrieval cues and the number of times each stimulus
is repeated are manipulated—allowing for the investigation
of the independent effects of current context and previous
experience on activity in the left prefrontal cortex. Our model
proposes that prefrontal activity is determined by a single
activation value that is a sum of both factors.
We will now briefly sketch out our model of declarative
memory. Human declarative memory is a vast store capable of
powerful parallel processing. Given the appropriate cue (e.g.,
‘‘What is your mother’s maiden name?’’), we are capable of
quickly singling out the corresponding fact from a vast
warehouse of information. Although declarative memory can
seem both infinitely large and extraordinarily efficient, it also
has limited resources and must prioritize some facts over
others. ACT-R, the latest instantiation of Anderson’s ACT
theory, is at its heart a Bayesian theory of declarative memory
that was inspired by the rational analysis of Anderson and
Schooler (1991). The theory is rational in the sense that it
claims that declarative memory is highly sensitive to the
statistical regularities in the environment. In ACT-R, the speed
and success with which a fact is retrieved from memory is
determined by the usefulness and relevance of said fact and is
affected by such factors as recency, frequency, and context.
That is, those memories that are most likely to be needed are
also the easiest to retrieve. According to Anderson (2007),
declarative memory provides ‘‘moment by moment, the most
appropriate window into our past’’ (p. 91).
As mentioned briefly above, in ACT-R, the availability of a fact
in memory is represented by its activation value. The activation
value of a fact reflects both its inherent strength, or base-level
activation, and its strength of association to cues in the current
context, or spreading activation. This relationship is formally
expressed in the activation equation,
Ai =Bi + +j2C
WjSji ;
where Ai is the activation of fact i, Bi is the base-level activation
of fact i, C is the context which is defined as the set of retrieval
cues j, Wj is the attentional weighting given to retrieval cue j,
and Sji is the strength of association between retrieval cue j and
fact i. As developed in detail in Anderson and Lebiere (1998),
the base-level activation and strengths of association change
with experience so that activation directly reflects the log odds
that a memory will be needed in the next moment of time.
Here, we will briefly review the aspects of these quantities
relevant to the experiment that we will describe.
The base-level activation Bi will reflect both the recency and
frequency of fact i and is determined by the number of
presentations n of fact i and the time since the first
presentation L according to the base-level learning equation,
Bi = ln� n
1 –d
�–d lnðLÞ;
where d represents the decay rate of facts in memory. As the
number of presentations n increases, so does the ease with
which the fact is retrieved (i.e., its activation value), producing
the power law of practice. In addition, as the time since the
first presentation L increases, the activation value of the fact
decreases, producing the power law of forgetting.
As for the spreading activation component of the activation
equation (Wj and Sji), Wj can be set to W/n, where n is the
number of sources of activation. This assumes an equal at-
tentional weight provided to each retrieval cue and a maximum
attentional weight, W. Sji represents the probability with which
retrieval cue j predicts fact i and can be calculated with the
associative strength equation,
Sji = S – lnðfanj Þ;
where S is the maximum associative strength and fanj is the
number of associations of cue j. Essentially, associative strength
is spread equally among each of the associates such that as the
number of associates increases, the spreading activation to
each decreases. From a rational perspective, the degree to
which a cue predicts a fact decreases as the number of
associated facts increases.
The activation value Ai of fact i determines the time Ti that it
takes ACT-R’s retrieval module to retrieve said fact from
declarative memory according to the retrieval time equation,
Ti = F e –Ai ;
where F is a latency scaling parameter. According to our theory
of the left prefrontal cortex, this equation determines the
amount of time this region must exert control over the
retrieval process and the amount of metabolic activity in this
region will be proportional to Ti and inversely proportional to
Ai. The parameters that will most affect activity in this region
Cerebral Cortex November 2008, V 18 N 11 2675Downloaded from https://academic.oup.com/cercor/article-abstract/18/11/2674/295316by gueston 16 February 2018

are the same parameters that will most affect the activation
value of the memory according to the activation equation—
specifically, the fan of the retrieval cues fanj via its impact on
spreading activation and the number of repetitions n via its
impact on base-level activation. (The time since the first
presentation L also impacts the base-level activation, but this
will not be addressed further in this paper because it is held
constant across conditions in our experiment.) In the following
experiment, participants must indicate an appropriate Object
in a Subject--Verb--Object phrase (e.g., ‘‘Farmer Greets Dentist’’)
given the Subject and Verb as cues (i.e., ‘‘Farmer Greets?’’). We
manipulate the fan of the Subject and Verb cues such that
they both either have 1 association (fan-1 condition) or 2 as-
sociations (fan-2 condition). We also manipulated the number
of repetitions of each stimulus such that each stimulus ap-
pears either once (low-repetition condition) or twice (high-
repetition condition) per block. We investigate the effects of
these factors on response time and activity in left prefrontal
cortex during cued recall.
Materials and Methods
ParticipantsTwenty-one right-handed participants (9 female, 12 male; ages 18--27;
mean age 21.3) completed 2 sessions each. All participants were given
informed consent in accordance with Carnegie Mellon University and
University of Pittsburgh guidelines. Two participants were excluded
from further analysis, 1 because of abnormalities in the structural scan
and 1 because of large fluctuations in the blood oxygen level--
dependent (BOLD) signal.
Stimuli and DesignParticipants performed 2 test sessions, each consisting of 8 blocks of 24
trials, that were no more than 1 week apart and were identical except
they used entirely different stimulus sets. The first session was a training
session outside of the scanner and was intended to familiarize
participants with the procedure. The second session was done in the
scanner. All data presented are from the scanning session.
The design was 2 3 2 factorial with 4 conditions and 2 major factors:
fan (1 or 2) and repetition (low or high). Stimuli for each session were
16 unique phrases in the form Subject--Verb--Object (e.g., Farmer Greets
Dentist). Each Subject--Verb pairing was unique as a combination and
therefore entirely predictive of the Object. However, in 8 of the phrases,
the subject and verb were both unique to that phrase (fan-1), and in 8 of
the phrases, the subject and verb each appeared in a different phrase
(fan-2). For example, if one of the phrases in the fan-2 condition was
‘‘Farmer Greets Dentist,’’ there might also be the 2 phrases ‘‘Farmer
Visits Camper’’ and ‘‘Doctor Greets Baker,’’ such that the subject and
verb each appeared in an additional phrase but not the same one. There
were only 4 possible objects, and they started with the letters A (Agent),
B (Baker), C (Camper), and D (Dentist), which were mapped onto
unique fingers on the response glove. In addition, 8 of the pairs were
shown only once in a block (low repetition) and 8 were shown twice
(high repetition), resulting in the 24 trials in each block.
ProcedureThe structure of an experimental trial is presented in Figure 1. Each
trial began with the presentation of a 2-word phrase consisting of
a Subject--Verb pairing for 6 s. Participants had to indicate 1 of 4
possible objects to complete a unique Subject--Verb--Object phrase by
clicking an appropriate finger on the response glove. If the object
indicated was incorrect, the correct response was presented on screen
for 6 s. Because there was no initial training on the stimuli, this
feedback was the only information made available for learning the
appropriate phrases. Next, a warning (–) was presented on screen for
1 s followed by 8 s of a 1-back task. In this task, a set of 3-letter words
was presented randomly and the participant responded with a thumb
press whenever a word was repeated. The purpose of the 1-back was to
bring neural activity down to baseline. The has been effective in
previous studies by our group (e.g., Anderson et al., forthcoming).
Finally, a fixation (++) was presented for 1 s to indicate that the next
trial was about to begin.
Functional Magnetic Resonance Imaging Procedure andPreprocessingEvent-related functional magnetic resonance imaging data were
collected using a gradient echoplanar image acquisition on a Siemens
3T Allegra Scanner. The imaging parameters were time repetition =2000 ms, time echo = 30 ms, flip angle = 79�, field of view = 200 mm,
matrix size = 64 3 64, slice thickness = 3.2 mm, slice gap = 0 mm, and
34 axial slices per scan with the anterior commissure-posterior
commissure (AC-PC) on the 11th slice from the bottom. Correct trials
lasted 8 scans and incorrect trials lasted 11 scans. Anatomical scans were
acquired by using a standard T2-weighted pulse sequence, with 34 slices
and the AC-PC on the 11th slice from the bottom.
Preprocessing of the functional imaging data included 6-parameter
rigid-body motion correction using automated image registration (AIR,
Woods et al. 1992). Images were coregistered to a common reference
anatomical magnetic resonance imaging scan by means of the 12-
parameter AIR algorithm (Woods et al. 1998) and smoothed with a 6-
mm full-width half-maximum 3-dimensional Gaussian filter.
Results
Behavioral
The proportion correct over blocks by condition is presented
in Figure 2A. It can be seen that accuracy improved rapidly over
the first few blocks and that high-repetition stimuli are
remembered more accurately than low-repetition stimuli
throughout the session, but this effect appears to attenuate
over blocks. Furthermore, it appears that fan-1 stimuli are
remembered better than fan-2 stimuli but not in the early
blocks (1 and 2). In order to test these observations, we
performed a 2-fan 3 2-repetition 3 8-block repeated-measures
analysis of variance (ANOVA) with proportion correct as the
dependent measure. The main effects of block (F7,18 = 158,
mean squared error (MSE) = 0.03, P < 0.001), fan (F1,18 = 13,
MSE = 0.07, P < 0.005), and repetition (F1,18 = 47, MSE = 0.07,
P < 0.001) were highly significant, confirming the patterns
apparent in Figure 2A. In addition, there was a significant
interaction between block and repetition (F7,126 = 3.8, MSE
= 0.03, P < 0.001), indicating that the effect of repetition
decreased over blocks. The interaction between block and fan
was only marginally significant (F7,126 = 1.78, MSE = 0.02,
P < 0.10). There was no significant interaction between fan
and repetition (F1,18 = 1.1, MSE = 0.10, P > 0.10).
Figure 1. The structure of an experimental trial. The feedback stage only appears onerror trials.
2676 Prefrontal Activation during Controlled Retrieval d Danker et al.Downloaded from https://academic.oup.com/cercor/article-abstract/18/11/2674/295316by gueston 16 February 2018
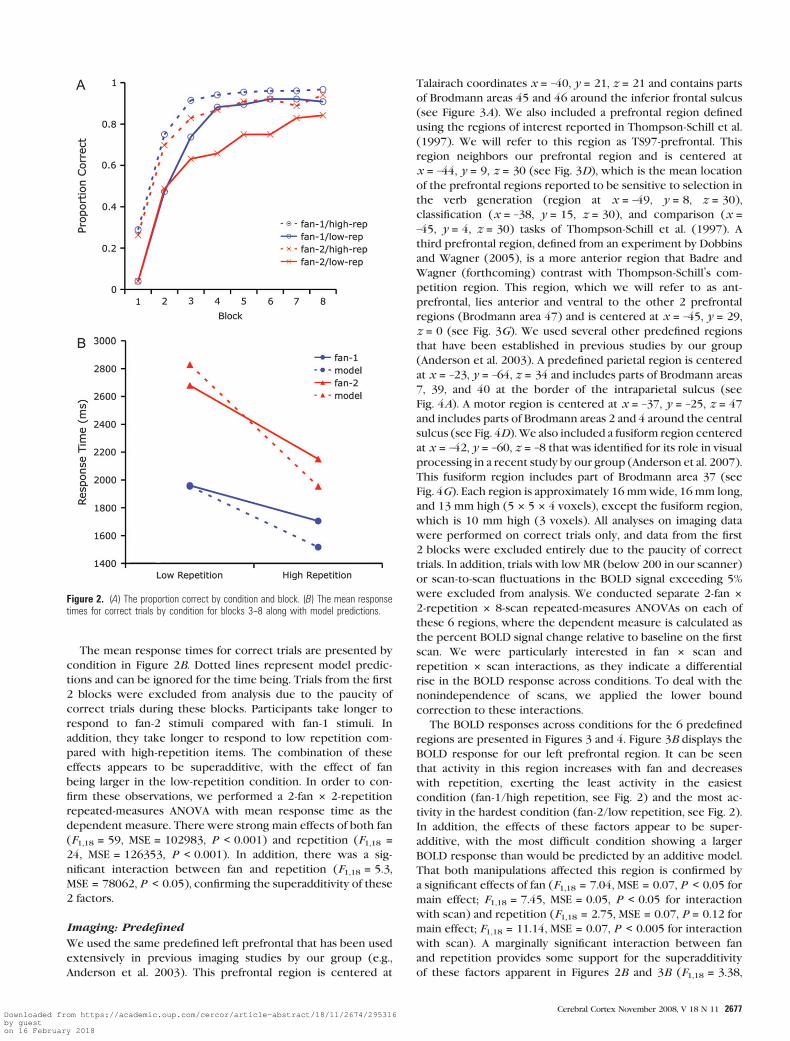
The mean response times for correct trials are presented by
condition in Figure 2B. Dotted lines represent model predic-
tions and can be ignored for the time being. Trials from the first
2 blocks were excluded from analysis due to the paucity of
correct trials during these blocks. Participants take longer to
respond to fan-2 stimuli compared with fan-1 stimuli. In
addition, they take longer to respond to low repetition com-
pared with high-repetition items. The combination of these
effects appears to be superadditive, with the effect of fan
being larger in the low-repetition condition. In order to con-
firm these observations, we performed a 2-fan 3 2-repetition
repeated-measures ANOVA with mean response time as the
dependent measure. There were strong main effects of both fan
(F1,18 = 59, MSE = 102983, P < 0.001) and repetition (F1,18 =24, MSE = 126353, P < 0.001). In addition, there was a sig-
nificant interaction between fan and repetition (F1,18 = 5.3,
MSE = 78062, P < 0.05), confirming the superadditivity of these
2 factors.
Imaging: Predefined
We used the same predefined left prefrontal that has been used
extensively in previous imaging studies by our group (e.g.,
Anderson et al. 2003). This prefrontal region is centered at
Talairach coordinates x = –40, y = 21, z = 21 and contains parts
of Brodmann areas 45 and 46 around the inferior frontal sulcus
(see Figure 3A). We also included a prefrontal region defined
using the regions of interest reported in Thompson-Schill et al.
(1997). We will refer to this region as TS97-prefrontal. This
region neighbors our prefrontal region and is centered at
x = –44, y = 9, z = 30 (see Fig. 3D), which is the mean location
of the prefrontal regions reported to be sensitive to selection in
the verb generation (region at x = –49, y = 8, z = 30),
classification (x = –38, y = 15, z = 30), and comparison (x =–45, y = 4, z = 30) tasks of Thompson-Schill et al. (1997). A
third prefrontal region, defined from an experiment by Dobbins
and Wagner (2005), is a more anterior region that Badre and
Wagner (forthcoming) contrast with Thompson-Schill’s com-
petition region. This region, which we will refer to as ant-
prefrontal, lies anterior and ventral to the other 2 prefrontal
regions (Brodmann area 47) and is centered at x = –45, y = 29,
z = 0 (see Fig. 3G). We used several other predefined regions
that have been established in previous studies by our group
(Anderson et al. 2003). A predefined parietal region is centered
at x = –23, y = –64, z = 34 and includes parts of Brodmann areas
7, 39, and 40 at the border of the intraparietal sulcus (see
Fig. 4A). A motor region is centered at x = –37, y = –25, z = 47
and includes parts of Brodmann areas 2 and 4 around the central
sulcus (see Fig. 4D). We also included a fusiform region centered
at x = –42, y = –60, z = –8 that was identified for its role in visual
processing in a recent study by our group (Anderson et al. 2007).
This fusiform region includes part of Brodmann area 37 (see
Fig. 4G). Each region is approximately 16 mmwide, 16 mm long,
and 13 mm high (5 3 5 3 4 voxels), except the fusiform region,
which is 10 mm high (3 voxels). All analyses on imaging data
were performed on correct trials only, and data from the first
2 blocks were excluded entirely due to the paucity of correct
trials. In addition, trials with low MR (below 200 in our scanner)
or scan-to-scan fluctuations in the BOLD signal exceeding 5%
were excluded from analysis. We conducted separate 2-fan 3
2-repetition 3 8-scan repeated-measures ANOVAs on each of
these 6 regions, where the dependent measure is calculated as
the percent BOLD signal change relative to baseline on the first
scan. We were particularly interested in fan 3 scan and
repetition 3 scan interactions, as they indicate a differential
rise in the BOLD response across conditions. To deal with the
nonindependence of scans, we applied the lower bound
correction to these interactions.
The BOLD responses across conditions for the 6 predefined
regions are presented in Figures 3 and 4. Figure 3B displays the
BOLD response for our left prefrontal region. It can be seen
that activity in this region increases with fan and decreases
with repetition, exerting the least activity in the easiest
condition (fan-1/high repetition, see Fig. 2) and the most ac-
tivity in the hardest condition (fan-2/low repetition, see Fig. 2).
In addition, the effects of these factors appear to be super-
additive, with the most difficult condition showing a larger
BOLD response than would be predicted by an additive model.
That both manipulations affected this region is confirmed by
a significant effects of fan (F1,18 = 7.04, MSE = 0.07, P < 0.05 for
main effect; F1,18 = 7.45, MSE = 0.05, P < 0.05 for interaction
with scan) and repetition (F1,18 = 2.75, MSE = 0.07, P = 0.12 for
main effect; F1,18 = 11.14, MSE = 0.07, P < 0.005 for interaction
with scan). A marginally significant interaction between fan
and repetition provides some support for the superadditivity
of these factors apparent in Figures 2B and 3B (F1,18 = 3.38,
Figure 2. (A) The proportion correct by condition and block. (B) The mean responsetimes for correct trials by condition for blocks 3--8 along with model predictions.
Cerebral Cortex November 2008, V 18 N 11 2677Downloaded from https://academic.oup.com/cercor/article-abstract/18/11/2674/295316by gueston 16 February 2018
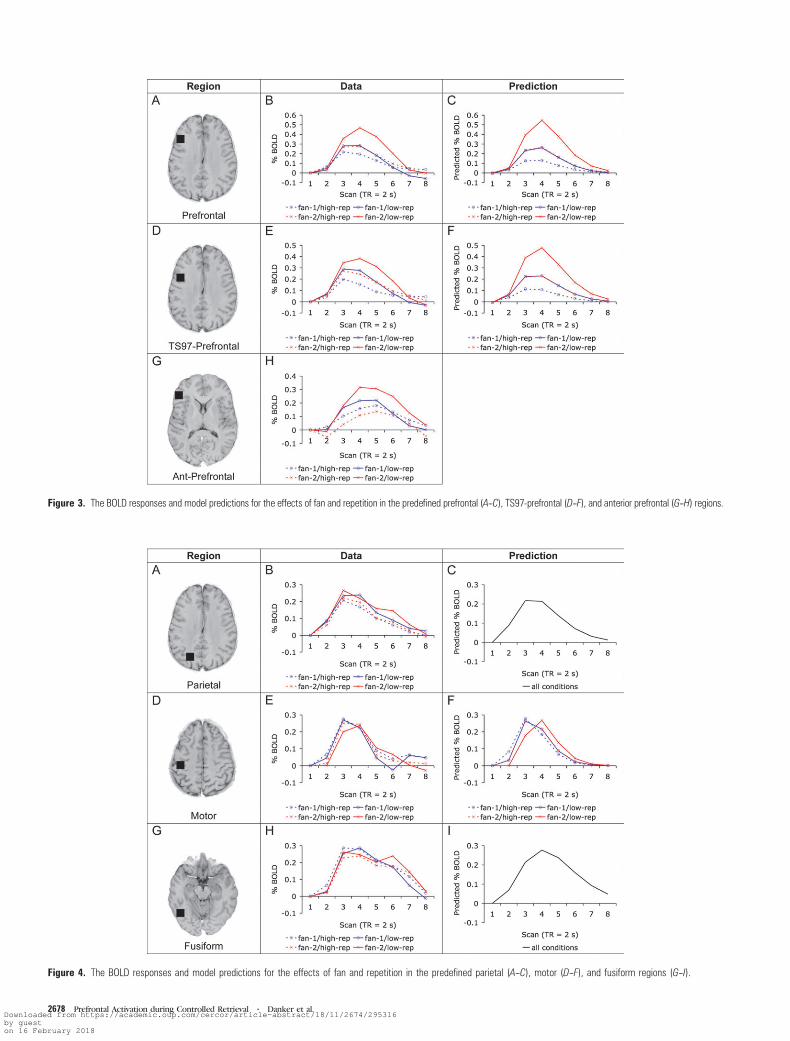
Figure 3. The BOLD responses and model predictions for the effects of fan and repetition in the predefined prefrontal (A--C), TS97-prefrontal (D--F), and anterior prefrontal (G--H) regions.
Figure 4. The BOLD responses and model predictions for the effects of fan and repetition in the predefined parietal (A--C), motor (D--F), and fusiform regions (G--I).
2678 Prefrontal Activation during Controlled Retrieval d Danker et al.Downloaded from https://academic.oup.com/cercor/article-abstract/18/11/2674/295316by gueston 16 February 2018

MSE = 0.06, P < 0.10), but the 3-way interaction with scan is
not significant (F1,18 = 1.47, MSE = 0.06, P > 0.10).
Figure 3E displays the BOLD response from the TS97-
prefrontal region. This region appears to respond to the task
manipulations similarly to our other prefrontal region. Like our
prefrontal region, this region shows significant effects of both
fan (F1,18 = 4.54, MSE = 0.06, P < 0.05 for main effect;
F1,18 = 5.22, MSE = 0.06, P < 0.05 for interaction with scan)
and repetition (F1,18 = 2.43, MSE = 0.09, P = 0.14 for main
effect; F1,18 = 9.56, MSE = 0.06, P < 0.01 for interaction with
scan). However, the interaction between fan and repetition is
not significant in this region (F1,18 = 0.43, MSE = 0.06, P > 0.10
for 2-way interaction; F1,18 = 0.49, MSE = 0.06, P > 0.10 for 3-way
interaction with scan). We conducted a 2-region (prefrontal or
TS97-prefrontal) 3 2-fan 3 2-repetition 3 8-scan repeated-
measures ANOVA to see whether the effects in these 2
prefrontal regions differed significantly. There were no detect-
able differences between regions as could be detected by
region 3 fan (F1,18 = 0.63, MSE = 0.02, P > 0.10), region 3 fan 3
scan (F1,18 = 0.74, MSE = 0.01, P > 0.10), region 3 repetition
(F1,18 = 0.02, MSE = 0.02, P > 0.10), or region 3 repetition 3
scan (F1,18 = 1.11, MSE = 0.02, P > 0.10) interactions. Further-
more, there was no significant region 3 fan 3 repetition
interaction (F1,18 = 2.11, MSE = 0.02, P > 0.10), indicating that
the superadditivity did not differ significantly between regions.
The BOLD response for the anterior prefrontal region is
displayed in Figure 3H. This region shows a different response
profile from the other 2 prefrontal regions, consistent with the
hypothesis of Badre and Wagner (forthcoming) that this region
is functionally distinct from more posterior prefrontal regions.
Like the other regions, this region appears to decrease activity
with more repetitions. However, it appears to respond only
weakly to fan, and the direction of the fan effect appears to
depend on the number of repetitions (i.e., fan-2 is greater for
low repetition, fan-1 is greater for high repetition). Consistent
with these observations, this region shows a significant effect of
repetition (F1,18 = 5.46, MSE = 0.09, P < 0.05 for main effect;
F1,18 = 6.14, MSE = 0.06, P < 0.05 for interaction with scan) but
not of fan (F1,18 = 0.30, MSE = 0.14, P > 0.10 for main effect;
F1,18 = 1.65, MSE = 0.09, P > 0.10 for interaction with scan).
Furthermore, there was a moderately significant interaction
between repetition and fan (F1,18 = 3.79, MSE = 0.10, P < 0.10).
The 3-way interaction with scan was not significant
(F1,18 = 1.36, MSE = 0.07, P > 0.10). We conducted a 2-region
(ant-prefrontal or TS97-prefrontal) 3 2-fan 3 2-repetition 3 8-
scan repeated-measures ANOVA to see if this region differs
significantly from the more posterior TS97-prefrontal region
with regard to our task manipulations. There were no detect-
able differences between regions as could be detected by re-
gion 3 fan (F1,18 = 2.194, MSE = 0.05, P > 0.10), region 3 fan 3
scan (F1,18 = 2.84, MSE = 0.04, P > 0.10), region 3 repetition
(F1,18 = 0.47, MSE = 0.06, P > 0.10), or region 3 repetition 3
scan (F1,18 = 2.01, MSE = 0.03, P > 0.10) interactions. However,
it is worth noting that the region 3 fan 3 scan interaction is
significant if the less conservative Greenhouse--Geisser correc-
tion is applied (F3.13,56.39 = 2.19, MSE = 0.05, P < 0.05). The
region 3 repetition 3 fan (F1,18 = 2.17, MSE = 0.05, P > 0.10)
and region 3 repetition 3 fan 3 scan (F1,18 = 0.70, MSE = 0.03,
P > 0.10) interactions were not significant.
The BOLD response for the left parietal region is displayed in
Figure 4B. There is a weak tendency for activity in this region
to be least in the fan-1/high-repetition condition and greatest
in the fan-2/low-repetition condition, indicating that it may be
responding to task difficulty to some extent. However, this
region did not show significant effects of fan (F1,18 = 0.28,
MSE = 0.03, P > 0.10 for main effect; F1,18 = 0.95, MSE = 0.04,
P > 0.10 for interaction) or repetition (F1,18 = 2.74, MSE
= 0.05, P > 0.10 for main effect; F1,18 = 1.13, MSE = 0.04,
P > 0.10 for interaction), indicating that these observations
are not reliable. In addition, we conducted a 2-region (pre-
frontal or parietal) 3 2-fan 3 2-repetition 3 8-scan repeated-
measures ANOVA to test the reliability of the difference
between this region and our prefrontal region. That the effect
of fan differed across regions was confirmed by significant
region 3 fan (F1,18 = 12.60, MSE = 0.01, P < 0.005) and region
3 fan 3 scan (F1,18 = 7.72, MSE = 0.02, P < 0.05) interactions.
That the effect of repetition differed across regions was con-
firmed by a significant region 3 repetition 3 scan interaction
(F1,18 = 7.45, MSE = 0.04, P < 0.05), although the interaction
between repetition and region was not significant (F1,18 = 0.08,
MSE = 0.03, P > 0.10).
Figure 4E shows the BOLD response for the left motor region.
That this region responds is hardly surprising, given that
participants respond to the task with their right hand. This
region does not appear to show differential activity across
conditions, besides showing a later peak in the conditions with
longer response times, particularly the fan-2 conditions. This
tendency is captured by a marginally significant fan 3 scan
interaction (F1,18 = 3.69, MSE = 0.05, P < 0.10). This region did
not show a significant repetition 3 scan interaction (F1,18 = 0.38,
MSE = 0.04, P > 0.10) or significant main effects of fan
(F1,18 = 1.07, MSE = 0.04, P > 0.10) or repetition (F1,18 = 0.32,
MSE = 0.06, P > 0.10). The presence of the interaction in the
absence of main effects supports the idea that the effects in this
region can be explained by a shift in the response curve.
The BOLD response for the left fusiform region is shown in
Figure 4H. This region does not seem to show differential
activity across conditions and did not show effects of fan
(F1,18 = 0.00, MSE = 0.03, P > 0.10 for main effect; F1,18 = 0.82,
MSE = 0.05, P > 0.10 for interaction) or repetition (F1,18 = 0.00,
MSE = 0.06, P > 0.10; F1,18 = 0.82, MSE = 0.05, P > 0.10).
Imaging: Exploratory
In this section, the results of the exploratory analyses will be
reported. We selected regions of interest that showed
significant fan 3 scan or repetition 3 scan interactions and
consisted of at least 40 contiguous voxels at P < 0.05. The
lower bound correction was applied to these interaction terms.
Regions with significant interactions showed effects of fan or
repetition that were dependent on scan (i.e., an effect that
changes over time), and most of them could be characterized
as having a differential rise or fall in the percent BOLD change
across conditions relative to baseline at the first scan.
The regions showing significant fan 3 scan interactions are
displayed in Figure 5 along with the predefined regions and
listed in Table 1 along with their sizes, locations, and areas
under the curve (% BOLD) for the fan-1 and -2 conditions.
Several regions showed positive-going responses that increased
with fan, including a pre/postcentral region, a left middle/
inferior frontal region, and a right insular region. The left
middle/inferior frontal region overlaps substantially with our
predefined prefrontal and TS97-prefrontal regions. This region
appears to show an extremely small effect of fan (Table 1) but
that is because it envelops several other functional regions
Cerebral Cortex November 2008, V 18 N 11 2679Downloaded from https://academic.oup.com/cercor/article-abstract/18/11/2674/295316by gueston 16 February 2018

besides our predefined prefrontal regions. A particularly
interesting contrast is between the anterior right insular region
and the more posterior insular region. Even though they are
neighbors, the anterior region shows a positive-going response
that increased with fan, whereas the posterior region showed
a positive-going response that decreased with fan. The majority
of the remaining regions showed responses with large negative-
going components that became more negative with increasing
fan.
The regions showing significant repetition 3 scan interac-
tions are displayed in Figure 6 along with the predefined
regions and listed in Table 2 along with their sizes, locations,
and areas under the curve (% BOLD) for the low- and high-
repetition conditions. The superior frontal and left middle/
inferior frontal regions had positive-going responses that were
weaker in the high-repetition condition. This left middle/
inferior frontal region also overlaps with our predefined
prefrontal and TS97-prefrontal regions. The medial frontal
and middle temporal regions had negative-going responses that
were weaker in the high-repetition condition.
Modeling
The ACT-R architecture is not only a theory of declarative
memory but also a framework for creating models of cognitive
tasks (Anderson 2007). ACT-R is instantiated as a group of
cognitive and perceptual-motor modules that perform distinct
cognitive operations and interact with each other through
a central procedural system. These modules consist of the
retrieval module discussed above as well as several other
modules that will be discussed shortly. Although each of the
modules provides precise timing predictions that contribute to
the absolute response time (i.e., the intercept), the retrieval
module is solely responsible for the differential response time
predictions across conditions due to retrieval manipulations
like fan and repetition.
In our model of this recall task, we propose encoding,
retrieval, and response phases during which the model visually
encodes the cue, retrieves the answer, and responds accord-
ingly, respectively. The encoding phase is divided between
a visual module, which attends to each of the retrieval cues, and
Figure 5. Exploratory regions showing fan effects. Exploratory regions are displayed in yellow, whereas predefined regions are shown in: prefrontal, red; TS97-prefrontal, blue;Ant-prefrontal, green; parietal, orange; and motor, cyan. The predefined fusiform region is not shown.
Table 1Results of fan 3 scan exploratory analysis
Region of interest Brodmannarea(s)
Voxelcount
Coordinates Fan-1 Fan-2
x y z
Pre/postcentral gyrus 1--4 155 �40 �30 60 1.55 1.63R. superior frontal 8 72 22 41 43 �0.40 �0.55Paracentral lobule 5, 7 215 0 �32 48 0.23 �0.04R. inferior parietal 40 329 53 �50 40 0.01 �0.26L. inferior parietal 40 180 �53 �50 40 0.23 �0.01L. middle/inferior frontal 9, 46 242 �44 20 25 0.69 0.73R. middle/inferior frontal 10, 46 56 45 40 15 0.08 �0.06L. middle/inferior frontal 10, 46 43 �42 41 20 0.56 0.57Medial frontal gyrus 10, 46 91 0 50 15 �0.24 �0.59R. insula 13 40 32 20 10 0.50 0.64R. insula 13 41 35 �4 13 0.57 0.28R. middle temporal 21, 22 58 59 �42 8 �0.34 �0.57
Note: R, right; L, left.
2680 Prefrontal Activation during Controlled Retrieval d Danker et al.Downloaded from https://academic.oup.com/cercor/article-abstract/18/11/2674/295316by gueston 16 February 2018

the imaginal module, which encodes these cues into working
memory. The retrieval is performed by the retrieval module
discussed above, and the response is performed by a manual
module responsible for controlling the hands. This model,
along with the time for each operation derived from default
ACT-R parameters, is depicted in Figure 7. In ACT-R, it takes
185 ms to attend to a visual object, 250 ms to modify an
imaginal representation, and 160 ms to prepare a binary
response. The response time for condition i, RTi, is predicted
to be the sum of the duration of all the other operations plus
the retrieval time for that particular condition, Ti,
RTi = 1080 + Ti :
Like previous models of the fan effect (Anderson and Reder
1999; Sohn et al. 2003, 2005), this model attributes response
time differences across conditions to differences in retrieval
time. That is, the fan and repetition manipulations solely impact
activity of the retrieval module. The retrieval time can be
calculated using the standard ACT-R activation equations
described above, and the end result has 1 free parameter, C,
which reflects overall speed of retrieval (see Supplementary
Material online for the derivation). The repetition manipulation
impacts Ti via its effect on base-level activation, and the fan
manipulation impacts Ti via its effect on spreading activation.
The retrieval time predictions for each condition in terms of C
are presented in Table 3. The response times predicted when C
is estimated to be 874 ms are presented in Figure 2 along with
the response time data. This value of C was calculated to
minimize the deviation from the response time data. These
predictions represent a reasonable fit to the data (r2 = 0.96).
Although C is an estimated parameter, it is worth noting that the
correlation tests a parameter-free prediction about the pattern
of times in the 4 conditions. Estimating the C parameter just
scales these predictions to match the magnitude of the data. For
example, the model predicts that the time to respond to the
fan-1/low-repetition condition will be the same as the time to
respond to the fan-2/high-repetition condition. Although the
data points for these 2 conditions are somewhat different in
Figure 2B, the difference between them is not reliable (t18 =–1.42, P > 0.10). Furthermore, our model predicts the super-
additive effects of fan and repetition apparent in Figure 2B.
We previously developed a methodology for mapping
activity in the imaginal, retrieval, manual, and visual modules
onto activity in our predefined parietal, prefrontal, motor, and
fusiform regions, respectively (Anderson et al. 2003; Anderson
2007). This technique allows us to make predictions about
brain activations based on ACT-R models of cognitive tasks. The
Table 2Results of repetition 3 scan exploratory analysis
Region of interest Brodmannarea(s)
Voxelcount
Coordinates Lowrepetition
Highrepetition
x y z
Superior frontal gyrus 6, 8 56 0 14 52 0.82 0.42L. middle/inferior frontal 8, 9, 46 360 �46 20 25 1.05 0.70Medial frontal gyrus 10 45 0 55 20 �1.19 �0.76R. middle temporal 21, 39 42 58 �55 8 �0.90 �0.41
Note: R, right; L, left.
Figure 6. Exploratory regions showing repetition effects. Exploratory regions are displayed in yellow, whereas predefined regions are shown in: prefrontal, red; TS97-prefrontal,blue; Ant-prefrontal, green; parietal, orange; and motor, cyan. The predefined fusiform region is not shown.
Cerebral Cortex November 2008, V 18 N 11 2681Downloaded from https://academic.oup.com/cercor/article-abstract/18/11/2674/295316by gueston 16 February 2018

major assumption of this technique is that whenever a module
is performing a cognitive operation, the corresponding region
is metabolically active. The technique involves convolving
a demand function that has a value of 1 whenever the module is
active and a value of 0 otherwise with a hemodynamic function
corresponding to the shape of the BOLD response. The
hemodynamic function we have adopted is the standard
gamma function, which has been used by several other
researchers to represent the BOLD response (Boynton et al.
1996; Cohen 1997; Dale and Buckner 1997; Glover 1999).
When a module is engaged, it will elicit a BOLD response t time
units later according to the function
H ðt Þ =N ða; sÞm�ts
�a
e– ðt=sÞ;
where m determines the magnitude of the response, a deter-
mines the shape of the response, and s determines the time
scale. N(a,s) is a normalizing constant and is equal to 1/(s 3 a!).
This function reaches a peak at a 3 s. The BOLD response
accumulates whenever a region is engaged according to the
engagement function f(t), thus the cumulative BOLD response
in a particular region can be calculated by convolving the
engagement function with the BOLD function
Bðt Þ =Z t
0
f ðxÞH ðt –xÞdx ;
We used these principles to predict activity in our
predefined regions using engagement functions from the
model in Figure 7. To reiterate, the visual module was engaged
during ‘‘attend’’ operations, the imaginal module during
‘‘encode’’ operations, the retrieval module during the ‘‘retrieve’’
operation, and the manual module during the ‘‘respond’’
operation. In addition to our standard mappings, we also
mapped activity in the retrieval module onto the TS97-
prefrontal region. We do not currently have a module in
ACT-R to map onto the ant-prefrontal region. The values of m,
a, and s were calculated to minimize the degree of mismatch
against the noise in the data according to the following chi-
square statistic:
v2 =+
iðXi – �XiÞ
2
S2�X
;
where the denominator is estimated from the interaction term
between condition and participants. The least squares pre-
dictions for each region are displayed alongside the data in
Figure 3. The best fitting parameters for the BOLD function in
each of these regions are presented in Table 4 along with
correlations and chi-square statistics to determine the good-
ness of fit of the model predictions to the data. The correlations
are calculated across all 32 data points (4 condition 3 8 scan),
and the chi-square statistic has 29 degrees of freedom,
calculated as 32 minus the 3 parameters estimated for the
BOLD function. This results in chi-square values greater than
42 representing significant deviations from the data (P < 0.05).
All 5 regions correlate well with the predictions of the
model, and none of the model predictions deviate significantly
from the data. This suggests that our model of the task
accounts well for the neural as well as response time data. It is
worth noting that the model only predicts differences across
conditions for the prefrontal (Fig. 3C), TS97-prefrontal
(Fig. 3F), and motor regions (Fig. 4F). In the case of the pre-
frontal regions, this is because of the differential engagement in
different conditions. In the case of the motor region, this is
because of the shift in response times across conditions. The
predictions for the parietal and fusiform regions are identical
across conditions.
It is notable that our prefrontal region elicits roughly
equivalent BOLD responses for the fan-1/low-repetition con-
dition and the fan-2/high-repetition condition (see Fig. 3B).
This is a parameter-free prediction of the ACT-R activation
equations (see Table 3). The model also predicts the super-
additive effects of fan and repetition on activity in this region.
Whereas this interaction is only marginally significant in the
ANOVA performed on this region, a 1-tailed contrast looking
for this superadditivity in the interaction between fan and
repetition is significant (t18 = 1.83, P < 0.05). Our prefrontal
region fits the retrieval module better than the TS97-prefrontal
region. This is hardly surprising considering that the exact
location of our region has been refined over many studies while
the TS97-prefrontal region represents the results of only one.
The motor region shows the predicted shift in peak from the
fan-1 to the fan-2 condition (see Fig. 4E,F). The parietal
(Fig. 4C) and fusiform (Fig. 4I) regions both seem to match well
with the model predictions, but there may be some variability
in these regions across conditions unaccounted for by our
admittedly simple model. For example, repetition of items and
increasing fan both result in certain words being presented
more often, which could prime encoding such that fan-2 and
high-repetition items have an encoding advantage, but there is
little evidence for this in the data. Overall, our model produces
more than sufficient fits to the BOLD responses in our
predefined regions and appears to account particularly well
for the behavior of our predefined prefrontal and TS97-
prefrontal regions.
Discussion
In this paper, we have described our rational theory of the left
prefrontal cortex and provided an empirical study supporting
Figure 7. Model of the recall task, with time accounted for by visual (dotted), imaginal (gray), retrieval (white), and manual (black) module operations. The variability in responsetime across conditions is entirely caused by differences in the retrieval time, Ti.
Table 3Estimated retrieval times for each condition, Ti
Low repetition High repetition
Fan-1 C C/2Fan-2 2C C
2682 Prefrontal Activation during Controlled Retrieval d Danker et al.Downloaded from https://academic.oup.com/cercor/article-abstract/18/11/2674/295316by gueston 16 February 2018

our theory. According to our theory, which is an extension of
Anderson’s (2007) ACT-R theory, the amount of metabolic
activity in prefrontal cortex during retrieval is precisely
determined by the accessibility of the retrieved fact (i.e., its
activation value). This activation value is a summation of base-
level activation (i.e., previous experience) and spreading
activation (i.e., current context). Memories with lower
activation values are retrieved more slowly and require more
control than memories with higher activation values. We claim
that it is the left prefrontal region that is responsible for
exerting control over the retrieval process, and therefore, the
hemodynamic response in this region during retrieval should
be negatively correlated with the activation value of the
retrieved memory. We found substantial evidence for this
theory by showing that activity in prefrontal cortex increases as
a function of manipulations that affect both base-level
activation (repetition) and spreading activation (fan). That is,
the amount of activity exerted by left prefrontal cortex
decreases as 1) the previous experience with the memory
increases and 2) the strength of the association with the
context increases. This is consistent with previous studies
showing that left prefrontal cortex responds to the frequency
of previous experiences (Velanova et al. 2003; Wheeler and
Buckner 2003) as well as number of associations (Thompson-
Schill et al. 1997, 1999; Sohn et al. 2003, 2005). Not only did our
theory predict that these manipulations would affect activity in
this region but also it provided precise predictions of the effect
sizes that matched the data well. It made the prediction that
increasing the fan of both items in a pair from 1 to 2 would
have the same impact on left prefrontal activity as halving the
number of presentations of the pair, and this prediction bore
out in the data. It also predicted the superadditive effects of fan
and repetition on response time and prefrontal activity that is
apparent in the data.
We have demonstrated that our theory is sufficiently precise
to predict the activation of prefrontal cortex in response to 2
theoretically orthogonal manipulations of retrieval difficulty. It
is important to understand the relationship between our
computational theory of prefrontal cortex and existing theories
in the literature. In essence, our theory is akin to that put forth
by Wagner et al. (2001; Badre and Wagner, 2002). According to
Wagner et al., left prefrontal cortex is engaged whenever
retrieval of semantic information is nonautomatic (i.e., when-
ever control must be exerted over the retrieval process).
Wheeler and Buckner (2003) make a similar proposal about
this region in episodic retrieval. The idea is that activity in this
region will be affected by any manipulation that alters the
amount of control that must be exerted during the retrieval
process, including frequency and associative strength. Wagner
et al. describe this region as providing a ‘‘bias mechanism’’ that
facilitates the retrieval process. In our activation equations, we
provide a precise mathematical description of this biasing signal.
That is, our theory posits that the left prefrontal regionmaintains
activation of the memory cues during controlled retrieval,
leading to activation of relevant concepts in declarative memory
and eventually the selection of the most active memory.
Our theory shares the Bayesian origins of the competition
model put forth by Thompson-Schill and Botvinick (2006).
Activation in ACT-R is intended to compute the log posterior
odds that a memory will be needed in a certain context. If we
let M denote the event that a memory is needed and C denote
the current context, then the activation equation mirrors the
following Bayesian equation:
log-posterior-oddsðM j CÞ = log-prior-oddsðM Þ+ likelihood-ratioðC j M Þ;
where the log-prior-odds corresponds to the base-level
component of our activation equations and the likelihood ratio
corresponds to the associative strength component. The
spreading activation essentially scales up the base-level
activation according to the relevant context. This is similar to
Thompson-Schill and Botvinick’s competition model except
that their model does not include base-level activation. That is,
our model accounts for the recency and frequency of items in
a way that is not currently implemented in Thompson and
Botvinick’s admittedly succinct and demonstrative model. As
ACT-R predicts, fan and repetition can equally impact
activation of the left prefrontal cortex because both factors
determine the amount of time that control must be exerted
over the retrieval process. It is worth emphasizing that
a competitive model like Thompson-Schill and Botvinick’s
could be easily modified to account for recency and frequency
in its competitive mechanism. In this case, we believe it would
differ from our own account only in its emphasis on
competition rather than associative strength (see below).
As is reflected in its name, competition is at the heart of
Thompson-Schill and Botvinick’s (2006) model. In Bayesian
terms, competition corresponds to the likelihood ratio and can
be seen as a selection process among activated alternatives. The
context C can be conceived of consisting of a set of cues j.
Making the naive Bayes assumption of independence of
information sources, this is expanded in ACT-R into a sum of
likelihood ratios log[likelihood(j|M)], where
log½likelihoodðj j M Þ� = log�pðj j M Þpðj j �M Þ
�;
which are equal to the Sji in the activation equation. Anderson
(1990) argues that this can be approximated by log[p(M|j)] --
log[p(j)]. If all memories are equally associated with a concept
likely given j as in this fan experiment, p(M|j) = 1/fanj, and we
get the associative strength equation by setting S = --log[p(j)].
This formulation makes clear that what is important for
associative strength is not the overall frequency of a pair (that
is reflected in the base-level activation) but the probability of
one member of the pair M given the other as a cue j. We agree
with Thompson-Schill and Botvinick’s (2006) assertion that the
distinction between associative strength and competition is
illusory and that ‘‘any manipulation of associative strength must
also be a manipulation of competition’’ (p. 407). In our model,
like that of Martin and Byrne (2006), competition between
associates is only implemented via the effect of competitors on
associative strength. If a cue j is only associated with M, then
Table 4Parameters estimated and fits to the BOLD response
Prefrontal/retrieval
TS97-prefrontal/retrieval
Parietal/imaginal
Motor/manual
Fusiform/visual
Magnitude (m) 1.90 1.81 3.91 11.53 13.42Exponent (a) 4.41 3.57 4.07 4.27 4.33Scale (s) 1.10 1.30 1.31 0.86 1.55Correlation (r2) 0.93 0.91 0.92 0.92 0.88Chi square 35.92 40.03 24.88 24.90 33.38
Cerebral Cortex November 2008, V 18 N 11 2683Downloaded from https://academic.oup.com/cercor/article-abstract/18/11/2674/295316by gueston 16 February 2018

the associative strength between them is high, and if j has many
associates, associative strength between the cue and any one of
them is low. The latter situation can be conceived of as
a condition of high competition. However, as this Bayesian
formulation makes clear, whether we think of this in terms of
associative strength or competition is just a matter of whether
we think of the same statistical glass as half full (associative
strength adding to the log odds) or half empty (competition
subtracting from the log odds).
A complication for our account of the left prefrontal cortex
is the recent empirical evidence that distinct prefrontal regions
exert control over retrieval and selection processes (Badre et al
2005; Gold et al. 2006; Dobbins and Wagner 2005; Badre and
Wagner, forthcoming). Badre and Wagner (forthcoming) pro-
pose a 2-process theory of prefrontal cortex, in which an
anterior prefrontal region is responsible for controlled retrieval
of semantic information and a more posterior region is involved
in postretrieval selection among competitors. We compared
the TS97-prefrontal region originally associated with selection
with a more anterior prefrontal region. The differences in the
response profiles of these 2 regions garners some support for
the 2-process theory. That the anterior region did not respond
to our selection manipulation (fan) is consistent with the idea
that this region is not affected by competition. The presence of
both repetition and fan effects in the more posterior regions
would concur with a competitive theory of these regions that
was expanded to account for recency and frequency, as
mentioned briefly above with respect to Thompson-Schill and
Botvinick’s (2006) model. In this sense, our data seem to be
consistent with the current 2-process theory of retrieval.
However, although our data are roughly in line with the 2-
process theory, the mathematical details of our framework
make it difficult to reconcile our perspective with the 2-
process theory. As outlined above, a rational account of
prefrontal function necessarily equates associative strength
and competition. In fact, the primary manipulation of associa-
tive strength is the addition of competitors (fan). According to
Badre and Wagner, the experimental manipulations that most
typify the processes performed by the anterior and posterior
prefrontal regions are ‘‘strength of association between cues
and target knowledge’’ and ‘‘number of retrieved competitors,’’
respectively. Thus, they are proposing a dissociation between 2
processes that are equivalent from our perspective. We believe
reconciling the 2-process theory with our own should be
a catalyst for future research. It might benefit the 2-process
theory to define the processes performed by these 2 regions in
a way that acknowledges the relationship between associative
strength and competition. On the other hand, our own
framework would greatly benefit from a computational theory
of the process performed by the anterior prefrontal region.
Like the theories discussed above, the ACT-R theory of the
left prefrontal cortex in retrieval is based on evidence from
studies of semantic memory (Anderson et al 2003; Qin et al.
2003, 2004). However, the declarative memory system in
ACT-R is a general theory of retrieval in prefrontal cortex that
fits into the ACT-R cognitive architecture (Anderson 2007), and
because of this it has substantially more breadth than the
semantic memory theories discussed in this paper. We believe
this breadth confers on ACT-R 2 advantages over other
theories. First, its scope extends beyond semantic memory
and can inform memory tasks that, like the experiment
presented here, are more episodic in nature. We have
presented evidence here that the same left prefrontal region
that spurred years of discussion in the semantic memory
literature also responds to manipulations of retrieval difficulty
in episodic memory paradigms, but we are not the first to make
this connection (Velanova et al. 2003; Wheeler and Buckner
2003; Badre and Wagner, forthcoming). If there was any doubt
that our model is describing this region, we have also shown
that a region of interest based on the original Thompson-Schill
et al. (1997) study also responds to our manipulations.
Second, the retrieval module in ACT-R interacts with an
extensive architecture of other modules, which allows for
precise response time predictions across a variety of tasks as
well as predictions about which other brain regions are
invoked in which tasks. In this paper, we discussed the visual,
imaginal, and manual modules, which attend the cues, encode
the cues, and respond, respectively (see Fig. 7). By using the
default ACT-R timing parameters for these modules, we were
able to make precise response time predictions for this task as
well as predict the amount of neural activity in the associated
brain regions. Of these modules, only the manual/motor
module predicted differential activity in its corresponding
brain region across conditions, and this was simply a shift in
response corresponding with the response time. The imaginal/
parietal and visual/fusiform modules predicted no differences
in activity across conditions, and this leads to reasonable fits to
the data. That our imaginal/parietal region did not respond to
our task manipulations is theoretically interesting, given that
activity in this region is typically difficult to isolate from activity
in our prefrontal region in symbolic manipulation tasks (for
a discussion of this issue, see Danker and Anderson 2007).
We have demonstrated the accuracy of our model of left
prefrontal cortex with an empirical study and have argued that
it offers more than the previous models of this region. We have
also shown that it fits in a framework that can account for
activity in several others regions, although the model of left
prefrontal cortex is by far the most developed. There is
increasing evidence of multiple, distinct regions in left inferior
prefrontal cortex that perform different roles in the retrieval
process (Gold and Buckner 2002; Velanova et al. 2003; Badre
et al. 2005; Gold et al. 2006; Badre and Wagner, forthcoming).
We believe we have captured the role of one of these regions
whose behavior can be precisely explained by the rational
analysis of human declarative memory.
Supplementary Material
Supplementary material can be found at: http://www.cercor.
oxfordjournals.org/.
Funding
National Institute of Mental Health (MH068243).
Notes
We thank Lynne Reder, Anthony Wagner, Mark Wheeler, Brice Kuhl,
and Yvonne Kao for helpful comments on previous versions of this
manuscript. Conflict of Interest: None declared.
Address correspondence to email: [email protected].
References
Anderson JR. 1974. Retrieval of propositional information from long-
term memory. Cognit Psychol. 5:451--474.
2684 Prefrontal Activation during Controlled Retrieval d Danker et al.Downloaded from https://academic.oup.com/cercor/article-abstract/18/11/2674/295316by gueston 16 February 2018

Anderson JR. 1990. The adaptive character of thought. Hillsdale (NJ):
Erlbaum.
Anderson JR. 2007. How can the human mind occur in the physical
universe? New York: Oxford University Press.
Anderson JR, Byrne D, Fincham JM, Gunn P. 2007. The role of prefrontal
and parietal cortices in associative learning. Cereb Cortex. Advance
Access published on August 3, 2007; doi: 10.1093/cercor/bhm123.
Anderson JR, Lebiere C. 1998. The atomic components of thought.
Mahwah (NJ): Erlbaum.
Anderson JR, Qin Y, Jung K-W, Carter CS. 2007. Information-processing
modules and their relative modality specificity. Cognit Psychol.
54:185--217.
Anderson JR, Qin Y, Sohn M-H, Stenger VA, Carter CS. 2003. An
information-processing model of the BOLD response in symbol
manipulation tasks. Psychon Bull Rev. 10:241--261.
Anderson JR, Reder LM. 1999. The fan effect: new results and new
theories. J Exp Psychol Gen. 128:186--1179.
Anderson JR, Schooler LJ. 1991. Reflections of the environment in
memory. Psychol Sci. 2:396--408.
Badre D, Poldrack RA, Pare-Gloev EJ, Insler RZ, Wagner AD. 2005.
Dissociable controlled retrieval and generalized selection mecha-
nisms in ventrolateral prefrontal cortex. Neuron. 47:907--918.
Badre D, Wagner AD. 2002. Semantic retrieval, mnemonic control, and
prefrontal cortex. Behav Cogn Neurosci Rev. 1:206--218.
Badre D, Wagner AD. 2007. Left ventrolateral prefrontal cortex
and the cognitive control of memory. Neuropsychologia. 45:
2883--2901.
Boynton GM, Engel SA, Glover GH, Heeger DJ. 1996. Linear systems
analysis of functional magnetic resonance imaging in human V1.
J Neurosci. 16:4207--4221.
Buckner RL. 1996. Beyond HERA: contributions of specific prefrontal
brain areas to long-term memory retrieval. Psychon Bull Rev.
3:149--158.
Bucker RL, Koutstaal W, Schacter DL, Wagner AD, Rosen BR. 1998.
Retrieval efforts versus retrieval success. Neuroimage. 7:151--162.
Buckner RL, Wheeler ME. 2001. The cognitive neuroscience of
remembering. Nat Rev Neurosci. 2:624--634.
Cabeza R, Nyberg L. 2000. Imaging cognition II: an empirical review of
275 PET and fMRI studies. J Cogn Neurosci. 12:1--47.
Cohen MS. 1997. Parametric analysis of fMRI data using linear systems
methods. Neuroimage. 6:93--103.
Dale AM, Buckner RL. 1997. Selective averaging of rapidly presented
individual trials using fMRI. Hum Brain Mapp. 5:329--340.
Danker JF, Anderson JR. 2007. The roles of prefrontal and posterior
parietal cortex in algebra problem solving: a case of using cognitive
modeling to inform neuroimaging data. Neuroimage. 35:1365--1377.
Dobbins IG, Wagner AD. 2005. Domain-general and domain-sensitive
prefrontal mechanisms for recollecting events and detecting
novelty. Cereb Cortex. 15:1768--1778.
Glover GH. 1999. Deconvolution of impulse response in event-related
BOLD fMRI. Neuroimage. 9:416--429.
Gold BT, Balota DA, Jones SJ, Powell DK, Smith CD, Andersen AH. 2006.
Dissociation of automatic and strategic lexical-semantics: functional
magnetic resonance imaging evidence for differing roles of multiple
frontotemporal regions. J Neurosci. 26:6523--6532.
Gold BT, Buckner RL. 2002. Common prefrontal regions coactivate
with dissociable posterior regions during controlled semantic and
phonological tasks. Neuron. 35:803--812.
Martin RC, Byrne MD. 2006. Why opening a door is as easy as eating an
apple: a reply to Thompson-Schill and Botvinick. Psychon Bull Rev.
13:409--411.
Martin RC, Cheng Y. 2006. Selection demands versus association
strength in the verb generation task. Psychon Bull Rev. 13:396--401.
Nolde SF, Johnson MK, Raye CL. 1998. The role of prefrontal cortex
during tests of episodic memory. Trends Cogn Sci. 2:399--406.
Petersen SE, Fox PT, Posner MI, Mintun M, Raichle ME. 1988. Positron
emission tomographic studies of cortical anatomy of single-word
processing. Nature. 331:585--589.
Petersen SE, Fox PT, Posner MI, Mintun M, Raichle ME. 1989. Positron
emission tomographic studies of processing of single words. J Cogn
Neurosci. 1:153--170.
Qin Y, Carter CS, Silk EM, Stenger A, Fissell K, Goode A, Anderson JR.
2004. The change of brain activation patterns as children
learn algebra equation solving. Proc Natl Acad Sci USA. 101:
5686--5691.
Qin Y, Sohn M-H, Anderson JR, Stenger VA, Fissell K, Goode A,
Carter CS. 2003. Predicting the practice effects on the blood
oxygenation level-dependent (BOLD) function of fMRI in a symbolic
manipulation task. Proc Natl Acad Sci USA. 100:4951--4956.
Sohn M-H, Goode A, Stenger VA, Carter CS, Anderson JR. 2003.
Competition and representation during memory retrieval: roles of
prefrontal cortex and posterior parietal cortex. Proc Natl Acad Sci
USA. 100:7412--7417.
Sohn M-H, Goode A, Stenger VA, Carter CS, Anderson JR. 2005. An
information-processing model of three cortical regions: evidence in
episodic memory retrieval. Neuroimage. 25:21--33.
Thompson-Schill SL, Botvinick MM. 2006. Resolving conflict: a response
to Martin and Cheng. Psychon Bull Rev. 13:402--408.
Thompson-Schill SL, D’Esposito M, Aguirre GK, Farah MJ. 1997. Role of
left inferior prefrontal cortex in retrieval of semantic knowledge:
a reevaluation. Proc Natl Acad Sci USA. 94:14792--14797.
Thompson-Schill SL, D’Esposito M, Kan IP. 1999. Effects of repetition
and competition on activity in left prefrontal cortex during word
generation. Neuron. 23:513--522.
Thompson-Schill SL, Swick D, Farah MJ, D’Esposito M, Kan IP,
Knight RT. 1998. Verb generation in patients with focal frontal
lesions: a neuropsychological test of neuroimaging findings. Proc
Natl Acad Sci USA. 95:15855--15860.
Tulving E, Kapur S, Craik FIM, Moscovitch M, Houle S. 1994.
Hemispheric encoding/retrieval asymmetry in episodic memory:
positron emission tomography findings. Proc Natl Acad Sci USA.
91:2016--2020.
Usher M, McClelland JL. 2001. The time course of perceptual choice:
the leaky, competing accumulator model. Psychol Rev.
108:550--592.
Velanova K, Jacoby LL, Wheeler ME, McAvoy MP, Petersen SE,
Buckner RL. 2003. Functional-anatomic correlates of sustained and
transient processing components engaged during controlled re-
trieval. J Neurosci. 23:8460--8470.
Wagner AD, Pare-Blagoev EJ, Clark J, Poldrack RA. 2001. Recovering
meaning: left prefrontal cortex guides controlled semantic retrieval.
Neuron. 31:329--338.
Wheeler ME, Buckner RL. 2003. Functional dissociations among
components of remembering: control, perceived oldness, and
content. J Neurosci. 23:3869--3880.
Woods RP, Cherry SR, Mazziotta JC. 1992. Rapid automated algorithm
for aligning and reslicing PET images. J Comput Assist Tomogr.
16:620--633.
Woods RP, Grafton ST, Holmes CJ, Cherry SR, Mazziotta JC. 1998.
Automated image registration: I. General methods of intra-
subject, intramodality variation. J Comput Assist Tomogr. 22:
139--152.
Cerebral Cortex November 2008, V 18 N 11 2685Downloaded from https://academic.oup.com/cercor/article-abstract/18/11/2674/295316by gueston 16 February 2018