a rational approach to reducing first-birth (ntsv) cesarean birth
TRANSCRIPT
1 1
Elliott Main, MD Medical Director, CMQCC
main@ .org
Clinical Professor, OB/GYN
UC San Francisco, and
Stanford Univ, School of Medicine
A Rational Approach to
Reducing First-birth (NTSV)
Cesarean Birth Rates
Anne Castles, MPH, MA Project Manager, CMDC
ACastles@ .edu
Stanford University School of Medicine

: Transforming Maternity
Care
Today’s Discussion:
What are the drivers for the rise and variation
in Primary CS?
NTSV (Nulliparous, Term Singleton, Vertex) as
the focus for CS Quality Improvement
Importance of L&D culture, Labor practices,
and use of Data and the California Maternal
Data Center to drive change
Multi-strategy approach to address CS rates
Public projects to support this initiative

: Transforming Maternity Care
Presenters’ Disclosures:
No financial conflicts
We are all employees of California Maternal
Quality Care Collaborative (CMQCC) based at
Stanford University, Palo Alto, CA
No outside business interests
CMQCC is a multi-stakeholder State Quality
Collaborative. The CMDC supported by the
CDC and the California HealthCare Foundation

: Transforming Maternity Care
CPQCC and CMQCC
Mission: Improving care for moms and newborns
California Perinatal Quality Care Collaborative (CPQCC) Expertise in data capture from hospitals
Established Perinatal Data Center in 1996
Data use agreements in place with 130 hospitals with NICUs
Model of working with state agencies to provide data of value
California Maternal Quality Care Collaborative (CMQCC) Expertise in maternal data analysis
Developer of QI toolkits
Host of collaborative learning sessions
Established Maternal Data Center in 2011

: Transforming Maternity Care
CMQCC Key Partner/Stakeholders State Agencies:
MCAH, Dept Public Health
OSHPD Healthcare Information Division
Office of Vital Records (OVR)
Regional Perinatal Programs of California (RPPC)
DHCS, Medi-Cal
Public Groups
California Hospital Accountability and Reporting Taskforce (CHART)
California HealthCare Foundation
Kaiser Family Foundation
March of Dimes (MOD)
Professional groups
American College of Obstetrics and Gynecology (ACOG)
Association of Women’s Health, Obstetric and Neonatal Nurses (AWHONN)
American College of Nurse Midwives (ACNM),
American Academy of Family Physicians (AAFP)
Key Medical and Nursing Leaders
Universities and Hospital Systems
Kaisers, Sutter, Sharp, Dignity, Scripps, Providence, Public hospitals,

: Transforming Maternity Care
CMQCC Key Partner/Stakeholders (con’t)
Medical Associations:
California Hospital Association
Regional Hospital Associations
California Medical Association
Payers
Aetna
Anthem Blue Cross
Blue Shield
Cigna
Health Net
Purchasers
CALPERS (State and local government employees and retirees)
Medi-Cal (for managed care plans)
Pacific Business Group on Health/ Silicon Valley Employers Forum
Cover California (ACA entity)

: Transforming Maternity Care
CMQCC Perinatal QI Toolkits
Adopted Nationally

: Transforming Maternity
Care
Cesarean Births Have Risen
by Over 50% in the Last 10 years

: Transforming Maternity
Care
CS Indication
Proportion
of Overall
CS Rate
Proportion
of Primary
CS Rate
CS Rate for
this
Indication
Repeat (prior) 30-35% 90+%
“Abnormal Labor”
(CPD/FTP)
25-30% 35-45% variable
“Fetal Distress” 10-15% 15-20% variable
Breech/Malpres. 10% 15-20% 98%
Multiple Gestation 5-9% 10-15% 60-80%
Other: Placenta
Previa, Herpes, etc
~5% ~10-15% 90%
What are the Indications for
Cesarean Section?

: Transforming Maternity
Care
Percent of the Increase in Primary Cesarean
Rate Attributable to this Indication
Cesarean Indication Yale (2003 v. 2009) (Total: 26% to 36.5%)
Focus: all primary
Cesareans
Kaiser So. Cal. (1991 v. 2008)
(Primary: 12.5% to 20%)
Focus: all primary singleton
Cesareans
Labor complications (CPD/FTP) 28% ~38%
Fetal Intolerance of Labor 32% ~24%
Breech/Malpresentation <1% <1%
Multiple Gestation 16% Not available
Various Obstetric and Medical
Conditions (Placenta Abnormalities,
Hypertension, Herpes, etc.)
6% 20%
(Did not separate
preeclampsia from other
complications)
Preeclampsia 10%
“Elective” (defined variously) 8%
(Scheduled without
“medical indication”)
18%
(Those “without a charted
indication”)
What Indications Have Driven the Rise in CS?

: Transforming Maternity
Care
Importance of NTSV population to the CS rate
>98% of inter-
institutional
variation in
overall CS rates
can be
attributed to
NTSV (TSCN)
• >60% of the rise
in CS rates
over the last 10
years can be
attributed to
NTSV (TSCN)
Brennan DJ. Am J Obstet Gynecol 2009; 201: 308.e1-8.

: Transforming Maternity
Care
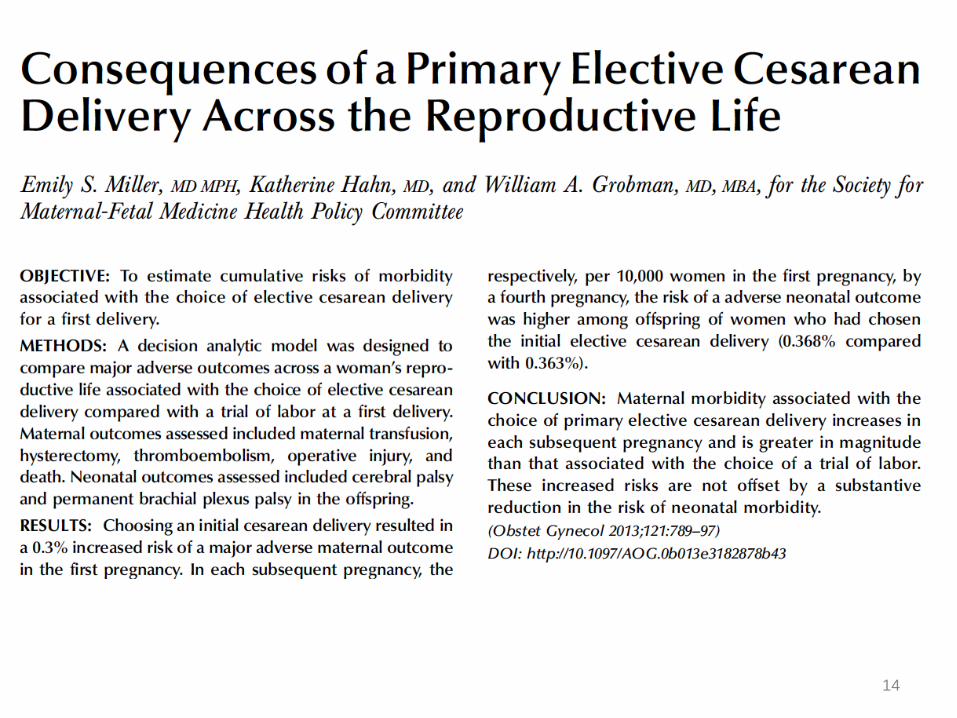
Importance of the First Birth
If you have a CS in the first labor, over 90% of ALL your subsequent births will be by Cesarean Section
If you have a vaginal birth in the first labor, over 90% of ALL your subsequent births will be vaginal
A Classic Example of “Path Dependency”
How do we focus QI activity on preventing
First-birth (Primary) Cesarean sections?
: Transforming Maternity
Care
NTSV Cesarean Section Rate:
Strengths
Simple
Focuses on the main source of variation
Focuses on the first birth, and therefore
her entire reproductive future
Focuses on labor management
14
: Transforming Maternity
Care
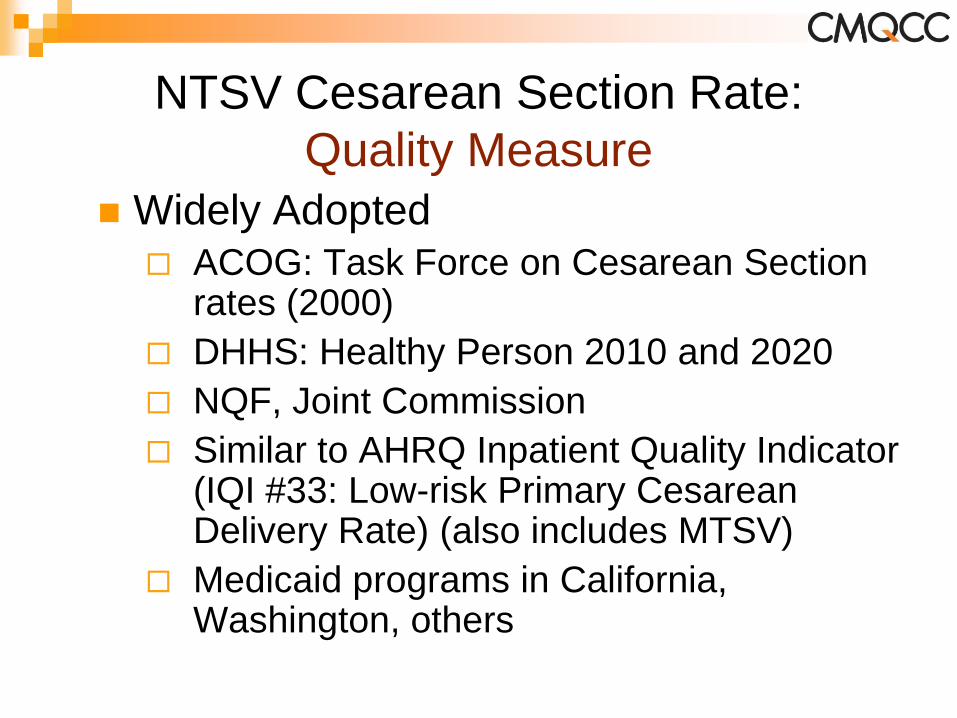
NTSV Cesarean Section Rate:
Quality Measure
Widely Adopted
ACOG: Task Force on Cesarean Section rates (2000)
DHHS: Healthy Person 2010 and 2020
NQF, Joint Commission
Similar to AHRQ Inpatient Quality Indicator (IQI #33: Low-risk Primary Cesarean Delivery Rate) (also includes MTSV)
Medicaid programs in California, Washington, others
: Transforming Maternity
Care
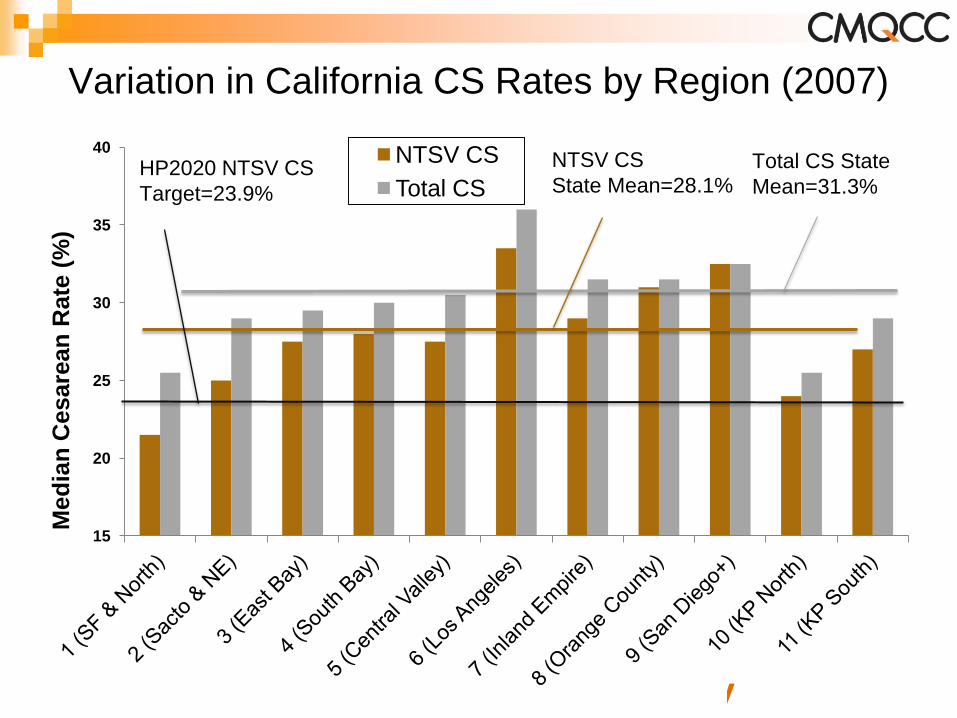
Variation in California CS Rates by Region (2007)
15
20
25
30
35
40
Med
ian
Cesare
an
Rate
(%
)
NTSV CS
Total CS
NTSV CS
State Mean=28.1% Total CS State
Mean=31.3% HP2020 NTSV CS
Target=23.9%

: Transforming Maternity
Care
In Effort to Limit C-Sections, Two Methods
Yield Different Results on Staten Island
Staten Island
University Hospital
23.2% Cesarean rate
Strong leadership and
determination
No elective inductions
prior to 41 wks
No elective CS
Non-interventionist
policy
Richmond University
Medical Center
48.3% Cesarean rate
“Perinatal Center”
(for high-risk pregnancies)
“Peer Review” to reduce
CS
2nd opinions for elective
CS (half-hearted?)
Susan Dominus NYT April 19, 2010

: Transforming Maternity
Care
So what do we mean by “culture” (1)
Nursing culture is about…
Experience in managing labor (versus charting,
caring for complications and FHR interpretation)
Value seen for vaginal birth
Importance of labor support
Flexibility and patience
OB culture is about…
All of the above, and…
Outside pressure (back to the office or family)
Perception of liability risk
“The way we do things around here”
: Transforming Maternity
Care
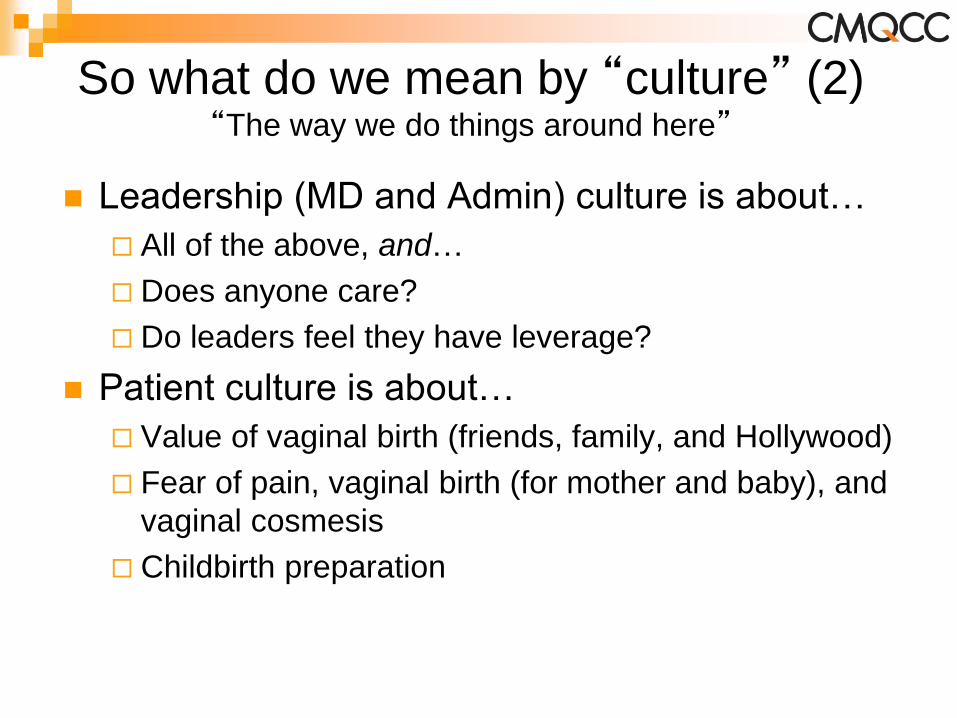
So what do we mean by “culture” (2)
Leadership (MD and Admin) culture is about…
All of the above, and…
Does anyone care?
Do leaders feel they have leverage?
Patient culture is about…
Value of vaginal birth (friends, family, and Hollywood)
Fear of pain, vaginal birth (for mother and baby), and
vaginal cosmesis
Childbirth preparation
“The way we do things around here”

: Transforming Maternity
Care
Primary CS QI Pathways
Which is the driver in my hospital??
Latent phase admission
Nullip (first birth) labor induction
Esp. with unfavorable cervix
Dystocia/Failure to progress
Arrest or protraction disorder
Non-reassuring Fetal Status
Oxytocin/misoprostol associated tachysytole
2nd Stage (failure of descent)
Predicted macrosomia
Patient choice

The California
Maternal Data Center
(CMDC)
Anne Castles, MPH, MA Kathryn Melsop, MS
CMDC Project Managers
Elliott Main, MD
CMQCC Medical Director
: Transforming Maternity Care
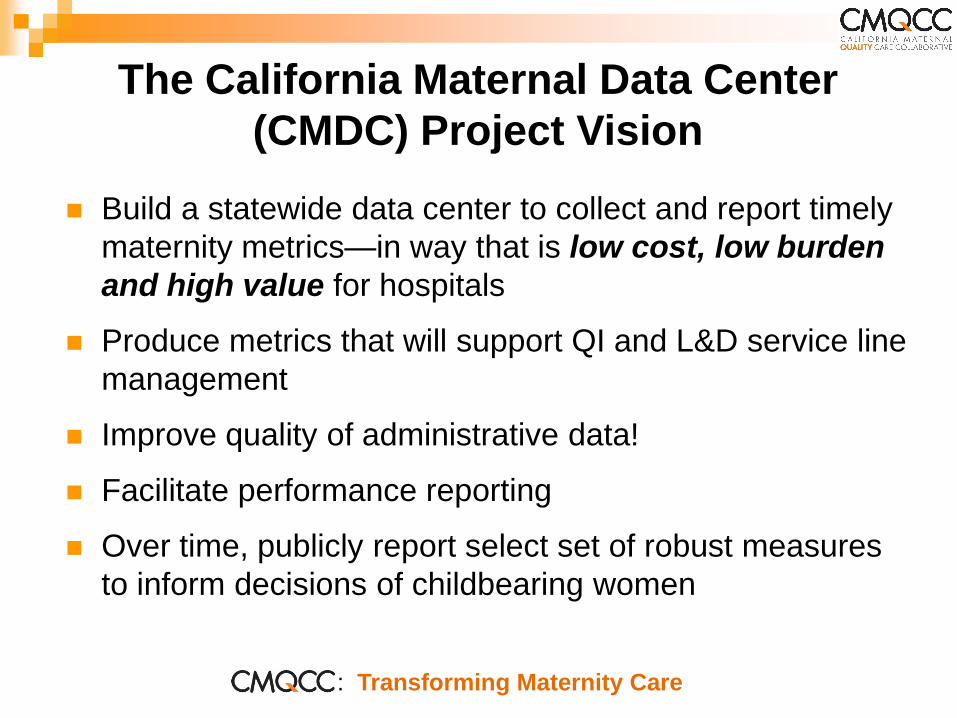
The California Maternal Data Center
(CMDC) Project Vision
Build a statewide data center to collect and report timely
maternity metrics—in way that is low cost, low burden
and high value for hospitals
Produce metrics that will support QI and L&D service line
management
Improve quality of administrative data!
Facilitate performance reporting
Over time, publicly report select set of robust measures
to inform decisions of childbearing women

: Transforming Maternity Care
Key Issue
Data most useful for hospital QI if:
Data available in rapid-cycle fashion—so actually
useful for motivating quality improvement! Program does not entail significant additional data
reporting burden for hospitals
23
: Transforming Maternity Care
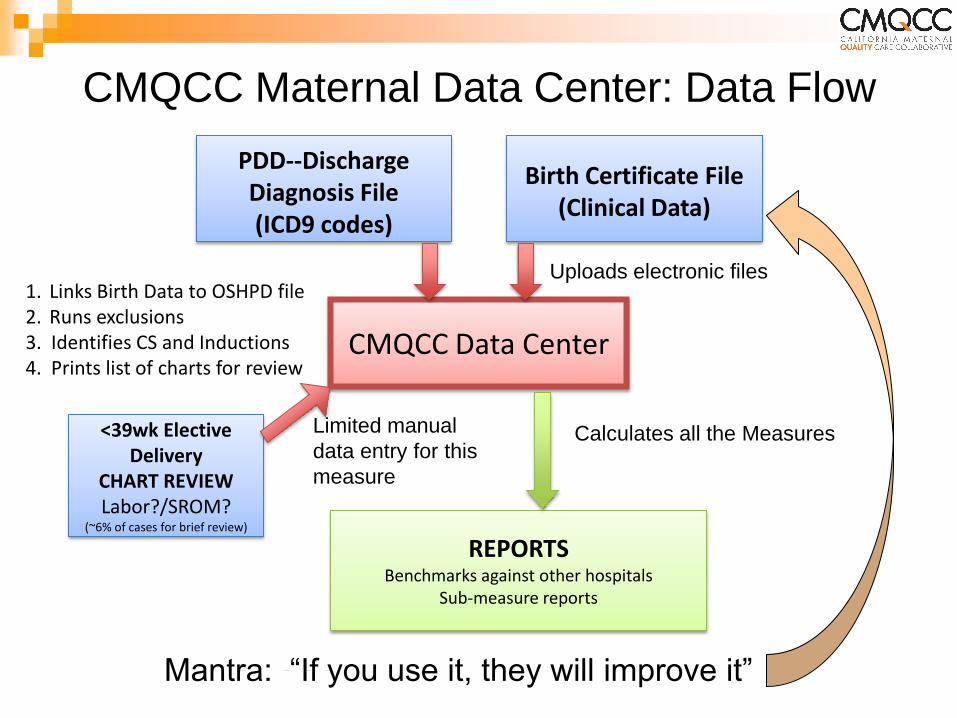
PDD--Discharge Diagnosis File (ICD9 codes)
Birth Certificate File (Clinical Data)
1. Links Birth Data to OSHPD file 2. Runs exclusions 3. Identifies CS and Inductions 4. Prints list of charts for review
CMQCC Maternal Data Center: Data Flow
CMQCC Data Center
REPORTS Benchmarks against other hospitals
Sub-measure reports
Calculates all the Measures <39wk Elective Delivery
CHART REVIEW Labor?/SROM?
(~6% of cases for brief review)
Limited manual
data entry for this
measure
Uploads electronic files
Mantra: “If you use it, they will improve it”
: Transforming Maternity Care
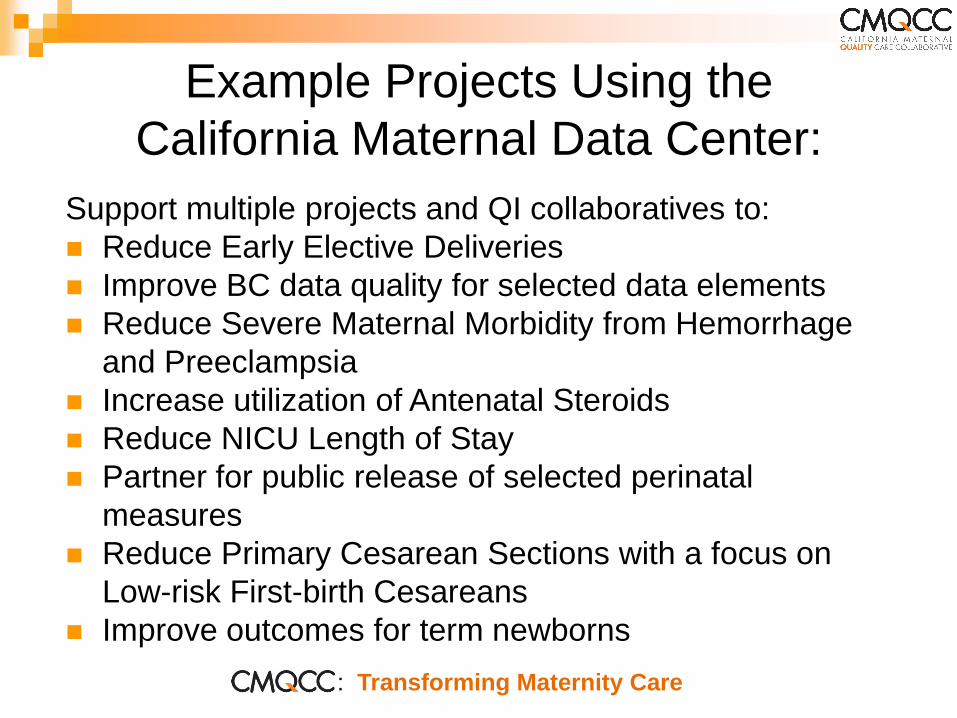
Example Projects Using the
California Maternal Data Center:
Support multiple projects and QI collaboratives to:
Reduce Early Elective Deliveries
Improve BC data quality for selected data elements
Reduce Severe Maternal Morbidity from Hemorrhage
and Preeclampsia
Increase utilization of Antenatal Steroids
Reduce NICU Length of Stay
Partner for public release of selected perinatal
measures
Reduce Primary Cesarean Sections with a focus on
Low-risk First-birth Cesareans
Improve outcomes for term newborns

0%
10%
20%
30%
40%
50%
60%
70%
80%
1
6
11
16
21
26
31
36
41
46
51
56
61
66
71
76
81
86
91
96
10
1
10
6
11
1
11
6
12
1
12
6
13
1
13
6
14
1
14
6
15
1
15
6
16
1
16
6
17
1
17
6
18
1
18
6
19
1
19
6
20
1
20
6
21
1
21
6
22
1
22
6
23
1
23
6
24
1
24
6
25
1
Total CS Rate Among 251 California Hospitals 2011-2012
(Source: CMQCC--California Maternal Data Center combining primary data from OSHPD and Vital Records)
Range: 15.0—71.4%
Median: 32.5%
Mean: 32.8%
July 24, 2013 26
0%
10%
20%
30%
40%
50%
60%
70%
80%
1
6
11
16
21
26
31
36
41
46
51
56
61
66
71
76
81
86
91
96
10
1
10
6
11
1
11
6
12
1
12
6
13
1
13
6
14
1
14
6
15
1
15
6
16
1
16
6
17
1
17
6
18
1
18
6
19
1
19
6
20
1
20
6
21
1
21
6
22
1
22
6
23
1
23
6
24
1
24
6
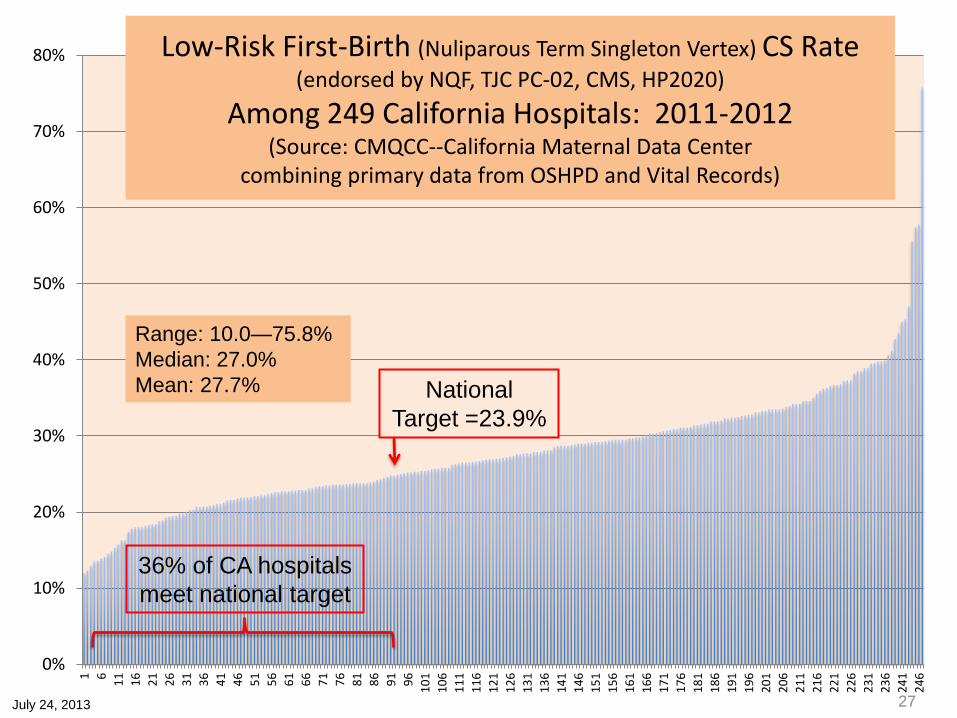
Low-Risk First-Birth (Nuliparous Term Singleton Vertex) CS Rate (endorsed by NQF, TJC PC-02, CMS, HP2020)
Among 249 California Hospitals: 2011-2012 (Source: CMQCC--California Maternal Data Center
combining primary data from OSHPD and Vital Records)
Range: 10.0—75.8%
Median: 27.0%
Mean: 27.7% National
Target =23.9%
July 24, 2013
36% of CA hospitals
meet national target
27
0%
10%
20%
30%
40%
50%
60%
70%
80%
1
6
11
16
21
26
31
36
41
46
51
56
61
66
71
76
81
86
91
96
10
1
10
6
11
1
11
6
12
1
12
6
13
1
13
6
14
1
14
6
15
1
15
6
16
1
16
6
17
1
17
6
18
1
18
6
19
1
19
6
20
1
20
6
21
1
21
6
22
1
22
6
23
1
23
6
24
1
24
6
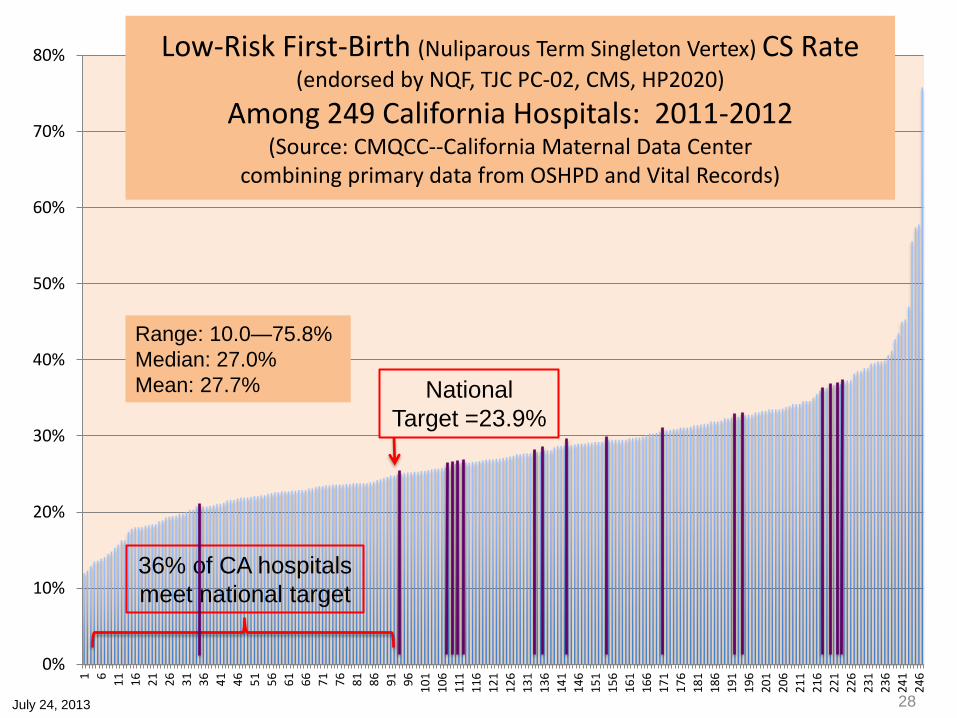
Low-Risk First-Birth (Nuliparous Term Singleton Vertex) CS Rate (endorsed by NQF, TJC PC-02, CMS, HP2020)
Among 249 California Hospitals: 2011-2012 (Source: CMQCC--California Maternal Data Center
combining primary data from OSHPD and Vital Records)
Range: 10.0—75.8%
Median: 27.0%
Mean: 27.7% National
Target =23.9%
July 24, 2013
36% of CA hospitals
meet national target
28

3 Major Drivers of the Primary CS Rate
Sample Hospital
Sample Hospital

Comparison Rates for the 3 Major Drivers
Sample Hospital

3 Major Drivers of the NTSV CS Rate
Sample Hospital
Sample Hospital
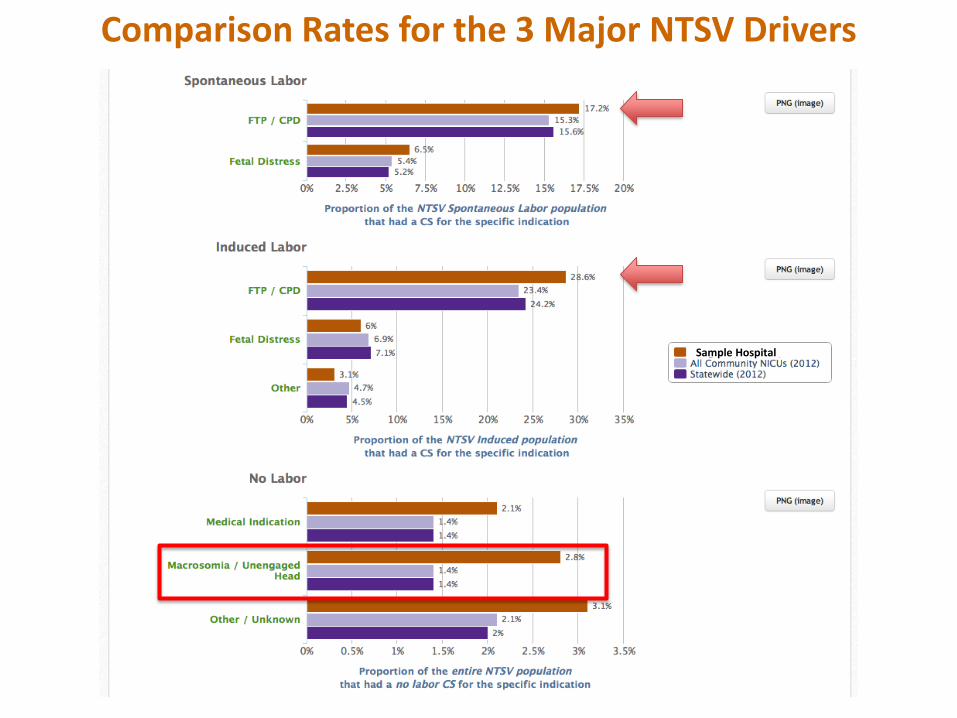
Comparison Rates for the 3 Major NTSV Drivers
Sample Hospital
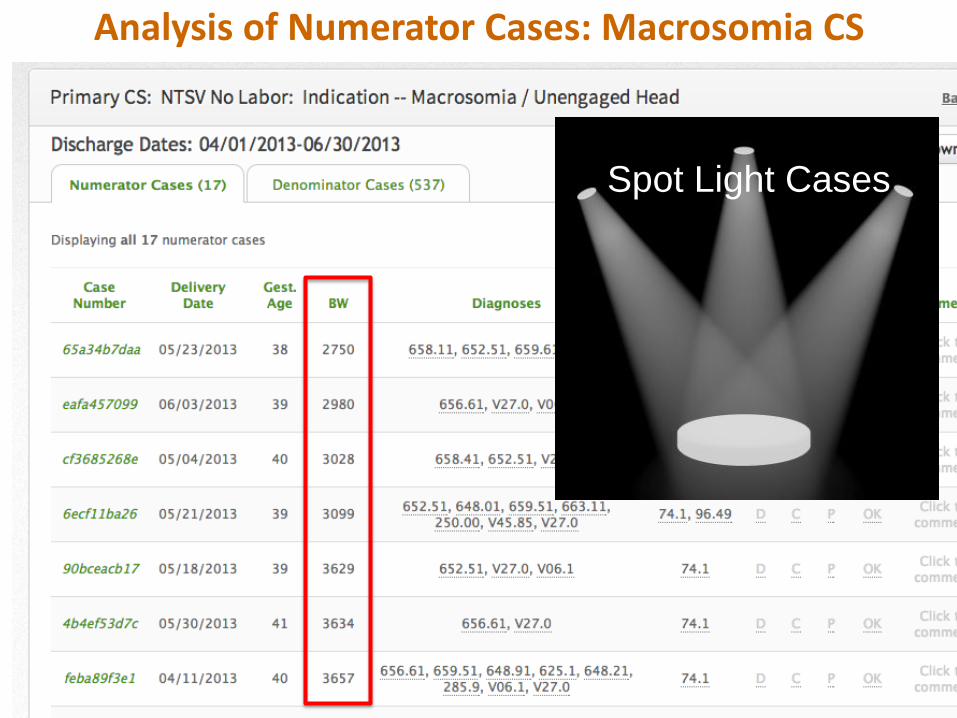
Analysis of Numerator Cases: Macrosomia CS
Spot Light Cases

3 Major Drivers of the Multip-TSV CS Rate
Sample Hospital
Sample Hospital

Pro
vid
er-
Leve
l Ce
sare
an R
ate
s
G5xxxx
G6xxxx
G7xxxx
G8xxxx
A8xxxx
A6xxxx
A5xxxx
A4xxxx
A8xxxx
A9xxxx
Sample Hospital
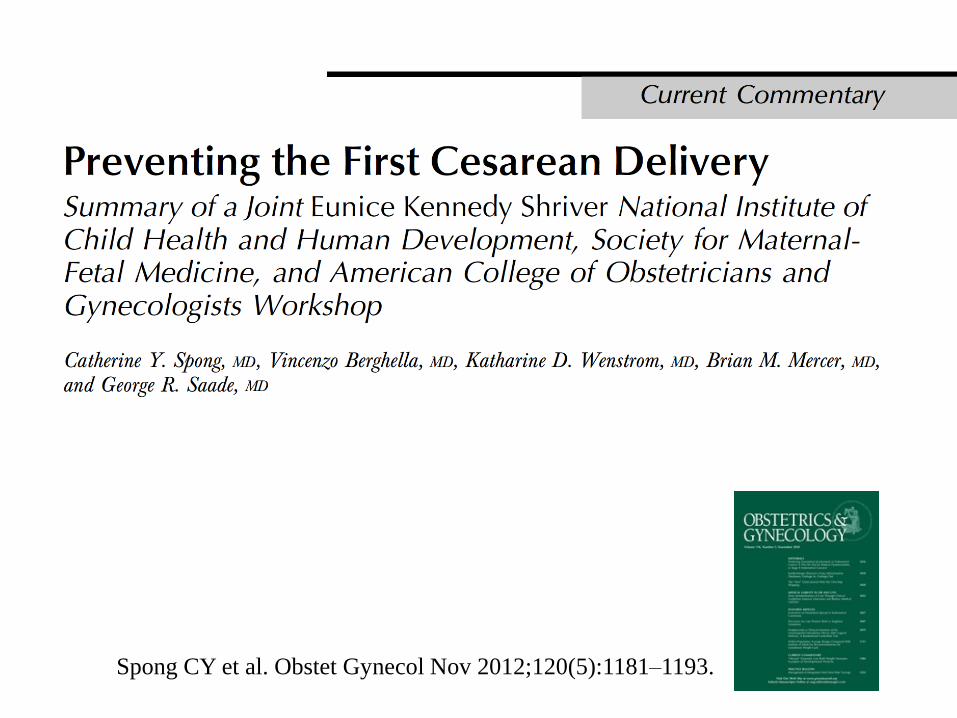
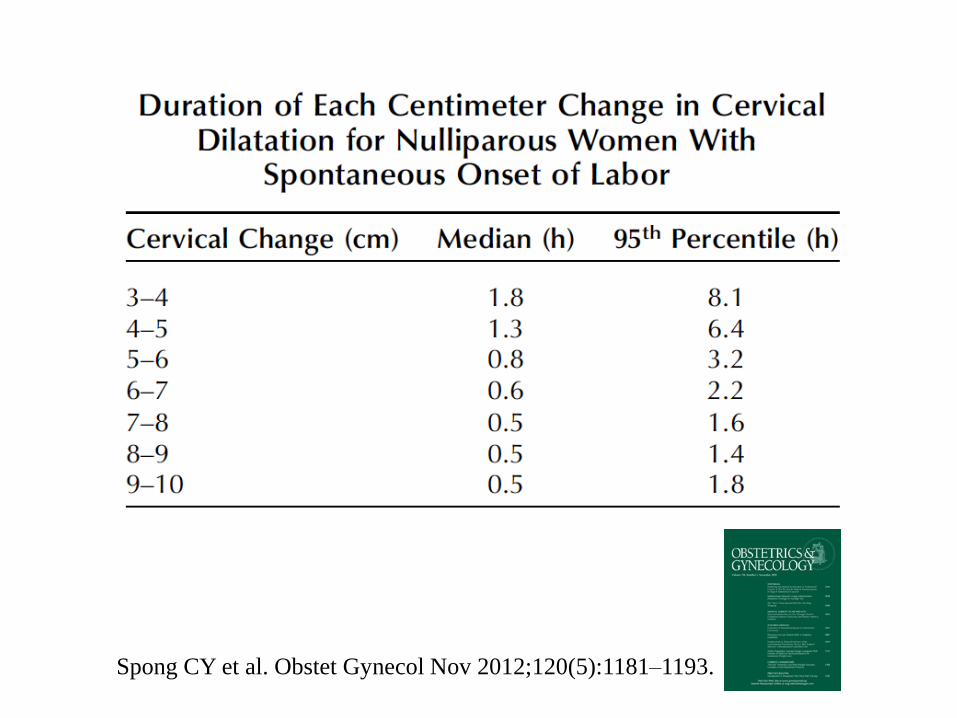
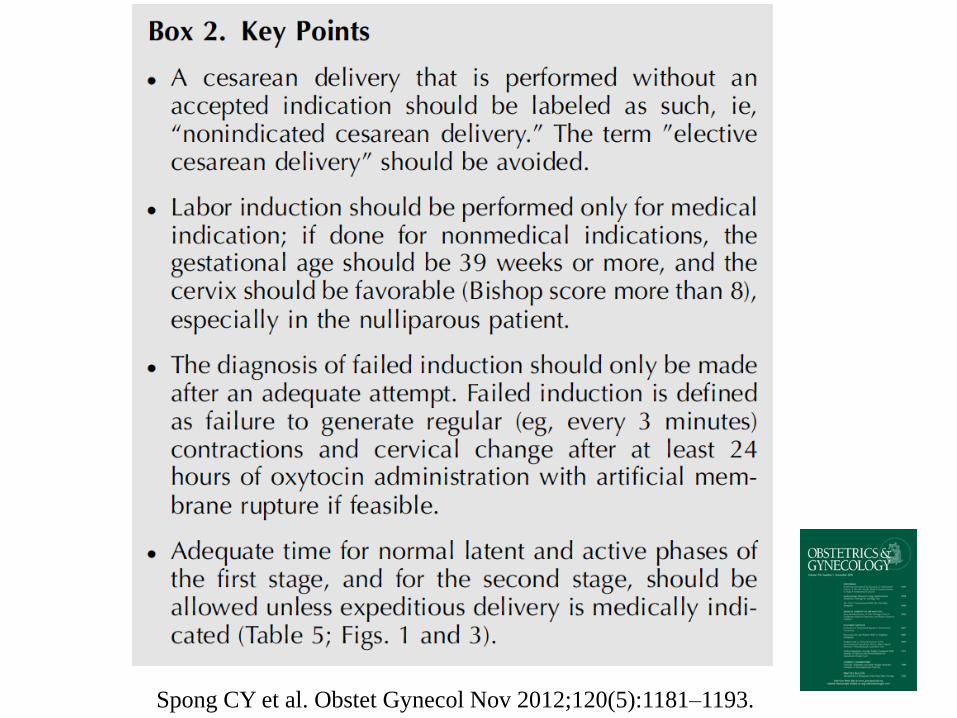
Spong CY et al. Obstet Gynecol Nov 2012;120(5):1181–1193.
Spong CY et al. Obstet Gynecol Nov 2012;120(5):1181–1193.
Spong CY et al. Obstet Gynecol Nov 2012;120(5):1181–1193.
Spong CY et al. Obstet Gynecol Nov 2012;120(5):1181–1193.

Spong CY et al. Obstet Gynecol Nov 2012;120(5):1181–1193.

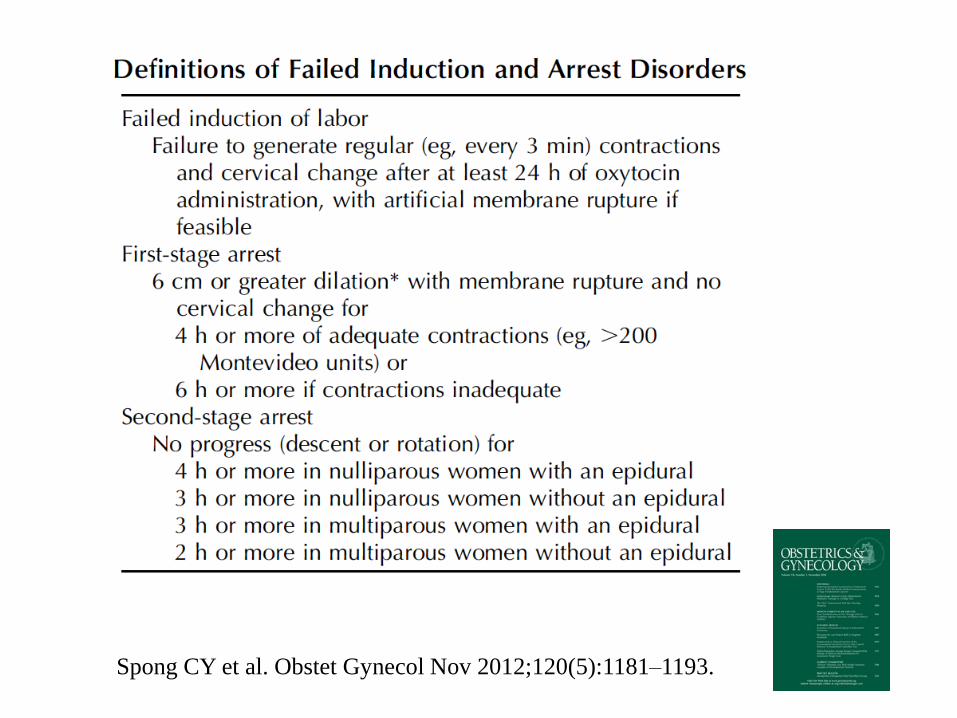
Case Review For Cesarean during First Stage Labor (before 10cm dilation)
Cervix 6 cm or greater and no change X 4 hours
Membranes ruptured
Adequate Uterine activity: > 200 Montivideo units x 4 hrs., or Q 3 minute palpably
strong contractions when not feasible to rupture membranes.
OR
< 200 Montivideo units or < 3/10 minute contractions x6 hrs. despite Oxytocin administration.
Example Checklist: All 3 should be present
Modified from:

Take the “Test” in Your Hospital…
• Identify 20 cases of CS in the first sage of labor performed for Labor dystocia/Failure to progress
• Review using the Check List
• How many will fail the 3 criteria?

Common sense approach to
Category II fetal monitor strips!
Clark SL et al. Am J Obstet Gynecol Aug 2013;209(2):89-97


Significant decelerations are defined as any of the following:
• Variable decelerations lasting longer than 60 seconds
and reaching a nadir more than 60 bpm below baseline.
• Variable decelerations lasting longer than 60 seconds and reaching a nadir less than 60 bpm regardless of the baseline.
• Any late decelerations of any depth. • Any prolonged deceleration, as defined by the NICHD.
Due to the broad heterogeneity inherent in this definition, identification of a prolonged deceleration should prompt discontinuation of the algorithm until the deceleration is resolved.
Clark SL et al. Am J Obstet Gynecol Aug 2013;209(2):89-97
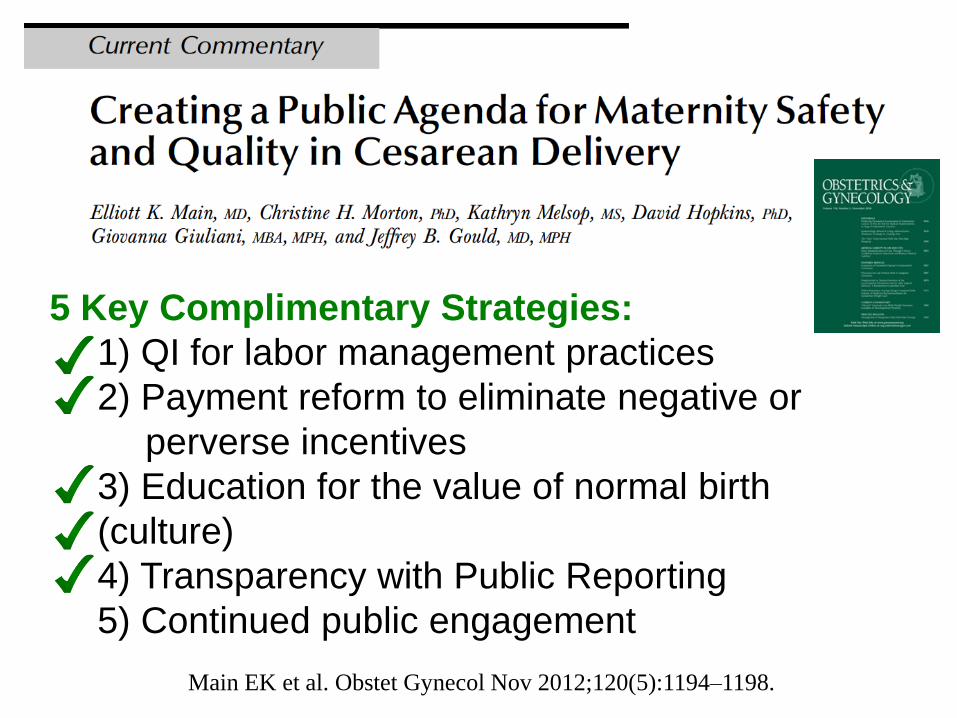
Main EK et al. Obstet Gynecol Nov 2012;120(5):1194–1198.
5 Key Complimentary Strategies:
1) QI for labor management practices
2) Payment reform to eliminate negative or
perverse incentives
3) Education for the value of normal birth
(culture)
4) Transparency with Public Reporting
5) Continued public engagement
: Transforming Maternity Care
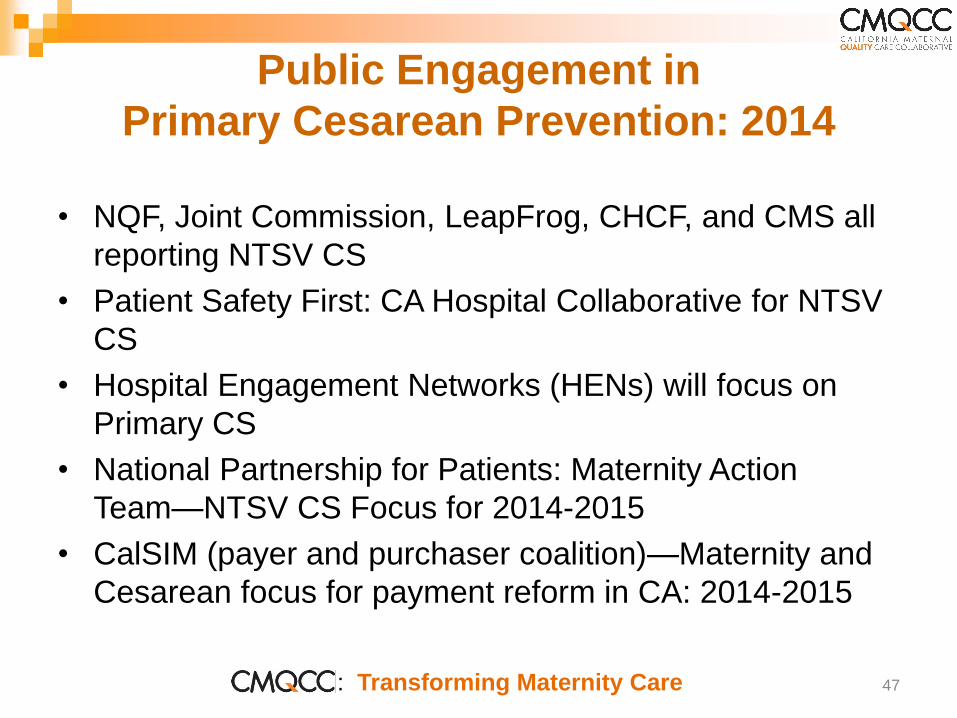
Public Engagement in
Primary Cesarean Prevention: 2014
• NQF, Joint Commission, LeapFrog, CHCF, and CMS all
reporting NTSV CS
• Patient Safety First: CA Hospital Collaborative for NTSV
CS
• Hospital Engagement Networks (HENs) will focus on
Primary CS
• National Partnership for Patients: Maternity Action
Team—NTSV CS Focus for 2014-2015
• CalSIM (payer and purchaser coalition)—Maternity and
Cesarean focus for payment reform in CA: 2014-2015
47

: Transforming Maternity
Care
Primary Cesarean QI Steps
Identify the local leaders
MD, RN and Admin
Identify your hospital's issue (Focus!)
CMDC is available in your hospital
Use the Checklists
CMQCC Toolkit and Change packages
Ready in Feb 2014
QI Mentoring (potential)
Sharing of experiences

: Transforming Maternity
Care
Today’s Discussion:
What are the drivers for the rise and variation
in Primary CS?
NTSV (Nulliparous, Term Singleton, Vertex) as
the focus for CS Quality Improvement
Importance of L&D culture, Labor practices,
and use of Data and the California Maternal
Data Center to drive change
Multi-strategy approach to address CS rates
Public projects to support this initiative