a re-examination of the slave diet a thesis … re-examination of the slave diet a thesis the honors...
TRANSCRIPT
A RE-EXAMINATION OF THE SLAVE DIET
A THESIS
The Honors Program
College of St. Benedict/St. John’s University
In Partial Fulfillment
of the Requirements for the Distinction of “All College Honors”
and the Degree Bachelor of Arts
In the Departments of History and Nutrition
by
Beth Blonigen
March, 2004

2
The genre of literature discussing the lives of slaves throughout United States
history is vast and covers all aspects of slavery from the viewpoints of different
researchers. The slaves’ quality of life is a complex topic since each plantation had its
own unique way of running, and slaves’ experiences on the plantation differed in their
access to food, housing and clothing, and treatment and punishments. The aspect of the
slaves’ life that is the focus of this study is the slaves’ diet on the plantation. This study
challenges the recent argument by Robert Fogel and Stanley Engerman that slave diets
were calorically and nutritionally adequate.
Previous studies on the slaves’ life have fit into several general categories. Some
researchers have reported that the slaves’ life was materially good. These researchers
argue that slavery was oppressive, but it was not as cruel as past historians first thought
and their material lives were comparable to free white laborers of the time.1
A second category of researchers describes the slaves’ material lives as awful.
This view paralleled that of abolitionists in the antebellum period. One source that
supports this view on the quality of life is the journal of Fanny Kemble. In one
publication of her journal, Kemble notes how the slave dwellings were filthy and
cramped, and the slaves unkempt. She says, “Slavery is answerable for all the
evils…from lying, thieving and adultery to dirty houses, ragged clothes and foul smells.”2
This description contrasts greatly from the view that life was quite good for the slaves in
that period in history.
1 R.W. Fogel, & S.L. Engerman, Time on the Cross: The Economics of American Negro Slavery, 2 vols. (Boston: Little, Brown and Company, 1974), 77-78, 107-44.2 Ibid., 158-59; F.A. Kemble, Journal of a Residence on a Georgian Plantation in 1838-1839 (New York: Alfred A. Knopf, 1961), 24; U.B. Phillips, Life and Labor in the Old South (Boston: Little, Brown and Company, 1963), 261.

3
The most recent research on the slaves’ quality of life comes from economic
historians, headed by Robert Fogel and Stanley Engerman.3 The economic historians
argue that slaves were considered an economic investment, and plantation owners were
good businessmen who knew that they needed to protect their “property” in order to
make a profit. Economic historians used quantitative methods to support their
conclusions. Fogel and Engerman reasoned that plantation owners would not
intentionally starve their slaves because the owners could not profit with slaves who were
weak or susceptible to disease due to malnutrition. They point out that
Slavery was not a system irrationally kept in existence by plantation owners who failed to perceive or were indifferent to their best economic interests. The purchase of a slave was generally a highly profitable investment which yielded rates of return that compared favorably with the most outstanding investment opportunities in manufacturing.4
This group of researchers argues that it would not be good business for owners to
“damage” their property. This study focuses on the economic historians’ view of the
slaves’ diet and nutritional health as it relates to slaves’ quality of life.
The nutritional requirements of slaves in the 19th century are similar to
what people require today. As with contemporary Americans, those in the 1800s
needed a balanced diet; and, of course, dietary luxuries like enriched grains and
processed foods were not available. Still, economic historians, like Fogel and
Engerman, argue that the slave diet was adequate. However, different
conclusions are reached when corrections are made for inedible portions of food
and nutrient losses due to processing and storage, and more accurate estimates of
slave energy expenditure are used. Although Fogel and Engerman used a
3 Fogel, Time on the Cross: The Economics of American Negro Slavery.4 Ibid., 4.

4
quantitative scientific approach towards their analysis of the slave diet, the
resources available to them in the 1970s were limited. One example is that
economic historians used the disappearance method to find the amount of food
available for consumption, assuming that all food “available” was consumed.
There are three main nutritional corrections that need to be applied to the
methodology of economic historians in order to develop an accurate conclusion regarding
the slaves’ diet and nutritional health. First, economic historians based their conclusions
on the analysis of raw foods. This method results in a reduced nutrient content of food
when it is consumed because some nutrients are destroyed when they are cooked;
additionally, processing reduces nutrient content. Secondly, these researchers did not
consider inedible portions of food that had to be removed before the food was consumed,
thus decreasing the amount of food available for consumption. Finally, economic
historians did not evaluate the slaves’ energy expenditure, a factor that greatly affected a
slave’s caloric needs.
Major Studies of Slave Nutrition by Economic Historians
Economists Robert Fogel and Stanley Engerman conducted one of the largest and
most well-known studies on slavery. Through the analysis of census documents and
other data and focusing on cotton plantations, they concluded that the slave diet provided
4,185 calories daily, calorically adequate by “modern” (1964) standards. These
economists claimed that slaves were fed adequately and that their standard of living was
quite similar to white laborers of that time.5
5 Ibid., 97, 99, 111-15.

5
Dale Swan completed another study that examined the slave diet. Swan’s study
looked specifically at slaves on rice plantations, using agricultural and population census
documents to construct the most cost-efficient diet. His diet, using the five main foods
available to slaves at the time, met the range of recommended caloric intakes for an adult
male slave, which he found to be 3,150-4,200 calories; but, Swan did not look
specifically at the nutrient adequacy of the diet, since his main focus was to find the
cheapest diet to fulfill caloric needs.6
This study uses much of the same methodology as Fogel and Engerman and
Swan; however, different conclusions are drawn about the nutritional adequacy of the
slaves’ diet. Analyzing rice plantation documents from a nutritional historian’s point of
view brings a different understanding of the nutritional adequacy of the diet, a position
that most economic historians do not share.
Methodology of Most Economic Historians
There are three main corrections that need to be made concerning the
methodology that economic historians use when analyzing the slave diet. Economic
historians calculate the amount of available food by the “disappearance method.” To
illustrate, the disappearance method takes the total amount of grain produced and
subtracts the animal feed allowances and the seed kept for the next year’s crop to find the
total amount of food available. This method assumes that all of the available food is
consumed. However, the total amount available is still not the amount of food actually
6 D.E. Swan, The Structure and Profitability of the Antebellum Industry 1859 (New York: Arno Press, 1972), 252-54, 58, 62-64.

6
consumed. For example, rotting and non-edible portions of produce were discarded and
grains had to be milled before they were consumed.7
Another correction to be made is that most economic historians analyzed raw food
for nutritional content. However, very little of the food was consumed raw, and the
vitamin content of raw versus cooked foods is considerably different. Prolonged storage
also decreases the vitamin content in grains and vegetables.8
The third correction that needs to be made is that economic historians do not
accurately assess the energy needs of the slave. Energy expenditure varies greatly
according to the specific work the slave does as well as the slave’s gender and weight.
Although Fogel and Engerman’s high calorie diet of 4,185 calories seems generous, it
would not have provided enough calories to meet the slaves’ energy needs on average
over the planting seasons. The high energy needs of slaves will be discussed more
extensively in the following pages.
This study attempts to make those corrections and focuses on rice plantation
slaves that lived along the coasts of Georgia and South Carolina in 1860.9 The general
contention that slaves had a calorically and nutritionally adequate diet stems from studies
in the past few decades that were mainly focused on cotton plantations in the antebellum
period, which was also the focus of Fogel and Engerman’s study. This study concludes
that the slave diet on rice plantations was calorically and nutritionally inadequate given
7 R. Macrae, R.K. Robinson, & M.J. Sadler, ed., Encyclopaedia of Food Science, Food Technology and Nutrition, 7 vols. (London: Academic Press, 1993), 3096, 321, 927; S.W. Souci, W. Fachmann, & H. Kraut, Food Composition and Nutrition Tables, 6th ed. (Stuttgart, Germany: medpharm GmbH Scientific Publishers, 2000), 12, 205, 07, 319, 28, 549, 635, 814.8 G.H. Beaton, & E.W. McHenry, eds., Nutrition, a Comprehensive Treatise, 3 vols., vol. 3 (New York: Academic Press, 1966), 249; P. Insel, E.E. Turner, & D. Ross, Nutrition (Massachusetts: Jones and Bartlett Publishers, 2002), 307-08.9 University of Virginia Geospatial and Statistical Data Center, United States Historical Census Data Browser (University of Virginia, 1998 [cited 31 May 2002]); available from http://fisher.lib.virginia.edu/collections/stats/histcensus/.

7
the amount of food that was available to the slaves and the amount of work the slaves
were required to complete.
The Disappearance Method
The major drawback of the disappearance method is that the non-edible portions
of the foods that had to be removed before consumption are not subtracted from the
calculated available food. Census records are unclear if the grains were already milled or
if the records account for the inedible portions of produce. Although some enumerators
recorded only the “clean” rice produced, the amount that was already milled, it is
unknown if that was a common practice with all goods enumerated in the census.10
The disappearance method does not correct for the inedible portions of produce,
such as sweet potato peels, which had to be discarded, or the premature rotting or supply
deterioration that occurred during storage. Small animals and worms may also have
contributed to supply deterioration.11 The following table represents typical foods that
were likely main components of the diet and the percent of food lost due to processing.
10 Swan, The Structure and Profitability of the Antebellum Industry 1859, 38.11 S.B. Hilliard, Hog Meat and Hoecake: Food Supply in the Old South, 1840-1860 (Carbondale: Southern Illinois University Press, 1972), 51.

8
Table 1. Percent of food as inedible before processing.12
Nutrient Losses in Food
Vitamin content can be considerably reduced when the food is exposed to light,
changes in pH level, heat, and cooking fluids. Cutting produce into small pieces for
cooking increases the surface area and allows for more of the water-soluble vitamins to
leach into the cooking water.13 The best way to avoid losing the vitamin content is to buy
fresh foods and eat them raw the same day. Slaves usually did not have this option, so
their nutrient intake would be reduced with cooking, and especially with prolonged
storage.
Slaves had few cooking methods to use and no real form of food preservation.
Most slaves boiled their vegetables, which can destroy 15-30% of the riboflavin. The
thiamin in pork would be destroyed when the meat was smoked, cured in brine, and
boiled. Prolonged storage of cornmeal can reduce the thiamin content by one-third to
12 Macrae, ed., Encyclopaedia of Food Science, Food Technology and Nutrition, 3096, 321, 927; Souci, Food Composition and Nutrition Tables, 12, 205, 07, 319, 28, 549, 635, 814.13 Insel, Nutrition, 307-08.
Food item Percent of food as inedible
Pork 21.5 (if includes the bone)
Sweet potatoes 19 (skins, bruises)
Cowpeas 60 (remove pod)
Rice 20 (remove the hull)
Oats 28 (remove the husk)
Wheat 17 (milling)

9
one-half, and another 30% of the thiamin can be destroyed when the cornmeal is
cooked.14
The amount of water-soluble vitamins lost in cooking also depends on the volume
of water covering the vegetable. Vegetables completely covered with water lose 80% of
the vitamin C; 60% if the vegetables are only half-covered, and 40% if the vegetables are
only one-quarter covered with water.15
Vitamin C, or ascorbic acid, is also lost due to storage. If kale is stored at room
temperature for 24 hours, it loses 30% of the vitamin C due to the chemical changes that
occur with wilting. Green-leafy vegetables lose 5-18% of their vitamin C content within
2 hours after being harvested, and that value increases dramatically to 35-60% by 8 hours
and up to 90% in 24 hours.16
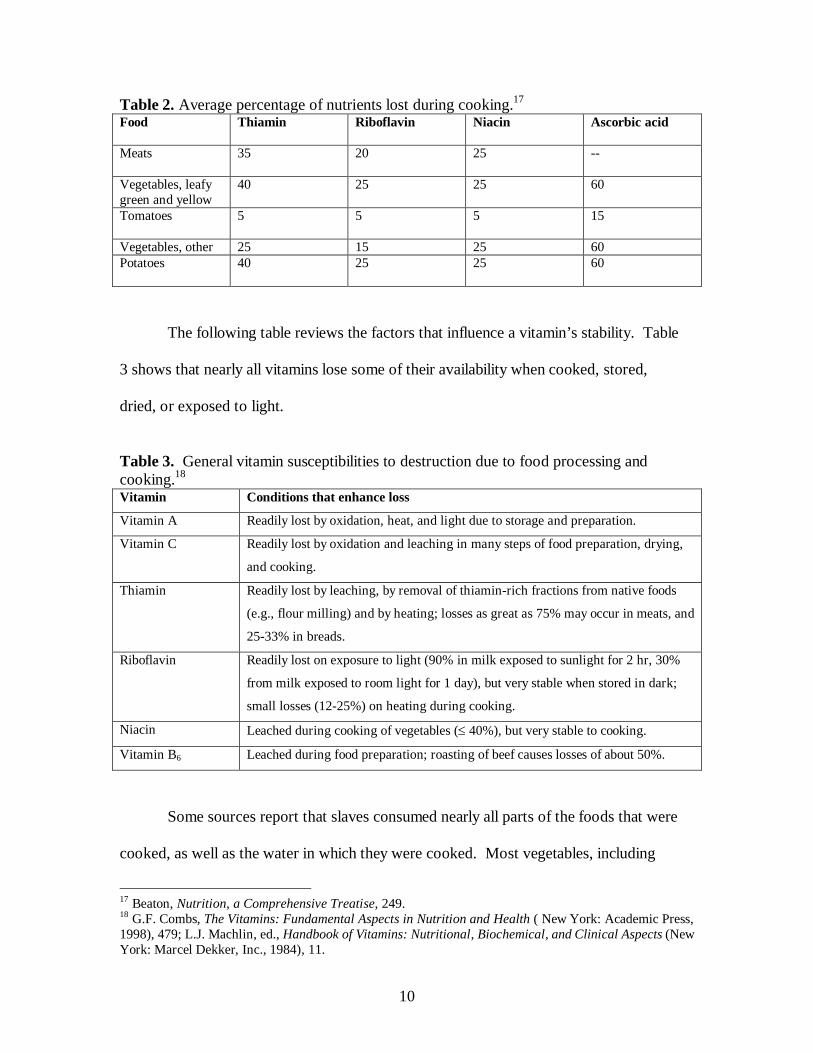
Table 2 demonstrates the water-soluble vitamin losses of a range of foods due to
cooking. When the potatoes were cooked, 40% of the thiamin, 25% of the riboflavin and
niacin, and 60% of the vitamin C is completely lost. The cooking of white and sweet
potatoes, whether baked or boiled, would have destroyed some of the nutrients available
in those foods. There is no vitamin C lost in meats because there is no vitamin C to be
destroyed—vitamin C is found mainly in fruits and vegetables.
14 P.A. David, H.G. Gutman, R. Sutch, P. Temin, & G. Wright, Reckoning with Slavery: A Critical Study in the Quantitative History of American Negro Slavery (New York: Oxford University Press, 1976), 279-80; T. Gibbs, K. Cargill, L.S. Lieberman, & E. Reitz, "Nutrition in a Slave Population: An Anthropological Examination," Medical Anthropology 4 (1980): 233.15 Processed Food (Nestle, [cited 22 October 2003]); available from http://www.nestle.co.uk/nutrition/articles/processed_food.asp.16 D.A. Bender, & A.E Bender, Nutrition, a Reference Handbook (New York: Oxford University Press, 1997), 446, 65.
10
Table 2. Average percentage of nutrients lost during cooking.17
Food Thiamin Riboflavin Niacin Ascorbic acid
Meats 35 20 25 --
Vegetables, leafy green and yellow
40 25 25 60
Tomatoes 5 5 5 15
Vegetables, other 25 15 25 60Potatoes 40 25 25 60
The following table reviews the factors that influence a vitamin’s stability. Table
3 shows that nearly all vitamins lose some of their availability when cooked, stored,
dried, or exposed to light.
Table 3. General vitamin susceptibilities to destruction due to food processing and cooking.18
Vitamin Conditions that enhance loss
Vitamin A Readily lost by oxidation, heat, and light due to storage and preparation.
Vitamin C Readily lost by oxidation and leaching in many steps of food preparation, drying,
and cooking.
Thiamin Readily lost by leaching, by removal of thiamin-rich fractions from native foods
(e.g., flour milling) and by heating; losses as great as 75% may occur in meats, and
25-33% in breads.
Riboflavin Readily lost on exposure to light (90% in milk exposed to sunlight for 2 hr, 30%
from milk exposed to room light for 1 day), but very stable when stored in dark;
small losses (12-25%) on heating during cooking.
Niacin Leached during cooking of vegetables ( 40%), but very stable to cooking.
Vitamin B6 Leached during food preparation; roasting of beef causes losses of about 50%.
Some sources report that slaves consumed nearly all parts of the foods that were
cooked, as well as the water in which they were cooked. Most vegetables, including
17 Beaton, Nutrition, a Comprehensive Treatise, 249.18 G.F. Combs, The Vitamins: Fundamental Aspects in Nutrition and Health ( New York: Academic Press, 1998), 479; L.J. Machlin, ed., Handbook of Vitamins: Nutritional, Biochemical, and Clinical Aspects (New York: Marcel Dekker, Inc., 1984), 11.

11
turnips, peas, cabbage, collards, beans, and other greens, were boiled for hours. A few
accounts suggest that a chunk of pork was put in the pot to add some flavor. When the
vegetables were cooked, the “pot-likker” or broth was consumed with corn pone, which
was often crumbled into the pot and mixed with the broth as part of the meal. This
practice allowed the slaves to retain some of the food’s vital nutrients, although the slaves
were probably unaware of this vitamin recovery.19 Since there is no substantial evidence
to prove that the slaves consumed the broth, the magnitude of nutrient losses due to
cooking cannot be precisely estimated. Even if the slaves consumed the cooking water,
some vitamins were destroyed due to oxidation or heat damage. The possibility of these
losses, however, should be acknowledged when explaining the slave diet and its
adequacy because it could be a significant factor.
Energy Expenditure
The energy expenditure of a slave differed dramatically during different times in
the planting season. For example, a male slave on a rice plantation would expend about
4,400 calories during an “easy” day of repair work when the rice was growing or already
harvested. The slave worked on other tasks around the plantation, such as chopping
down trees and carrying the logs back to the plantation, repairing cabins, scaring rice
birds out of the rice fields, and tending their gardens. On a “hard” day during harvest
time the slave would have burned about 8,700 calories (the slave usually spent about 15
hours harvesting the rice, leaving little time or energy to do other tasks at the end of the
day). Rice harvesting took place during the fall months, so the high value for energy
19 J.B. Boles, Black Southerners 1619-1869 (Lexington: The University Press of Kentucky, 1983), 51; Fogel, Time on the Cross: The Economics of American Negro Slavery, 98.

12
expenditure likely only lasted for 3 months. Weighing the expenditure and the time
under each kind of working conditions, the average energy expenditure for a male rice
plantation slave over the year would be about 5,500 calories a day in order to maintain
the slave’s body weight and strength.20 This average intake would probably have been
enough for the slave during lighter months, but the slave would have needed a much
greater caloric intake during the fall harvest season. Since the average energy need for a
slave was about 5,500 calories, there may have been times throughout the year when the
slave gained or lost weight as the amount of work changed seasonally. The following
table estimates the amount of calories a slave could have burned as the planting season
changed.
Table 4. The energy expenditure of an adult male rice plantation slave on “easy” and “hard” workdays.21 “Easy” Day
“Hard” Day
Activity Time (min)
Rate (kcal/min x weight)
Kcals used
Activity Time (min)
Rate (kcal/min x weight)
Kcals used
Sleep 480 1.16 557 Sleep 360 1.16 472
Eat, sit 180 1.61 290 Eat, sit 180 1.61 290
Tend garden
180 5.74 1033 Harvest 900 8.82 7938
Chop trees 60 13.02 781
Carry logs 60 9.24 554
Scare birds 300 1.89 567
Repair cabins
180 3.64 655
TOTAL 1440 4437 TOTAL 1440 8700
20 Gibbs, "Nutrition in a Slave Population: An Anthropological Examination," 236-48; W.D. McArdle, F.I. Katch, & V.L. Katch, Exercise Physiology: Energy, Nutrition, and Human Performance, 3rd ed. (Philadelphia: Lea & Febiger, 1991), 804-10.21 Gibbs, "Nutrition in a Slave Population: An Anthropological Examination," 236-48; McArdle, Exercise Physiology: Energy, Nutrition, and Human Performance, 804-10.

13
History of Rice Plantations
On rice plantations, 74% of male slaves and 90% of female slaves were field
hands working under the task system.22 The task system was a method of dividing the
work force according to each slave’s labor abilities. Each slave was assigned to a plot of
land that had to be worked until the job was completed. The task system was efficient in
utilizing the slaves’ labor and providing an incentive to work hard and get the job done
early. The pace of the work depended on the slave’s skill with the assigned task. When
it was not harvest season, a majority of workers were done by four o’clock in the
afternoon, with the more productive hands often finishing their tasks by two o’clock and
some even by one o’clock. The slaves then returned to their cabins to do personal tasks,
like tending their garden.23
The season of rice planting lasted nearly the entire year, but the duration and
amount of hard labor required by each slave varied with the season; therefore, the slaves’
energy expenditure also changed with the seasons. The soil was broken in the fall, and
by early spring the fields were smoothed and trenched with hoes. Between March and
May, the fields were seeded and flooded for a week, commonly referred to as “sprout
flow.” Then the field was drained and kept dry until plant growth was flourishing. A
week of “point flow” flooding occurred and was followed by two weeks of dryness for
light hoeing and weed pulling. Next, the “long flow” flooding took two to three weeks,
followed by vigorous hoeing, and the “lay-by flow” which lasted for two or three months.
22 J.F. Olson, “The Occupational Structure of Southern Plantations during the Late Antebellum Era” in R.W. Fogel, & S.L. Engerman, Without Consent or Contract: The Rise and Fall of American Slavery-Conditions of Slave Life and the Transition to Freedom: Technical Papers, vol. 1 (New York: W.W. Norton & Company, 1992), 143.23 F.L. Olmsted, Journey in the Seaboard Slave States with Remarks on Their Economy (New York: Dix & Edwards, 1856), 435; U.B. Phillips, The Slave Economy of the Old South (Baton Rouge: Louisiana State University Press, 1968), 102-03.

14
The crop was ready for harvest when it stood shoulder high and thick, with the rice
bending the stalks with its weight. Just before the rice was ripe, the crop had to be
guarded from ricebirds (bobolinks). The migration pattern of these birds coincided with
the beginning of the harvest season; slaves were stationed in the fields to scare the birds
away. Rice harvesting began in early September. After harvesting, thrashing separated
the seeds from the straw. This was followed by the task of removing the rice grain from
the husk in the mill. The rice was then sifted to be separated from its flour and broken
parts, and the whole rice was removed and barreled for market.24
Some Aspects of the Slave Diet
Most sources state the allotment of meat for slaves was from two to five pounds
of pork a week, averaging about three pounds. Corn dominated throughout most of the
South as a staple in everyone’s diet since it was cheap and could be grown in almost
every region of the South. Rice consumption along the rice coast was high relative to
other regions in the South. When the rice was produced, some of it was damaged or
“broken,” so this low-grade rice was kept for home consumption while the best rice was
sold. The high production and low cost of broken rice made it another staple in the diets
of slaves and free people in the rice region.25
The task system allowed the slaves time during the day to tend gardens, hunt, and
fish during most of the year—they probably did not have the time or energy to do these
24 L.A. Chamerovzow, ed., Slave Life in Georgia: A Narrative of the Life of John Brown (New York: Books for Library Press, 1971), 185-89; J.H. Easterby, ed., The South Carolina Rice Plantation as Revealed in the Papers of Robert F.W. Allston (Chicago: University of Chicago Press, 1945), 31-32; Olmsted, Journey in the Seaboard Slave States with Remarks on Their Economy, 466-77; U.B. Phillips, American Negro Slavery (Baton Rouge: Louisiana State University Press, 1966), 89-90.25 Hilliard, Hog Meat and Hoecake: Food Supply in the Old South, 1840-1860, 48-50, 105, 52, 58-59; J.F. Smith, Slavery and Rice Culture in Low Country Georgia 1750-1860 (Knoxville: The University of Tennessee Press, 1985), 115.

15
things during the 3-month harvest season. Most slaves were able to have private gardens
to grow produce and add supplemental foods to their diets. Most families had a garden,
and if it was about one-half to one acre big, it could have supplied a family with enough
vegetables for the year. The climate along the rice coast allowed the slaves to grow white
potatoes and green vegetables such as cabbages, turnip greens, beans, and collards
throughout the year. The vegetables grown in the garden plots augmented the slave’s
diet, but since there is no specific evidence about amount of food supplemented by the
garden, these foods were not analyzed as part of the food available for slave consumption
in this study. In addition, the planter usually gave rations of vegetables that may have
included sweet potatoes, peas, or turnips along with the meat and corn. Other ways to
supplement the diet included hunting fowl, deer, raccoons, and opossum in the forests
around the plantation; turtles, alligators, crabs, fish, shrimp, and oysters could have been
caught in the nearby swamps and creeks.26 This supplementation allowed the slaves a
more varied diet than just the rationed food they were given.
Fogel and Engerman found some plantation references in literature sources that
mentioned foods other than corn and pork that slaves were given. This list included other
plantation products like fruits, meats, and vegetables, as well as purchased food items like
molasses. Since these documents were not very specific in describing rations or amount
of food available on the plantation, Fogel and Engerman decided to use a sample of
census manuscripts to predict the slaves’ food intake. The logic was that since the foods
were enumerated in the census, they were likely to be eaten on the plantation. They
assumed that 80% of the diet consisted of eleven principal foods and 20% of the caloric
26 Hilliard, Hog Meat and Hoecake: Food Supply in the Old South, 1840-1860, 182-83; Smith, Slavery and Rice Culture in Low Country Georgia 1750-1860, 116, 18.
16
intake was provided from supplements such as hunting, fishing, or slave gardens. Their
caloric estimates of the diet only used the 11 enumerated foods since supplementation
amounts were not recorded (the assumed 20% of calories from supplemented foods
would have resulted in an additional 1000 calories in Fogel and Engerman’s diet of 4,185
calories). Since there is little recorded evidence stating specifically what slaves ate to
supplement their diet, it is very difficult to draw any conclusions about the exact amount
of extra food slaves consumed.27 The diet analyzed in this study also does not calculate
the caloric contribution of supplemental foods in the slave diet because the evidence on
such foods was not recorded on plantation documents. See the appendix for further
information about the diet.
Historical Concepts of Nutrition and Food Availability
Slave owners knew that their slaves’ productivity, and therefore the owner’s
profit, was related to the slaves’ diet. Although some slave owners cut costs by
intentionally underfeeding their slaves, a large majority tried to feed their slaves
adequately but did not understand basic principles of nutrition. One common theory
about slave health was that some foods were “heat-producing” foods that produced
muscle and helped the slaves work; the main “heat-producing” foods were corn and fatty
cuts of pork. Few people understood what vitamins were and their connection to
diseases. Hardly any slave owners knew how to create a balanced diet with appropriate
amounts of nutrients, but many tried to add variety to the diet by producing other crops
and distributing them in season. Although the slaves might have received a varied diet
27 Fogel, Time on the Cross: The Economics of American Negro Slavery, 111-13. Steven Crawford found information that pertains to supplementation, but there are no conclusive results about food amounts that could be applied to this study.

17
during the growing season, deficiencies could have occurred during the winter months
when fresh fruits and vegetables were not available and most of the stored grains and
vegetables were depleted.28
An Analysis of the Nutritional Adequacy of the Adult Male Slave’s Diet on Rice
Plantations
The foods available for consumption were calculated from the 1860 census of 256
plantations along the rice coast of South Carolina and Georgia. This data set only
included slaveholding plantations with 10 or more slaves. Plantations with less than 10
slaves were likely small family subsistence farms where only a few slaves worked closely
with the owner, thus those slaves lived differently than slaves on large plantations. In
order to compare this study to Fogel and Engerman’s study, the diet was analyzed for an
adult male slave. To determine food allocation, the adult male slave was considered a
standardized unit. Female slaves and slave children were given a smaller proportion of
food than the adult male slave, and the free white population was given a much larger
portion than the adult male slave. To find the amount of food available to slaves, the
animal feed and crop seed was subtracted from the total amount of food produced. The
slave owners and other whites on the plantation were given twice the amount of food
allocated to slaves. This approximation would therefore seem to overestimate the food
eaten by the free whites and underestimate the food available for slave consumption. A
more detailed explanation of the study’s methods can be found in the appendix.
28 K.M. Stampp, The Peculiar Institution: Slavery in the Ante-Bellum South (New York: Alfred A. Knopf, Inc., 1963), 282-85.

18
The adult male slave unit was used to compare to previous studies. The reference
male is 23 years old; based on Swan’s work, his weight was 154 pounds, and manifest
studies reported an average height of five feet seven inches.29 By age 23, the slave would
likely have stopped growing and would have had a regular work schedule and diet, so it
was an appropriate age to analyze.
The slave diet was analyzed two different ways. The first calculation (“Diet 1”)
follows the methodology of Fogel and Engerman and Swan and is based on the nutrient
content of available raw foods. The second calculation (“Diet 2”) adjusts Diet 1 for
inedible portions of sweet potatoes, cowpeas, mutton, oats, and wheat; it is also analyzed
raw. Diet 1 had a caloric value of 3,162 calories; Diet 2 was adjusted for inedible
portions and resulted in 2,856 calories. According to the 2000 Recommended Dietary
Allowance (RDA), the reference sedentary male requires an intake of 2,700 calories in
relation to his weight and height.30
The “RDA are levels of intake of essential nutrients considered…to be adequate
to meet the known nutritional needs of practically all healthy persons.31” After the
average nutrient requirement is determined, that RDA value is set two standard
deviations above the average to sufficiently meet the nutrient needs of 98% of the healthy
population. However, the calorie requirement for an individual is set at the average.
29 R.W. Fogel, S.L. Engerman, R. Floud, G. Friedman, R.A. Margo, K. Sokoloff, R.H. Steckel, J. Trussell, G. Villaflor, & K.W. Wachter, "Secular Changes in American and British Stature and Nutrition," Journal of Interdisciplinary History 14, no. 2 (1983): 456; J. Komlos, & P. Coclanis, "On the Puzzling Cycle in the Biological Standard of Living: The Case of Antebellum Georgia," Explorations in Economic History 34 (1997): 443; R.H. Steckel, "A Peculiar Population: The Nutrition, Health, and Mortality of American Slaves from Childhood to Maturity," Journal of Economic History 46, no. 3 (1986): 724; R.H. Steckel, "Slave Height Profiles from Coastwise Manifests," Explorations in Economic History 16 (1979): 368; Swan, The Structure and Profitability of the Antebellum Industry 1859, 255.30 Nutrition Analysis Tool 2.0 (Food Science and Human Nutrition Department at the University of Illinois, [cited 8 July 2002]); available from http://www.nat.uiuc.edu/nat.pdl.31 Committee on Dietary Allowances of the Food and Nutrition Board, Recommended Dietary Allowances, 9th revised ed. (Washington, D.C.: National Academy of Sciences, 1980), 1.

19
Since the RDA values are set high, there is no major concern unless the individual is
receiving less than 75% of the RDA. When less than RDA recommendations are
consumed, the body can redistribute nutrients when tissue is broken down so that some
body functions can be maintained. It is also important to note that the body’s ability to
store fat-soluble and water-soluble vitamins varies greatly. A high intake of a fat-soluble
vitamin, such as vitamin A, can be stored; it may take over a year for deficiency
symptoms to surface. Excess vitamin C is excreted from the body and not stored;
consequently, deficiency symptoms are obvious within a few months. If nutrient needs
are not met on a certain day, a surplus of those nutrients consumed shortly thereafter can
make up for the previous low intake; however, if a person’s intake is insufficient for a
prolonged period of time, nutrient depletion will occur despite the body’s attempt to
adapt.32
The diet analyzed in this study was a hypothetical diet constructed from the foods
available on rice plantations in the southern U.S. according to the 1860 census. The
methods used to calculate the amount of food available came from Fogel and Engerman’s
and Swan’s studies on slave diets on cotton and rice plantations, respectively. To find the
amount of food available, inedible waste, animal feed allocations, and plant seed kept for
the next year were subtracted from the total amount of food produced on the plantations.
Table 5 shows a sample daily intake of the 10 foods in the diet. Table 6 gives the actual
caloric value of each diet and compares the percent of the RDA of each nutrient in each
diet.
32 Ibid., 3, 5, 7.

20
Table 5. The average daily intake of food in Diet 2.33
Food AmountPork 1.8 oz.Beef 3.2 oz.Mutton 0.1 oz.Milk 13.3 fl. oz.Corn 0.98 c.Rice 1.2 c.Peas/beans 3.5 Tbsp.Sweet potatoes 3.6 c.Oats 2.5 tsp.Wheat 0.02 tsp.
Table 6. A comparison of the percent of the RDA achieved in Diet 1 and Diet 2.34
Diet 1 Diet 2Basic Components Calories (kcal) 3162 kcals 2856 kcals35
Protein (g) 76.5 63.5Carbohydrate (g) 89 78.5Fat (g) 69.5 68.5
Vitamins Vitamin A (RE) 596 484Vitamin C (mg) 154 125Thiamine (mg) 177 132Riboflavin (mg) 174 151Niacin (mg) 123 110Vitamin B6 (mg) 218 180Folate (mcg) 179 91Vitamin B12 (mcg) 71 71
Minerals Calcium (mg) 75 6736
Phosphorus (mg) 235 197Potassium (mg) 104 80Zinc (mg) 80 65Iron (mg) 194 141Magnesium (mg) 132 103
33 Although an average of 13.3 fl. oz. of milk was available, most adult slaves were lactose intolerant. The milk produced on the plantation could likely have gone to the slave children because they were not yet lactose intolerant. Boles, Black Southerners 1619-1869, 92; M. Paubert-Braquet, C. Dupont, & R. Paoletti, ed., Foods, Nutrition and Immunity: Effects of Dairy and Fermented Milk Products (Paris: Karger, 1992), 49.34 The slave’s protein requirements would have been higher than the RDA recommends for the general population. The RDA for protein is 0.8g/kg body weight, but due to the limited calories in the diet and the high exercise demands of the slave, he would have required a protein intake closer to 1.8g/kg body weight, which is calculated to be 126g of protein daily. G.M. Wardlaw, Perspectives in Nutrition, 4th ed. (Boston: WCB/McGraw-Hill, 1999), 327.35 This is the average caloric intake, but the actual intake would have varied with the season during the year.36 The calcium intake includes the consumption of 13.3 fl. oz. of milk. The milk accounts for 72% of the slave’s total calcium intake, so Diet 2 would have achieved only 19% of the RDA (187mg) for calcium if the milk were not consumed due to the slave’s lactose intolerance.

21
The RDA are based on the needs of a fairly inactive person, so the slave’s activity
level would have required a much higher caloric intake than the 2,700 calories the RDA
suggests. Table 6 shows the comparison between the two diets. Since Diet 2 is adjusted
for waste, a quick observation reveals some significant differences; for example, there is
a marked drop in the percent of the RDA for protein and carbohydrate due to processing
and the removal of inedible waste. Sweet potatoes must be peeled and peas hulled before
consumption; the reduced edible portion results in a loss of 14 grams of protein and 70
grams of carbohydrate, representing a loss of 300 calories in the diet.
Some nutrients appear to exceed RDA levels, but the analysis was based on raw
foods to allow comparison to previous slave diet studies. A raw analysis was done
because Fogel and Engerman’s only option for diet analysis was to analyze the nutrient
content of food in the raw state. When foods are cooked, the actual nutrient intake is
much lower due to the destruction and loss of vitamins in the cooking process. Most of
the water-soluble vitamins (vitamin C, thiamin, riboflavin, niacin, and vitamin B6) levels
were near or above 100% of the RDA in the raw state, but cooking the food would have
greatly reduced the amount of these vitamins.37
The adjusted diet, Diet 2, corrects for the removal of non-edible portions of the
food before consumption; intake levels of vitamin B12, calcium, and zinc are below RDA
levels. All of the major components of the diet—calories, protein, carbohydrate, and
fat—are 20-35% below recommended levels.
37 Beaton, Nutrition, a Comprehensive Treatise, 249.

22
Deficiencies resulting from the slave diet
Vitamins are susceptible to destruction when the food is cooked, stored,
processed, exposed to light, or the pH is altered. The diet analysis of raw foods reveals
inadequate levels of three nutrients, but with the effects of cooking and storage, many
more vitamins could be deficient.
A deficiency of nutrients can result in an increased susceptibility to various
nutrient-related diseases. Protein-calorie malnutrition results from regular deficiencies of
energy and protein; it predisposes the body to infections and diseases, can cause liver
damage, and can possibly result in death.38
Vitamin B12 is a water-soluble vitamin that can be stored in the liver for over a
year, so the slave may have had enough of this vitamin stored during times of
deprivation. However, the vitamin intake was below recommended levels and some of it
would have been further destroyed when the food was exposed to light, so over time a
deficiency could have occurred. A deficiency in vitamin B12 can result in megaloblastic
anemia and peripheral neuropathy, characterized by a numbness in the hands and feet,
memory loss, and dementia.39
The diet is also deficient in calcium and zinc. A calcium deficiency can lead to
deformed teeth. The slave’s primary dietary sources of calcium were milk, sweet
potatoes, and black-eyed peas. As previously noted, adult slaves probably did not
consume milk because they were lactose intolerant, which would have created a greater
deficit of calcium in the slave’s diet. When the plantation stores were depleted of sweet
38 K.F. Kiple, & V. H. King, Another Dimension to the Black Diaspora: Diet, Disease, and Racism(Cambridge: Cambridge University Press, 1981), 111; Wardlaw, Perspectives in Nutrition, 179.39 Megaloblastic anemia is the result of abnormally large red blood cells. Combs, The Vitamins: Fundamental Aspects in Nutrition and Health, 396, 408, 16; Machlin, Handbook of Vitamins: Nutritional, Biochemical, and Clinical Aspects, 503, 33; Wardlaw, Perspectives in Nutrition, 448.
23
potatoes and peas, the slaves would have gotten very little calcium. The amount of
calcium absorbed in plant sources is also lower than in fluid milk; the body absorbs 25-
75% of dietary calcium, with plant sources at the lower end of that range. There is no
RDA for sodium, but a minimum intake of 500 mg/day is necessary under comfortable
environmental temperatures and when the person is not working hard enough to sweat.
Slaves were given a ration of salt and meats were cured, so the actual intake of sodium
would have been much higher than the raw foods suggest; for example, the slave’s daily
allotment of 1.8 oz. of salt pork provides 730 mg sodium and one teaspoon of salt has
2000 mg sodium. Zinc, a trace mineral in the body, is a cofactor for more than 300
enzymes, including those enzymes involved in growth and immunity. A zinc deficiency
can result in many symptoms, including diarrhea, skin rash, hair loss, poor growth,
decreased appetite, and poor wound healing. 40
Vitamin C, thiamin, riboflavin, niacin, vitamin B6, and folate are all vitamins that
appear to be at adequate intake levels in Table 6, but they are susceptible to damage when
the food is cooked. Vitamin C is very unstable to heat, drying, and oxidation, so it is
possible that a deficiency could have occurred in the slave population. A mild deficiency
of vitamin C would have resulted in muscle pain, fatigue, an increased susceptibility to
infection, and anorexia. A severe deficiency of vitamin C results in scurvy, accompanied
by a weakening of collagen in bones and cartilage, and swollen and bleeding gums,
resulting in the loss of teeth (See Figure 141).42 Evidence of possible vitamin C
40 R.B. Flanders, Plantation Slavery in Georgia (Connecticut: John E. Edwards, 1967), 156-57; Insel, Nutrition, 424; Kiple, Another Dimension to the Black Diaspora: Diet, Disease, and Racism, 118.41 D.S. McLaren, A Colour Atlas and Text of Diet-Related Disorders, 2nd ed. (England: Wolfe Publishing, 1992), 173.42 Combs, The Vitamins: Fundamental Aspects in Nutrition and Health, 266, 479; Machlin, Handbook of Vitamins: Nutritional, Biochemical, and Clinical Aspects, 224.

24
deficiencies in the slave population can be extracted from historical accounts that report
frequent dental problems. One source explained, “you will find but few negroes who are
not subject to tooth-ache” and “an examination of the physicians’ accounts reveals that a
large portion of their practice was extracting teeth.”43 There were several references to
scurvy in antebellum medical literature “scurvy condition among slaves” often
recognized by physicians as a result of a diet that relied mainly on high fat pork and
cornmeal, but too few vegetables.44
A thiamin deficiency is found in places where unenriched polished rice is widely
consumed; it is characterized by cardiac enlargement, anorexia, and muscular weakness,
a condition known as beriberi. An acute thiamin deficiency would have resulted in
edematous beriberi. Edema is a condition that masks the wasting away of tissues, and
causes a rapid heart rate with possible heart failure.45 One account of slaves likely
suffering from beriberi reported “bondsmen who would suddenly swell in every part of
the body, and in five or six days the case would invariably prove fatal.”46
43 Kiple, Another Dimension to the Black Diaspora: Diet, Disease, and Racism, 118; W.D. Postell, The Health of Slaves on Southern Plantations (Baton Rouge: Louisiana State University Press, 1951), 85; Stampp, The Peculiar Institution: Slavery in the Ante-Bellum South, 305.44 Kiple, Another Dimension to the Black Diaspora: Diet, Disease, and Racism, 123.45 Combs, The Vitamins: Fundamental Aspects in Nutrition and Health, 290; Machlin, Handbook of Vitamins: Nutritional, Biochemical, and Clinical Aspects, 281.46 Kiple, Another Dimension to the Black Diaspora: Diet, Disease, and Racism, 122.
Figure 1. This picture shows symptoms of scurvy: swollen and bleeding gums and tooth loss.

25
Riboflavin deficiency symptoms include poor appetite and growth, muscular
weakness, and extreme sensibility to touch and temperature. Changes in the mouth and
mucous membranes, known as cheilosis, stomatitis, and glossitis, are also characteristic
of a riboflavin deficiency. These dermatitis symptoms generally develop gradually as the
deficiency worsens (see Figure 247).48
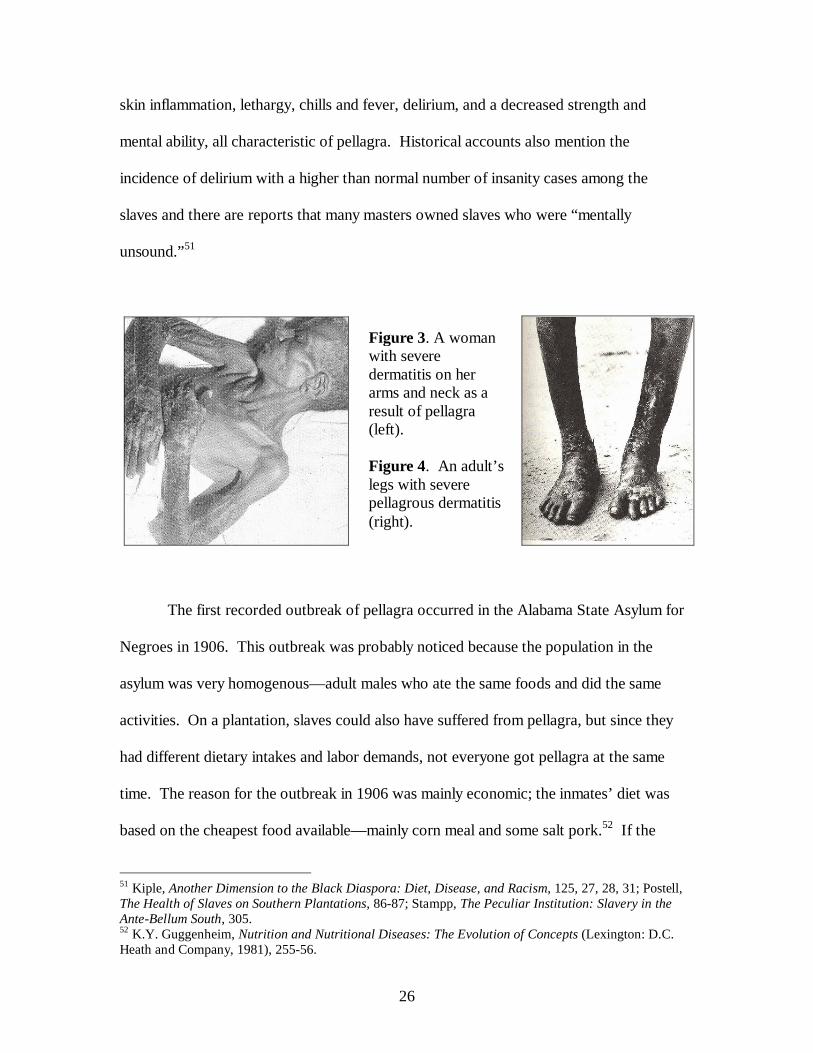
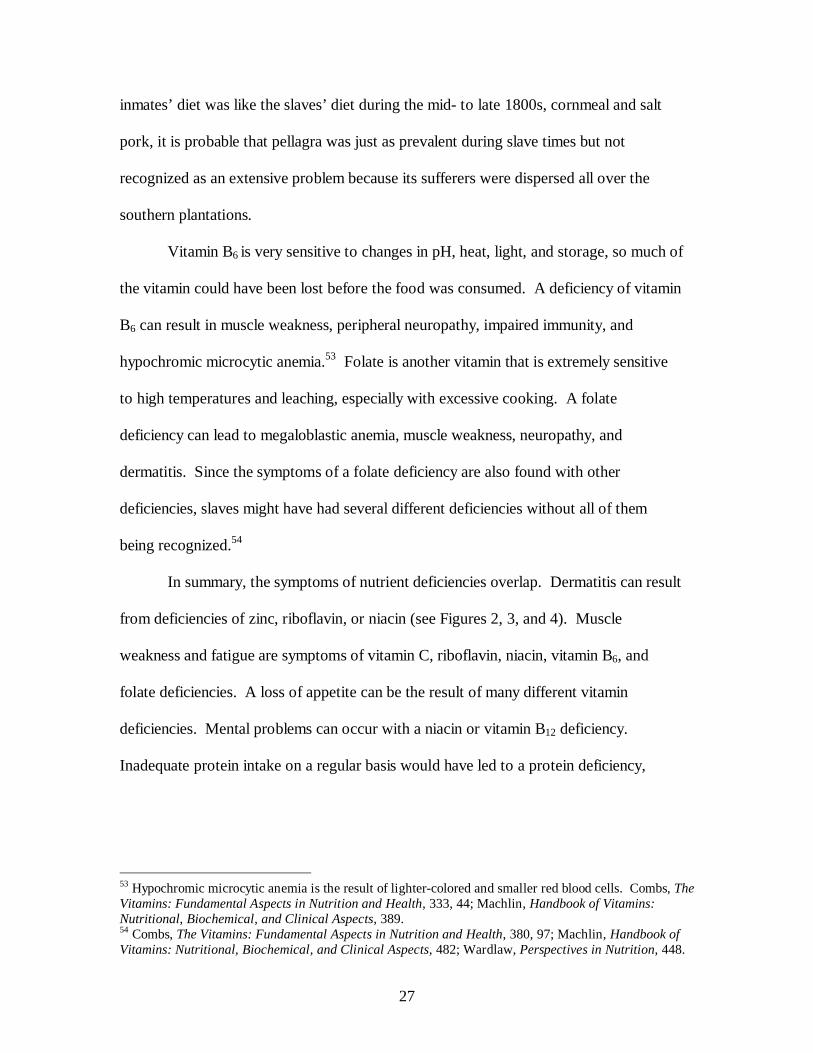
Niacin is relatively stable to cooking and heat, but can be lost due to the vitamin
leaching into the cooking water. Pellagra results from a niacin deficiency, and is
characterized by skin lesions—skin that is cracked, scaly, is darker in color, and hardened
(see Figures 3 and 449). Other symptoms include delirium, depression, anxiety, and
fatigue.50 Pellagra was a very new disease during the antebellum period, so the disease
was often misdiagnosed. Over time, doctors recognized this “new” disease as the same
disease called “black tongue” in dogs because its main superficial symptom was having a
brown coating on the tongue. One Georgia doctor described black tongue symptoms as
47 M. Rechcigl, Jr., ed., C.R.C. Handbook Series in Nutrition and Food, Section E: Nutritional Disorders, vol. III (West Palm Beach: CRC Press, Inc., 1978), 17.48 The symptom of cheilosis is lip lesions, the symptom of stomatitis is lesions around the corners of the mouth, and the symptom of glossitis is tongue inflammation. Combs, The Vitamins: Fundamental Aspects in Nutrition and Health, 297, 306; Machlin, Handbook of Vitamins: Nutritional, Biochemical, and Clinical Aspects, 304-07, 13; Rechcigl, C.R.C. Handbook Series in Nutrition and Food, Section E: Nutritional Disorders, 18-19.49 McLaren, A Colour Atlas and Text of Diet-Related Disorders, 145; Rechcigl, C.R.C. Handbook Series in Nutrition and Food, Section E: Nutritional Disorders, 25.50 Combs, The Vitamins: Fundamental Aspects in Nutrition and Health, 314, 24.
Figure 2. These two pictures show symptoms of riboflavin deficiency, as evident by the stomatitis and cheilosis (left) and glossitis (right).
26
skin inflammation, lethargy, chills and fever, delirium, and a decreased strength and
mental ability, all characteristic of pellagra. Historical accounts also mention the
incidence of delirium with a higher than normal number of insanity cases among the
slaves and there are reports that many masters owned slaves who were “mentally
unsound.”51
The first recorded outbreak of pellagra occurred in the Alabama State Asylum for
Negroes in 1906. This outbreak was probably noticed because the population in the
asylum was very homogenous—adult males who ate the same foods and did the same
activities. On a plantation, slaves could also have suffered from pellagra, but since they
had different dietary intakes and labor demands, not everyone got pellagra at the same
time. The reason for the outbreak in 1906 was mainly economic; the inmates’ diet was
based on the cheapest food available—mainly corn meal and some salt pork.52 If the
51 Kiple, Another Dimension to the Black Diaspora: Diet, Disease, and Racism, 125, 27, 28, 31; Postell, The Health of Slaves on Southern Plantations, 86-87; Stampp, The Peculiar Institution: Slavery in the Ante-Bellum South, 305.52 K.Y. Guggenheim, Nutrition and Nutritional Diseases: The Evolution of Concepts (Lexington: D.C. Heath and Company, 1981), 255-56.
Figure 3. A woman with severe dermatitis on her arms and neck as a result of pellagra (left).
Figure 4. An adult’s legs with severe pellagrous dermatitis (right).
27
inmates’ diet was like the slaves’ diet during the mid- to late 1800s, cornmeal and salt
pork, it is probable that pellagra was just as prevalent during slave times but not
recognized as an extensive problem because its sufferers were dispersed all over the
southern plantations.
Vitamin B6 is very sensitive to changes in pH, heat, light, and storage, so much of
the vitamin could have been lost before the food was consumed. A deficiency of vitamin
B6 can result in muscle weakness, peripheral neuropathy, impaired immunity, and
hypochromic microcytic anemia.53 Folate is another vitamin that is extremely sensitive
to high temperatures and leaching, especially with excessive cooking. A folate
deficiency can lead to megaloblastic anemia, muscle weakness, neuropathy, and
dermatitis. Since the symptoms of a folate deficiency are also found with other
deficiencies, slaves might have had several different deficiencies without all of them
being recognized.54
In summary, the symptoms of nutrient deficiencies overlap. Dermatitis can result
from deficiencies of zinc, riboflavin, or niacin (see Figures 2, 3, and 4). Muscle
weakness and fatigue are symptoms of vitamin C, riboflavin, niacin, vitamin B6, and
folate deficiencies. A loss of appetite can be the result of many different vitamin
deficiencies. Mental problems can occur with a niacin or vitamin B12 deficiency.
Inadequate protein intake on a regular basis would have led to a protein deficiency,
53 Hypochromic microcytic anemia is the result of lighter-colored and smaller red blood cells. Combs, The Vitamins: Fundamental Aspects in Nutrition and Health, 333, 44; Machlin, Handbook of Vitamins: Nutritional, Biochemical, and Clinical Aspects, 389.54 Combs, The Vitamins: Fundamental Aspects in Nutrition and Health, 380, 97; Machlin, Handbook of Vitamins: Nutritional, Biochemical, and Clinical Aspects, 482; Wardlaw, Perspectives in Nutrition, 448.

28
resulting in a weakened immune system; a vitamin C deficiency also results in a
weakened immune system and an increased susceptibility to infection.55
The skin problems could have been worsened by the wet conditions that the
slaves worked in throughout the planting season, making the slave more susceptible to
infection. The need for rice to be harvested in wet land promoted illness. While the
fields were flooded, slaves were working knee-deep in the foul-smelling stagnant water,
contributing to sickness and fever. The slaves’ feet suffered greatly from being in water
for extended periods of time, causing the skin to crack and develop sores.56 Considering
all of the nutrient deficiencies that produce skin lesions and negatively affect the immune
system, there was an increased risk for infection when an open wound is in contact with
swamp water.
Muscle weakness, loss of appetite, and fatigue could have also worsened the
slave’s health because they could have added to the caloric deficit experienced by the
slave. If the slave was too tired to work in his garden or hunt for supplemental foods, he
would be eating less than if he were healthy and physically able to gather supplemental
food and boost his caloric intake. If the slave had no appetite, he might not have eaten
his food even if there was enough food for him to eat.
Conclusion
Fogel and Engerman, Swan, and other economic historians concluded that slave
diets were adequate by utilizing the only methods of nutritional analysis that they had
55 A protein deficiency would have been more likely than the diet analysis suggests because the slave needed a protein intake closer to 1.8g/kg, which is higher than the amount analyzed in the diet. Wardlaw, Perspectives in Nutrition, 327.56 Chamerovzow, ed., Slave Life in Georgia: A Narrative of the Life of John Brown, 186-87.
29
available to them. However, these researchers did not consider waste, cooking losses, or
differences in the caloric need of slaves due to their energy expenditure. This study
attempts to make these corrections, and the result leads to a different conclusion about the
nutritional adequacy of the slaves’ diet. The historical importance of this study goes back
to the question of how the slave’s diet affected his quality of life. This study concludes
that slaves from rice plantations likely had an inadequate diet, which may have
contributed to many other health problems.
This study proposes many more possible nutrient deficiencies than suggested by
previous diet studies. Deficient levels of nutrients would have added to other health
problems that the slaves already endured as a result of their working conditions. Slaves
contracted fevers, inflammation in the joints and muscles, and other infections due to
their often-watery working conditions; these health problems would likely have worsened
if they were combined with nutritional deficiencies.57
The slaves’ caloric intake was also probably lower than the slaves’ workloads
required, and the slaves’ protein requirements were higher than the needs of the general
public.58 There is some evidence suggesting that slaves had stunted growth due to a
protein-calorie deficiency. A study of Civil War soldiers in the South examined their
height relative to their pre-war occupations. It appears from this study that slaves were
shorter on average than their white farming counterparts. Southern farmers were 68.5
inches tall on average, 1.5 inches taller than the average male slave born in about the
57 Ibid.58 A protein deficiency would have been more likely than the diet analysis suggests because the slave needed a protein intake closer to 1.8g/kg, which is higher than the amount analyzed in the diet. Wardlaw, Perspectives in Nutrition, 327.
30
same location at about the same time. The farmers’ taller height might be due to having
access to a higher quality and a larger quantity of food compared to slaves.59
Fogel and Engerman’s study created a diet to explain how the slavery investment
was supported by a diet that appeared adequate, but their work focused on cotton
plantations. Evidence indicates that slave labor on rice plantations was more intense than
on cotton plantations due to nature of the work and the conditions in which the slaves
worked. The increased susceptibility to disease that rice plantation slaves encountered
while working in water for much of the season, as well as their high energy expenditure,
would result in those slaves needing more nutrients, especially calories, to maintain their
work level throughout the day. The rice plantation diet could have left the slaves tired,
susceptible to diseases, and undernourished given the amount of work they had to do.
Slaves who were at peak physical health might have been functional, but gradually
wearing down their bodies.
This study suggests a different picture of the quality of the slaves’ diet,
specifically in terms of the rice plantation slaves. If Fogel and Engerman’s study were to
be re-examined by taking into account food waste and processing losses, different
conclusions about the cotton plantation slaves’ diet would be reached. This study takes a
unique perspective of a long-studied topic—the slave diet—in that it accounts for food
losses other than those calculated in the disappearance method and it looks at a relatively
understudied type of plantation. The results of this study question previous slave diet
studies which argued that slaves had an adequate diet. Although this study has
methodological limitations due to the amount of information documented about slavery
59 R.A. Margo, & R.H. Steckel, "Heights of Native Born Whites During the Antebellum Period," The Journal of Economic History 43, no. 1 (1983).

31
that pertain to the slave diet, it gives a more accurate depiction of slave diets because it
builds on previous studies and improves the methodology of the researchers of those
studies. This study is important to the annals of knowledge regarding slavery and the
slave diet as it relates to quality of life because it challenges modern research results that
declare the slave diet as having been adequate.

32
Appendix
The following four tables tabulate the results of Diet 1 (all available foods) and
Diet 2 (all available foods with inedible portions removed). The diet in Tables A1-A4
was constructed from the 1860 census data of rice plantations, with Tables A3 and A4
being adjusted for inedible waste. Subsequent tables and equations explain how the meat
and grain allotments were calculated (Tables A5-A6). The final three tables list the
RDAs for an adult male slave (Tables A7-A9).
Table A1. Amount of food available for slave consumption in Diet 1.
*A bushel is the equivalent of 32 quarts or 128 cups.
Foods Available Annual Food Production Available for Consumption Per Adult Slave Consuming Unit
Pork 41.21 poundsBeef 73.50 poundsMutton 3.50 poundsMilk 303.18 fluid poundsCorn 2.78 bushels*Rice 3.50 bushelsPeas/beans 1.51 bushelsSweet potatoes 12.57 bushelsOats 0.21 bushelWheat 0.003 bushel

33
Table A2. The nutritional value of Diet 1 per day.
Basic Components Calories 3161.92
Protein 88.78
Carbohydrate 500.46
Dietary Fiber 36.48
Total Fat 89.38
Vitamins Vitamin A (RE) 5959.39
Vitamin C (mg) 138.22
Thiamin (mg) 2.13
Riboflavin (mg) 2.26
Niacin (mg) 19.62
Vitamin B6 (mg) 2.84
Folate (mcg) 714.24
Vitamin B12 (mcg) 1.60
Minerals Calcium (mg) 754.86
Phosphorus (mg) 1645.58
Sodium (mg) 1128.84
Potassium (mg) 3629.93
Zinc (mg) 12.00
Iron (mg) 19.36
Magnesium (mg) 526.07
34
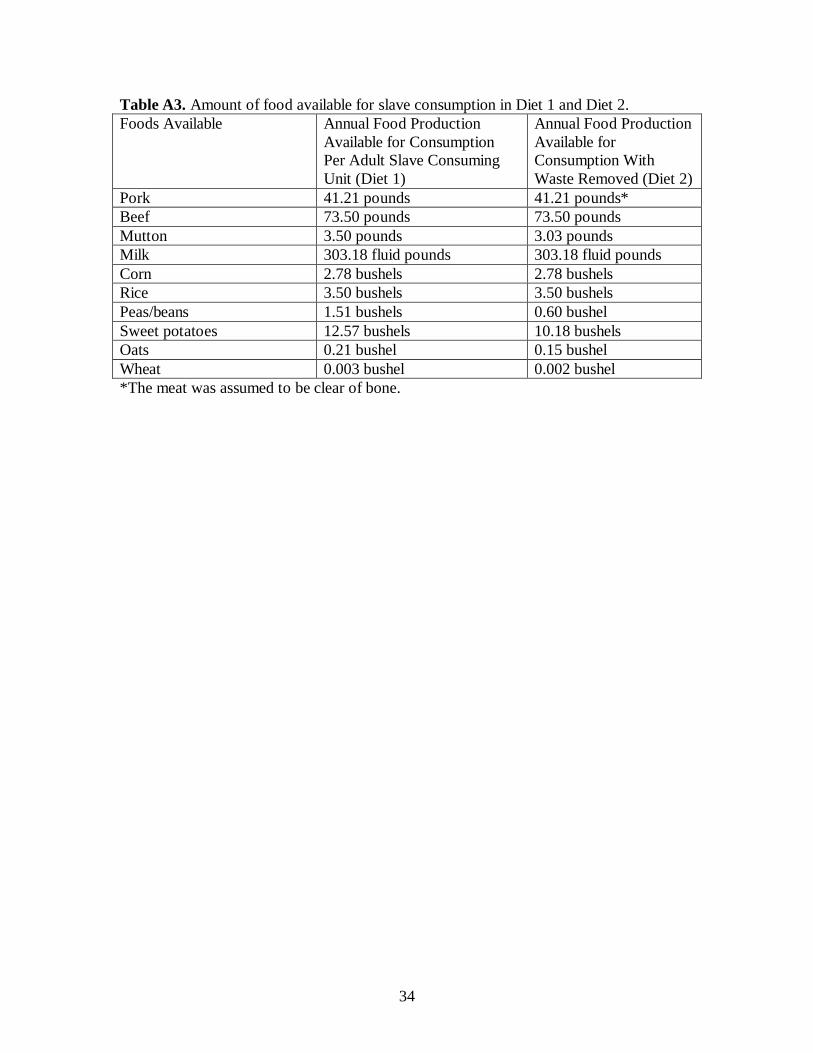
Table A3. Amount of food available for slave consumption in Diet 1 and Diet 2.Foods Available Annual Food Production
Available for Consumption Per Adult Slave Consuming Unit (Diet 1)
Annual Food Production Available for Consumption With Waste Removed (Diet 2)
Pork 41.21 pounds 41.21 pounds*Beef 73.50 pounds 73.50 poundsMutton 3.50 pounds 3.03 poundsMilk 303.18 fluid pounds 303.18 fluid poundsCorn 2.78 bushels 2.78 bushelsRice 3.50 bushels 3.50 bushelsPeas/beans 1.51 bushels 0.60 bushelSweet potatoes 12.57 bushels 10.18 bushelsOats 0.21 bushel 0.15 bushelWheat 0.003 bushel 0.002 bushel*The meat was assumed to be clear of bone.

35
Table A4. Nutritional value of Diet 2 per day.Basic Components Calories 2855.84
Protein 74.01
Carbohydrate 440.02Dietary Fiber 27.25
Total Fat 88.05
VitaminsVitamin A (RE) 4839.990Vitamin C (mg) 112.12
Thiamin (mg) 1.58Riboflavin (mg) 1.97
Niacin (mg) 17.67Vitamin B6 (mg) 2.34
Folate (mcg) 365.48Vitamin B12 (mcg) 1.71
Minerals Calcium (mg) 669.72Phosphorus (mg) 1378.91
Sodium (mg) 1105.12Potassium (mg) 2799.18
Zinc (mg) 9.79
Iron (mg) 14.14Magnesium (mg) 413.57
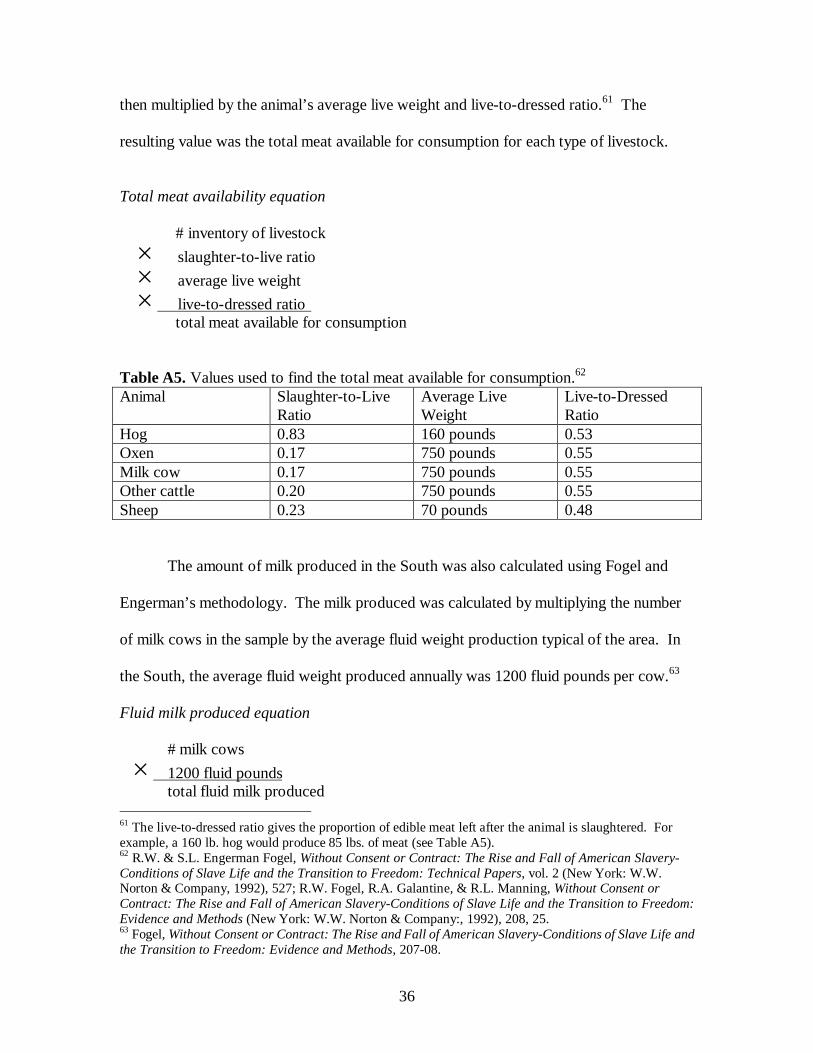
The amount of edible meat available from the livestock was approximated using a
series of equations. Each type of livestock on the plantations was multiplied by an
animal-specific slaughter-to-live ratio to find the gross carcass weight.60 This value was
60 The slaughter-to-live ratio gives the proportion of the entire livestock population that is slaughtered. For example, 83% of the entire hog population is slaughtered each year (see Table A5).
36
then multiplied by the animal’s average live weight and live-to-dressed ratio.61 The
resulting value was the total meat available for consumption for each type of livestock.
Total meat availability equation
# inventory of livestock
slaughter-to-live ratio
average live weight
live-to-dressed ratio total meat available for consumption
Table A5. Values used to find the total meat available for consumption.62
The amount of milk produced in the South was also calculated using Fogel and
Engerman’s methodology. The milk produced was calculated by multiplying the number
of milk cows in the sample by the average fluid weight production typical of the area. In
the South, the average fluid weight produced annually was 1200 fluid pounds per cow.63
Fluid milk produced equation
# milk cows
1200 fluid poundstotal fluid milk produced
61 The live-to-dressed ratio gives the proportion of edible meat left after the animal is slaughtered. For example, a 160 lb. hog would produce 85 lbs. of meat (see Table A5).62 R.W. & S.L. Engerman Fogel, Without Consent or Contract: The Rise and Fall of American Slavery-Conditions of Slave Life and the Transition to Freedom: Technical Papers, vol. 2 (New York: W.W. Norton & Company, 1992), 527; R.W. Fogel, R.A. Galantine, & R.L. Manning, Without Consent or Contract: The Rise and Fall of American Slavery-Conditions of Slave Life and the Transition to Freedom: Evidence and Methods (New York: W.W. Norton & Company:, 1992), 208, 25.63 Fogel, Without Consent or Contract: The Rise and Fall of American Slavery-Conditions of Slave Life and the Transition to Freedom: Evidence and Methods, 207-08.
Animal Slaughter-to-Live Ratio
Average Live Weight
Live-to-Dressed Ratio
Hog 0.83 160 pounds 0.53 Oxen 0.17 750 pounds 0.55 Milk cow 0.17 750 pounds 0.55 Other cattle 0.20 750 pounds 0.55 Sheep 0.23 70 pounds 0.48

37
To find the amount of grain available for human consumption, the total crop
production was calculated, and then the amount used for feed and seed was subtracted.
Since rice was produced for profit, all of the high-quality rice was sent to market to be
sold, and only the broken rice was kept for consumption on the plantation. The
approximate amount of broken rice can be calculated using a conversion equation. The
amount of broken rice produced per 1000 bushels of whole rice is 3243 pounds.64 The
following table gives values for the percent of the total food production that was available
for consumption after feed allowances and seed requirements were subtracted.
Table A6. Gross production percentages available for human consumption.65
*The sweet potato is a storage root and cannot produce its own plants. The sweet potatois used as seed by cutting branches off of the vine and rooting them. Therefore, the seed allowance should be zero (rather than 8.3%), making the amount available for humans 99.3%. There is an assumed feed allowance of 0.7%.66
The recommended intake levels of vitamins and minerals depend on a person’s
age and gender. Since the reference slave is a male between the ages of 18 and 39, his
64 Olmsted, Journey in the Seaboard Slave States with Remarks on Their Economy, 477.65 Fogel, Without Consent or Contract: The Rise and Fall of American Slavery-Conditions of Slave Life and the Transition to Freedom: Evidence and Methods, 208; M.W. Towne, & W.D. Rasmussen, "Farm Gross Product and Gross Investment in the Nineteenth Century," Trends in the American Economy in the Nineteenth Century 24 (1960): 294-304.66 Fogel, Without Consent or Contract: The Rise and Fall of American Slavery-Conditions of Slave Life and the Transition to Freedom: Evidence and Methods, 208; Hilliard, Hog Meat and Hoecake: Food Supply in the Old South, 1840-1860, 175; Olmsted, Journey in the Seaboard Slave States with Remarks on Their Economy, 477; Sweetpotato: Treasure for the Poor (Centro Internacional de la Papa, [cited 14 June 2002]); available from http://www.cipotato.org/projects/sweetpotato.htm.
Grain Percent available for human consumptionCorn 17.5Wheat 85.5Peas/beans 60.0Oats 28.0Sweet potatoes 91.0 Rice 5.4

38
nutrient requirements are different from children and females. Therefore, the diet
analyzed and its adequacy is dependent on the adult male’s needs.
Table A7. Basic components of the diet.67
* The RDA is based on the average calorie needs of an inactive person.
Table A8. Recommended vitamin intakes.68
Table A9. Recommended mineral intakes.70
Calcium 1000.0 mgPhosphorus 700.0 mgSodium 2400.0 mgPotassium 3500.0 mgZinc 15.0 mgIron 10.0 mg
67 From the 1998 RDA, taken from Nutrition Analysis Tool 2.0.68 Ibid.69 Vitamin A is measured in RE (retinol equivalents) because there are three active forms of vitamin A. Retinol can be easily converted to retinal, the form needed for night vision. Retinal can be converted to retinol or retinoic acid, which is needed for cell differentiation and growth. Carotenoids are the precursor to vitamin A. RE conversions are as follows: 1 RE = 1 mcg retinol = 2 mcg beta-carotene (supplemented) = 12 mcg dietary beta-carotene = 24 mcg dietary carotenoids. Insel, Nutrition, 331, 37. 70 Nutrition Analysis Tool 2.0.
Calories 2,700 kcals*Protein 109-124 gCarbohydrate 526-601 gDietary fiber 36-41 gTotal fat 121-138 g
Vitamin A 1000.0 RE69
Vitamin C 90.0 mgThiamin 1.2 mgRiboflavin 1.3 mgNiacin 16.0 mgVitamin B6 1.3 mgFolate 400.0 mcgVitamin B12 2.4 mcg

39
Bibliography
Beaton, G.H., & E.W. McHenry, eds. Nutrition, a Comprehensive Treatise. 3 vols. Vol. 3. New York: Academic Press, 1966.
Bender, D.A., & A.E Bender. Nutrition, a Reference Handbook. New York: Oxford University Press, 1997.
Board, Committee on Dietary Allowances of the Food and Nutrition. Recommended Dietary Allowances. 9th revised ed. Washington, D.C.: National Academy of Sciences, 1980.
Boles, J.B. Black Southerners 1619-1869. Lexington: The University Press of Kentucky, 1983.
Center, University of Virginia Geospatial and Statistical Data. United States Historical Census Data Browser University of Virginia, 1998 [cited 31 May 2002]. Available from http://fisher.lib.virginia.edu/collections/stats/histcensus/.
Chamerovzow, L.A., ed. Slave Life in Georgia: A Narrative of the Life of John Brown. New York: Books for Library Press, 1971.
Combs, G.F. The Vitamins: Fundamental Aspects in Nutrition and Health. New York: Academic Press, 1998.
David, P.A., H.G. Gutman, R. Sutch, P. Temin, & G. Wright. Reckoning with Slavery: A Critical Study in the Quantitative History of American Negro Slavery. New York: Oxford University Press, 1976.
Easterby, J.H., ed. The South Carolina Rice Plantation as Revealed in the Papers of Robert F.W. Allston. Chicago: University of Chicago Press, 1945.
Flanders, R.B. Plantation Slavery in Georgia. Connecticut: John E. Edwards, 1967.Fogel, R.W., & S.L. Engerman. Time on the Cross: The Economics of American Negro
Slavery. 2 vols. Boston: Little, Brown and Company, 1974.Fogel, R.W. & S.L. Engerman. Without Consent or Contract: The Rise and Fall of
American Slavery-Conditions of Slave Life and the Transition to Freedom: Technical Papers. Vol. 2. New York: W.W. Norton & Company, 1992.
Fogel, R.W., & S.L. Engerman. Without Consent or Contract: The Rise and Fall of American Slavery-Conditions of Slave Life and the Transition to Freedom: Technical Papers. Vol. 1. New York: W.W. Norton & Company, 1992.
Fogel, R.W., R.A. Galantine, & R.L. Manning. Without Consent or Contract: The Rise and Fall of American Slavery-Conditions of Slave Life and the Transition to Freedom: Evidence and Methods. New York: W.W. Norton & Company, 1992.
Fogel, R.W., S.L. Engerman, R. Floud, G. Friedman, R.A. Margo, K. Sokoloff, R.H. Steckel, J. Trussell, G. Villaflor, & K.W. Wachter. "Secular Changes in American and British Stature and Nutrition." Journal of Interdisciplinary History 14, no. 2 (1983): 445-81.
Gibbs, T., K. Cargill, L.S. Lieberman, & E. Reitz. "Nutrition in a Slave Population: An Anthropological Examination." Medical Anthropology 4 (1980): 175-262.
Guggenheim, K.Y. Nutrition and Nutritional Diseases: The Evolution of Concepts. Lexington: D.C. Heath and Company, 1981.
Hilliard, S.B. Hog Meat and Hoecake: Food Supply in the Old South, 1840-1860. Carbondale: Southern Illinois University Press, 1972.

40
Insel, P., E.E. Turner, & D. Ross. Nutrition. Massachusetts: Jones and Bartlett Publishers, 2002.
Kemble, F.A. Journal of a Residence on a Georgian Plantation in 1838-1839. New York: Alfred A. Knopf, 1961.
Kiple, K.F., & V. H. King. Another Dimension to the Black Diaspora: Diet, Disease, and Racism. Cambridge: Cambridge University Press, 1981.
Komlos, J., & P. Coclanis. "On the Puzzling Cycle in the Biological Standard of Living: The Case of Antebellum Georgia." Explorations in Economic History 34 (1997): 433-59.
Machlin, L.J., ed. Handbook of Vitamins: Nutritional, Biochemical, and Clinical Aspects. New York: Marcel Dekker, Inc., 1984.
Macrae, R., R.K. Robinson, & M.J. Sadler, ed. Encyclopaedia of Food Science, Food Technology and Nutrition. 7 vols. London: Academic Press, 1993.
Margo, R.A., & R.H. Steckel. "Heights of Native Born Whites During the Antebellum Period." The Journal of Economic History 43, no. 1 (1983): 167-74.
McArdle, W.D., F.I. Katch, & V.L. Katch. Exercise Physiology: Energy, Nutrition, and Human Performance. 3rd ed. Philadelphia: Lea & Febiger, 1991.
McLaren, D.S. A Colour Atlas and Text of Diet-Related Disorders. 2nd ed. England: Wolfe Publishing, 1992.
Nutrition Analysis Tool 2.0 Food Science and Human Nutrition Department at the University of Illinois, [cited 8 July 2002]. Available from http://www.nat.uiuc.edu/nat.pdl.
Olmsted, F.L. Journey in the Seaboard Slave States with Remarks on Their Economy. New York: Dix & Edwards, 1856.
Paubert-Braquet, M., C. Dupont, & R. Paoletti, ed. Foods, Nutrition and Immunity: Effects of Dairy and Fermented Milk Products. Paris: Karger, 1992.
Phillips, U.B. American Negro Slavery. Baton Rouge: Louisiana State University Press, 1966.
———. Life and Labor in the Old South. Boston: Little, Brown and Company, 1963.———. The Slave Economy of the Old South. Baton Rouge: Louisiana State University
Press, 1968.Postell, W.D. The Health of Slaves on Southern Plantations. Baton Rouge: Louisiana
State University Press, 1951.Processed Food Nestle, [cited 22 October 2003]. Available from
http://www.nestle.co.uk/nutrition/articles/processed_food.asp.Rechcigl, M., Jr., ed. C.R.C. Handbook Series in Nutrition and Food, Section E:
Nutritional Disorders. Vol. III. West Palm Beach: CRC Press, Inc., 1978.Smith, J.F. Slavery and Rice Culture in Low Country Georgia 1750-1860. Knoxville: The
University of Tennessee Press, 1985.Souci, S.W., W. Fachmann, & H. Kraut. Food Composition and Nutrition Tables. 6th ed.
Stuttgart, Germany: medpharm GmbH Scientific Publishers, 2000.Stampp, K.M. The Peculiar Institution: Slavery in the Ante-Bellum South. New York:
Alfred A. Knopf, Inc., 1963.Steckel, R.H. "A Peculiar Population: The Nutrition, Health, and Mortality of American
Slaves from Childhood to Maturity." Journal of Economic History 46, no. 3 (1986): 721-41.
41
———. "Slave Height Profiles from Coastwise Manifests." Explorations in Economic History 16 (1979): 363-80.
Swan, D.E. The Structure and Profitability of the Antebellum Industry 1859. New York: Arno Press, 1972.
Sweetpotato: Treasure for the Poor Centro Internacional de la Papa, [cited 14 June 2002]. Available from http://www.cipotato.org/projects/sweetpotato.htm.
Towne, M.W., & W.D. Rasmussen. "Farm Gross Product and Gross Investment in the Nineteenth Century." Trends in the American Economy in the Nineteenth Century24 (1960): 255-315.
Wardlaw, G.M. Perspectives in Nutrition. 4th ed. Boston: WCB/McGraw-Hill, 1999.