a regulatory crosstalk in down syndrome: competing mrna ... filea regulatory crosstalk in down...
TRANSCRIPT

University of Naples
“Federico II”
PhD Program
“Advanced Biology” (XXVII CICLO)
Coordinator
Prof. Luciano Gaudio
A regulatory crosstalk in Down syndrome:
competing mRNA-miRNA network
Tutor: PhD student: Prof. Giuseppe Saccone Dr. Margherita Scarpato
Co-Tutor: Prof. Alfredo Ciccodicola
Academic Year 2013/2014

i
Table of Contents
1 Abstract (Italiano) 1
2 Abstract (English) 3
3 Introduction 5
3.1 Down syndrome 5 3.1.1 Down syndrome as a multisystem disorder 6 3.1.2 Embryogenesis and Down syndrome 7 3.1.3 Chromosome 21 and gene expression 7
3.2 Beyond the gene dosage hypothesis 10 3.2.1 ceRNA hypothesis 12
3.3 microRNAs 13 3.3.1 miRNA biogenesis 14 3.3.2 miRNA-‐mediated silencing 16
4 Aim 19
5 Methods 21
5.1 Data processing and bioinformatics analysis 21 5.1.1 Expression data sets description and processing 21 5.1.2 mRNA-‐miRNA interactions prediction 22 5.1.3 Data integration and biclustering analysis 22 5.1.4 Differential gene expression in DS embryos 23
5.2 Generation of plasmid constructs 23 5.3 Cell culture and transfection 25 5.4 RNA extraction and Reverse Transcription 25 5.5 Quantitative Real-‐Time PCR 26
6 Results 29
6.1 Gene expression during human embryogenesis 29 6.2 Identification of miRNA-‐mRNA regulatory network 33 6.3 Perturbation of miRNA-‐mRNA regulatory network during DS embryogenesis
39 6.4 The role of HUNK as a ceRNA 43

ii
7 Discussion 50
8 References 53

iii
Table of Figures Figure 1: Trisomy 21 karyotype showing three copies of human chromosome
21 (HSA21) 5
Figure 2: HSA21 conserved synteny with mouse chromosomes Mmu10,
Mmu16 and Mmu17 9
Figure 3: Hypothesis for Trisomy 21 phenotypes 12
Figure 4: RNAs' crosstalk mediated by miRNAs 13
Figure 5: miRNA biogenesis 15
Figure 6: Mechanisms of miRNA-mediated silencing 18
Figure 7: mRNA expression during weeks 4-6 of human development 30
Figure 8: Statistical over-representation test of 11080 expressed genes during
weeks 4-6 of development, according to Panther GO-Slim Biological Process 31
Figure 9: Top 15 mRNAs expression levels during weeks 4-6 of human
development 31
Figure 10: miRNA expression during weeks 4-6 of human development 32
Figure 11: Top 15 miRNAs expression levels during weeks 4-6 of human
development 33
Figure 12: Correlation distribution curve before (green) and after (red)
integration of prediction of miRNA-mRNA interactions 34
Figure 13: Bubbleplot representing biclustering results 36
Figure 14: Heatmap of the extracted bicluster 37
Figure 15: Correlation distribution curve for the extracted bicluster 38
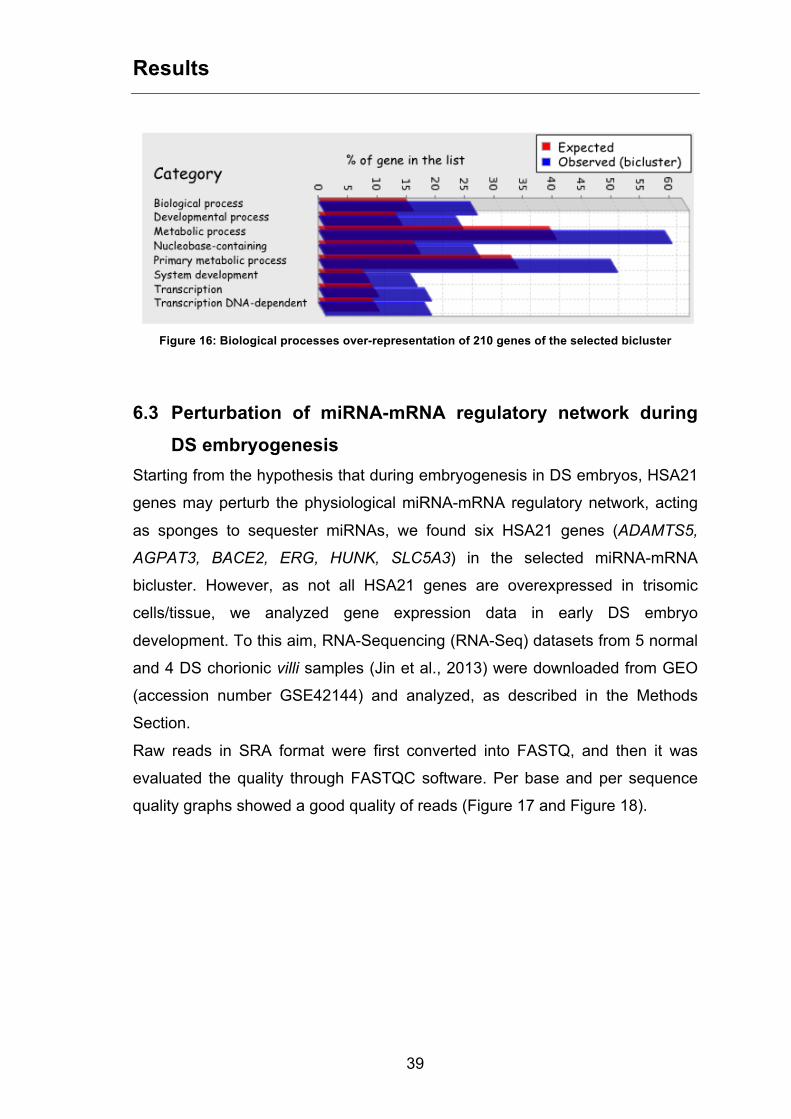
Figure 16: Biological processes over-representation of 210 genes of the
selected bicluster 39
Figure 17: Per base read quality 40
Figure 18: Per sequence read quality 40
Figure 19: Box plot of RPKM counts distribution 41
Figure 20: PCA plot of euploid and DS samples before (upper) and after
(lower) removing EU2 sample (red arrow). 42
Figure 21: HUNK expression 24, 30, 48 hours after HUNK 3'UTR transfection
45
iv
Figure 22: Gene expression after HUNK 3'UTR transfection 46
Figure 23: miRNA expression in HEK293 cells 24 and 30 hours after HUNK
3'UTR transfection 47
Figure 24: Expression analysis of selected genes 24h after transfection of
partial HUNK 3'UTR fragments 48
Figure 25: Expression analysis of selected miRNAs 24h after transfection of
partial HUNK 3'UTR fragments 49

1
1 Abstract (Italiano)
La sindrome di Down (DS), la cui causa genetica fu ricondotta alla trisomia
completa o parziale del cromosoma 21 (HSA21), è la più comune aneuploidia
umana compatibile con la vita. La DS è una complessa condizione genetica
caratterizzata da più di 80 diversi fenotipi clinici, con espressività e penetranza
estremamente variabili. Gli individui affetti da DS presentano alterazioni - sia di
carattere strutturale sia funzionale - a carico di differenti organi e sistemi, che
lasciano presupporre un’alterazione dell’embriogenesi negli individui affetti da
sindrome di Down, dovuta alla Trisomia 21. L'alterazione del quadro fenotipico
in individui con la sindrome di Down è stata attribuita in primo luogo ad
anomalie nel dosaggio genico, derivanti dalla trisomia del cromosoma 21.
Tuttavia, studi di espressione genica eseguiti su larga scala hanno messo in
luce uno scenario più complesso, in cui si assiste a una deregolazione
trascrizionale globale, estesa ai geni euploidi. In tale contesto, è ipotizzabile
l’esistenza di un meccanismo di controllo dell’espressione genica più
complesso, che presuppone interazioni dirette e/o indirette tra i prodotti genici
del cromosoma 21 e i geni localizzati sugli altri cromosomi. Inoltre,
recentemente è emerso un cross-talk tra RNA messaggeri, pseudogeni e
lincRNA, mediato dalla competizione per il legame a specifici miRNA. Pertanto,
lo sbilanciamento genico dovuto alla trisomia del cromosoma 21, potrebbe agire
sull’espressione genica globale, mediante un cross-talk mediato dall’interazione
con specifici miRNA durante l’embriogenesi, causando alterazioni dello sviluppo
e determinando, conseguentemente, il carattere multisistemico tipico del
fenotipo della sindrome di Down.
Alla luce di tali evidenze, lo scopo di questo progetto di dottorato si è focalizzato
sullo studio della deregolazione genica globale e del potenziale ruolo di
“spugne” di microRNA svolto dai geni HSA21 sovraespressi nella sindrome
durante lo sviluppo embrionale.
L’analisi di dataset pubblici di espressione di miRNA e mRNA condotti su
embrioni umani alla 4-6 settimana di sviluppo ha permesso di delineare un

2
network di interazione miRNA/mRNA durante l’embriogenesi. Inoltre, tale studio
ha mostrato che la sovraespressione del 3’UTR del gene HSA21 HUNK,
sovraespresso nella sindrome di Down, induce un aumento dell’espressione di
geni coinvolti nello sviluppo embrionale, tra cui BCL2, CLIC5, EPHA5, ERBB4,
HIPK2, MECP2, ONECUT2, e WNT5A, ed una riduzione dell’espressione di
miRNA, tra cui miR-17, miR-20a, miR-20b, miR-128 e miR-200c. Tali risultati
suggeriscono che ci siano perturbazioni del normale network di regolazione tra
mRNA e miRNA durante lo sviluppo di embrioni affetti da DS, causate dalla
sovraespressione dei geni HSA21 presenti in triplice copia. Ciò spiegherebbe,
almeno in parte, le alterazioni a carattere multisistemico tipiche della sindrome.

3
2 Abstract (English)
Down syndrome (DS) - also known as Trisomy 21 - is a genetic disorder caused
by an extra copy of all or part of human chromosome 21 (HSA21). DS is a
complex genetic condition characterized by over 80 clinically different
phenotypes of variable penetrance and expressivity. Individuals with DS show
alterations - both structural and functional - affecting distinct organs and
systems, which suggest that a perturbation of embryogenesis occurs in
individuals with Down syndrome, due to Trisomy 21.
Large-scale gene expression studies have revealed a more complex scenario,
highlighting a global transcriptional deregulation, extended also to genes
mapping outside the DS Critical Region (DSCR) on HSA21, as well as on the
other chromosomes. In this context, it is clear that direct and/or indirect
interactions between gene products of HSA21 and those from the other
chromosomes can better explain the complexity of the clinical manifestations of
the disorder. Recent studies have pointed out a previously unexpected role of
non-coding RNA (ncRNAs), such as pseudogenes and lincRNAs, on gene
expression regulation. In particular, a new crosstalk mediated by the
competition for the binding to specific miRNAs has been demonstrated between
messenger RNAs and ncRNAs. Such a regulatory crosstalk represents a new
and interesting "RNA language" through which different mRNAs regulate each
other by competing for miRNAs' availability.
Given these recent findings and considering that Trisomy 21-induced gene
imbalance perturbs the entire transcriptome and occurs throughout the
embryogenesis, the above-described regulatory crosstalk may be altered by
HSA21 trisomy in DS foetuses. The pathological overexpression of HSA21
genes may perturb gene expression during embryogenesis through the
alteration of the crosstalk mediated by the interaction with specific miRNAs. In
turn, it would cause typical multisystem clinical manifestations of Down
syndrome.

4
Thus, the aim of this PhD project is to deeply explore the global gene
deregulation, and the potential role of microRNAs' "sponges" played by HSA21
genes that are overexpressed in DS during embryonic development. Taking
advantage of publicly available mRNA and miRNA expression datasets of
human embryos (4-6 weeks), a regulatory miRNA/mRNA network in these
crucial weeks of the human embryonic development was established. A
significant fraction of genes within the network belong to developmental-related
pathways. Afterwards, HSA21 genes overexpressed in DS embryos that belong
to this network were identified using RNA-Seq datasets from DS and euploid
matched chorionic villi. HUNK gene was computationally selected as the best
candidate to be an HSA21-derived miRNAs’ sponge. Experimental studies
confirmed that the overexpression of its 3'UTR induces an increased expression
of genes involved in embryonic development, including BCL2, CLIC5, EPHA5,
ERBB4, HIPK2, MECP2, ONECUT2, and WNT5A, and a reduction of the
expression of correlated miRNAs, including miR-17, miR-20a, miR-20b, miR-
128 and miR-200c. Although further studies are still in progress, the results of
both the computational and the experimental studies strongly suggest that the
overexpression of HSA21 genes may perturb the physiologic regulatory
miRNA/mRNA network during DS embryos' development. This would explain, at
least in part, the multisystemic nature of the alterations that typically occur in
individuals with the syndrome.

Introduction
5
3 Introduction
3.1 Down syndrome Down syndrome (DS) - also known as Trisomy 21 - is a genetic disorder caused
by an extra copy of all or part of human chromosome 21 (HSA21; Figure 1). DS
was first characterized as a separate form of mental disability in 1866 by John
Langdon Down, who used the term ‘mongoloid’, due to shared facial similarities
of children with Down syndrome with those of Mongolian race (Down, 1995).
The term ‘Trisomy 21’ began to be addressed to DS in 1959, when Jérôme
Lejeune reported the discovery that Down syndrome resulted from an extra
chromosome, using karyotype technique (Lejeune et al., 1959). Trisomy 21 is
the most frequent human aneuploidy with an incidence of 1 in every 700-800
live births in Western countries (Park and Chung, 2013).
Figure 1: Trisomy 21 karyotype showing three copies of human chromosome 21 (HSA21)

Introduction
6
3.1.1 Down syndrome as a multisystem disorder DS is a complex genetic condition characterized by over 80 clinically different
phenotypes of variable penetrance and expressivity. Individuals with DS show
alterations - both structural and functional - affecting distinct organs and
systems, which generally evolve with age (Antonarakis and Epstein, 2006).
Physical growth delays, distinguishing dysmorphic features - especially visible
in the craniofacies, hands and feet - muscle hypotonia, and mild to moderate
intellectual disability represent constant features observed in DS. Individuals
with DS present an increased risk of early-onset Alzheimer-like
neurodegeneration (Reeves et al., 2001; Wiseman et al., 2009). Two groups of
major congenital abnormalities, that can cause morbidity or even death if left
untreated, are associated with DS: congenital heart disease (CHD) and several
types of gastrointestinal-tract obstruction or dysfunction. CHD affect
approximately 50% of children with DS, with a wide range of defects and
severity. Atrial or ventricular septal defect, complete atrioventricular-canal
defect, mitral valve problems, tetralogy of Fallot and patent ductus arteriosus
are common features of DS heart (Antonarakis and Epstein, 2006; Wiseman et
al., 2009). The gastrointestinal system is also affected, particularly duodenal
stenosis or atresia, pyloric stenosis, Meckel diverticulum, imperforate anus and
Hirschprung disease occur with an increased incidence in DS children
(Patterson, 2007). Moreover, defects involving the immune and haematopoietic
systems are recurrent phenomena in the pathogenesis of the syndrome.
Individuals with Down syndrome have a 20-fold increased risk of childhood
acute lymphoblastic leukaemia (ALL) and a decreased risk of solid tumours,
such as breast cancer, in all age-groups (Patterson, 2009). These evidences,
combined to the reduced incidence of diabetic proliferative retinopathy and
atherosclerosis, strongly indicate a suppression of angiogenesis (Ryeom and
Folkman, 2009).
Introduction
7
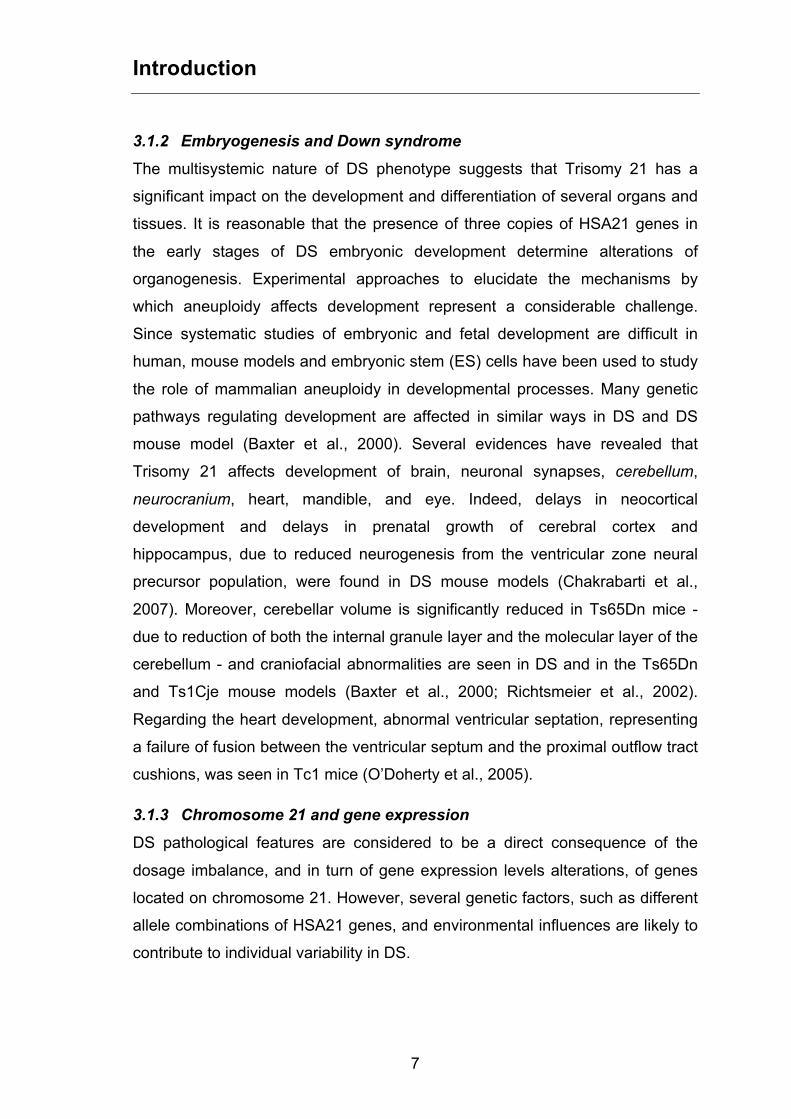
3.1.2 Embryogenesis and Down syndrome The multisystemic nature of DS phenotype suggests that Trisomy 21 has a
significant impact on the development and differentiation of several organs and
tissues. It is reasonable that the presence of three copies of HSA21 genes in
the early stages of DS embryonic development determine alterations of
organogenesis. Experimental approaches to elucidate the mechanisms by
which aneuploidy affects development represent a considerable challenge.
Since systematic studies of embryonic and fetal development are difficult in
human, mouse models and embryonic stem (ES) cells have been used to study
the role of mammalian aneuploidy in developmental processes. Many genetic
pathways regulating development are affected in similar ways in DS and DS
mouse model (Baxter et al., 2000). Several evidences have revealed that
Trisomy 21 affects development of brain, neuronal synapses, cerebellum,
neurocranium, heart, mandible, and eye. Indeed, delays in neocortical
development and delays in prenatal growth of cerebral cortex and
hippocampus, due to reduced neurogenesis from the ventricular zone neural
precursor population, were found in DS mouse models (Chakrabarti et al.,
2007). Moreover, cerebellar volume is significantly reduced in Ts65Dn mice -
due to reduction of both the internal granule layer and the molecular layer of the
cerebellum - and craniofacial abnormalities are seen in DS and in the Ts65Dn
and Ts1Cje mouse models (Baxter et al., 2000; Richtsmeier et al., 2002).
Regarding the heart development, abnormal ventricular septation, representing
a failure of fusion between the ventricular septum and the proximal outflow tract
cushions, was seen in Tc1 mice (O’Doherty et al., 2005).
3.1.3 Chromosome 21 and gene expression DS pathological features are considered to be a direct consequence of the
dosage imbalance, and in turn of gene expression levels alterations, of genes
located on chromosome 21. However, several genetic factors, such as different
allele combinations of HSA21 genes, and environmental influences are likely to
contribute to individual variability in DS.

Introduction
8
The phenotypic alterations occurring in individuals affected with DS was
primarily attributed to gene dosage imbalance resulting from the presence of an
extra copy of chromosome 21. Thus, characterization of all HSA21 genes
represented a starting point to better understand the molecular mechanisms
underlying the different phenotypic manifestations of the DS.
Human chromosome 21 is the smallest acrocentric chromosome and
represents 1.5% of the entire human genome, spanning about 50 million base
pairs. The almost complete, high-quality sequence of the long arm (21q) of
HSA21 was published in 2000 (Hattori et al., 2000). The initial analysis of 21q
revealed 225 genes (127 known genes and 98 putative novel genes predicted
in silico) and 59 pseudogenes (Hattori et al., 2000). Although the precise gene
catalogue has not yet been conclusively determined, the total number of HSA21
genes has increased to more than 350 (Gardiner, 2003). Several studies have
been focused to find out specific genotype-phenotype correlations, through the
characterization of chromosome 21 genes functions and the consequences of
their increased expression to specific features of the phenotype, according to a
‘gene dosage’ hypothesis. Such hypothesis states that specific phenotypes are
a consequence of a gene dosage imbalance that results in overexpression of
individual causative genes. To address this issue, human partial trisomy and
DS mouse models have been studied (Lyle et al., 2009). Mapping partial
HSA21 trisomy allowed narrowing studies to a limited region of chromosome
21, called “Down Syndrome Critical Region” (DSCR), that contains genes
responsible for many features of DS (Barlow et al., 2001; Korenberg et al.,
1990; Sinet et al., 1994). The DSCR was defined with a proximal boundary
between markers D21S17 (35 892 kb) and D21S55 (38 012 kb), and a distal
boundary at MX1 (41 720 kb). This is a region spanning 3.8–6.5 Mb and
containing 25–50 genes. Although the notion of a DSCR has gained some
acceptance in DS research, the data supporting it remain controversial. The
generation of several DS mouse models enabled further progress in the
research for dosage-sensitive genes underlying DS. HSA21 shares conserved

Introduction
9
synteny with orthologous regions on three mouse chromosomes: Mmu10,
Mmu16 and Mmu17 (Figure 2).
Figure 2: HSA21 conserved synteny with mouse chromosomes Mmu10, Mmu16 and Mmu17
The first two models that were generated, Ts65Dn and Ts1Cje mice, with
duplications of parts of Mmu16, showed several morphological and functional
features of DS. In particular, it was demonstrated that some DSCR genes are
involved in development of different organs and tissues. Indeed, the presence
of three copies of the DYRK1A gene is related to learning, memory and brain
development, neurodegeneration, and motor control, while DSCAM gene is
associated to cardiac defects and ETS2 and ERG genes are involved in
leukaemia (Lana-elola et al., 2011).
However, the strategy to map partial trisomy 21 in animal models or to analyze
by microarray the gene expression in different DS cells/tissues, have often
reported conflicting results (Diller et al., 2008; Jablonska et al., 2006; Li et al.,
2006; Lyle et al., 2009; Sommer and Henrique-Silva, 2008). Indeed, a study on
a mouse model either trisomic or monosomic for the syntenic DSCR found that
trisomy for the DSCR alone is not sufficient to produce the structural and
Baxter et al., 2000
Introduction
10
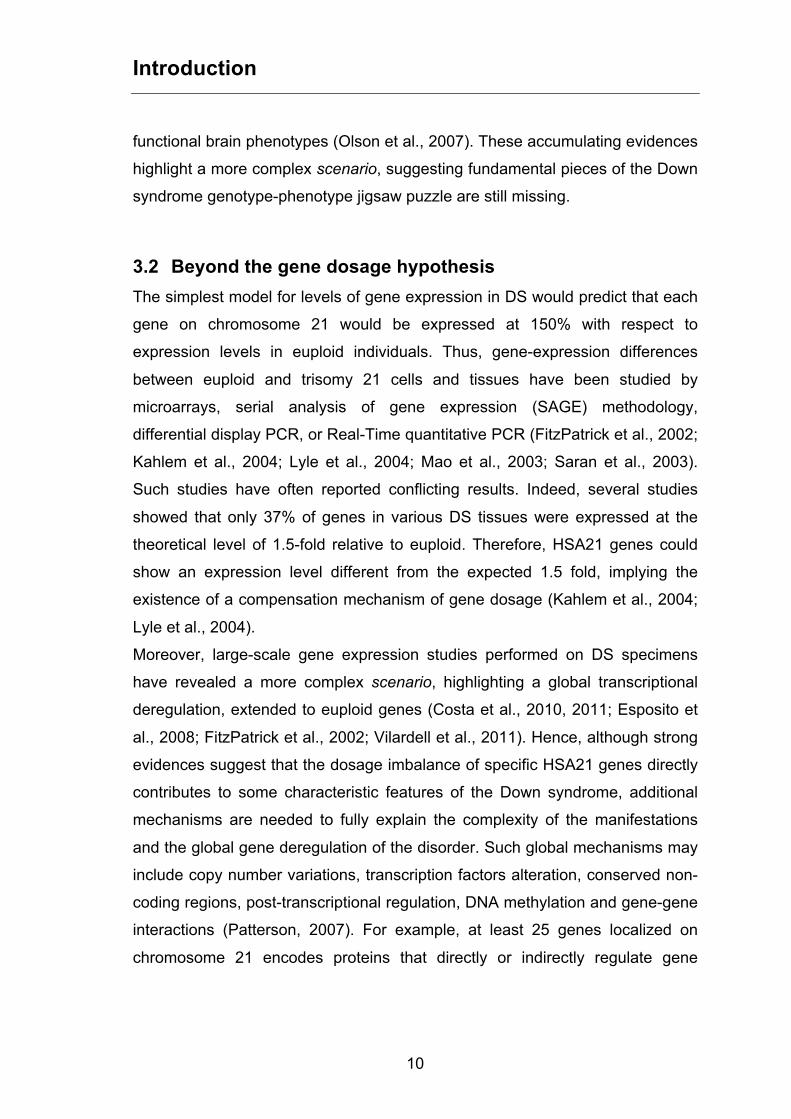
functional brain phenotypes (Olson et al., 2007). These accumulating evidences
highlight a more complex scenario, suggesting fundamental pieces of the Down
syndrome genotype-phenotype jigsaw puzzle are still missing.
3.2 Beyond the gene dosage hypothesis The simplest model for levels of gene expression in DS would predict that each
gene on chromosome 21 would be expressed at 150% with respect to
expression levels in euploid individuals. Thus, gene-expression differences
between euploid and trisomy 21 cells and tissues have been studied by
microarrays, serial analysis of gene expression (SAGE) methodology,
differential display PCR, or Real-Time quantitative PCR (FitzPatrick et al., 2002;
Kahlem et al., 2004; Lyle et al., 2004; Mao et al., 2003; Saran et al., 2003).
Such studies have often reported conflicting results. Indeed, several studies
showed that only 37% of genes in various DS tissues were expressed at the
theoretical level of 1.5-fold relative to euploid. Therefore, HSA21 genes could
show an expression level different from the expected 1.5 fold, implying the
existence of a compensation mechanism of gene dosage (Kahlem et al., 2004;
Lyle et al., 2004).
Moreover, large-scale gene expression studies performed on DS specimens
have revealed a more complex scenario, highlighting a global transcriptional
deregulation, extended to euploid genes (Costa et al., 2010, 2011; Esposito et
al., 2008; FitzPatrick et al., 2002; Vilardell et al., 2011). Hence, although strong
evidences suggest that the dosage imbalance of specific HSA21 genes directly
contributes to some characteristic features of the Down syndrome, additional
mechanisms are needed to fully explain the complexity of the manifestations
and the global gene deregulation of the disorder. Such global mechanisms may
include copy number variations, transcription factors alteration, conserved non-
coding regions, post-transcriptional regulation, DNA methylation and gene-gene
interactions (Patterson, 2007). For example, at least 25 genes localized on
chromosome 21 encodes proteins that directly or indirectly regulate gene
Introduction
11
transcription, while other chromosome 21 proteins contribute to post-
translational modification of transcription factors, including their
phosphorylation, dephosphorylation and sumoylation (Gardiner, 2006). Thus,
altered stoichiometry in transcription factors’ complexes, due to extra copy of
HSA21, may contribute to the Down syndrome phenotype, determining
perturbation of downstream gene expression. Moreover, recent studies have
highlighted the role of non-coding RNAs (ncRNAs) in regulation of gene
expression. Particularly, microRNAs (miRNAs) have been shown to control
gene expression, interfering with translation or inducing degradation of mRNA.
Further, miRNAs have been identified in all tissues in mammals and have been
associated with several biological processes, including development and
differentiation (Motti et al., 2012). Since each miRNA may regulate expression
of hundreds mRNAs and five miRNAs (i.e., miR-99a, let-7c, miR-125b-2, miR-
155 and miR-802) are encoded by genes on HSA21, it is reasonable that
HSA21‑derived miRNAs could control expression of other genes. Indeed,
HSA21‑derived micro-RNAs are overexpressed in Down syndrome brain and
heart specimens, leading to improper repression of specific target proteins that
are linked to specific phenotypes (Dierssen, 2012).
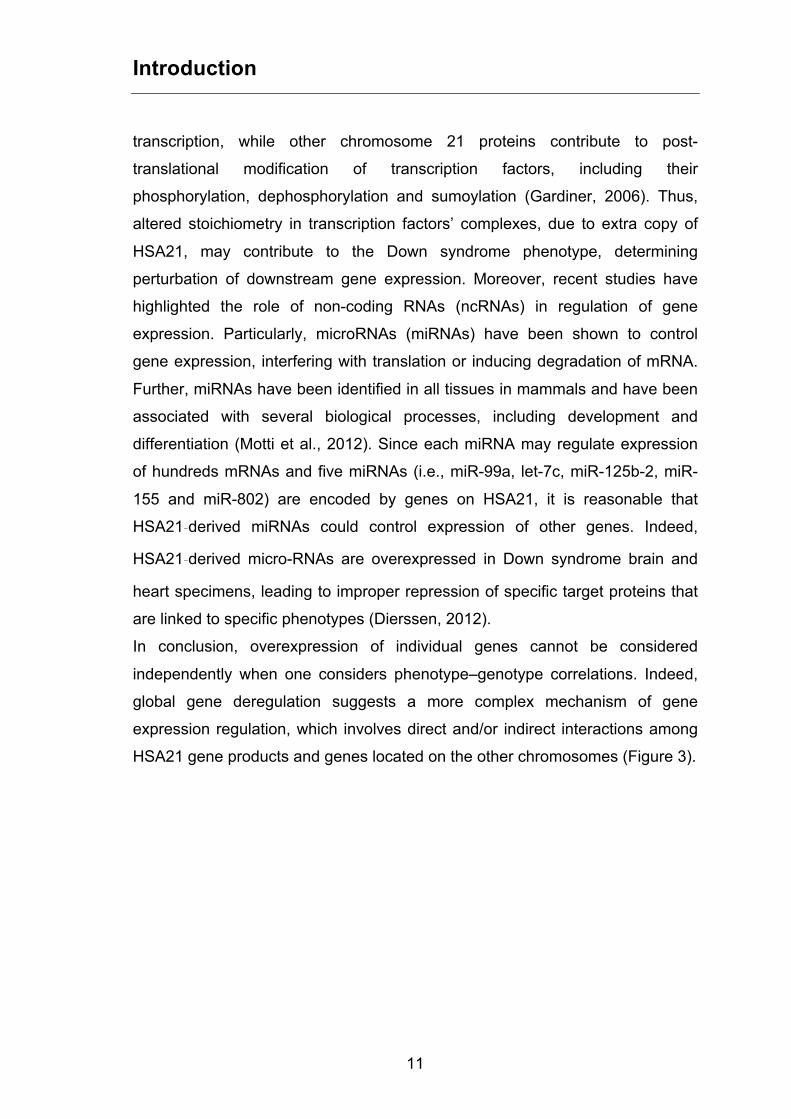
In conclusion, overexpression of individual genes cannot be considered
independently when one considers phenotype–genotype correlations. Indeed,
global gene deregulation suggests a more complex mechanism of gene
expression regulation, which involves direct and/or indirect interactions among
HSA21 gene products and genes located on the other chromosomes (Figure 3).

Introduction
12
Figure 3: Hypothesis for Trisomy 21 phenotypes
3.2.1 ceRNA hypothesis Recently, several evidences have shown cross-talk between RNAs, both coding
and non-coding, through microRNA binding, which determine large-scale
regulatory network across the transcriptome (Poliseno et al., 2010; Salmena et
al., 2011; Tay et al., 2011). RNAs influence each other’s levels by competing for
a limited pool of miRNAs. This competing endogenous RNAs (ceRNAs) act as
miRNAs “sponges” by sharing common microRNA responsive elements
(MREs), inhibiting normal miRNAs activity. These sponges absorb miRNAs,
lowering the levels of available miRNAs for the target mRNA, resulting in
increased translations (Figure 4).
Antonarakis et al., 2004

Introduction
13
Figure 4: RNAs' crosstalk mediated by miRNAs
This new “RNA language” mediated by MREs regulates gene expression in
several biological processes, including development and differentiation. Thus,
ceRNA activity explains the complexity of organisms’ transcriptome landscape.
Moreover, perturbations of ceRNAs and ceRNA networks could have an impact
on disease onset. Indeed, ceRNAs have been shown to be involved in the
pathogenesis of several common cancers such as melanoma, prostate cancer,
liver cancer, breast cancer, and thyroid cancer (Fan et al., 2013; Kumar et al.,
2014; Tay et al., 2011, 2014).
3.3 microRNAs In the past ten years, genome-wide expression analyses have revealed a
pervasive transcription of human genome, bringing to light thousands of non-
coding transcripts. These evidences determined a revolution in the “RNA
world”, leading to reconsider the central dogma of biology (Mattick and
Makunin, 2006). Further studies have revealed that ncRNAs represents an
Salmena et al., 2010
Introduction
14
hidden layer of molecular genetics, which fulfill a wide range of functions,
including the control of chromosome dynamics, splicing, RNA editing,
translational inhibition and mRNA destruction (Eddy, 2001).
A class of ncRNAs is represented by microRNAs, which are short (22
nucleotide in length) endogenous non-coding RNAs involved in gene
expression regulation in plant and animals. The first miRNA, lin-4, was
discovered in 1993 in C. elegans. lin-4 gene did not encode a protein, but it
produced a short non-coding RNA complementary to multiple sequences in the
3' UTR of the lin-14 gene, which control the timing of larval development by
repressing lin-14 (Lee et al., 1993). Nevertheless, only a few years later, the
characterization of a second small ncRNA, let-7, highlighted the hidden role of
miRNAs regulation (Reinhart et al., 2000).
miRNAs influence gene expression by sequence-specific binding to target
mRNAs and promoting their degradation and/or translational inhibition (Bartel,
2004). miRNAs have been shown to play a crucial regulatory role in several
biological processes, including developmental transitions, neuronal patterning,
apoptosis, adipogenesis metabolism and hematopoiesis. Moreover, altered
levels of miRNAs’ expression have been associated with the pathogenesis of
different human diseases, such as cancer, cardiovascular disorders, Alzheimer
disease, viral infections and metabolic diseases (Singh et al., 2008).
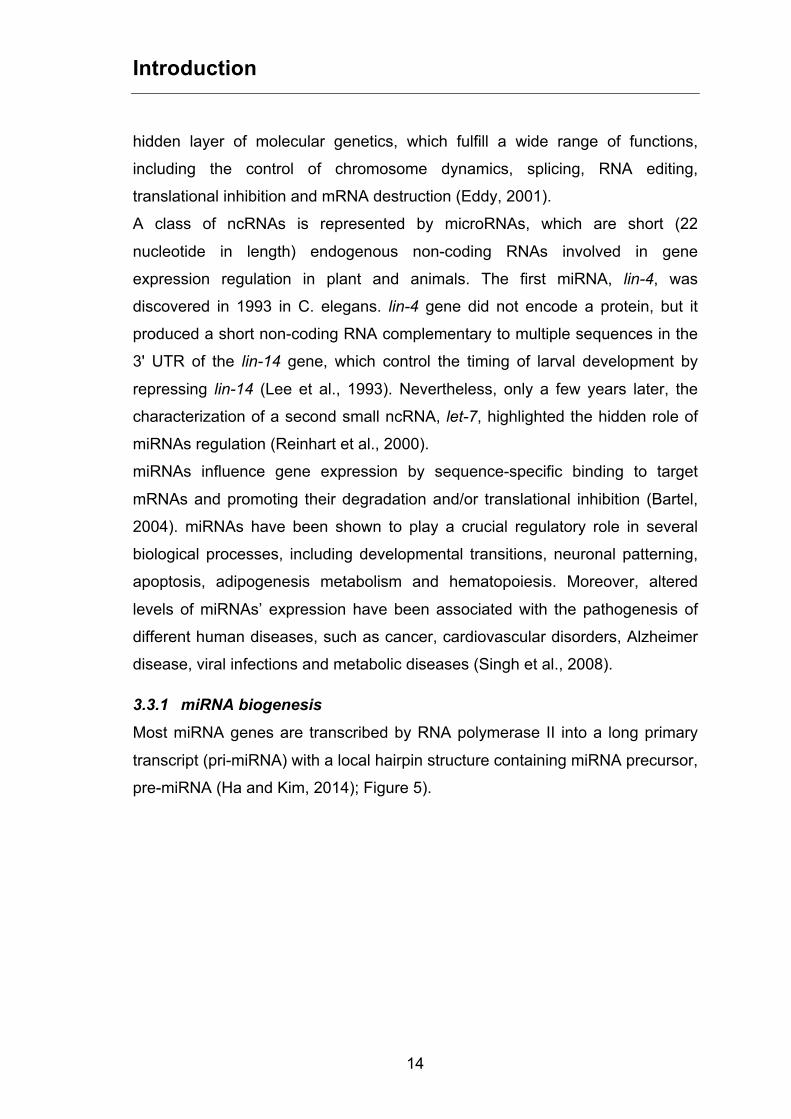
3.3.1 miRNA biogenesis Most miRNA genes are transcribed by RNA polymerase II into a long primary
transcript (pri-miRNA) with a local hairpin structure containing miRNA precursor,
pre-miRNA (Ha and Kim, 2014); Figure 5).

Introduction
15
Figure 5: miRNA biogenesis
Pri-miRNA can range in size from hundreds of nucleotides to tens of kilobases
(Bushati and Cohen, 2007). However, miRNAs can also be transcribed by RNA
polymerase III, which specifically synthesizes small non-protein coding RNAs,
such as tRNAs, 5S ribosomal RNA, and the U6 snRNA (Bartel, 2004). Most
mammalian miRNAs are intergenic or are encoded by introns of both coding
and non-coding genes, while some miRNAs are encoded by exonic regions.
Intronic miRNAs’ processing does not affect splicing of the host pre-mRNA and
appears to occur co-transcriptionally before splicing catalysis (Kim et al., 2007).
The pre-miRNA hairpin is processed from the pri-miRNA transcript within the
nucleus by a multiprotein complex called the Microprocessor. The core of this
complex consists of the RNase III enzyme Drosha and the double-stranded
RNA-binding domain (dsRBD) protein known as DiGeorge syndrome critical
region 8 (DGCR8 or "Pasha" in invertebrates) (Ha and Kim, 2014). DGCR8
recognizes the pri-miRNA at the junction of single stranded RNA and double
Winter et al., 2009
Introduction
16
stranded RNA and guides the catalytic RNase III domain of Drosha to a specific
cleavage. Drosha cleaves the pri-miRNA ~11 bp from the junction on the stem,
producing a ~ 60-70 bp pre-miRNA with a 5’ phosphate and a two-nucleotide 3’
overhang (Han et al., 2006).
Following Drosha processing, pre-miRNA is exported into the cytoplasm to
complete maturation process. The export receptor Exportin-5 recognizes the 2-
nt 3’ overhang, characteristic of RNase III-mediated cleavage, and transports
the pre-miRNA into the cytoplasm via a Ran-GTP-dependent mechanism (Ha
and Kim, 2014). Once in the cytoplasm, the pre-miRNA is cleaved near the
terminal loop by Dicer to produce the mature ~22-nt miRNA:miRNA* duplex
(Bushati and Cohen, 2007). Dicer is another RNase III endonuclease, highly
conserved in all eukaryotes, with a N-terminal ATPase/Helicase domain,
DUF283 (domain of unknown function), PAZ (Piwi/Argonaute/Zwilli) domain,
and two tandem RNase III nuclease domains (RNase IIIa and RNase IIIb)
located at the C-terminal followed by a dsRNA-binding domain (dsRBD). The
PAZ domain binds the 2nt 3’ overhang of pre-miRNA and the two RNase III
domains cleave (“dice”) the dsRNA (Macfarlane and Murphy, 2010).
Dicer, together with the human immunodeficiency virus trans-activating
response RNA binding protein (TRBP), recruits the Argonaute protein Ago2
(and other Ago proteins), and they form a trimeric complex that initiates the
assembly of the RNA-induced silencing complex (RISC), a ribonucleoprotein
complex (Bushati and Cohen, 2007). Only one strand is usually incorporated
into RISC complex: the miRNA strand with relatively lower stability of base-
pairing at its 5’ end is incorporated into RISC, whereas the miRNA* strand is
typically degraded. Once incorporated into RISC, the miRNA guides the
complex to its mRNA targets for silencing mediated by base-pairing
interactions.
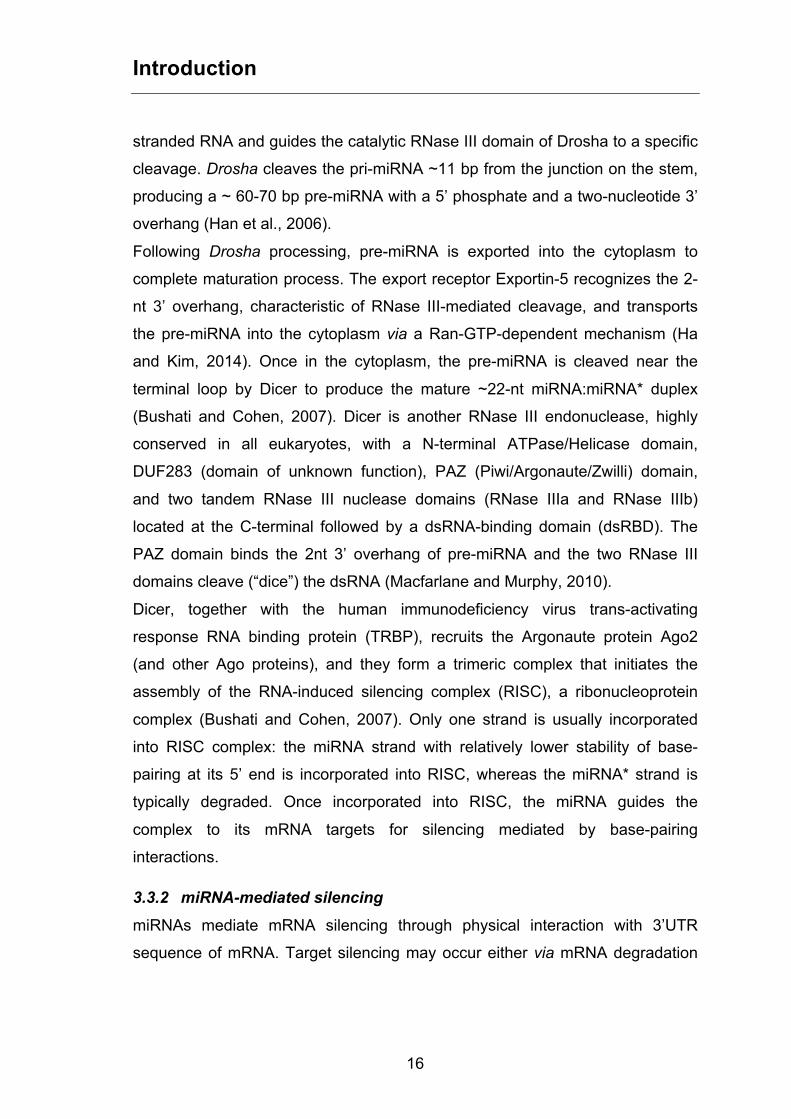
3.3.2 miRNA-mediated silencing miRNAs mediate mRNA silencing through physical interaction with 3’UTR
sequence of mRNA. Target silencing may occur either via mRNA degradation

Introduction
17
or preventing mRNA translation, depending on the identity of base pairing. In
cases of perfect complementarity to the miRNA, target mRNAs undergo
degradation; otherwise, their translation is prevented (Bushati and Cohen,
2007). miRNAs mediate mRNA repression by recruiting the RISC complex to
target mRNAs. Argonaute proteins, specifically Ago2 in mammals and flies, are
capable of endonucleolytic cleavage and are essential for miRNA-mediated
gene silencing (Bushati and Cohen, 2007; Fabian and Sonenberg, 2012). Ago
proteins interact with GW182/TNRC6 (TriNucleotide repeat-containing) family
proteins, which provide a platform for interaction with several proteins and
complexes required for miRNA target decay (Fabian and Sonenberg, 2012).
First, interaction with poly(A) binding protein (PABP), and CCR4-NOT and
PAN2-PAN3 deadenylase complexes, induces target deadenylation of the
poly(A) tail. Following deadenylation, DCP1-DCP2 decapping complexes
remove the 5’ terminal cap and the target mRNA is degraded by Xrn1 5’-3’
exonuclease (Fabian and Sonenberg, 2012; Inada and Makino, 2014).
Imperfect base-pairing of miRNAs with their targets promotes translational
repression rather than cleavage and degradation. The mechanism of
translational repression by miRNAs remains controversial. Some studies show
that miRNAs block translation initiation, whereas other studies suggest a block
in elongation (Bushati and Cohen, 2007). A recent model suggests that during
miRNA-mediated repression all three levels of translation (initiation, elongation
and termination) are coordinately inhibited or slowed (Gu and Kay, 2010);
Figure 6).

Introduction
18
Figure 6: Mechanisms of miRNA-mediated silencing
Indeed, RISC complex inhibits translation initiation by interfering with eIF4G cap
recognition, by preventing the circularization required for efficient translation
and by preventing the 60S and 40S ribosomes assembly. Moreover, miRNA-
induced silencing complex might inhibit ribosome elongation or promote
premature translation termination and co-translation degradation in the P-
bodies (Bushati and Cohen, 2007; Gu and Kay, 2010).
Sethi et al., 2013
Aim
19
4 Aim
The multisystemic nature of Down syndrome suggests the involvement of
chromosome 21 trisomy in the development and differentiation of different
organs and tissues (Wiseman et al., 2009). However, the role of triplicated
genes and the mechanism by which they alter the events underlying
organogenesis are still unclear. Thus, addressing the pathogenic mechanisms
underlying the Down syndrome in the early stages of embryonic development,
when organogenesis occurs, is of crucial relevance. Moreover, large-scale gene
expression studies on Down syndrome cells/tissue – carried out also in our
laboratory (Costa et al., 2010, 2011) - revealed a more complex scenario.
Particularly, it has been shown that the transcriptional deregulation is not limited
to genes mapping on HSA21, but it is extended to euploid genes, suggesting
direct and/or indirect interactions between HSA21 genes and genes located on
other chromosomes. Furthermore, very recently, the existence - at least in
tumours - of a new gene regulatory mechanism based on the competition for
microRNAs binding (the competing endogenous RNAs, ceRNAs) has been
demonstrated.
In light of these considerations, the aim of my PhD project is to understand
whether the multisystemic alterations of Down syndrome can be caused, at
least in part, by a competition for the same miRNAs between HSA21 and non-
HSA21 transcripts in early stages of the embryonic development. The main
purpose of this project is to assess whether HSA21 mRNAs - that are
overexpressed in DS embryos - can potentially function as miRNA "sponges",
acting as ceRNAs and thus perturbing the expression of non-HSA21 mRNAs
involved in the organogenesis.
The starting hypothesis is that the presence - throughout the entire embryonic
development - of supernumerary copies of HSA21 mRNAs in DS embryos may
disrupt the physiological mRNAs/miRNAs balance. It would affect the miRNA-
mediated gene silencing that physiologically occurs during the embryonic
development. This hypothesis would explain - at least partially - the
Aim
20
multisystemic nature of the DS pathological outcomes, the heterogeneous
phenotype of DS individuals as well as the global gene expression deregulation
observed in distinct cell types and tissues isolated from DS individuals.
To address this aim, my PhD project first focused on the definition of a network
of potential interactions between HSA21 and non-HSA21 genes mediated by
miRNAs' binding during the early stages of human embryonic development.
Such network is built on mRNAs and miRNAs expression data collected at
specific weeks of the embryogenesis, and is based on a computational
prediction analysis of miRNA binding sites within 3'UTRs of all the expressed
genes. Then, the research project focused on the potential perturbation of such
network - in DS embryos - induced by the presence of supernumerary copy of
HSA21 genes. Afterwards, the computationally predicted mRNA/miRNAs
interactions were evaluated using experimental in vitro approaches to validate
the potential role of a selected HSA21 gene (i.e. HUNK) as sponge for miRNAs.
The aim of the project was also to establish a potential regulatory crosstalk
between HSA21 genes and those belonging to development- and embryo-
related pathways. The hypothesis is that such mRNAs may reciprocally regulate
their expression through a ceRNA (or ceRNA-like) network.
As stated in the seminal work of Salmena and colleagues (2011), the aim of this
project is to demonstrate that HSA21 genes overexpressed in DS embryos and
some developmentally relevant mRNAs "talk to each other using microRNA
response elements, as letters of a new language".

Methods
21
5 Methods
5.1 Data processing and bioinformatics analysis
5.1.1 Expression data sets description and processing To assess gene expression for mRNAs and miRNAs during human
embryogenesis, two previously published data sets were analysed. For mRNAs
expression, a microarray genome-wide expression study carried out on human
embryos during weeks 4-9 of development was analysed (Yi et al., 2010).
Microarray technology involves the hybridization of mRNA molecules to probes
immobilized in known locations on a chip. Fluorescence signal intensity of each
spot is detected as an indirect measure of a specific gene expression. This
study was performed on three RNA samples from whole embryo for each week
using the Human Genome U133 Plus 2.0 Array (Affymetrix), which contains
50093 transcripts accounting for 38500 human genes. Normalized mRNA
expression data were retrieved from the public functional genomics data
repository Gene Expression Omnibus (GEO) at the National Center of
Biotechnology Information (NCBI), through Geo Series accession number
GSE15744. Custom MATLAB scripts were used to process data. Particularly,
probe set IDs were associated to corresponding gene symbols using the HG-
U133A_2 Affymetrix annotation file and mean values were calculated across
genes. After filtering out mean values among replicates inferior than an arbitrary
threshold of 49.5 signal intensity, an mRNA expression matrix was compiled for
weeks 4-6 of human embryogenesis.
For miRNAs expression, a recently published miRNA microarray study was
analysed (Lin et al., 2013). The miRNA expression study was performed on
small RNA samples extracted from 3 embryos at week 4, 3 embryos at week 5
and 2 embryos at week 6 of development in dual-sample experiments, using
µParaflo microfluidic chip (Atactic Technologies), which covers 835 miRNAs
annotated in the Sanger miRBase database (release 10.1). Normalized miRNA
expression data were retrieved from GEO through Geo Series accession

Methods
22
number GSE46795. MATLAB scripts were used to calculate mean values
among replicates and to set an arbitrary threshold of 49.5 signal intensity in
order to compile a matrix for miRNA expression during human embryogenesis.
Using a custom MATLAB script, Pearson’s linear correlation was calculated
between each mRNA-miRNA pair after logarithmic transformation of expression
data and a 2D correlation matrix was compiled.
5.1.2 mRNA-miRNA interactions prediction Fasta file corresponding to the 3’UTR sequences of 11080 genes expressed
during weeks 4-6 of human development were downloaded from UCSC Table
Browser (Karolchik et al., 2004). MREs in these sequences were predicted
executing TargetScan 6.0 algorithm implemented in Perl language. Target
prediction data were filtered out to remove miRNAs not expressed in weeks 4-6
of human embryogenesis. Then, a binary matrix with 11080 rows and 134
columns was compiled according to MREs prediction, and 0 and 1 were used to
indicate the absence and presence of miRNA/mRNA interaction, respectively.
5.1.3 Data integration and biclustering analysis TargetScan prediction information was integrated with the expression
correlation data using element-by-element product of the two matrices in
MATLAB. The integrated association matrix thus compiled underwent
biclustering analysis. PLAID model biclustering was performed with the R
“biclust” package (Turner et al., 2005). This algorithm is an improvement of
original ’Plaid Models for Gene Expression Data’ (Lazzeroni and Owen, 2002).
The plaid model allows a gene to be in more than one cluster, or in none at all.
It consists of a series of additive layers intended to capture the underlying
structure of a gene expression matrix. Each layer is fitted to linear model y ~ m
+ a + b, that estimates three parameters: m (constant for all elements in the
bicluster), a (constant for all rows in the bicluster) and b (constant for all
columns).
For the biclustering analysis, background layer was considered absent in the
data matrix. Before a layer is added, it’s statistical significance is compared

Methods
23
against 3 layers obtained by random, 15 and 10 iterations were performed to
find starting values and each layer, respectively. The row and column release
probabilities were set to 0.6 and the maximum number of layers to 50. The
biclustering algorithm was iterated 100 times.
5.1.4 Differential gene expression in DS embryos RNA-Sequencing data sets from 5 normal and 4 DS chorionic villus samples
were downloaded from GEO (accession n. GSE42144) in SRA format and then
converted into FASTQ format using fastq-dump function included in the SRA
Toolkit. Reads quality was evaluated through the FASTQC software. RNA-Seq
reads were mapped against human reference transcriptome and then genome
hg19 using TopHat v.2 software, allowing 3 segment mismatch. Gene counts
and RPKM (Reads Per Kilobase of transcript per Million mapped reads)
normalization were performed using RNASeqGUI R package (Russo and
Angelini, 2014) and a threshold of 1 RPKM was used. Average RPKM values
for each gene in each sample group (euploid and DS) were calculated. To
identify differentially expressed genes in DS versus euploid conditions, fold
change (FC) was calculated as the ratio of average RPKM value for
DS/average RPKM value for euploid. Genes with a FC equal or greater than 1.5
FC were considered up-regulated in DS.
5.2 Generation of plasmid constructs The full 3’UTR of HUNK gene (NM_014586) and the five partially overlapping
3’UTR fragments of the same 3'UTR were amplified from cDNA of MCF7 cell
line by polymerase chain reaction (PCR). Specific PCR primers were designed
using Oligo 4.0 software and synthesized by IDT (Table 1).
PCR reactions were carried out in 25 µL reaction volume, using 1 unit of
Platinum Taq DNA Polymerase High Fidelity (Invitrogen), 2.5 µL of 10X High
Fidelity PCR Buffer, 1 µL of MgSO4 (50 mM), 0.5 µL of dNTP mix (10 mM), 0.7
µL of each primer (8 µM) and 1 µL of cDNA (50 ng/µL). Amplification was
performed in Bio-Rad thermal cycler under the following conditions: 94°C for 1
min; then 35 cycles of 94°C for 30 sec, annealing temperature (Ta) for 30 sec,

Methods
24
68°C for 6 min; and a final extension at 68°C for 30 min. Amplicons were
analysed by 1.2% agarose gel electrophoresis and then underwent automated
Sanger sequencing.
Amplicon Forward Reverse Size (bp)
Ta
(°C)
HUNK_3UTR_FULL CAGCGGGGTTTGGGGTAT GCTTCCTGTGCCATCTTTA 4831 60
HUNK_3UTR_FR_1 CAGCGGGGTTTGGGGTAT TTGAAATCAGCATCGCACAG 1033 60
HUNK_3UTR_FR_2 AGAGGGAAAAGATGATTGTGA GGAAGTACCCCTGCTCTCA 1339 57
HUNK_3UTR_FR_3 CTTGCTGGAACCCCTGATG CTTGTTTCCAGTCAGATGCTA 996 56
HUNK_3UTR_FR_4 TTCCCTCACTACGACTGCT GACATCCCCCTCTGACCAT 1153 56
HUNK_3UTR_FR_5 CTCCCTCAAAGAACACAGA GCTTCCTGTGCCATCTTTA 934 58
Table 1: Primer pairs used for HUNK 3'UTR amplification
PCR products were cloned into pcDNA3.1/V5-His TOPO TA expression vector
(Invitrogen). Particularly, 4 µL of PCR product was mixed with 1 µL of vector
and 1 µL of salt solution (1.2 M NaCl, 0.06 M MgCl2) and incubated at room
temperature for 20 min. Subsequently, cloning reaction mix was used to
transform 50 µL chemically competent E. coli DH5α. Cells were incubated 30
min in ice and then heat-shocked 1 min at 42°C. After a 1 hour incubation in
SOC medium (2% tryptone, 0.5% yeast extract, 10 mM NaCl, 2.5 mM KCl, 10
mM MgCl2, 10 mM MgSO4, and 20 mM glucose) at 37°C in a shaking incubator
(200 rpm), two different volumes (100 and 200 µL) of cells were spread on
selective LB agar (1% tryptone, 0.5% yeast extract, 1% NaCl, 1.5% agar) plates
containing 100 µg/mL ampicillin and incubated at 37°C overnight. The following
day, 10 colonies were picked and cultured in 5 mL LB medium (1% tryptone,
0.5% yeast extract, 1% NaCl) containing 100 µg/mL ampicillin overnight.
Plasmid DNA was isolated from bacterial cells with the ISOLATE II Plasmid Mini
Kit (Bioline), according to manufacturers’ instructions. Isolated plasmids were
digested with KpnI restriction enzyme to analyse insert presence and
orientation. Plasmids with the correct insert were sequenced.

Methods
25
5.3 Cell culture and transfection Human Embryonic Kidney 293 (HEK293) cell line was cultured in Dulbecco’s
modified Eagle’s medium (DMEM, Gibco) supplemented with 10% fetal bovine
serum (FBS, Gibco), 2 mmol/L glutamine (Gibco), 100 units/mL penicillin
(Gibco), and 100 units/mL streptomycin (Gibco) for 4-5 passages after thawing.
Cultures were maintained in a humidified atmosphere and 5% CO2 at 37°C.
Cells were dissociated using Trypsin-EDTA (0.05%), phenol red (Gibco) and
seeded in six-wells plates at 5.0x10⁵ cells/well in 2 mL of complete medium 18h
before transfection to ensure 70-90% confluence on the day of transfection.
Plasmid transient transfection was performed with Lipofectamine 3000 Reagent
(Invitrogen), using a 1:3 DNA:lipid ratio, according to manufacturer’s
instructions. Particularly, 2 µg of plasmid and 6 µL of Lipofectamine 3000 were
each diluted in 125 µL Opti-MEM Reduced-Serum Medium (Gibco). 5 µL P3000
Reagent was added to diluted DNA. Then DNA mix was added to diluted
Lipofectamine 3000 and incubated at room temperature for 5 minutes in order
to allow DNA-lipid complex formation. Subsequently, 250 µL of the DNA-lipid
complex was added dropwise to cells in serum- and antibiotic-free medium. The
same quantity of empty pcDNA3.1 V5/His TOPO plasmid with the same lipid-to-
DNA ratio was used as the control. Cells were incubated at 37°C in a humidified
atmosphere with 5% CO2. 6 hours after transfection, transfection mixture was
replaced with complete medium. Transfected cells were harvested 24, 32 and
48 hours after transfection.
5.4 RNA extraction and Reverse Transcription Total RNA was isolated from HEK293 cells using mirVana miRNA Isolation kit
(Ambion), according to manufacturer’s instructions. This kit combines the
advantages of organic extraction and solid-phase extraction to isolate RNA
avoiding the loss of small RNAs. The sample is first lysed in a denaturing lysis
solution, which stabilizes RNA and inactivates RNases. The lysate is then
extracted with Acid-Phenol:Chloroform, which removes most of the other
cellular components, leaving a semi-pure RNA sample. This is further purified

Methods
26
over a glass-fiber filter specifically formulated for miRNA retention and finally
the RNA is eluted with a low ionic-strength solution.
RNA integrity and concentration were evaluated by gel electrophoresis and
spectrophotometry (NanoDrop Technologies).
For mRNA analysis, reverse transcription was performed on total isolated RNA
with SUPERSCRIPT II Reverse Transcriptase (Invitrogen). Reaction mix of 1 µg
RNA, 1 µL Oligo(dT)12-18 (500 µg/mL) and 1 µL dNTP mix (10 mM each) in a
final volume of 12 µL was heated at 65°C for 5 min and then chilled on ice.
Subsequently, 4 µL 5X First-Strand Buffer, 2 µL DTT (0.1 M) and 1 µL RNase
OUT (40 units/µL) were added to the reaction mix and incubated at 42°C for 2
min. After the addition of 1 µL of SuperScript II RT enzyme, the reaction mix
was incubated at 42°C for 50 min and then the enzyme was inactivated heating
the mixture at 70°C for 15 min.
For miRNA analysis, reverse transcription was performed on total isolated RNA
with the miSCRIPT II RT Kit (Qiagen). Reverse-transcription master mix was
prepared with 4 µL 5X miScript HiSpec Buffer, 2 µL 10X miScript Nucleics Mix,
2 µL miScript Reverse Transcriptase Mix and 1 µg of total RNA in a final volume
of 20 µl. Samples were incubated at 37°C for 60 min and then at 95°C for 5 min
to inactivate the Reverse Transcriptase Mix.
5.5 Quantitative Real-Time PCR All quantitative Real-Time PCRs were performed on the CFX Connect Real-
Time PCR Detection System (Bio-Rad). For mRNA quantification, 10 µL final
volume reaction mix was prepared using 1 µL cDNA from 1/5th of RT reaction
with 5 µL iTaq Universal SYBR Green Supermix (Bio-Rad) and 0.4 µL of each
primer (10 µM). After an initial polymerase activation step at 95°C for 2 min, 40
2-steps cycles of amplification were run at 95°C for 5 sec and 60°C for 30 sec.
Melt-curve analysis was performed from 65°C to 95°C with a 0.5°C increment
and 5 sec/step to verify PCR product specificity. The housekeeping GAPDH
and HPRT genes were used as reference genes for data normalization and

Methods
27
relative gene expression was measured with the 2-ΔΔCt method, comparing the
Ct values of the samples of interest with the control.
Mature miRNA quantification was performed using miSCRIPT SYBR Green
PCR Kit with miSCRIPT Primer Assay (Qiagen). Reaction mix was prepared
with 12.5 µL 2X QuantiTect SYBR Green PCR Master Mix, 2.5 µL 10X miScript
Universal Primer, 2.5 µL miRNA-specific 10X miScript Primer Assay and 1 µL
cDNA from 1/10th of RT reaction in 25 µL final volume. After an initial activation
step at 95°C for 15 min, 40 cycles of amplification were run at 94°C for 15 sec,
55°C for 30 sec and 70°C for 30 sec. Dissociation curve analysis was
performed from 65°C to 95°C with a 0.5°C increment and 5 sec/step to assess
the specificity of the reaction. Relative quantification was performed using the
Ct comparison method, after data normalization with miScript PCR Controls for
RNU6B snRNA and SNORD61 snoRNA.
Gene specific primers used for quantitative Real-Time amplification of mRNAs
and miRNAs are listed in Table 2 and Table 3.
Gene Forward Reverse Size (bp)
BCL2 GCCCCTGGTGGACAACATC TCAGAGACAGCCAGGAGAAAT 152
CLIC5 ACCCGCCCTTCCTGACCTT TGCTGCTTGGTATTTTTGATG 184
EPHA5 GGACCTGGGATGGATTGCTT TGGTTTTCCTTGATGTTTCTCC 297
ERBB4 GAGATAACCAGCATTGAGCAC AGTTTTGTCCCACGAATAATGC 140
HIPK2 GGAAGAGTAAGCAGCACCAG GTTCTCCTTGACACGCTTGG 107
HUNK CAGGCTCGCTTATGACACAG GGTGGCACGGGGATGAACT 172
MECP2 GATCAATCCCCAGGGAAAAGC CCTCTCCCAGTTACCGTGAAG 117
ONECUT2 CCGCAGGATGTGGAAGTGG CGGGCGTTTGTTCTCCTTGA 190
WNT5A CGCCCAGGTTGTAATTGAAG GCATGTGGTCCTGATACAAGT 164
GAPDH GCCTCCTGCACCACCAACT CCATCACGCCACAGTTTCC 149
HPRT TGGCGTCGTGATTAGTGATG CCCATCTCCTTCATCACATC 156
Table 2: Primer pairs used for mRNA expression quantification by Real-Time PCR

Methods
28
miRNA Forward specific primer
miR-17 Hs_miR-17_2
miR-20a Hs_miR-20a_1
miR-20b Hs_miR-20b_1
miR-128 Hs_miR-128_1
miR-200c Hs_miR-200c_1
miR-205 Hs_miR-205_1
RNU 6 Hs_RNU6-2_11
SNORD 61 Hs_SNORD61_11
Table 3: miRNA specific primers used in quantitative Real-Time PCR
Results
29
6 Results
6.1 Gene expression during human embryogenesis Embryogenesis is the process of cell division and differentiation that occurs
during the early stages of embryo development, when most organs began to
form. Mammalian development requires the specification of over 200 unique
cell types from a single totipotent cell (Boyer et al., 2005). Human
embryogenesis covers the first eight weeks following fertilization and is
governed by a precise genetic program. During early and late embryo
development, a large number of molecules participate in embryo patterning and
organization in a spatial and temporal manner to ensure the adequate formation
of an organism. Transcription factors and small RNAs play a crucial role in
several developmental processes (Pauli et al., 2011). Moreover, epigenetics
changes, including histone modification, DNA methylation, and chromatin
condensation, regulate specific genes during embryonic development, dictating
cell fate decisions (Barber and Rastegar, 2010).
In this complex scenario, it is essential to understand how the global gene
expression deregulation, due to the presence of an extra copy of chromosome
21, may contribute to the multisystemic nature of DS phenotypes during
embryogenesis.
Since human embryos are difficult to access for research, publicly available
expression datasets were downloaded and re-analysed in this PhD project to
identify the genes expressed during human embryogenesis. Particularly, a
Chinese research group investigated gene expression during the early stages
of human development. They performed two independent genome-wide
microarray studies to evaluate expression of both mRNAs and miRNAs in
human embryos (Lin et al., 2013; Yi et al., 2010). Since miRNA expression data
were available for weeks 4-6, expression data for mRNA were filtered out to
remove weeks with no corresponded miRNA expression data (weeks 7-9).
Results
30
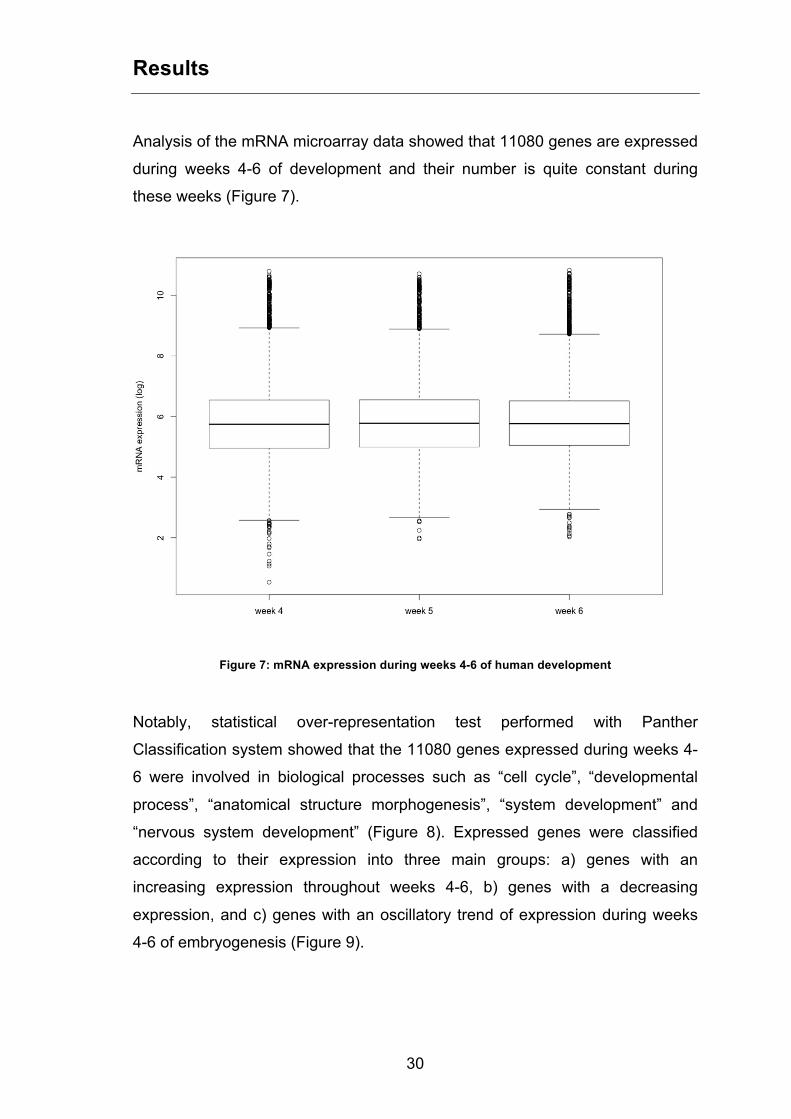
Analysis of the mRNA microarray data showed that 11080 genes are expressed
during weeks 4-6 of development and their number is quite constant during
these weeks (Figure 7).
Figure 7: mRNA expression during weeks 4-6 of human development
Notably, statistical over-representation test performed with Panther
Classification system showed that the 11080 genes expressed during weeks 4-
6 were involved in biological processes such as “cell cycle”, “developmental
process”, “anatomical structure morphogenesis”, “system development” and
“nervous system development” (Figure 8). Expressed genes were classified
according to their expression into three main groups: a) genes with an
increasing expression throughout weeks 4-6, b) genes with a decreasing
expression, and c) genes with an oscillatory trend of expression during weeks
4-6 of embryogenesis (Figure 9).

Results
31
Figure 8: Statistical over-representation test of 11080 expressed genes during weeks 4-6 of
development, according to Panther GO-Slim Biological Process
Figure 9: Top 15 mRNAs expression levels during weeks 4-6 of human development
20000
25000
30000
35000
40000
45000
50000
week 4 week 5 week 6
Sign
al in
tens
ity
Weeks of development
RPS3A RPL41 TUBA1A ATP13A5 RPL23A HBE1 RPL9 RPL39 ACTB HBG1 HBG2 RPS20 RPS2 RPS11 HBA2

Results
32
Analysis of miRNA datasets revealed that 134 out of 835 miRNAs are
expressed during weeks 4-6 (Figure 10). These data showed that most of
miRNAs (about 84%) are not expressed in these weeks in which organogenesis
occurs. Similarly to the mRNAs, we could classify expressed miRNAs into three
categories: a) miRNAs with an increasing or b) decreasing expression
throughout weeks 4-6 and c) miRNAs with an oscillatory trend of expression
(Figure 11).
Figure 10: miRNA expression during weeks 4-6 of human development

Results
33
Figure 11: Top 15 miRNAs expression levels during weeks 4-6 of human development
6.2 Identification of miRNA-mRNA regulatory network Expression data for mRNA and miRNA were used to predict miRNA-mRNA
interactions to define a regulatory network during early human development.
Since miRNAs act as negative regulators of mRNAs, we were particularly
interested in specific miRNAs with anti-correlation with the expression of its
target mRNA. Thus, mRNA and miRNA expression data, following logarithmic
transformations, underwent pairwise Pearson’s linear correlation analysis, in
order to compile a 2D correlation matrix for all possible combinations of miRNA
and mRNA expression (134 columns and 11080 rows). Pearson’s correlation
coefficient is a degree of linear dependence between two variable and ranges
from -1 to 1, where 1 indicates total positive correlation, 0 indicates the absence
of correlation and -1 indicates a total negative correlation. Distribution of
miRNA-mRNA correlation coefficients was represented by a bimodal curve with
two distinct peaks (local maxima) at the extreme end of correlation values,
indicating that we found a very high percentage of positive/negative miRNA-
gene associations in our analysis (Figure 12).
0
2000
4000
6000
8000
10000
12000
14000
week 4 week 5 week 6
Sign
al in
tens
ity
Weeks of development
hsa-miR-92a hsa-miR-122 hsa-miR-26a hsa-miR-638 hsa-miR-92b hsa-miR-17 hsa-miR-106a hsa-miR-320a hsa-miR-20a hsa-miR-214 hsa-miR-25 hsa-miR-10b hsa-miR-320c hsa-miR-20b hsa-miR-320b

Results
34
Figure 12: Correlation distribution curve before (green) and after (red) integration of prediction of
miRNA-mRNA interactions
However, these positive/negative correlations did not imply direct miRNA-
mRNA interactions. Indeed, it is known that miRNA-mRNA interactions are
guided by sequence complementarity of the 5’ end of the miRNA, called the
seed region, with the 3’UTR of target mRNA. MicroRNA-mRNA expression
correlation matrix was integrated with data from the computational seed
prediction in mRNA 3’UTR sequences of all expressed genes. Therefore,
3’UTR sequences of 11080 genes expressed during weeks 4-6 of human
development were downloaded from UCSC Table Browser (Karolchik et al.,
2004). MiRNA responsive elements in these sequences were predicted using
TargetScan 6.0 algorithm implemented in Perl. Target prediction data was
filtered out to remove miRNAs not expressed in weeks 4-6 of human
embryogenesis. Then, a binary matrix with 11080 rows and 134 columns was
compiled according to MREs prediction, where 0 and 1 indicate absence and
presence of interaction, respectively. Such target prediction information was

Results
35
integrated with the expression correlation information using element-by-element
product of the two matrices. In this way, an integrated association matrix was
compiled, where any association - positive or negative - that was in conflict with
predicted target site information was removed. Distribution of filtered miRNA-
mRNA correlation coefficients was represented by a bimodal curve with two
distinct peaks at the extreme end of correlation values lower than the peaks of
the correlation coefficient distribution before filtering, indicating that most of
miRNA-mRNA pairs showed no more correlation (Figure 12).
Subsequently, the analysis focused on the identification of a potential network
of miRNA-mRNA interactions. In order to address this issue, a biclustering
approach on the integrated association matrix was adopted. Biclustering allows
simultaneously clustering rows and columns of a matrix, grouping a subset of
rows that exhibit similar behaviour across a subset of columns, or vice versa. In
this case, biclustering was used to find a subset of mRNAs whit anti-correlation
to miRNAs, outlining a group of genes that can potentially compete for binding
to specific miRNAs. For this analysis was used the Plaid model biclustering
which is more flexible and allows a gene to be in more than one cluster, or in
none at all. The biclustering algorithm was iterated 100 times and extracted
biclusters were evaluated in order to find the one with the maximum number of
genes and miRNAs with an opposing correlation. Such analysis revealed a
bicluster of 210 genes and 29 miRNAs with anti-correlation, indicating a
potential miRNA-mRNA regulatory network during early human embryogenesis
(Figure 13 and Figure 14).

Results
36
Figure 13: Bubbleplot representing biclustering results

Results
37
Figure 14: Heatmap of the extracted bicluster
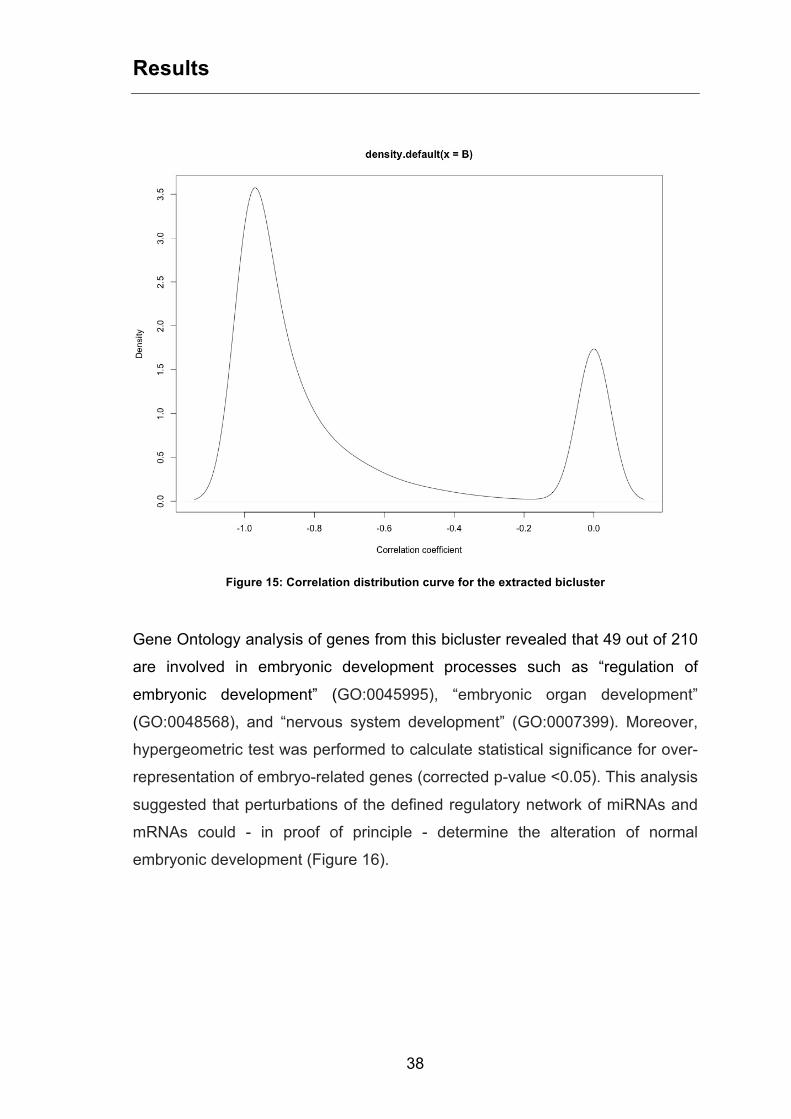
The analysis of distribution of miRNA-mRNA correlation coefficients for such
bicluster showed a strong anti-correlation, as indicated by the bimodal curve
with a highest peak centred near -1 value (Figure 15).
Results
38
Figure 15: Correlation distribution curve for the extracted bicluster
Gene Ontology analysis of genes from this bicluster revealed that 49 out of 210
are involved in embryonic development processes such as “regulation of
embryonic development” (GO:0045995), “embryonic organ development”
(GO:0048568), and “nervous system development” (GO:0007399). Moreover,
hypergeometric test was performed to calculate statistical significance for over-
representation of embryo-related genes (corrected p-value <0.05). This analysis
suggested that perturbations of the defined regulatory network of miRNAs and
mRNAs could - in proof of principle - determine the alteration of normal
embryonic development (Figure 16).
Results
39
Figure 16: Biological processes over-representation of 210 genes of the selected bicluster
6.3 Perturbation of miRNA-mRNA regulatory network during DS embryogenesis
Starting from the hypothesis that during embryogenesis in DS embryos, HSA21
genes may perturb the physiological miRNA-mRNA regulatory network, acting
as sponges to sequester miRNAs, we found six HSA21 genes (ADAMTS5,
AGPAT3, BACE2, ERG, HUNK, SLC5A3) in the selected miRNA-mRNA
bicluster. However, as not all HSA21 genes are overexpressed in trisomic
cells/tissue, we analyzed gene expression data in early DS embryo
development. To this aim, RNA-Sequencing (RNA-Seq) datasets from 5 normal
and 4 DS chorionic villi samples (Jin et al., 2013) were downloaded from GEO
(accession number GSE42144) and analyzed, as described in the Methods
Section.
Raw reads in SRA format were first converted into FASTQ, and then it was
evaluated the quality through FASTQC software. Per base and per sequence
quality graphs showed a good quality of reads (Figure 17 and Figure 18).

Results
40
Figure 17: Per base read quality
Figure 18: Per sequence read quality

Results
41
Subsequently, RNA-Seq reads were mapped against the human reference
genome hg19 using TopHat software. Quantification of gene expression levels
by reads' counting and RPKM normalization were performed using RNASeqGUI
package in R language (Russo and Angelini, 2014). RPKM counts distribution
was analysed to assess samples variability (Figure 19).
Figure 19: Box plot of RPKM counts distribution
Similarities and differences among samples were highlighted performing a PCA
(Principal Component Analysis). This analysis showed that euploid and DS
samples were different enough to be considered two distinct groups, with the
exception of sample EU2, which was discarded from further analyses (Figure
20).

Results
42
Figure 20: PCA plot of euploid and DS samples before (upper) and after (lower) removing EU2
sample (red arrow).
Results
43
Applying an arbitrary threshold of 1 RPKM, 14705 coding genes were detected
as expressed in chorionic villi, 14044 of which were expressed in both
conditions, 355 only in DS and 306 only in euploid samples. Differential
expression analysis showed that 1221 genes were up-regulated in Down
syndrome with 25 up-regulated HSA21 genes. Two out of six HSA21 genes -
i.e. HUNK and BACE2 - are overexpressed in DS embryos and belong to the
previously described bicluster of miRNA-mRNAs. Such network consists of 210
potential ceRNAs and 29 miRNAs; however, not every mRNA is necessarily
targeted by every miRNA. Indeed, ceRNA cross-regulation increases with the
number of shared miRNAs and is weakened when a ceRNA pair is targeted by
too many non-shared miRNAs. Thus, the number of MREs and the anti-
correlation values of HUNK and BACE2 genes with the miRNAs included in the
selected bicluster were analysed. HUNK and BACE2 genes were both
predicted to interact with 19 out of 29 miRNAs contained in this bicluster.
However, HUNK gene showed more negative anti-correlation values, and
therefore it was selected for further in vitro studies.
6.4 The role of HUNK as a ceRNA HUNK (hormonally up-regulated Neu-associated kinase) gene spans 171318
bp on the forward strand of human chromosome 21q22 and consists of 11
exons. HUNK is a sucrose non-fermenting 1 (Snf-1)/AMPK family of
serine/threonine protein kinases member, that was first identified in the murine
mammary gland (Gardner et al., 2000). AMPK family regulates cellular
metabolism, stress responses and several processes relevant to tumorigenesis,
including proliferation, differentiation, survival, and migration (Yeh et al., 2011).
Consistently, Hunk is overexpressed in several human cancers and is involved
in the onset and the metastasis of specific human mammary tumors (Yeh et al.,
2013). In situ hybridization showed that Hunk expression is developmentally
regulated and tissue-specific in fetal mice and restricted to subsets of cells in
the adult mouse (Gardner et al., 2000). Despite these findings suggest a role for
Hunk in murine development, Hunk deletion in mice did not alter viability,

Results
44
fertility, longevity, revealing HUNK is dispensable for normal development
(Wertheim et al., 2009).
The ability of HUNK to act as ceRNA during human embryogenesis was
investigated in the course of this project overexpressing HUNK 3’UTR in
HEK293 cell model. HEK293 cells were used since these cells are very easy to
grow in culture and transfect very readily. Moreover, gene expression data from
RNA-Seq experiments performed in our laboratory and from The Human
Protein Atlas database indicated that HEK293 share 80% genes with embryonic
samples.
The 3’UTR is transcribed, but it is not translated into protein; however it can
exert a regulatory function on gene expression through miRNA binding. HUNK
3’UTR (4880 bp) was amplified by RT-PCR, cloned into expression plasmid
pcDNA3.1 V5/His TOPO, and used to transfect HEK293 cell line. Empty
pcDNA3.1 V5/His TOPO vector was used as control. According to the results of
our computational analysis of the regulatory network, and in line with the
ceRNA mechanism, HUNK 3’UTR overexpression should perturb the
distribution of miRNAs on their targets, acting as a decoy for specific miRNAs.
Consequently, as miRNAs are able to repress specific mRNAs, altering the
expression level of a single ceRNA may have significant effect on other
ceRNAs with shared MREs. Thus, we evaluated the expression of genes
belonging to the ceRNA network 24, 30 and 48 hours after HUNK 3’UTR
transfection by quantitative Real-Time PCR. First, endogenous HUNK gene
expression was evaluated with specific primer pairs in the coding exons 10 and
11. Results showed that overexpression of HUNK 3’UTR de-repressed HUNK
transcript itself, inducing an overexpression of its endogenous transcript.
Particularly, HUNK expression increased with increasing time after transfection
(Figure 21).

Results
45
Figure 21: HUNK expression 24, 30, 48 hours after HUNK 3'UTR transfection
Then, the potential role of HUNK gene overexpression in the perturbation of
embryogenesis in DS was further investigated. First, genes included in the
selected bicluster were analysed in order to identify candidate genes involved in
human embryogenesis. As previously cited, 49 out of 210 genes of the selected
bicluster resulted to play a role in human embryogenesis, according to gene
ontology (GO:0048568, GO:0045995, GO:0007399). Then, a comparative
analysis with the genes differentially expressed in DS embryos was performed
to assess whether some of these 49 embryo-related genes were up-regulated
during DS embryogenesis. Hence, 8 embryo-related genes (BCL2, CLIC5,
EPHA5, ERBB4, HIPK2, MECP2, ONECUT2, and WNT5A), included in the
bicluster - and up-regulated in DS embryos - were selected, and their
expression was evaluated in HUNK 3’UTR transfected samples (Figure 22).
0
0.5
1
1.5
2
2.5
3
3.5
24h 30h 48h
Rel
ativ
e no
rmal
ized
ex
pres
sion

Results
46
Figure 22: Gene expression after HUNK 3'UTR transfection
Overexpression of HUNK 3’UTR determined an increase of BCL2, CLIC5,
EPHA5, ERBB4, HIPK2, MECP2, ONECUT2, and WNT5A genes expression
levels, confirming the computational analysis used to define the miRNA/mRNA
network.
Since HUNK 3’UTR may act as decoy for the miRNAs belonging to this ceRNA
network, the expression of 6 selected miRNAs (miR-17, miR-20a, miR-20b,
miR-128, miR-200c, and miR-205) was investigated. To this end, quantitative
Real-Time PCR was performed in transfected cells 24 and 30 hours after
transfection (Figure 23).

Results
47
Figure 23: miRNA expression in HEK293 cells 24 and 30 hours after HUNK 3'UTR transfection
Notably, in line with our hypothesis, all miRNAs but miR-205 showed a
decrease of expression, suggesting they are sequestered by the 3’UTR of
HUNK gene.
Then, to test whether the ceRNA effect of HUNK gene was due to a specific
region of its 3’UTR, and in turn to specific MREs, HUNK 3’UTR was divided into
5 overlapping fragments. Each fragment was amplified, cloned into pcDNA3.1
V5/HIS TOPO vector and used to transfect HEK293 cells. Expression levels of
BCL2, CLIC5, HIPK2, MECP2, ONECUT2, and WNT5A genes was analysed by
quantitative Real-Time PCR (Figure 24).

Results
48
Figure 24: Expression analysis of selected genes 24h after transfection of partial HUNK 3'UTR
fragments
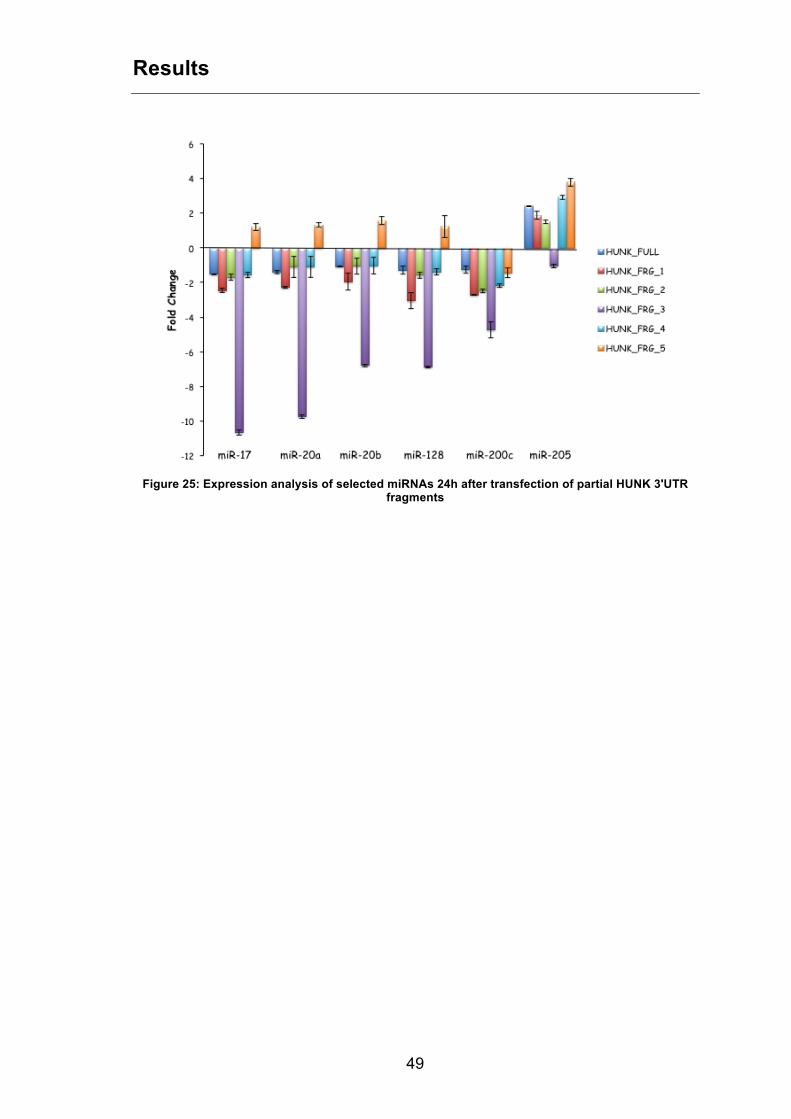
Moreover, the expression of the six selected miRNAs was analysed through
quantitative Real-Time PCR in cells transfected with partial HUNK 3’UTR
fragments (Figure 25).
Results
49
Figure 25: Expression analysis of selected miRNAs 24h after transfection of partial HUNK 3'UTR
fragments

Discussion
50
7 Discussion
Down syndrome (DS) is the most frequent human aneuploidy, caused by an
extra copy of all or part of human chromosome 21 (HSA21). DS is a complex
genetic condition characterized by over 80 clinically different phenotypes of
variable penetrance and expressivity. Individuals with DS show alterations -
both structural and functional - affecting distinct organs and systems,
suggesting a crucial role of Trisomy 21 in determining alterations of
developmental processes. Thus, overexpression of individual genes cannot be
considered independently when one considers phenotype–genotype
correlations. Indeed, global gene deregulation suggests a more complex
mechanism of gene expression regulation, which involves direct and/or indirect
interactions among HSA21 gene products and genes located on the other
chromosomes.
This PhD project investigated the potential role of HSA21 genes - that are
overexpressed in DS embryos - as competing endogenous RNA (ceRNA)
during embryogenesis in foetuses with trisomy 21. The hypothesis is that these
genes may act as miRNA "sponges", perturbing the expression of non-HSA21
mRNAs involved in the organogenesis. The supernumerary copies of HSA21
mRNAs would - in principle - disrupt the physiological mRNAs/miRNAs balance
in DS embryos, thus affecting the miRNA-mediated gene silencing network that
physiologically occurs during embryonic development.
Using bioinformatics approaches and in vitro experimental validation, a potential
regulatory network between miRNA and mRNA has been defined during the
early stages of human development. It has been demonstrated that some
HSA21 genes can crosstalk with other mRNAs through a competition for
common miRNAs. Particularly, the results demonstrate that the 3’UTR of HUNK
gene acts as decoy for miR-17, miR-20a, miR-20b, miR-128, and miR-200c.
This "sponge" effect determines an increase of BCL2, CLIC5, EPHA5, ERBB4,
HIPK2, MECP2, ONECUT2, and WNT5A expression levels.
Discussion
51
Interestingly, MECP2 is essential for embryonic development. Its
overexpression in mouse embryos leads to motor coordination deficit,
impairment in learning and memory, hypotonia, severe mental retardation,
recurrent infections. MECP2 encodes for methyl-CpG-binding protein 2
(MeCP2), which binds specifically to methylated DNA and is able to repress
transcription from methylated gene promoters. WNT5A (Wingless-Type MMTV
Integration Site Family, Member 5A) gene is implicated in several
developmental processes, including regulation of cell fate and patterning during
embryogenesis. Its overexpression leads to severe outgrowth defects, including
gastrointestinal, limbs, facial structures defects, and mental impairment.
MECP2 and WNT5A overexpression in foetuses with DS are in agreement with
the potential defects occurring during embryogenesis in DS. The results
described in this project show that the multisystem alterations of Down
syndrome may be caused, at least partly, by a competition between HSA21 and
non-HSA21 transcripts for the same miRNAs. Such event is likely to occur in
early stages of the embryonic development. These findings shed new light on
HSA21 genes. Indeed, if data will be supported by further experimental
evidences (e.g. cellular models of differentiation or animal models), it will confer
a previously unrecognised role - encrypted in the mRNA itself and not linked to
the protein-coding potential - to HSA21 genes in Down syndrome. This project
has highlighted for the first time the existence of a crosstalk among mRNAs
during human embryogenesis, demonstrating that HSA21 genes - that are
overexpressed in DS embryos - and some developmentally relevant mRNAs
"talk to each other using microRNA response elements, as letters of a new
language". Concernedly, beyond their functioning as cis regulatory elements,
UTRs can act as trans modulator of gene expression through miRNA binding,
allowing RNA to communicate each other through the letters of the “ceRNA
language”.
This new regulatory layer, based on mRNA-miRNA interaction network,
provides new perspectives to the study of human embryogenesis regulation and
to the deregulation of key mechanisms of pathogenesis. Furthermore, it might

Discussion
52
account for a portion of missing genetic and epigenetic variability in the etiology
of diseases, particularly of DS. Thus, a novel dimension in gene regulation,
based on cellular mRNAs and miRNAs homeostasis, is proposed herein. The
disruption of this balance - caused for instance by HSA21 gene triplication -
would affect crosstalk among ceRNAs, promoting genetic syndromes (like DS)
due to aneuploidy or other similar genetic conditions linked to large
chromosomal rearrangements.
However, it remains to be established whether other HSA21 genes besides
HUNK may exert a similar role of ceRNA during embryogenesis. In addition,
animal model studies of embryogenesis and DS will be needed to clarify the
regulatory network of miRNA-mRNA interactions during human development
and the effect of perturbations of such network on phenotype manifestations.

References
53
8 References
Antonarakis, S.E., and Epstein, C.J. (2006). The challenge of Down syndrome. Trends Mol. Med. 12.
Barber, B.A., and Rastegar, M. (2010). Epigenetic control of Hox genes during neurogenesis, development, and disease. Ann. Anat. 192, 261–274.
Barlow, G.M., Chen, X.N., Shi, Z.Y., Lyons, G.E., Kurnit, D.M., Celle, L., Spinner, N.B., Zackai, E., Pettenati, M.J., Van Riper, a J., et al. (2001). Down syndrome congenital heart disease: a narrowed region and a candidate gene. Genet. Med. 3, 91–101.
Bartel, D.P. (2004). MicroRNAs: Genomics, Biogenesis, Mechanism, and Function. Cell 116, 281–297.
Baxter, L.L., Moran, T.H., Richtsmeier, J.T., Troncoso, J., and Reeves, R.H. (2000). Discovery and genetic localization of Down syndrome cerebellar phenotypes using the Ts65Dn mouse. Hum. Mol. Genet. 9, 195–202.
Boyer, L.A., Lee, T.I., Cole, M.F., Johnstone, S.E., Levine, S.S., Zucker, J.P., Guenther, M.G., Kumar, R.M., Murray, H.L., Jenner, R.G., et al. (2005). Core transcriptional regulatory circuitry in human embryonic stem cells. Cell 122, 947–956.
Bushati, N., and Cohen, S.M. (2007). microRNA functions. Annu. Rev. Cell Dev. Biol. 23, 175–205.
Chakrabarti, L., Galdzicki, Z., and Haydar, T.F. (2007). Defects in embryonic neurogenesis and initial synapse formation in the forebrain of the Ts65Dn mouse model of Down syndrome. J. Neurosci. 27, 11483–11495.
Costa, V., Sommese, L., Casamassimi, A., Colicchio, R., Angelini, C., Marchesano, V., Milone, L., Farzati, B., Giovane, A., Fiorito, C., et al. (2010). Impairment of circulating endothelial progenitors in Down syndrome. BMC Med. Genomics 3, 40.
Costa, V., Angelini, C., D’Apice, L., Mutarelli, M., Casamassimi, A., Sommese, L., Gallo, M.A., Aprile, M., Esposito, R., Leone, L., et al. (2011). Massive-scale rna-seq analysis of non ribosomal transcriptome in human trisomy 21. PLoS One 6, e18493.
Dierssen, M. (2012). Down syndrome: the brain in trisomic mode. Nat. Rev. Neurosci. 13, 844–858.
Diller, G.-P., van Eijl, S., Okonko, D.O., Howard, L.S., Ali, O., Thum, T., Wort, S.J., Bédard, E., Gibbs, J.S.R., Bauersachs, J., et al. (2008). Circulating endothelial progenitor cells in patients with Eisenmenger syndrome and idiopathic pulmonary arterial hypertension. Circulation 117, 3020–3030.
Down, J.L. (1995). Observations on an ethnic classification of idiots. 1866. Ment. Retard. 33, 54–56.
Eddy, S.R. (2001). Non-coding RNA and the modern RNA world. Nat. Rev. Genet. 2, 919–929.

References
54
Esposito, G., Imitola, J., Lu, J., De Filippis, D., Scuderi, C., Ganesh, V.S., Folkerth, R., Hecht, J., Shin, S., Iuvone, T., et al. (2008). Genomic and functional profiling of human Down syndrome neural progenitors implicates S100B and aquaporin 4 in cell injury. Hum. Mol. Genet. 17, 440–457.
Fabian, M.R., and Sonenberg, N. (2012). The mechanics of miRNA-mediated gene silencing: a look under the hood of miRISC. Nat. Struct. Mol. Biol. 19, 586–593.
Fan, M., Li, X., Jiang, W., Huang, Y., Li, J., and Wang, Z. (2013). A long non-coding RNA, PTCSC3, as a tumor suppressor and a target of miRNAs in thyroid cancer cells. Exp. Ther. Med. 5, 1143–1146.
FitzPatrick, D.R., Ramsay, J., McGill, N.I., Shade, M., Carothers, A.D., and Hastie, N.D. (2002). Transcriptome analysis of human autosomal trisomy. Hum. Mol. Genet. 11, 3249–3256.
Gardiner, K. (2003). Predicting pathway perturbations in Down syndrome. J. Neural Transm. Suppl. 21–37.
Gardiner, K. (2006). Transcriptional dysregulation in Down syndrome: Predictions for altered protein complex stoichiometries and post-translational modifications, and consequences for learning/behavior genes ELK, CREB, and the estrogen and glucocorticoid receptors. Behav. Genet. 36, 439–453.
Gardner, H.P., Wertheim, G.B., Ha, S.I., Copeland, N.G., Gilbert, D.J., Jenkins, N.A., Marquis, S.T., and Chodosh, L.A. (2000). Cloning and characterization of Hunk, a novel mammalian SNF1-related protein kinase. Genomics 63, 46–59.
Gu, S., and Kay, M. a (2010). How do miRNAs mediate translational repression? Silence 1, 11.
Ha, M., and Kim, V.N. (2014). Regulation of microRNA biogenesis. Nat. Rev. Mol. Cell Biol. 15, 509–524.
Han, J., Lee, Y., Yeom, K.H., Nam, J.W., Heo, I., Rhee, J.K., Sohn, S.Y., Cho, Y., Zhang, B.T., and Kim, V.N. (2006). Molecular Basis for the Recognition of Primary microRNAs by the Drosha-DGCR8 Complex. Cell 125, 887–901.
Hattori, M., Fujiyama, A., Taylor, T.D., Watanabe, H., Yada, T., Park, H.S., Toyoda, A., Ishii, K., Totoki, Y., Choi, D.K., et al. (2000). The DNA sequence of human chromosome 21. Nature 405, 311–319.
Inada, T., and Makino, S. (2014). Novel roles of the multi-functional CCR4-NOT complex in post-transcriptional regulation. Front. Genet. 5, 1–7.
Jablonska, B., Ford, D., Trisler, D., and Pessac, B. (2006). The growth capacity of bone marrow CD34 positive cells in culture is drastically reduced in a murine model of Down syndrome. Comptes Rendus - Biol. 329, 726–732.
Jin, S., Lee, Y.K., Lim, Y.C., Zheng, Z., Lin, X.M., Ng, D.P.Y., Holbrook, J.D., Law, H.Y., Kwek, K.Y.C., Yeo, G.S.H., et al. (2013). Global DNA Hypermethylation in Down Syndrome Placenta. PLoS Genet. 9.

References
55
Kahlem, P., Sultan, M., Herwig, R., Steinfath, M., Balzereit, D., Eppens, B., Saran, N.G., Pletcher, M.T., South, S.T., Stetten, G., et al. (2004). Transcript level alterations reflect gene dosage effects across multiple tissues in a mouse model of down syndrome. Genome Res. 14, 1258–1267.
Karolchik, D., Hinrichs, A.S., Furey, T.S., Roskin, K.M., Sugnet, C.W., Haussler, D., and Kent, W.J. (2004). The UCSC Table Browser data retrieval tool. Nucleic Acids Res. 32, D493–D496.
Kim, E., Magen, A., and Ast, G. (2007). Different levels of alternative splicing among eukaryotes. Nucleic Acids Res. 35, 125–131.
Korenberg, J.R., Kawashima, H., Pulst, S.M., Ikeuchi, T., Ogasawara, N., Yamamoto, K., Schonberg, S.A., West, R., Allen, L., and Magenis, E. (1990). Molecular definition of a region of chromosome 21 that causes features of the Down syndrome phenotype. Am. J. Hum. Genet. 47, 236–246.
Kumar, M.S., Armenteros-Monterroso, E., East, P., Chakravorty, P., Matthews, N., Winslow, M.M., and Downward, J. (2014). HMGA2 functions as a competing endogenous RNA to promote lung cancer progression. Nature 505, 212–217.
Lana-elola, E., Watson-scales, S.D., Fisher, E.M.C., and Tybulewicz, V.L.J. (2011). Down syndrome : searching for the genetic culprits. Dis. Model. Mech. 595, 586–595.
Lazzeroni, L., and Owen, A. (2002). Plaid model for gene expression data. Stat. Sin. 12, 61–86.
Lee, R.C., Feinbaum, R.L., and Ambros, V. (1993). The C. elegans heterochronic gene lin-4 encodes small RNAs with antisense complementarity to lin-14. Cell 75, 843–854.
Lejeune, J., Gautier, M., and Turpin, R. (1959). A study of somatic chromosomes in nine infants with mongolism. C.R. Acad. Sci. 248, 1721–1722.
Li, C.-M., Guo, M., Salas, M., Schupf, N., Silverman, W., Zigman, W.B., Husain, S., Warburton, D., Thaker, H., and Tycko, B. (2006). Cell type-specific over-expression of chromosome 21 genes in fibroblasts and fetal hearts with trisomy 21. BMC Med. Genet. 7, 24.
Lin, Y., Zeng, Y., Zhang, F., Xue, L., Huang, Z., Li, W., and Guo, M. (2013). Characterization of microRNA expression profiles and the discovery of novel microRNAs involved in cancer during human embryonic development. PLoS One 8, e69230.
Lyle, R., Gehrig, C., Neergaard-Henrichsen, C., Deutsch, S., and Antonarakis, S.E. (2004). Gene expression from the aneuploid chromosome in a trisomy mouse model of down syndrome. Genome Res. 14, 1268–1274.
Lyle, R., Béna, F., Gagos, S., Gehrig, C., Lopez, G., Schinzel, A., Lespinasse, J., Bottani, A., Dahoun, S., Taine, L., et al. (2009). Genotype-phenotype correlations in Down syndrome identified by array CGH in 30 cases of partial trisomy and partial monosomy chromosome 21. Eur. J. Hum. Genet. 17, 454–466.
Macfarlane, L.-A., and Murphy, P.R. (2010). MicroRNA: Biogenesis, Function and Role in Cancer. Curr. Genomics 11, 537–561.

References
56
Mao, R., Zielke, C.L., Zielke, H.R., and Pevsner, J. (2003). Global up-regulation of chromosome 21 gene expression in the developing Down syndrome brain. Genomics 81, 457–467.
Mattick, J.S., and Makunin, I. V (2006). Non-coding RNA. Hum. Mol. Genet. 15 Spec No, R17–R29.
Motti, D., Bixby, J.L., and Lemmon, V.P. (2012). MicroRNAs and neuronal development. Semin. Fetal Neonatal Med. 17, 347–352.
O’Doherty, A., Ruf, S., Mulligan, C., Hildreth, V., Errington, M.L., Cooke, S., Sesay, A., Modino, S., Vanes, L., Hernandez, D., et al. (2005). An aneuploid mouse strain carrying human chromosome 21 with Down syndrome phenotypes. Science 309, 2033–2037.
Olson, L.E., Roper, R.J., Sengstaken, C.L., Peterson, E.A., Aquino, V., Galdzicki, Z., Siarey, R., Pletnikov, M., Moran, T.H., and Reeves, R.H. (2007). Trisomy for the Down syndrome “critical region” is necessary but not sufficient for brain phenotypes of trisomic mice. Hum. Mol. Genet. 16, 774–782.
Park, J., and Chung, K.C. (2013). New Perspectives of Dyrk1A Role in Neurogenesis and Neuropathologic Features of Down Syndrome. Exp. Neurobiol. 22, 244–248.
Patterson, D. (2007). Genetic mechanisms involved in the phenotype of Down syndrome. Ment. Retard. Dev. Disabil. 206, 199–206.
Patterson, D. (2009). Molecular genetic analysis of Down syndrome. Hum. Genet. 126, 195–214.
Pauli, A., Rinn, J.L., and Schier, A.F. (2011). Non-coding RNAs as regulators of embryogenesis. Nat. Rev. Genet. 12, 136–149.
Poliseno, L., Salmena, L., Zhang, J., Carver, B., Haveman, W.J., and Pandolfi, P.P. (2010). A coding-independent function of gene and pseudogene mRNAs regulates tumour biology. Nature 465, 1033–1038.
Reeves, R.H., Baxter, L.L., and Richtsmeier, J.T. (2001). Too much of a good thing : mechanisms of gene action in Down syndrome. Trends Genet. 17, 83–88.
Reinhart, B.J., Slack, F.J., Basson, M., Pasquinelli, A.E., Bettinger, J.C., Rougvie, A.E., Horvitz, H.R., and Ruvkun, G. (2000). The 21-nucleotide let-7 RNA regulates developmental timing in Caenorhabditis elegans. Nature 403, 901–906.
Richtsmeier, J.T., Zumwalt, A., Carlson, E.J., Epstein, C.J., and Reeves, R.H. (2002). Craniofacial phenotypes in segmentally trisomic mouse models for Down syndrome. Am. J. Med. Genet. 107, 317–324.
Russo, F., and Angelini, C. (2014). RNASeqGUI: a GUI for analysing RNA-Seq data. Bioinformatics 30, 2514–2516.
Ryeom, S., and Folkman, J. (2009). Role of endogenous angiogenesis inhibitors in Down syndrome. J. Craniofac. Surg. 20 Suppl 1, 595–596.

References
57
Salmena, L., Poliseno, L., Tay, Y., Kats, L., and Pandolfi, P.P. (2011). A ceRNA hypothesis: The rosetta stone of a hidden RNA language? Cell 146, 353–358.
Saran, N.G., Pletcher, M.T., Natale, J.E., Cheng, Y., and Reeves, R.H. (2003). Global disruption of the cerebellar transcriptome in a Down syndrome mouse model. Hum. Mol. Genet. 12, 2013–2019.
Sinet, P.M., Théophile, D., Rahmani, Z., Chettouh, Z., Blouin, J.L., Prieur, M., Noel, B., and Delabar, J.M. (1994). Mapping of the Down syndrome phenotype on chromosome 21 at the molecular level. Biomed. Pharmacother. 48, 247–252.
Singh, S.K., Pal Bhadra, M., Girschick, H.J., and Bhadra, U. (2008). MicroRNAs - Micro in size but macro in function. FEBS J. 275, 4929–4944.
Sommer, C.A., and Henrique-Silva, F. (2008). Trisomy 21 and Down syndrome: a short review. Braz. J. Biol. 68, 447–452.
Tay, Y., Kats, L., Salmena, L., Weiss, D., Tan, S.M., Ala, U., Karreth, F., Poliseno, L., Provero, P., Di Cunto, F., et al. (2011). Coding-independent regulation of the tumor suppressor PTEN by competing endogenous mRNAs. Cell 147, 344–357.
Tay, Y., Karreth, F. a, and Pandolfi, P.P. (2014). Aberrant ceRNA activity drives lung cancer. Cell Res. 24, 259–260.
Turner, H., Bailey, T., and Krzanowski, W. (2005). Improved biclustering of microarray data demonstrated through systematic performance tests. Comput. Stat. Data Anal. 48, 235–254.
Vilardell, M., Rasche, A., Thormann, A., Maschke-Dutz, E., Pérez-Jurado, L.A., Lehrach, H., and Herwig, R. (2011). Meta-analysis of heterogeneous Down Syndrome data reveals consistent genome-wide dosage effects related to neurological processes. BMC Genomics 12, 229.
Wertheim, G.B.W., Yang, T.W., Pan, T., Ramne, A., Liu, Z., Gardner, H.P., Dugan, K.D., Kristel, P., Kreike, B., van de Vijver, M.J., et al. (2009). The Snf1-related kinase, Hunk, is essential for mammary tumor metastasis. Proc. Natl. Acad. Sci. U. S. A. 106, 15855–15860.
Wiseman, F.K., Alford, K.A., Tybulewicz, V.L.J., and Fisher, E.M.C. (2009). Down syndrome — recent progress and future prospects. Hum. Mol. Genet. 18, 75–83.
Yeh, E.S., Yang, T.W., Jung, J.J., Gardner, H.P., Cardiff, R.D., and Chodosh, L.A. (2011). Hunk is required for HER2/neu-induced mammary tumorigenesis. J. Clin. Invest. 121, 866–879.
Yeh, E.S., Belka, G.K., Vernon, A.E., Chen, C.-C., Jung, J.J., and Chodosh, L.A. (2013). Hunk negatively regulates c-myc to promote Akt-mediated cell survival and mammary tumorigenesis induced by loss of Pten. Proc. Natl. Acad. Sci. U. S. A. 110, 6103–6108.
Yi, H., Xue, L., Guo, M.-X., Ma, J., Zeng, Y., Wang, W., Cai, J.-Y., Hu, H.-M., Shu, H.-B., Shi, Y.-B., et al. (2010). Gene expression atlas for human embryogenesis. FASEB J. 24, 3341–3350.

58