a report - lokniti elections/nagaland assembly... · ncp 8 2 4.0 rjd 23 --- 6.5 ... number of...
TRANSCRIPT

1
A REPORT On
NAGALAND ASSEMBLY ELECTION 2008 A CSDS Study
Lokniti: Programme for comparative Democracy Centre for the Study of Developing Societies
29 Rajpur Road, Civil Lines, Delhi-110054 Phone: +91-011-23942199 (Ext. 333), +91-011-23981012
www.lokniti.org

2
CONTENTS
A: INTRODUCTION
Table-I: The Background of the Election
Table-II: Election Result
Table-III: Survey Frame
Table-IV: Sample Profile: Census of India vs. Survey
B: SURVEY DESIGN
Sampling Note:
a. How Assembly Constituencies for the survey were selected?
b. How Polling Stations for the survey were selected?
c. How Respondents for the survey were selected?
Table-V: Questionnaire Design
Table-VI: Details of Training Workshop of Investigator
Table-VII: Data Collection and Processing
Table-VIII: Details of Data Dissemination
C: DETAILS OF SURVEY TEAM
D. ANNEXURE
I: Annexure-1: Details of Survey Profile
II: Annexure-2: Marginal of All the Questions
III: Key Cross-Tabulation: Vote Share by Different Categories of Voters
IV: Annexure-4: Questionnaire
v. Annexure-5: Code Book
vi. Annexure-6: Copies of Publication
3
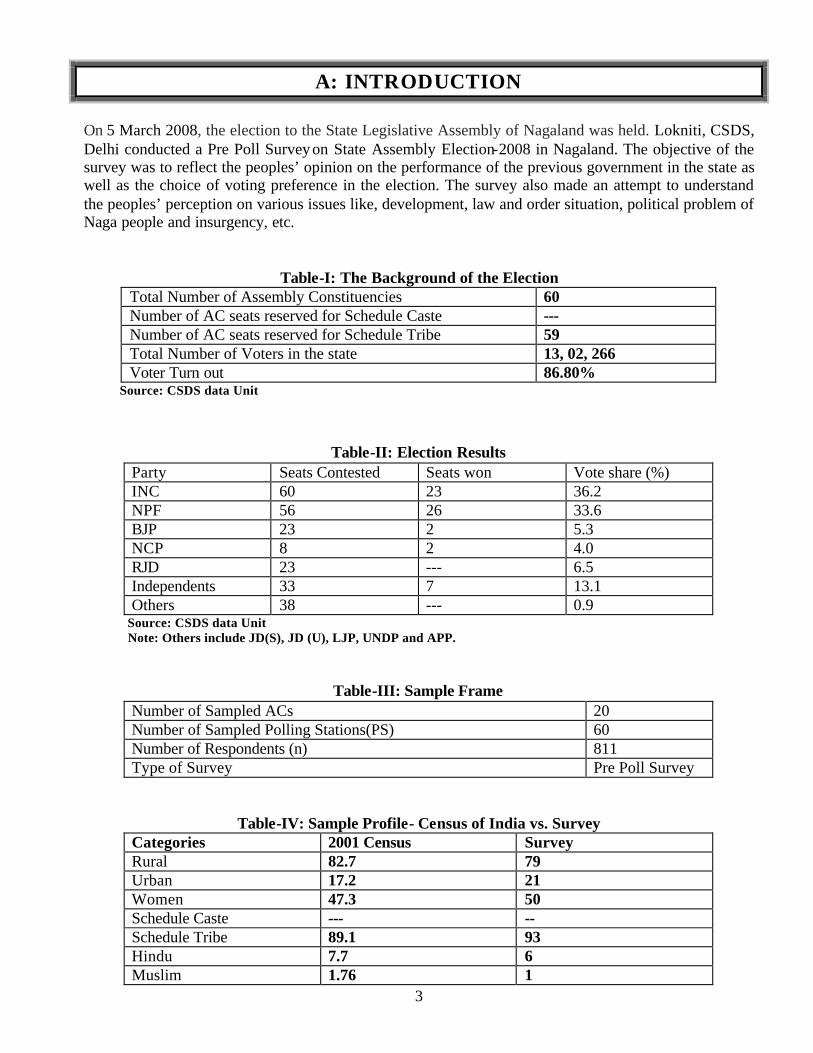
A: INTRODUCTION On 5 March 2008, the election to the State Legislative Assembly of Nagaland was held. Lokniti, CSDS, Delhi conducted a Pre Poll Survey on State Assembly Election-2008 in Nagaland. The objective of the survey was to reflect the peoples’ opinion on the performance of the previous government in the state as well as the choice of voting preference in the election. The survey also made an attempt to understand the peoples’ perception on various issues like, development, law and order situation, political problem of Naga people and insurgency, etc.
Table-I: The Background of the Election Total Number of Assembly Constituencies 60 Number of AC seats reserved for Schedule Caste --- Number of AC seats reserved for Schedule Tribe 59 Total Number of Voters in the state 13, 02, 266 Voter Turn out 86.80%
Source: CSDS data Unit
Table-II: Election Results Party Seats Contested Seats won Vote share (%) INC 60 23 36.2 NPF 56 26 33.6 BJP 23 2 5.3 NCP 8 2 4.0 RJD 23 --- 6.5 Independents 33 7 13.1 Others 38 --- 0.9
Source: CSDS data Unit Note: Others include JD(S), JD (U), LJP, UNDP and APP.
Table-III: Sample Frame Number of Sampled ACs 20 Number of Sampled Polling Stations(PS) 60 Number of Respondents (n) 811 Type of Survey Pre Poll Survey
Table-IV: Sample Profile- Census of India vs. Survey Categories 2001 Census Survey Rural 82.7 79 Urban 17.2 21 Women 47.3 50 Schedule Caste --- -- Schedule Tribe 89.1 93 Hindu 7.7 6 Muslim 1.76 1

4
Christian 89.9 92 Ao tribe 13.3 18 Angami Tribe 7.2 17 Sema Tribe 13.9 13 Lotha Tribe 8.5 9 Chakeshang 7.7 6 Kaonyak 14.0 6.3 Phom 6.6 6.7 Sangtam 4.8 5.6
Note: All figures in percent.
B: SURVEY DESIGN Sampling Note:
d. How Assembly Constituencies for the survey were selected? Out of its total 60 ACs, 20 ACs were sampled for the survey.
i. All the 60 ACs in the state were arranged in ascending order according to their AC ID numbers along with the total number of registered voters in each AC.
ii. The cumulative total of the total number of voters for each AC was computed. The cumulative total refers to adding the total number of registered voters in the first AC to the total number of registered voters in the second AC, and adding the cumulative number to the total number of registered voters in the third AC. This process is repeated for all the ACs and the cumulative total of the last AC was equal to the total voters in the state. For example, if AC 1, 2, 3 and 4 have 11, 15, 15 and 20 voters respectively, the cumulative total for AC 1 will be 11, AC 2 will be 26 (11+15=26), AC 3 will be 41 (15 + 26 = 41), and the cumulative total for AC 4 will be 61 (20 + 41 = 61).
iii. In order to arrive at a Sampling Constant, the total number of voters was then divided by 20, as it was decided that the survey will be conducted in 20 ACs. For example, if the total number of voters is 1000, it was divided by 20 to arrive at a Constant Sampling of 50.
iv. A number less than the Sampling Constant was randomly selected in the column of cumulative totals. Here randomly refers to an absolute non-bias approach wherein you should not be inclined to pick any particular PS. Then the AC in which the randomly selected number was located (identified from cumulative voters) became the first selected AC.
v. For example, if the 50th voter (if 50 is the Sampling Constant) was identified to be in AC number 4, then AC number 4 became the first sampled AC.
vi. By adding the Sampling Constant to the cumulative voter list of the first sampled AC, the next AC was selected. For Example, if the cumulative total at AC 4 is 75, then 50, the sampling constant will be added to 75 (75 + 50 = 125). Thus the second sample AC will be the one in which 125 will lie, or in other words the AC in which 125th voter is located becomes the second sampled AC.
vii. By repeating the same process, the third randomly sampled AC was selected. The same process was carried out to select all the 20-sampled ACs.

5
e. How Polling Stations for the survey were selected?
i. A comprehensive list of all the PS in the AC listing their number in ascending order was prepared.
ii. As it was decided to sample 3 PS in each AC, the total number of PS was divided by 3 to arrive at a Sampling Constant. For example, if the AC has 120 PS, it was divided by 3 to get a Sampling Constant of 40 (120 ÷ 3 = 40).
iii. Any PS with a number less than the Sampling Constant (for example less than 40) was randomly selected.
iv. The next PS was selected by adding the Sampling Constant to the PS Number already sampled. For example, if PS No. 25 (which is less than 40) is the first Sampled PS, then 40 (the Sampling Constant) to it to select the second sampled PS. So, 65 (25 + 40 = 65), becomes second randomly sampled PS.
v. By repeating the same process, the third randomly sampled PS was selected. For example, by adding 40 to randomly sampled PS No. 65 (as explained in the example above), add 40, 105 (65 + 40 = 105), becomes third randomly sampled PS.
vi. Thus, 3 randomly sampled PS from the total PS in each sampled AC was selected for the survey. For example, PS No. 25 (First Sample PS), PS No. 65 (Second Sample PS) and PS No. 105 (Third Sample PS). This process was carried out for all the 20-sampled ACs.
f. How Respondents for the survey were selected?
• In each sampled PS, a sampled respondent list of 25 voters was prepared from the voter list procured for this purpose. (Download it from state EC website or if not available from EC office)
• As the sample in each PS is 25 voters, the total number of Voters as given in the electoral roll of the selected sampled PS was divided by 25 to arrive at a Sampling Constant. For example, if the PS has 1000 Voters, it was divided by 25 to get a Sampling Constant of 40 (1000 ÷ 25 = 40).
• The first Voter with a number less than the Sampling Constant (for example less than 40) was randomly selected. Here, randomly refers to an absolute non-bias approach wherein one should not be inclined to pick any particular Voter.
• By adding the Sampling Constant to the Voter Number already sampled, the next Voter is selected. For example if the randomly sampled Voter No. 25 (which is less than 40) is first Sampled Voter, by adding 40 (the Sampling Constant) to it, voter No. 65 (25 + 40 = 65), became the second randomly sampled Voter. By repeating this process, 25 Voters from the voter list were selected.
• Thus, the names of the 25 Voters with their details in the blank respondent list were recorded to provide to the investigators for interviews. Substitution of respondents (Sampled Voters) was strictly not allowed.
• A team of 2 Investigators were asked to approach all the 25 respondents sampled at each PS in one day and interview as many voters as possible.

6
Table-V: Questionnaire Design
Language designed English Language translated* Questionnaire was administered through a master copy of
translated version of each and every tribal language in the state. Translated by Amongla Jamir and S Phyobenthung,
Fazal Ali College, Mokokchung, Nagaland Number variables 100 Major Themes
• Performance of the NPF-Led DAN Government • Question of Leadership • Solution to the Naga Problem • Issue of Greater Nagaland • Role of NSCN-IM in the Cause of Naga People • Problem of Insurgency • Free and Fairness of the Election
*After consulting Lokniti team at CSDS, the state co-ordinator decided to make only a master copy of translated version of Questionnaire for all the required languages due to the difficulties of translating the same into different tribal languages in the state. Thus, interviews were conducted in respective languages of respondent though it was recorded in the language designed.
Table-VI: Details of Training Workshop of Investigator
Date Venue No. of Investigator
Resource Person(s)
28 February 2008 Mokokchung, Nagaland
40 Amongla Jamir and S. Phyobenthung, Fazal Ali College, Mokokchung, Nagaland
Table-VII: Data Collection and Processing
Date(s) of field work 29 February -4 March 2008 Date(s) of Data Checking 5 March 2008 Venue of Data Checking Lokniti, CSDS, Delhi Date(s) of Data Entry 5- 6 March 2008 Venue of Data Entry Lokniti, CSDS, Delhi
Table-VIII: Details of Data Dissemination
Electronic Media Name of the Channel Date Time CNN-IBN 9th March 2008 8.00 p.m. Print Media Name of Publication Title of Article Name of Author Date The Indian Express Tribes and the State Rajiv Kshetri and
Dhanajai Joshi 11 March 2008

7
C: DETAILS OF SURVEY TEAM Sanjay Kumar of the CSDS directed the survey. Lokniti-State Coordinator Amongla Jamir and State supervisor, S Phyobenthung of Fazal Ali College, Nagaland coordinated the entire process of the survey like the selection of the investigators, their training and finally in supervising the field-work in Nagaland. The team that designed, coordinated and analyzed the survey at CSDS comprised of Dhananjai Joshi, Himanshu Bhattacharya, Kanchan Malhotra, Kshetri Rajiv Singh, Praveen Rai, Vikas Gautam and Yogendra Yadav.

8
D: ANNEXURES

9
I. ANNEXURE-1
DETAILS OF SURVEY PROFILE PS Number Ac Name PS No. N
7 10 20 10
Dimapur-I
33 9
01:
Total 29 3 10 11 8
Dimapur-III (ST)
19 9
03:
Total 28 12 15 37 17
Ghaspani-I (ST)
62 13
04:
TOTAL 45 6 20 24 10
Tenning (ST)
42 20
06:
Total 50 6 17 17 26
Kohima TOWN (ST)
28 18
09:
Total 61 2 21 12 21
Northern Angami-II (ST)
22 18
11:
Total 60 2 20 7 22
Southern Angami-I (ST)
12 15
14:
Total 57 5 16 13 11
Chazouba (ST)
21 17
18:
Total 43 5 18 12 14
Tuli (ST)
19 18
21:
Total 50 3 15 12 17
Angetyongpang (ST)
18 11
24:
Total 43 3 18 7 17
Jangpetkong (ST)
11 17
29:
Total 51

10
3 18 14 12
Akuluto (ST)
16 19
31:
Total 49 3 9 7 12
Tyui (ST)
12 13
37:
Total 35 6 7 15 12
Sanis (ST)
24 16
39:
Total 35 4 20 15 20
Tamlu (ST)
24 19
49:
Total 59 2 13 11 14
Longkhim Chare (ST)
20 13
52:
Total 41 3 18 10 14
Tobu (ST)
17 18
55:
Total 50 17 11 Siyuchong-Sitimi (ST) 28 12
59:
Total 23 Source: CSDS Data Unit; N = Number of Respondents Note: Out of sampled 20 ACs, the survey was conducted only in 18 ACs due to the transportation difficulties and other problems related to the bad law and order situation in the state. Hence, out of 60 polling stations targeted for the survey, only 53 polling stations could be surveyed. Thus, a total of 811 voters spread across 53 Polling Stations in 18 ACs were interviewed during the survey.

11
II. ANNEXURE-2
MARGINAL OF ALL THE QUESTIONS
Q2: Will you vote in the coming election?
15 1.9 1.9 1.9734 90.6 90.6 92.5
61 7.5 7.5 100.0811 100.0 100.0
1: No
2: Yes8: Can't sayTotal
ValidFrequency Percent
ValidPercent
Cumulative Percent
Q2a: (If yes) Would you definitely vote in any condition or is also possible thatyou do not vote for some reason?
585 72.1 72.1 72.1
69 8.5 8.5 80.6
81 10.0 10.0 90.677 9.4 9.4 100.0
811 100.0 100.0
1: Definitely vote2: Might not votefor some reason8: Can't say9: N.A.Total
ValidFrequency Percent
ValidPercent
Cumulative Percent
Q3: If Assembly Elections are held tomorrow which party or candidate will youvote for?
292 36.1 36.1 36.144 5.4 5.4 41.4
8 1.0 1.0 42.5276 34.0 34.0 76.5
42 5.2 5.2 81.731 3.8 3.8 85.5
2 .2 .2 85.85 .6 .6 86.3
111 13.7 13.7 100.0811 100.0 100.0
01: Congress02: BJP05: NCP06: NPF07: RJD96: Independents97: Others98: Don't know99: Blank/RefusalTotal
ValidFrequency Percent
ValidPercent
Cumulative Percent
12
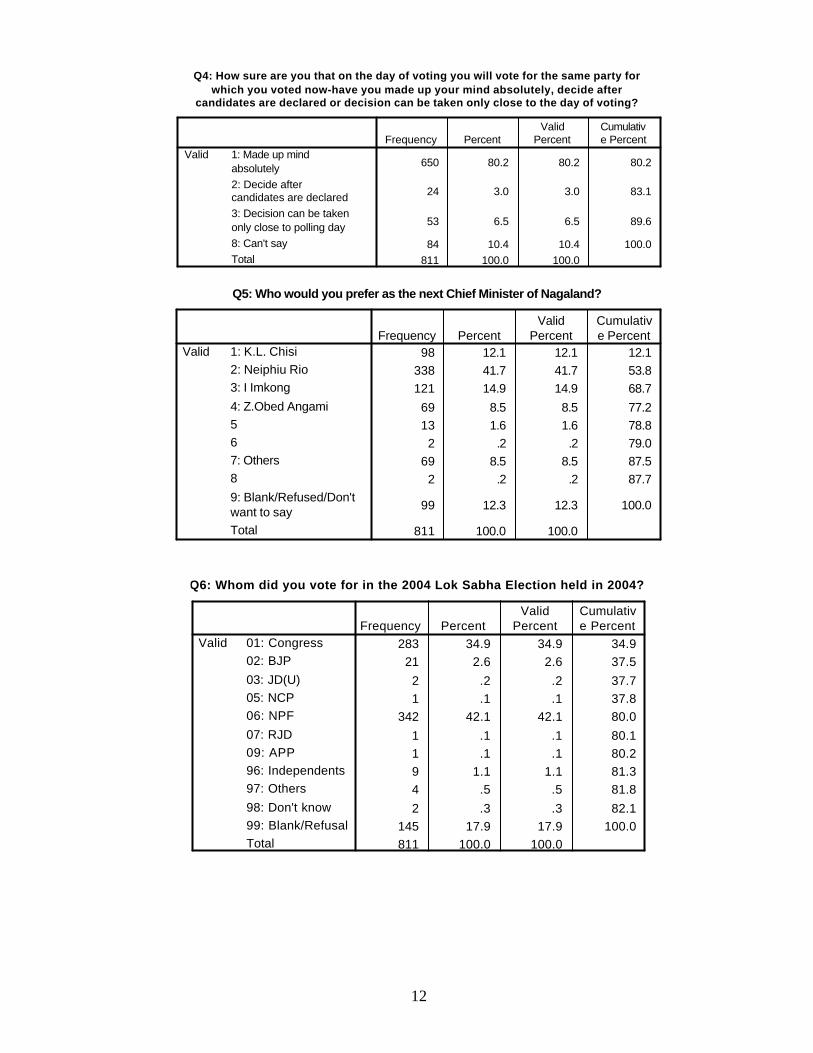
Q4: How sure are you that on the day of voting you will vote for the same party forwhich you voted now-have you made up your mind absolutely, decide after
candidates are declared or decision can be taken only close to the day of voting?
650 80.2 80.2 80.2
24 3.0 3.0 83.1
53 6.5 6.5 89.6
84 10.4 10.4 100.0811 100.0 100.0
1: Made up mindabsolutely2: Decide aftercandidates are declared3: Decision can be takenonly close to polling day8: Can't sayTotal
ValidFrequency Percent
ValidPercent
Cumulative Percent
Q5: Who would you prefer as the next Chief Minister of Nagaland?
98 12.1 12.1 12.1338 41.7 41.7 53.8121 14.9 14.9 68.7
69 8.5 8.5 77.213 1.6 1.6 78.8
2 .2 .2 79.069 8.5 8.5 87.5
2 .2 .2 87.7
99 12.3 12.3 100.0
811 100.0 100.0
1: K.L. Chisi2: Neiphiu Rio3: I Imkong
4: Z.Obed Angami567: Others8
9: Blank/Refused/Don'twant to sayTotal
ValidFrequency Percent
ValidPercent
Cumulative Percent
Q6: Whom did you vote for in the 2004 Lok Sabha Election held in 2004?
283 34.9 34.9 34.921 2.6 2.6 37.5
2 .2 .2 37.71 .1 .1 37.8
342 42.1 42.1 80.0
1 .1 .1 80.11 .1 .1 80.29 1.1 1.1 81.34 .5 .5 81.8
2 .3 .3 82.1145 17.9 17.9 100.0811 100.0 100.0
01: Congress02: BJP
03: JD(U)05: NCP06: NPF
07: RJD09: APP96: Independents97: Others
98: Don't know99: Blank/RefusalTotal
ValidFrequency Percent
ValidPercent
Cumulative Percent

13
Q7: What is your assement of the work done by the NPF led DAN government inNagaland during the last five years-would you say that you are satisfied or
dissatisfied with it?
102 12.5 12.5 12.5370 45.7 45.7 58.2160 19.7 19.7 77.9103 12.7 12.7 90.6
76 9.4 9.4 100.0811 100.0 100.0
1: Fully satisfied2: Somewhat satisfied3: Somewhat dissatisfied4: Fully dissatisfied8: Can't say/D.KTotal
ValidFrequency Percent
ValidPercent
Cumulative Percent
Q8: And what is your opinion about the performance of Neiphiu Rio as Chief Ministerof Nagaland in the last five years-would you say that you are satisfied or dissatisfied
with his performance?
103 12.7 12.7 12.7381 47.0 47.0 59.7160 19.7 19.7 79.5104 12.8 12.8 92.2
63 7.8 7.8 100.0811 100.0 100.0
1: Fully satisfied2: Somewhat satisfied3: Somewhat dissatisfied4: Fully dissatisfied8: Can't say/D.KTotal
ValidFrequency Percent
ValidPercent
Cumulative Percent
Q9a: Now I will talk about the changes that have taken place in Nagaland duringthe last five years, after the NPF led DAN came to power. In the five years hasthe development of Nagaland improved, deteriorated or remained the same?
440 54.3 54.3 54.3
321 39.6 39.6 93.839 4.9 4.9 98.711 1.3 1.3 100.0
811 100.0 100.0
1: Improved2: Remained same3: Deteriorated8: D.KTotal
ValidFrequency Percent
ValidPercent
Cumulative Percent
Q9b: Now I will talk about the changes that have taken place in Nagaland duringthe last five years, after the NPF led DAN came to power. In the five years has
the condition of roads improved, deteriorated or remained the same?
368 45.3 45.3 45.3320 39.5 39.5 84.8115 14.2 14.2 99.1
8 .9 .9 100.0811 100.0 100.0
1: Improved2: Remained same3: Deteriorated8: D.KTotal
ValidFrequency Percent
ValidPercent
Cumulative Percent

14
Q9c: Now I will talk about the changes that have taken place in Nagaland duringthe last five years, after the NPF led DAN came to power. In the five years has
the security of ordinary people improved, deteriorated or remained the same?
162 20.0 20.0 20.0464 57.2 57.2 77.2101 12.5 12.5 89.7
84 10.3 10.3 100.0811 100.0 100.0
1: Improved2: Remained same3: Deteriorated8: D.KTotal
ValidFrequency Percent
ValidPercent
Cumulative Percent
Q9d: Now I will talk about the changes that have taken place in Nagaland duringthe last five years, after the NPF led DAN came to power. In the five years, has
the Condition of poor improved, deteriorated or remained the same?
136 16.8 16.8 16.8474 58.5 58.5 75.3111 13.7 13.7 88.9
90 11.1 11.1 100.0811 100.0 100.0
1: Improved2: Remained same3: Deteriorated8: D.KTotal
ValidFrequency Percent
ValidPercent
Cumulative Percent
Q10a: And also tell me if in the last five years, after the NPF led DAN Govt. cameto power, corruptions have increased, decreased or remained the same?
199 24.6 24.6 24.6
452 55.8 55.8 80.4111 13.7 13.7 94.1
48 5.9 5.9 100.0811 100.0 100.0
1: Increased
2: Remained same3: Decreased8: D.K.Total
ValidFrequency Percent
ValidPercent
Cumulative Percent
Q10b: And also tell me if in the last five years, after the NPF led DAN Govt. cameto power, insurgencies have increased, decreased or remained the same?
246 30.4 30.4 30.4
402 49.6 49.6 79.948 5.9 5.9 85.8
115 14.2 14.2 100.0811 100.0 100.0
1: Increased
2: Remained same3: Decreased8: D.K.Total
ValidFrequency Percent
ValidPercent
Cumulative Percent

15
Q10c: And also tell me if in the last five years, after the NPF led DAN Govt. cameto power, inflations have increased, decreased or remained the same?
258 31.8 31.8 31.8
351 43.2 43.2 75.181 9.9 9.9 85.0
122 15.0 15.0 100.0811 100.0 100.0
1: Increased
2: Remained same3: Decreased8: D.K.Total
ValidFrequency Percent
ValidPercent
Cumulative Percent
Q10d: And also tell me if in the last five years, after the NPF led DAN Govt. cameto power, employment opportunities have increased, decreased or remained
the same?
228 28.2 28.2 28.2349 43.1 43.1 71.2176 21.7 21.7 93.0
57 7.0 7.0 100.0811 100.0 100.0
1: Increased2: Remained same3: Decreased8: D.K.Total
ValidFrequency Percent
ValidPercent
Cumulative Percent
Q11: If we compare S.C. Jamir with Neiphiu Rio, then in your opinion whichof the two was a better leader for Nagaland - S.C. Jamir or Neiphiu Rio?
221 27.2 27.2 27.2
398 49.0 49.0 76.3192 23.7 23.7 100.0811 100.0 100.0
1: S.C. Jamir
2: Neiphiu Rio8: No opinionTotal
ValidFrequency Percent
ValidPercent
Cumulative Percent
Q12: Have you heard of the demand of 'Greater Nagaland'?
129 15.9 15.9 15.9682 84.1 84.1 100.0811 100.0 100.0
1: No2: YesTotal
ValidFrequency Percent
ValidPercent
Cumulative Percent
Q12a: (If yes) To what extent do you think that the demand of 'Greater Nagaland'is justified-fully justified, somewhat justified, not justified or not at all justified?
115 14.2 14.2 14.2254 31.3 31.3 45.6
91 11.2 11.2 56.826 3.2 3.2 60.0
196 24.2 24.2 84.1129 15.9 15.9 100.0811 100.0 100.0
1: Fully justified2: Somewhat justified3: Not justified4: Not at all justified8: No opinion9: N.A.Total
ValidFrequency Percent
ValidPercent
Cumulative Percent

16
Q13: People have different opinions on what should be the solution to the Nagaproblem. I am going to read out some opinions that we often hear. Please tell me
which one of these do you feel close to?
122 15.1 15.1 15.1
337 41.5 41.5 56.6
286 35.2 35.2 91.8
66 8.2 8.2 100.0811 100.0 100.0
1: Nagalnd shouldremain in India the wayit is2: Nagaland shouldseperate from India andbecome independen3: Nagaland should getgreater autonomy withinIndia8: No opinionTotal
ValidFrequency Percent
ValidPercent
Cumulative Percent
Q14a: Now I will ask you to make a comparison between the DANgovernment and the previous Congress government. Tell me on the
issue-for curbing corruption which government is better?
181 22.4 22.4 22.4229 28.2 28.2 50.6
309 38.1 38.1 88.791 11.3 11.3 100.0
811 100.0 100.0
1: Congress2: DAN
3: No difference8: No opinionTotal
ValidFrequency Percent
ValidPercent
Cumulative Percent
Q14b: Now I will ask you to make a comparison between the DANgovernment and the previous Congress government. Tell me on the
issue-for overall development of Nagaland which government is better?
193 23.8 23.8 23.8356 43.9 43.9 67.7
186 23.0 23.0 90.676 9.4 9.4 100.0
811 100.0 100.0
1: Congress2: DAN
3: No difference8: No opinionTotal
ValidFrequency Percent
ValidPercent
Cumulative Percent
Q14c: Now I will ask you to make a comparison between the DANgovernment and the previous Congress government. Tell me on the
issue-for bringing peace which government is better?
291 35.8 35.8 35.8209 25.7 25.7 61.6
233 28.7 28.7 90.279 9.8 9.8 100.0
811 100.0 100.0
1: Congress2: DAN
3: No difference8: No opinionTotal
ValidFrequency Percent
ValidPercent
Cumulative Percent

17
Q15a: I am going to name a number of institutions. For each one, pleasetell me, how much trust do you have in Central/National Government?
87 10.8 10.8 10.8
128 15.8 15.8 26.6114 14.0 14.0 40.6
69 8.5 8.5 49.1111 13.7 13.7 62.8
48 5.9 5.9 68.741 5.1 5.1 73.829 3.6 3.6 77.518 2.3 2.3 79.721 2.6 2.6 82.3
3 .4 .4 82.7140 17.3 17.3 100.0811 100.0 100.0
01: One
02: Two03: Three04: Four05: Five
06: Six07: Seven08: Eight09: Nine
10: Ten97: Not heard98: No opinionTotal
ValidFrequency Percent
ValidPercent
Cumulative Percent
Q15b: I am going to name a number of institutions. For each one, pleasetell me, how much trust do you have in State Government?
221 27.2 27.2 27.2
113 13.9 13.9 41.184 10.4 10.4 51.570 8.7 8.7 60.2
128 15.8 15.8 76.0
45 5.5 5.5 81.528 3.4 3.4 85.026 3.2 3.2 88.211 1.4 1.4 89.524 3.0 3.0 92.5
1 .1 .1 92.760 7.3 7.3 100.0
811 100.0 100.0
01: One
02: Two03: Three04: Four05: Five
06: Six07: Seven08: Eight09: Nine10: Ten
97: Not heard98: No opinionTotal
ValidFrequency Percent
ValidPercent
Cumulative Percent

18
Q15c: I am going to name a number of institutions. For each one, pleasetell me, how much trust do you have in Police?
24 3.0 3.0 3.0
122 15.0 15.0 18.0114 14.1 14.1 32.1
64 7.9 7.9 40.0141 17.4 17.4 57.4
65 8.0 8.0 65.435 4.3 4.3 69.740 4.9 4.9 74.635 4.3 4.3 78.920 2.4 2.4 81.3
4 .5 .5 81.8147 18.2 18.2 100.0811 100.0 100.0
01: One
02: Two03: Three04: Four05: Five
06: Six07: Seven08: Eight09: Nine10: Ten
97: Not heard98: No opinionTotal
ValidFrequency Percent
ValidPercent
Cumulative Percent
Q15d: I am going to name a number of institutions. For each one, pleasetell me, how much trust do you have in Army?
25 3.1 3.1 3.1
26 3.2 3.2 6.348 5.9 5.9 12.257 7.0 7.0 19.2
175 21.6 21.6 40.9
52 6.4 6.4 47.343 5.2 5.2 52.581 10.0 10.0 62.664 7.9 7.9 70.5
126 15.6 15.6 86.1
11 1.4 1.4 87.4102 12.6 12.6 100.0811 100.0 100.0
01: One
02: Two03: Three04: Four05: Five
06: Six07: Seven08: Eight09: Nine10: Ten
97: Not heard98: No opinionTotal
ValidFrequency Percent
ValidPercent
Cumulative Percent

19
Q15e: I am going to name a number of institutions. For each one, pleasetell me, how much trust do you have in Election Commission?
33 4.1 4.1 4.1
77 9.5 9.5 13.680 9.9 9.9 23.5
132 16.2 16.2 39.7110 13.6 13.6 53.3
39 4.8 4.8 58.115 1.9 1.9 60.012 1.4 1.4 61.419 2.4 2.4 63.813 1.6 1.6 65.4
66 8.1 8.1 73.5215 26.5 26.5 100.0811 100.0 100.0
01: One
02: Two03: Three04: Four05: Five
06: Six07: Seven08: Eight09: Nine10: Ten
97: Not heard98: No opinionTotal
ValidFrequency Percent
ValidPercent
Cumulative Percent
Q16: Have you heard about Presiden't rule in Nagaland?
68 8.4 8.4 8.4743 91.6 91.6 100.0811 100.0 100.0
1: No2: YesTotal
ValidFrequency Percent
ValidPercent
Cumulative Percent
Q16a: (If yes) To what extent do you think that putting President's Rule inNagaland is justified-fully justified, somewhat justified, not justified or not at all
justified?
144 17.8 17.8 17.8182 22.4 22.4 40.2144 17.7 17.7 58.0113 14.0 14.0 71.9
160 19.7 19.7 91.668 8.4 8.4 100.0
811 100.0 100.0
1: Fully justified2: Somewhat justified3: Not justified4: Not at all justified
8: No opinion9: N.A.Total
ValidFrequency Percent
ValidPercent
Cumulative Percent

20
Q17a: Now I will read out names of few national leaders of India. You tellme, how much trust do you have in Lal Krishna Advani?
5 .7 .7 .7
21 2.6 2.6 3.327 3.4 3.4 6.660 7.4 7.4 14.178 9.6 9.6 23.7
39 4.8 4.8 28.536 4.5 4.5 32.998 12.1 12.1 45.041 5.0 5.0 50.1
154 19.0 19.0 69.1
60 7.4 7.4 76.4191 23.6 23.6 100.0811 100.0 100.0
01: One
02: Two03: Three04: Four05: Five
06: Six07: Seven08: Eight09: Nine10: Ten
97: Not heard98: No opinionTotal
ValidFrequency Percent
ValidPercent
Cumulative Percent
Q17b: Now I will read out names of few national leaders of India. You tellme, how much trust do you have in Sonia Gandhi?
227 27.9 27.9 27.9
188 23.2 23.2 51.2102 12.5 12.5 63.7
62 7.6 7.6 71.370 8.6 8.6 79.9
36 4.5 4.5 84.419 2.4 2.4 86.820 2.4 2.4 89.212 1.5 1.5 90.7
5 .6 .6 91.3
1 .1 .1 91.470 8.6 8.6 100.0
811 100.0 100.0
01: One
02: Two03: Three04: Four05: Five
06: Six07: Seven08: Eight09: Nine
10: Ten97: Not heard98: No opinionTotal
ValidFrequency Percent
ValidPercent
Cumulative Percent

21
Q17c: Now I will read out names of few national leaders of India. You tellme, how much trust do you have in Atal Behari Vajpayee?
54 6.6 6.6 6.6
100 12.3 12.3 18.9135 16.7 16.7 35.6
65 8.0 8.0 43.690 11.1 11.1 54.7
59 7.3 7.3 62.027 3.3 3.3 65.438 4.7 4.7 70.143 5.3 5.3 75.428 3.5 3.5 78.8
11 1.4 1.4 80.2161 19.8 19.8 100.0811 100.0 100.0
01: One
02: Two03: Three04: Four05: Five
06: Six07: Seven08: Eight09: Nine
10: Ten97: Not heard98: No opinionTotal
ValidFrequency Percent
ValidPercent
Cumulative Percent
Q17d: Now I will read out names of few national leaders of India. You tellme, how much trust do you have in Manmohan Singh?
144 17.7 17.7 17.7
154 19.0 19.0 36.8130 16.1 16.1 52.8
73 9.0 9.0 61.883 10.2 10.2 72.0
24 3.0 3.0 75.020 2.5 2.5 77.521 2.6 2.6 80.125 3.1 3.1 83.219 2.4 2.4 85.6
7 .9 .9 86.5110 13.5 13.5 100.0811 100.0 100.0
01: One
02: Two03: Three04: Four05: Five
06: Six07: Seven08: Eight09: Nine10: Ten
97: Not heard98: No opinionTotal
ValidFrequency Percent
ValidPercent
Cumulative Percent

22
Q18a: And now I will read out names of few state leaders of Nagaland. Youtell me, how much trust do you have in K.L. Chishi?
71 8.8 8.8 8.8
70 8.6 8.6 17.481 10.0 10.0 27.474 9.1 9.1 36.591 11.2 11.2 47.7
42 5.2 5.2 52.854 6.7 6.7 59.538 4.7 4.7 64.234 4.2 4.2 68.432 4.0 4.0 72.4
52 6.4 6.4 78.9171 21.1 21.1 100.0811 100.0 100.0
01: One
02: Two03: Three04: Four05: Five
06: Six07: Seven08: Eight09: Nine10: Ten
97: Not heard98: No opinionTotal
ValidFrequency Percent
ValidPercent
Cumulative Percent
Q18b: And now I will read out names of few state leaders of Nagaland. Youtell me, how much trust do you have in Neiphiu Rio?
222 27.4 27.4 27.4
191 23.6 23.6 51.073 9.0 9.0 60.058 7.1 7.1 67.270 8.6 8.6 75.8
22 2.7 2.7 78.513 1.6 1.6 80.126 3.2 3.2 83.329 3.6 3.6 86.951 6.3 6.3 93.2
2 .2 .2 93.553 6.5 6.5 100.0
811 100.0 100.0
01: One
02: Two03: Three04: Four05: Five
06: Six07: Seven08: Eight09: Nine10: Ten
97: Not heard98: No opinionTotal
ValidFrequency Percent
ValidPercent
Cumulative Percent
23
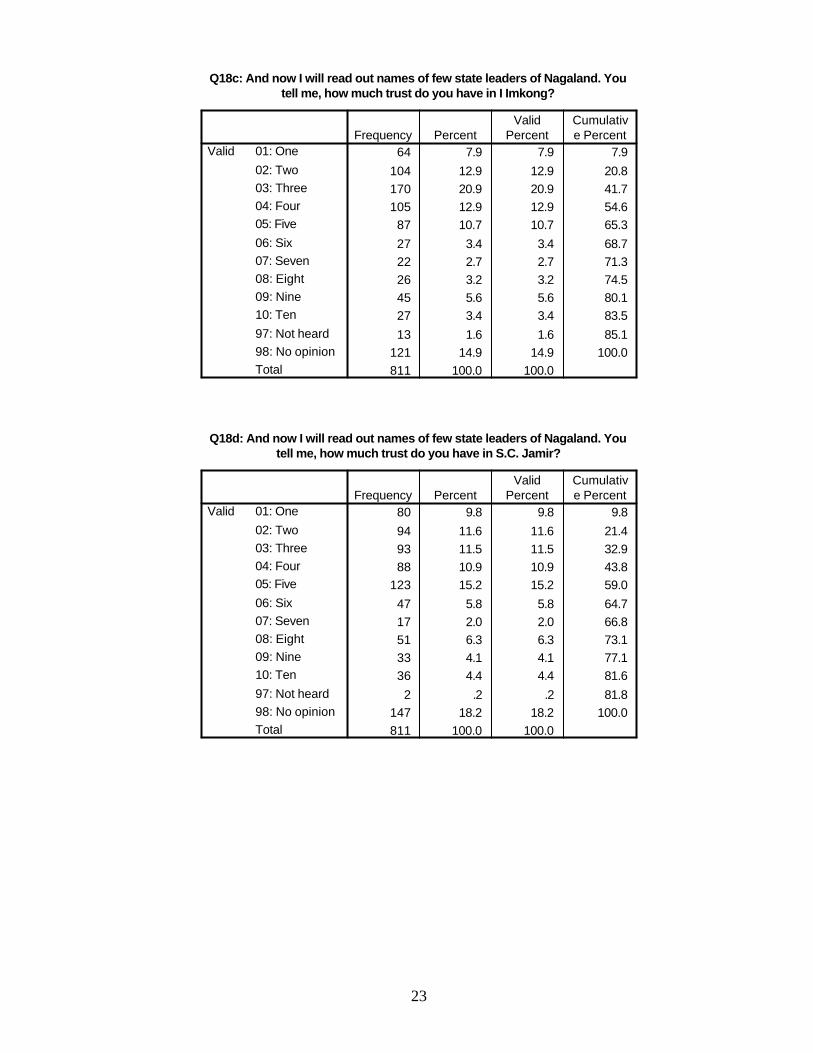
Q18c: And now I will read out names of few state leaders of Nagaland. Youtell me, how much trust do you have in I Imkong?
64 7.9 7.9 7.9
104 12.9 12.9 20.8170 20.9 20.9 41.7105 12.9 12.9 54.6
87 10.7 10.7 65.3
27 3.4 3.4 68.722 2.7 2.7 71.326 3.2 3.2 74.545 5.6 5.6 80.127 3.4 3.4 83.5
13 1.6 1.6 85.1121 14.9 14.9 100.0811 100.0 100.0
01: One
02: Two03: Three04: Four05: Five
06: Six07: Seven08: Eight09: Nine10: Ten
97: Not heard98: No opinionTotal
ValidFrequency Percent
ValidPercent
Cumulative Percent
Q18d: And now I will read out names of few state leaders of Nagaland. Youtell me, how much trust do you have in S.C. Jamir?
80 9.8 9.8 9.8
94 11.6 11.6 21.493 11.5 11.5 32.988 10.9 10.9 43.8
123 15.2 15.2 59.0
47 5.8 5.8 64.717 2.0 2.0 66.851 6.3 6.3 73.133 4.1 4.1 77.136 4.4 4.4 81.6
2 .2 .2 81.8147 18.2 18.2 100.0811 100.0 100.0
01: One
02: Two03: Three04: Four05: Five
06: Six07: Seven08: Eight09: Nine10: Ten
97: Not heard98: No opinionTotal
ValidFrequency Percent
ValidPercent
Cumulative Percent

24
Q18e: And now I will read out names of few state leaders of Nagaland. Youtell me, how much trust do you have in Z.Obed Angami?
87 10.8 10.8 10.8
111 13.7 13.7 24.584 10.3 10.3 34.8
103 12.7 12.7 47.554 6.6 6.6 54.1
44 5.4 5.4 59.650 6.2 6.2 65.734 4.2 4.2 69.938 4.7 4.7 74.622 2.7 2.7 77.3
24 3.0 3.0 80.3160 19.7 19.7 100.0811 100.0 100.0
01: One
02: Two03: Three04: Four05: Five
06: Six07: Seven08: Eight09: Nine10: Ten
97: Not heard98: No opinionTotal
ValidFrequency Percent
ValidPercent
Cumulative Percent
Q19a: Now I will read out few statents. Please tell me whether you agree ordisagree with the statement-There should be a ban shifting cultivation since it
harms the environment?
84 10.3 10.3 10.3214 26.3 26.3 36.6321 39.6 39.6 76.2
98 12.1 12.1 88.395 11.7 11.7 100.0
811 100.0 100.0
1: Fully disagree2: Somewhat disagree3: Somewhat agree
4: Fully agree8: No opinionTotal
ValidFrequency Percent
ValidPercent
Cumulative Percent
Q19a: Now I will read out few statements. Please tell me whether you agree ordisagree with the statement-There should be a ban on shifting cultivation since it
harms the environment?
84 10.3 10.3 10.3214 26.3 26.3 36.6321 39.6 39.6 76.2
98 12.1 12.1 88.395 11.7 11.7 100.0
811 100.0 100.0
1: Fully disagree2: Somewhat disagree3: Somewhat agree4: Fully agree8: No opinionTotal
ValidFrequency Percent
ValidPercent
Cumulative Percent
25
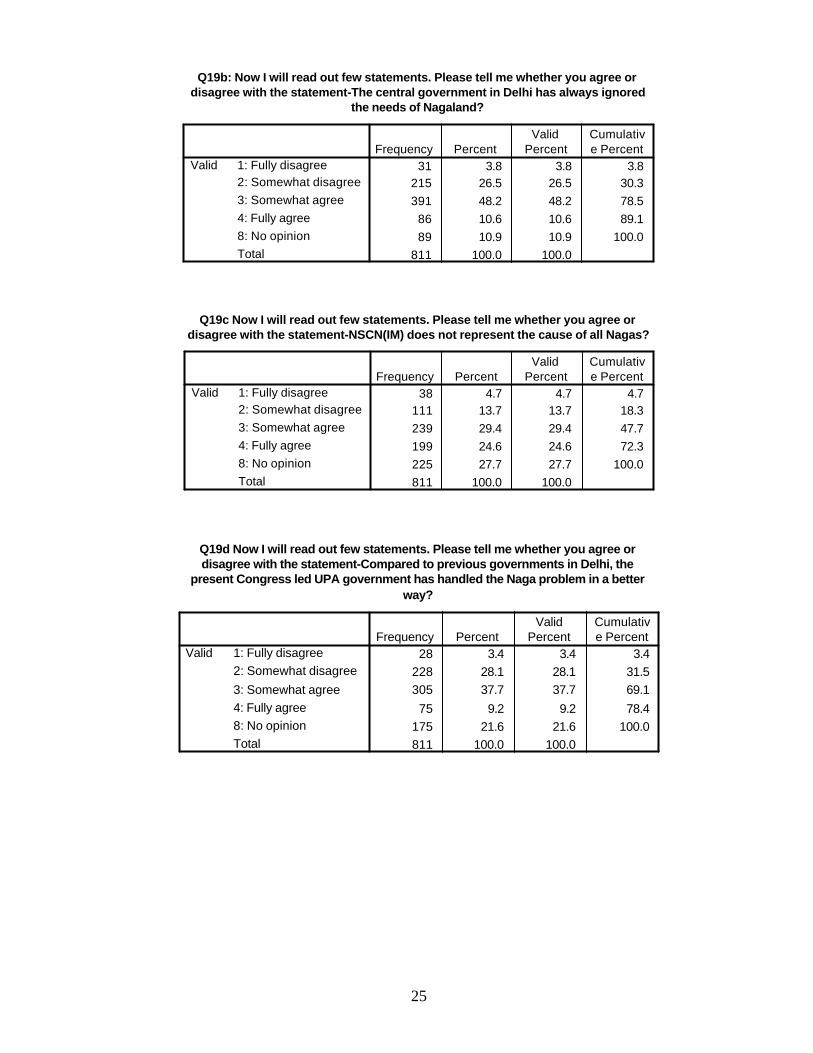
Q19b: Now I will read out few statements. Please tell me whether you agree ordisagree with the statement-The central government in Delhi has always ignored
the needs of Nagaland?
31 3.8 3.8 3.8215 26.5 26.5 30.3391 48.2 48.2 78.5
86 10.6 10.6 89.189 10.9 10.9 100.0
811 100.0 100.0
1: Fully disagree2: Somewhat disagree3: Somewhat agree4: Fully agree8: No opinionTotal
ValidFrequency Percent
ValidPercent
Cumulative Percent
Q19c Now I will read out few statements. Please tell me whether you agree ordisagree with the statement-NSCN(IM) does not represent the cause of all Nagas?
38 4.7 4.7 4.7111 13.7 13.7 18.3239 29.4 29.4 47.7199 24.6 24.6 72.3225 27.7 27.7 100.0811 100.0 100.0
1: Fully disagree2: Somewhat disagree3: Somewhat agree4: Fully agree8: No opinionTotal
ValidFrequency Percent
ValidPercent
Cumulative Percent
Q19d Now I will read out few statements. Please tell me whether you agree ordisagree with the statement-Compared to previous governments in Delhi, the
present Congress led UPA government has handled the Naga problem in a betterway?
28 3.4 3.4 3.4228 28.1 28.1 31.5305 37.7 37.7 69.1
75 9.2 9.2 78.4175 21.6 21.6 100.0811 100.0 100.0
1: Fully disagree2: Somewhat disagree
3: Somewhat agree4: Fully agree8: No opinionTotal
ValidFrequency Percent
ValidPercent
Cumulative Percent

26
Q19e: Now I will read out few statements. Please tell me whether you agree ordisagree with the statement-Seats should be reserved for women in Lok Sabha
and Vidhan Sabha?
34 4.2 4.2 4.242 5.1 5.1 9.3
231 28.4 28.4 37.7403 49.7 49.7 87.4102 12.6 12.6 100.0811 100.0 100.0
1: Fully disagree2: Somewhat disagree3: Somewhat agree4: Fully agree8: No opinionTotal
ValidFrequency Percent
ValidPercent
Cumulative Percent
Q20: We often hear diffrent opinions about the peace process in Nagland. Somepeople say that there can be no peace without Greater Nagaland, some say, cause
is fine, but peace should continue, others say that demand not justified. What isyour opinion?
130 16.1 16.1 16.1
272 33.6 33.6 49.6
82 10.1 10.1 59.7327 40.3 40.3 100.0811 100.0 100.0
1: No peace withoutGreater Nagaland2: Cause is fine, butpeace should continue3: Demand not justified8: No opinionTotal
ValidFrequency Percent
ValidPercent
Cumulative Percent
Q21a: Now I will read out names of few groups. Please tell me for each ofthem, to solve the Naga issue, should the Central Government of India
hold talks with NSCN (Isak-Muhiva)?
175 21.6 21.6 21.6424 52.3 52.3 73.9
2 .2 .2 74.1210 25.9 25.9 100.0811 100.0 100.0
1: No2: Yes7: Not heard8: No opinionTotal
ValidFrequency Percent
ValidPercent
Cumulative Percent
Q21b: Now I will read out names of few groups. Please tell me for each ofthem, to solve the Naga issue, should the Central Government of India
hold talks with NNC (Adino)?
119 14.6 14.6 14.6406 50.1 50.1 64.7
66 8.2 8.2 72.9219 27.1 27.1 100.0811 100.0 100.0
1: No2: Yes7: Not heard8: No opinionTotal
ValidFrequency Percent
ValidPercent
Cumulative Percent

27
Q21c: Now I will read out names of few groups. Please tell me for each ofthem, to solve the Naga issue, should the Central Government of India
hold talks with NSCN (Khaplang?
114 14.0 14.0 14.0431 53.1 53.1 67.2
4 .5 .5 67.7262 32.3 32.3 100.0811 100.0 100.0
1: No2: Yes7: Not heard8: No opinionTotal
ValidFrequency Percent
ValidPercent
Cumulative Percent
Q21d: Now I will read out names of few groups. Please tell me for each ofthem, to solve the Naga issue, should the Central Government of India
hold talks with NFG?
85 10.4 10.4 10.4176 21.7 21.7 32.2255 31.5 31.5 63.7295 36.3 36.3 100.0811 100.0 100.0
1: No2: Yes7: Not heard8: No opinionTotal
ValidFrequency Percent
ValidPercent
Cumulative Percent
Q21e: Now I will read out names of few groups. Please tell me for each ofthem, to solve the Naga issue, should the Central Government of India
hold talks with NFA?
78 9.7 9.7 9.7100 12.4 12.4 22.0293 36.1 36.1 58.1340 41.9 41.9 100.0811 100.0 100.0
1: No2: Yes7: Not heard8: No opinionTotal
ValidFrequency Percent
ValidPercent
Cumulative Percent

28
Q22a: And tell me, how much trust do you have in MSCN (Isak-Muhiva)?
58 7.2 7.2 7.296 11.8 11.8 19.081 10.0 10.0 29.047 5.7 5.7 34.886 10.6 10.6 45.424 3.0 3.0 48.335 4.3 4.3 52.728 3.5 3.5 56.226 3.2 3.2 59.3
113 14.0 14.0 73.34 .5 .5 73.8
213 26.2 26.2 100.0811 100.0 100.0
01: One02: Two03: Three04: Four05: Five06: Six07: Seven08: Eight09: Nine10: Ten97: Not heard98: No opinionTotal
ValidFrequency Percent
ValidPercent
Cumulative Percent
Q22b: And tell me, how much trust do you have in NNC (Adino)?
185 22.8 22.8 22.877 9.5 9.5 32.341 5.1 5.1 37.432 3.9 3.9 41.4
69 8.5 8.5 49.924 2.9 2.9 52.830 3.7 3.7 56.524 2.9 2.9 59.426 3.2 3.2 62.6
32 3.9 3.9 66.564 7.9 7.9 74.4
207 25.6 25.6 100.0811 100.0 100.0
01: One02: Two03: Three
04: Four05: Five06: Six07: Seven08: Eight09: Nine
10: Ten97: Not heard98: No opinionTotal
ValidFrequency Percent
ValidPercent
Cumulative Percent

29
Q22c: And tell me, how much trust do you have in NSCN (Khaplang)?
46 5.6 5.6 5.6130 16.1 16.1 21.7
125 15.4 15.4 37.126 3.2 3.2 40.387 10.8 10.8 51.134 4.2 4.2 55.2
26 3.3 3.3 58.535 4.3 4.3 62.827 3.3 3.3 66.145 5.5 5.5 71.6
2 .3 .3 71.9228 28.1 28.1 100.0811 100.0 100.0
01: One02: Two
03: Three04: Four05: Five06: Six
07: Seven08: Eight09: Nine10: Ten
97: Not heard98: No opinionTotal
ValidFrequency Percent
ValidPercent
Cumulative Percent
Q22d: And tell me, how much trust do you have in NFG?
5 .7 .7 .722 2.7 2.7 3.324 2.9 2.9 6.331 3.9 3.9 10.2
65 8.1 8.1 18.236 4.4 4.4 22.721 2.6 2.6 25.214 1.7 1.7 27.026 3.1 3.1 30.1
34 4.2 4.2 34.3260 32.1 32.1 66.4273 33.6 33.6 100.0811 100.0 100.0
01: One02: Two03: Three
04: Four05: Five06: Six07: Seven08: Eight09: Nine
10: Ten97: Not heard98: No opinionTotal
ValidFrequency Percent
ValidPercent
Cumulative Percent

30
Q22e: And tell me, how much trust do you have in NFA?
4 .5 .5 .55 .6 .6 1.1
15 1.9 1.9 3.011 1.4 1.4 4.448 5.9 5.9 10.322 2.7 2.7 13.0
24 3.0 3.0 16.016 2.0 2.0 18.017 2.1 2.1 20.138 4.7 4.7 24.7
287 35.4 35.4 60.1323 39.9 39.9 100.0811 100.0 100.0
01: One02: Two
03: Three04: Four05: Five06: Six
07: Seven08: Eight09: Nine10: Ten
97: Not heard98: No opinionTotal
ValidFrequency Percent
ValidPercent
Cumulative Percent
Q23a: Now I will read out the names of few places. Please tell me if in youropinion should Manipur hills be included in the proposed Greater Nagaland?
344 42.4 42.4 42.4291 35.9 35.9 78.3176 21.7 21.7 100.0811 100.0 100.0
1: No2: Yes8: DK/Can't sayTotal
ValidFrequency Percent
ValidPercent
Cumulative Percent
Q23b: Now I will read out the names of few places. Please tell me if in youropinion should Mayanmar hills be included in the proposed Greater
Nagaland?
286 35.3 35.3 35.3341 42.1 42.1 77.3184 22.7 22.7 100.0811 100.0 100.0
1: No2: Yes8: DK/Can't sayTotal
ValidFrequency Percent
ValidPercent
Cumulative Percent
Q23c: Now I will read out the names of few places. Please tell me if in youropinion should parts of Upper Assam be included in the proposed Greater
Nagaland?
250 30.8 30.8 30.8324 39.9 39.9 70.8237 29.2 29.2 100.0811 100.0 100.0
1: No2: Yes8: DK/Can't sayTotal
ValidFrequency Percent
ValidPercent
Cumulative Percent

31
Q23d: Now I will read out the names of few places. Please tell me if in youropinion should parts of Mizoram be included in the proposed Greater
Nagaland?
432 53.2 53.2 53.296 11.9 11.9 65.1
283 34.9 34.9 100.0811 100.0 100.0
1: No2: Yes8: DK/Can't sayTotal
ValidFrequency Percent
ValidPercent
Cumulative Percent
Q24: In an ordinary week, how regularly do you read newspaper-daily, 5-6 times ina week, 2-4 times a week, once or twice or never?
302 37.2 37.2 37.276 9.4 9.4 46.699 12.2 12.2 58.895 11.8 11.8 70.6
129 16.0 16.0 86.5109 13.5 13.5 100.0811 100.0 100.0
1: Daily2: 5-6 times in a week3: 2-4 times in a week4: 1-2 days5: Never8: Can't sayTotal
ValidFrequency Percent
ValidPercent
Cumulative Percent
Q25: In an ordinary week, how regularly do you listen to news on radio-more thanonce a day, once a day, 5-6 times a week, 2-4 times a week, once or twice or
never?
186 22.9 22.9 22.9159 19.6 19.6 42.5
31 3.9 3.9 46.4115 14.1 14.1 60.5
83 10.2 10.2 70.7123 15.2 15.2 85.9114 14.1 14.1 100.0811 100.0 100.0
1: Once a day2: More than once a day3: 5-6 times in a week4: 2-4 times in a week
5: 1-2 days6: Never8: Can't sayTotal
ValidFrequency Percent
ValidPercent
Cumulative Percent

32
Q26: In an ordinary week, how regularly do you watch news on TV-more than oncea day, once a day, 5-6 times a week, 2-4 times a week, once or twice or never?
157 19.3 19.3 19.3
185 22.8 22.8 42.150 6.1 6.1 48.284 10.4 10.4 58.582 10.1 10.1 68.7
79 9.8 9.8 78.4175 21.6 21.6 100.0811 100.0 100.0
1: Once a day
2: More than once a day3: 5-6 times in a week4: 2-4 times in a week5: 1-2 days
6: Never8: Can't sayTotal
ValidFrequency Percent
ValidPercent
Cumulative Percent
Q27: Thinking how you or your family have voted in the past few elections, howwould you describe yourself, would you say you have been a Congress supporter,
NPF supporter or you have not been a supporter of any one party?
321 39.5 39.5 39.5278 34.3 34.3 73.8
126 15.5 15.5 89.3
50 6.2 6.2 95.536 4.5 4.5 100.0
811 100.0 100.0
1: Congress supporter2: NPF supporter3: Supporter of noparticular party7: Others8: Can't say/D.KTotal
ValidFrequency Percent
ValidPercent
Cumulative Percent
Q28: Now I will ask you about the assembly elections held in past in yourvillage/locality. Do you think that elections were conducted fairly, somewhat
fairly or unfairly?
156 19.2 19.2 19.2382 47.2 47.2 66.4209 25.8 25.8 92.2
63 7.8 7.8 100.0811 100.0 100.0
1: Unfairly2: Somewhat fairly3: Fairly8: Can't say/D.KTotal
ValidFrequency Percent
ValidPercent
Cumulative Percent
Q29: What about the forthcoming assembly elections. Do you think that in yourvillage/locality the elections will be conducted fairly, somewhat fairly or
unfairly?
95 11.7 11.7 11.7272 33.5 33.5 45.3189 23.3 23.3 68.6255 31.4 31.4 100.0811 100.0 100.0
1: Unfairly2: Somewhat fairly3: Fairly8: Can't say/D.KTotal
ValidFrequency Percent
ValidPercent
Cumulative Percent
33
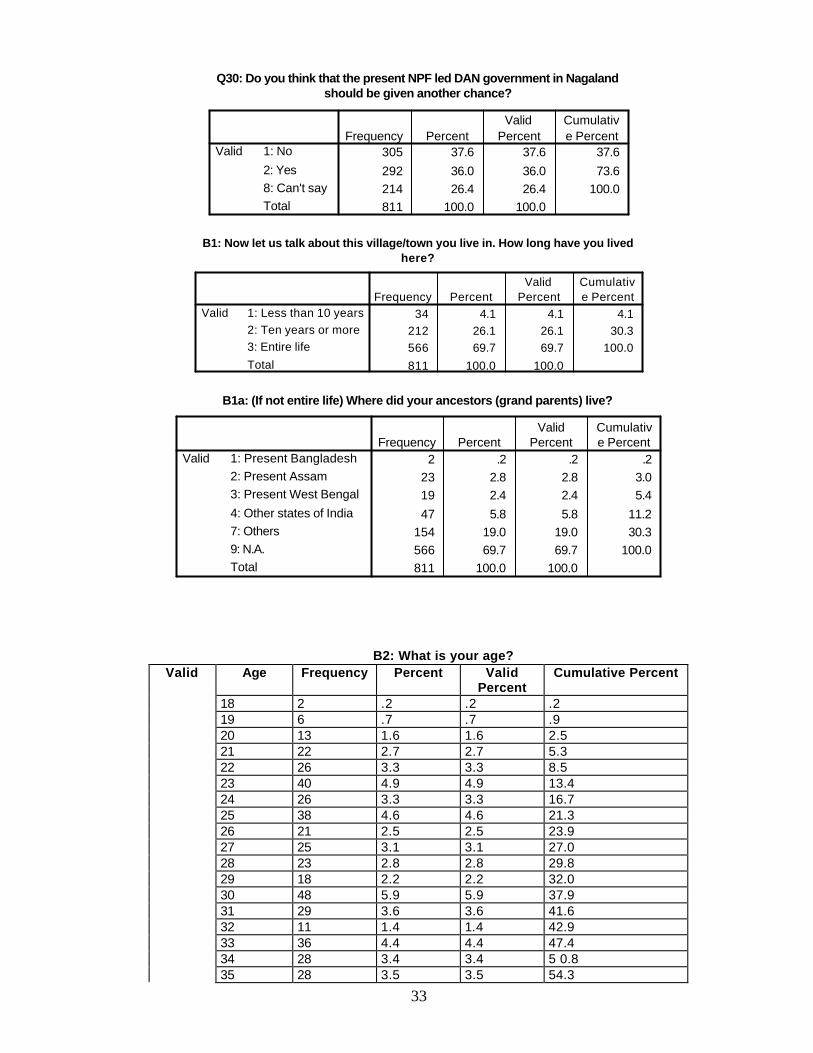
Q30: Do you think that the present NPF led DAN government in Nagalandshould be given another chance?
305 37.6 37.6 37.6
292 36.0 36.0 73.6214 26.4 26.4 100.0811 100.0 100.0
1: No
2: Yes8: Can't sayTotal
ValidFrequency Percent
ValidPercent
Cumulative Percent
B1: Now let us talk about this village/town you live in. How long have you livedhere?
34 4.1 4.1 4.1212 26.1 26.1 30.3566 69.7 69.7 100.0
811 100.0 100.0
1: Less than 10 years2: Ten years or more3: Entire life
Total
ValidFrequency Percent
ValidPercent
Cumulative Percent
B1a: (If not entire life) Where did your ancestors (grand parents) live?
2 .2 .2 .223 2.8 2.8 3.019 2.4 2.4 5.4
47 5.8 5.8 11.2154 19.0 19.0 30.3566 69.7 69.7 100.0811 100.0 100.0
1: Present Bangladesh2: Present Assam3: Present West Bengal
4: Other states of India7: Others9: N.A.Total
ValidFrequency Percent
ValidPercent
Cumulative Percent
B2: What is your age? Age Frequency Percent Valid
Percent Cumulative Percent
18 2 .2 .2 .2 19 6 .7 .7 .9 20 13 1.6 1.6 2.5 21 22 2.7 2.7 5.3 22 26 3.3 3.3 8.5 23 40 4.9 4.9 13.4 24 26 3.3 3.3 16.7 25 38 4.6 4.6 21.3 26 21 2.5 2.5 23.9 27 25 3.1 3.1 27.0 28 23 2.8 2.8 29.8 29 18 2.2 2.2 32.0 30 48 5.9 5.9 37.9 31 29 3.6 3.6 41.6 32 11 1.4 1.4 42.9 33 36 4.4 4.4 47.4 34 28 3.4 3.4 5 0.8
Valid
35 28 3.5 3.5 54.3

34
36 7 .9 .9 55.2 37 9 1.2 1.2 56.4 38 24 3.0 3.0 59.4 39 14 1.7 1.7 61.1 40 23 2.8 2.8 63.9 41 15 1.8 1.8 65.7 42 17 2.1 2.1 67.9 43 22 2.7 2.7 70.6 44 6 .7 .7 71.3 45 17 2.1 2.1 73.4 46 5 .6 .6 74.0 47 5 .6 .6 74.6 48 17 2.0 2.0 76.7 49 8 1.0 1.0 77.7 50 10 1.2 1.2 78.9 51 16 2.0 2.0 80.8 52 9 1.2 1.2 82.0 53 16 2.0 2.0 84.0 54 6 .7 .7 84.7 55 16 1.9 1.9 86.7 56 4 .5 .5 87.1 57 10 1.2 1.2 88.3 58 10 1.2 1.2 89.5 59 4 .4 .4 90.0 60 4 .5 .5 90.5 61 7 .9 .9 91.3 62 5 .6 .6 92.0 63 7 .8 .8 92.8 64 6 .7 .7 93.5 65 7 .8 .8 94.3 66 1 .1 .1 94.4 67 2 .2 .2 94.7 68 7 .9 .9 95.6 69 2 .2 .2 95.8 70 4 .5 .5 96.4 71 4 .5 .5 96.8 72 1 .1 .1 96.9 73 3 .4 .4 97.3 74 2 .2 .2 97.6 75 3 .4 .4 97.9 76 1 .1 .1 98.0 77 1 .1 .1 98.2 78 3 .4 .4 98.6 79 2 .2 .2 98.8 80 2 .2 .2 99.0 81 1 .1 .1 99.1 82 2 .2 .2 99.4 84 1 .1 .1 99.5 85 1 .1 .1 99.6 86 2 .3 .3 99.9 89 1 .1 .1 100.0 Total 811 100.0 100.0

35
B3: Gender
408 50.4 50.4 50.4403 49.6 49.6 100.0811 100.0 100.0
1: Male2: FemaleTotal
ValidFrequency Percent
ValidPercent
Cumulative Percent
B4: What is your marital status?
514 63.4 63.4 63.4243 30.0 30.0 93.3
11 1.4 1.4 94.7
7 .8 .8 95.6
33 4.1 4.1 99.73 .3 .3 100.0
811 100.0 100.0
1: Married2: Unmarried
3: Living with someone,but unmarried4: Divorced/Separated
5: WidowedN.A.Total
ValidFrequency Percent
ValidPercent
Cumulative Percent
B5: Till what level have you studied(Respondent)?
87 10.7 10.7 10.768 8.3 8.3 19.0
125 15.4 15.4 34.5
182 22.4 22.4 56.9123 15.2 15.2 72.0
124 15.3 15.3 87.4
88 10.8 10.8 98.110 1.3 1.3 99.4
5 .6 .6 100.0
811 100.0 100.0
0: Non Literate1: Below Primary
2: Primary pass/Middlefail3: Middle pass/Matric fail4: Matric
5: Intermediate/Collegeno degree6: Graduate or equivalent7: Post Graduate
8: Professional Degreesand Higher ResearchTotal
ValidFrequency Percent
ValidPercent
Cumulative Percent
36
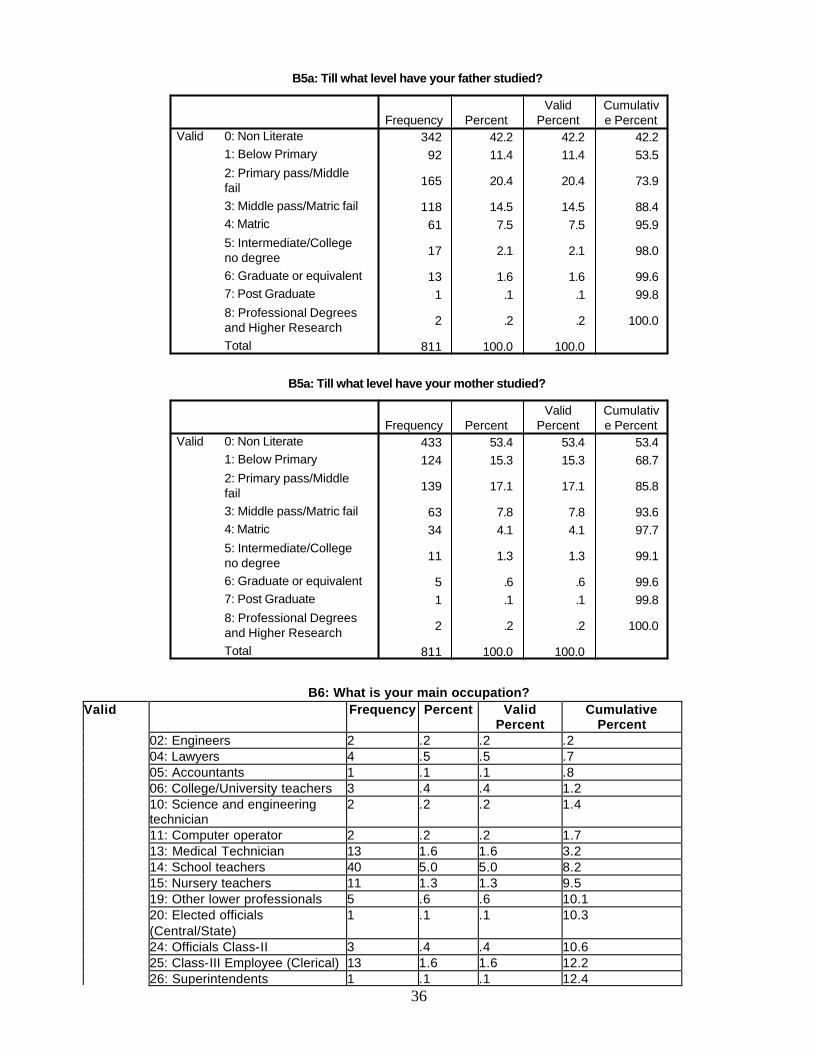
B5a: Till what level have your father studied?
342 42.2 42.2 42.292 11.4 11.4 53.5
165 20.4 20.4 73.9
118 14.5 14.5 88.461 7.5 7.5 95.9
17 2.1 2.1 98.0
13 1.6 1.6 99.61 .1 .1 99.8
2 .2 .2 100.0
811 100.0 100.0
0: Non Literate1: Below Primary
2: Primary pass/Middlefail3: Middle pass/Matric fail4: Matric
5: Intermediate/Collegeno degree6: Graduate or equivalent7: Post Graduate
8: Professional Degreesand Higher ResearchTotal
ValidFrequency Percent
ValidPercent
Cumulative Percent
B5a: Till what level have your mother studied?
433 53.4 53.4 53.4124 15.3 15.3 68.7
139 17.1 17.1 85.8
63 7.8 7.8 93.634 4.1 4.1 97.7
11 1.3 1.3 99.1
5 .6 .6 99.61 .1 .1 99.8
2 .2 .2 100.0
811 100.0 100.0
0: Non Literate1: Below Primary
2: Primary pass/Middlefail3: Middle pass/Matric fail4: Matric
5: Intermediate/Collegeno degree6: Graduate or equivalent7: Post Graduate
8: Professional Degreesand Higher ResearchTotal
ValidFrequency Percent
ValidPercent
Cumulative Percent
B6: What is your main occupation? Frequency Percent Valid
Percent Cumulative
Percent 02: Engineers 2 .2 .2 .2 04: Lawyers 4 .5 .5 .7 05: Accountants 1 .1 .1 .8 06: College/University teachers 3 .4 .4 1.2 10: Science and engineering technician
2 .2 .2 1.4
11: Computer operator 2 .2 .2 1.7 13: Medical Technician 13 1.6 1.6 3.2 14: School teachers 40 5.0 5.0 8.2 15: Nursery teachers 11 1.3 1.3 9.5 19: Other lower professionals 5 .6 .6 10.1 20: Elected officials (Central/State)
1 .1 .1 10.3
24: Officials Class-II 3 .4 .4 10.6 25: Class-III Employee (Clerical) 13 1.6 1.6 12.2
Valid
26: Superintendents 1 .1 .1 12.4

37
27: Traditional clerks 3 .4 .4 12.7 28: Class IV employee 18 2.3 2.3 15.0 30: Big businessmen 3 .3 .3 15.3 31: Medium businessmen 12 1.5 1.5 16.8 32: Small businessmen 21 2.6 2.6 19.4 33: Petty business 22 2.7 2.7 22.1 36: Salespersons 4 .4 .4 22.6 37: Shop Assistants 5 .7 .7 23.3 38: Rentire 6 .7 .7 24.0 39: Other businessmen 1 .1 .1 24.1 40: Waiters 1 .1 .1 24.2 43: Ayahs, Maids, Domestic servants
1 .1 .1 24.4
44: Chowkidars 8 1.0 1.0 25.4 45: Sweepers 4 .5 .5 25.9 49: Other service workers 8 1.0 1.0 26.9 50: Mechanics 15 1.9 1.9 28.7 51: Electricians 4 .5 .5 29.2 53: Tailors 3 .3 .3 29.5 54: Weavers 1 .1 .1 29.7 56: Blacksmiths 1 .1 .1 29.8 57: Carpainters 16 1.9 1.9 31.7 59: Other skilled workers 2 .2 .2 32.0 61: Measons 1 .1 .1 32.1 62: Potters 1 .1 .1 32.2 63: Stone-cutter and carvers 12 1.5 1.5 33.7 64: Furniture, basket, mat makers
2 .2 .2 33.9
66: Unskilled labourers 3 .3 .3 34.2 70: Owner-cultivators 20+ Acres 10 1.2 1.2 35.4 71: Owner-cultivators 10-20 Acres
6 .7 .7 36.1
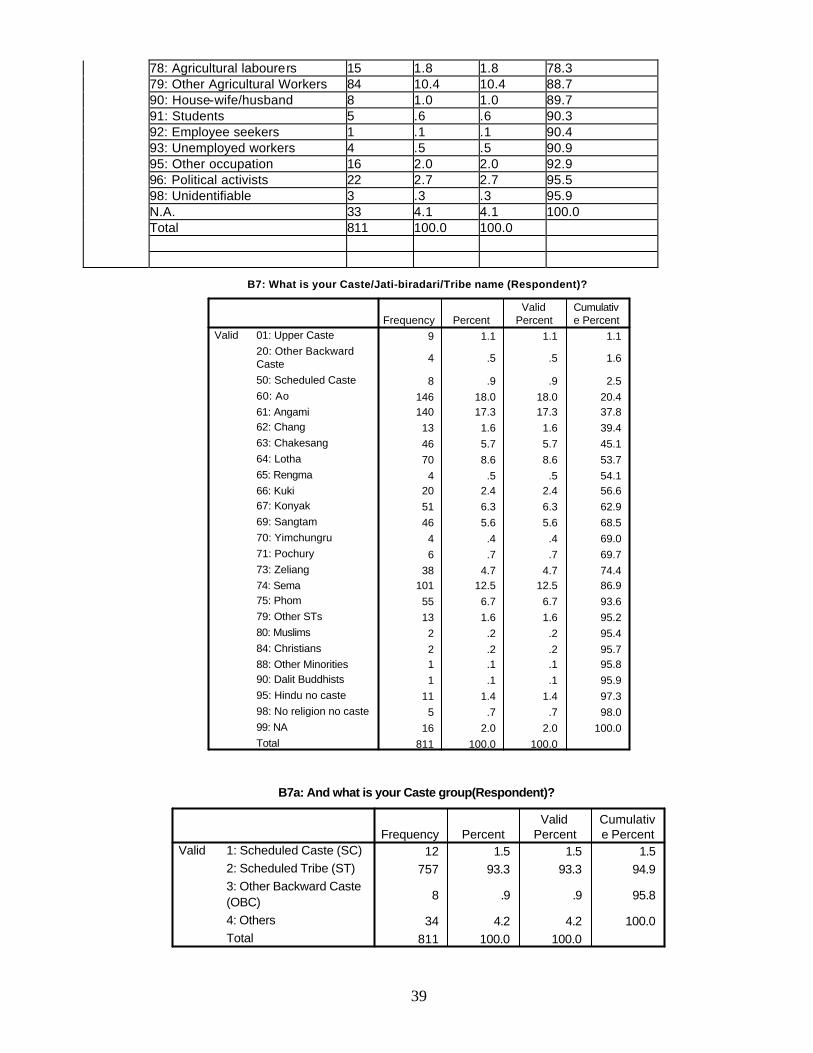
72: Owner-cultivators 5-10 Acres 16 2.0 2.0 38.1 73: Owner-cultivators 1-5 Acres 44 5.4 5.4 43.5 74: Owner-cultivators 0-1 Acre 6 .7 .7 44.2 75: Tenant Cultivators. 5+ acres 5 .7 .7 44.8 Tenant Cultivators 0-5 acres 16 2.0 2.0 46.8 77: Plantation workers 2 .2 .2 47.1 78: Agricultural labourers 15 1.8 1.8 48.9 79: Other Agricultural Workers 33 4.0 4.0 52.9 90: House-wife/husband 168 20.8 20.8 73.7 91: Students 82 10.1 10.1 83.8 92: Employee seekers 77 9.5 9.5 93.2 93: Unemployed workers 14 1.7 1.7 95.0 95: Other occupation 5 .7 .7 95.7 96: Political activists 14 1.7 1.7 97.4 98: Unidentifiable 5 .6 .6 98.0 N.A. 16 2.0 2.0 100.0 Total 811 100.0 100.0
B6a: What is/was/has been the main occupation of the main earner of the respondent's household?
Frequency Percent Valid Percent
Cumulative Percent
02: Engineers 2 .2 .2 .2 04: Lawyers 1 .1 .1 .3 06: College/University teachers 3 .4 .4 .7
Valid
07: Writers 4 .4 .4 1.1

38
08: Modern Artist 1 .1 .1 1.3 09: Other higher professional 1 .1 .1 1.4 10: Science and engineering technician
1 .1 .1 1.5
11: Computer operator 1 .1 .1 1.6 13: Medical Technician 13 1.6 1.6 3.2 14: School teachers 34 4.2 4.2 7.4 15: Nursery teachers 13 1.7 1.7 9.0 16: Folk and commercial artist 1 .1 .1 9.1 18: Priests 4 .5 .5 9.6 19: Other lower professionals 11 1.3 1.3 10.9 21: Elected officials (District) 2 .2 .2 11.2 24: Officials Class-II 4 .5 .5 11.6 25: Class-III Employee (Clerical) 25 3.1 3.1 14.7 26: Superintendents 2 .2 .2 14.9 27: Traditional clerks 13 1.6 1.6 16.5 28: Class IV employee 37 4.5 4.5 21.0 29: Other administrative workers 4 .4 .4 21.5 30: Big businessmen 1 .1 .1 21.6 31: Medium businessmen 21 2.5 2.5 24.1 32: Small businessmen 26 3.2 3.2 27.3 33: Petty business 30 3.7 3.7 31.0 34: Hawkers 3 .3 .3 31.3 35: Sales Executive 2 .2 .2 31.6 36: Salespersons 1 .1 .1 31.7 37: Shop Assistants 5 .6 .6 32.2 38: Rentire 10 1.2 1.2 33.4 39: Other businessmen 2 .2 .2 33.6 42: Barbers 1 .1 .1 33.7 43: Ayahs, Maids, Domestic servants
2 .2 .2 34.0
44: Chowkidars 9 1.2 1.2 35.1 45: Sweepers 3 .4 .4 35.5 49: Other service workers 14 1.7 1.7 37.2 50: Mechanics 25 3.1 3.1 40.4 51: Electricians 7 .8 .8 41.2 53: Tailors 4 .4 .4 41.6 54: Weavers 1 .1 .1 41.7 56: Blacksmiths 2 .2 .2 42.0 57: Carpainters 16 2.0 2.0 44.0 59: Other skilled workers 7 .8 .8 44.9 61: Measons 3 .3 .3 45.2 62: Potters 2 .2 .2 45.4 63: Stone-cutter and carvers 13 1.6 1.6 47.1 64: Furniture, basket, mat makers
6 .7 .7 47.8
66: Unskilled labourers 4 .4 .4 48.2 69: Other semi-skilled and unskilled workers
1 .1 .1 48.3
70: Owner-cultivators 20+ Acres 34 4.2 4.2 52.5 71: Owner-cultivators 10-20 Acres
28 3.4 3.4 56.0
72: Owner-cultivators 5-10 Acres 34 4.2 4.2 60.2 73: Owner-cultivators 1-5 Acres 83 10.3 10.3 70.5 74: Owner-cultivators 0-1 Acre 12 1.5 1.5 72.0 75: Tenant Cultivators. 5+ acres 14 1.7 1.7 73.6 Tenant Cultivators 0-5 acres 19 2.3 2.3 76.0 77: Plantation workers 5 .6 .6 76.5
39
78: Agricultural labourers 15 1.8 1.8 78.3 79: Other Agricultural Workers 84 10.4 10.4 88.7 90: House-wife/husband 8 1.0 1.0 89.7 91: Students 5 .6 .6 90.3 92: Employee seekers 1 .1 .1 90.4 93: Unemployed workers 4 .5 .5 90.9 95: Other occupation 16 2.0 2.0 92.9 96: Political activists 22 2.7 2.7 95.5 98: Unidentifiable 3 .3 .3 95.9 N.A. 33 4.1 4.1 100.0 Total 811 100.0 100.0
B7: What is your Caste/Jati-biradari/Tribe name (Respondent)?
9 1.1 1.1 1.1
4 .5 .5 1.6
8 .9 .9 2.5146 18.0 18.0 20.4140 17.3 17.3 37.813 1.6 1.6 39.446 5.7 5.7 45.170 8.6 8.6 53.74 .5 .5 54.1
20 2.4 2.4 56.651 6.3 6.3 62.946 5.6 5.6 68.54 .4 .4 69.06 .7 .7 69.7
38 4.7 4.7 74.4101 12.5 12.5 86.955 6.7 6.7 93.613 1.6 1.6 95.22 .2 .2 95.42 .2 .2 95.71 .1 .1 95.81 .1 .1 95.9
11 1.4 1.4 97.35 .7 .7 98.0
16 2.0 2.0 100.0811 100.0 100.0
01: Upper Caste20: Other BackwardCaste50: Scheduled Caste60: Ao61: Angami62: Chang63: Chakesang64: Lotha65: Rengma66: Kuki67: Konyak69: Sangtam70: Yimchungru71: Pochury73: Zeliang74: Sema75: Phom79: Other STs80: Muslims84: Christians88: Other Minorities90: Dalit Buddhists95: Hindu no caste98: No religion no caste99: NATotal
ValidFrequency Percent
ValidPercent
Cumulative Percent
B7a: And what is your Caste group(Respondent)?
12 1.5 1.5 1.5757 93.3 93.3 94.9
8 .9 .9 95.8
34 4.2 4.2 100.0811 100.0 100.0
1: Scheduled Caste (SC)2: Scheduled Tribe (ST)3: Other Backward Caste(OBC)4: OthersTotal
ValidFrequency Percent
ValidPercent
Cumulative Percent

40
B8: Which religion do you follw? (Respondent)
46 5.6 5.6 5.66 .7 .7 6.3
746 92.0 92.0 98.3
2 .2 .2 98.61 .1 .1 98.7
10 1.3 1.3 100.0811 100.0 100.0
1: Hindu2: Muslim3: Christian
6: Jain7: Parsi8: OthersTotal
ValidFrequency Percent
ValidPercent
Cumulative Percent
B9: Generally, which language is spoken in your house?
Languages Frequency Percent Valid Percent
Cumulative Percent
01: Telugu 1 .1 .1 .1 02: English 1 .1 .1 .2 03: Assamese 3 .3 .3 .6 04: Hindi 6 .7 .7 1.3 11: Malayalam 1 .1 .1 1.4 14: Manipuri/Meithei 1 .1 .1 1.5 18: Oriya 1 .1 .1 1.6 19: Punjabi 1 .1 .1 1.7 21: Nepali/Gokhali 13 1.6 1.6 3.4 25: Bengali 9 1.1 1.1 4.4 32: Bhojpuri 3 .3 .3 4.8 40: Gondi 1 .1 .1 4.9 58: Sirmauri 1 .1 .1 5.0 60: Kinnauri 19 2.4 2.4 7.4 61: Gujjari 75 9.3 9.3 16.7 64: Naga 6 .7 .7 17.4 68: Tangkhul 1 .1 .1 17.5 70: Ao 130 16.1 16.1 33.6 71: Sema 95 11.8 11.8 45.3 72: Konyak 50 6.2 6.2 51.5 74: Lepcha 4 .4 .4 52.0 79: Mishing 2 .2 .2 52.2 82: Other Indian Language 63 7.8 7.8 60.0 83: Other South Asian Language
1 .1 .1 60.2
87 1 .1 .1 60.3 96 1 .1 .1 60.4 97 1 .1 .1 60.5 99: NA 320 39.5 39.5 100.0
Valid
Total 811 100.0 100.0
B10: Area/Locality
645 79.5 79.5 79.5
161 19.9 19.9 99.45 .6 .6 100.0
811 100.0 100.0
1: Village
2: Town(Below 1 Lakh)3: City (above 1 Lakh)Total
ValidFrequency Percent
ValidPercent
Cumulative Percent

41
B10a: (If Town/City) Type of house
646 79.6 79.6 79.6
22 2.7 2.7 82.3
42 5.2 5.2 87.5
38 4.6 4.6 92.1
28 3.5 3.5 95.6
2 .2 .2 95.8
7 .9 .9 96.7
1 .1 .1 96.8
25 3.0 3.0 99.91 .1 .1 100.0
811 100.0 100.0
0: NA1: House/Flat with 4 ormore bedrooms2: House/Flat with 3 or4 Bedrooms
3: House/Flat with 3bedrooms4: House/flats with 2pucca rooms (withkitchen)5: House/Flat with 2pucca rooms(Withoutkitchen6: House with 1 puccarooms(With kitchen)7: House with 1 puccarooms(without kitchen
8: Mainly Kutcha house9: Slum/JJ/Fully KutchaTotal
ValidFrequency Percent
ValidPercent
Cumulative Percent
B10b: (If Village), Type of House
175 21.5 21.5 21.5139 17.2 17.2 38.7265 32.7 32.7 71.4
193 23.8 23.8 95.239 4.8 4.8 100.0
811 100.0 100.0
0: NA1: Pucca
2: Pucca-Kutcha3: Kutcha4: HutTotal
ValidFrequency Percent
ValidPercent
Cumulative Percent
B11: Total number of family member(Adult)
2 .2 .2 .271 8.7 8.7 9.0
477 58.8 58.8 67.7
73 9.0 9.0 76.771 8.7 8.7 85.452 6.4 6.4 91.827 3.3 3.3 95.0
20 2.5 2.5 97.514 1.7 1.7 99.2
6 .8 .8 100.0811 100.0 100.0
0: Blank/NA1: One2: Two
3: Three4: Four5: Five6: Six
7: Seven8: Eight9: Nine and aboveTotal
ValidFrequency Percent
ValidPercent
Cumulative Percent
42
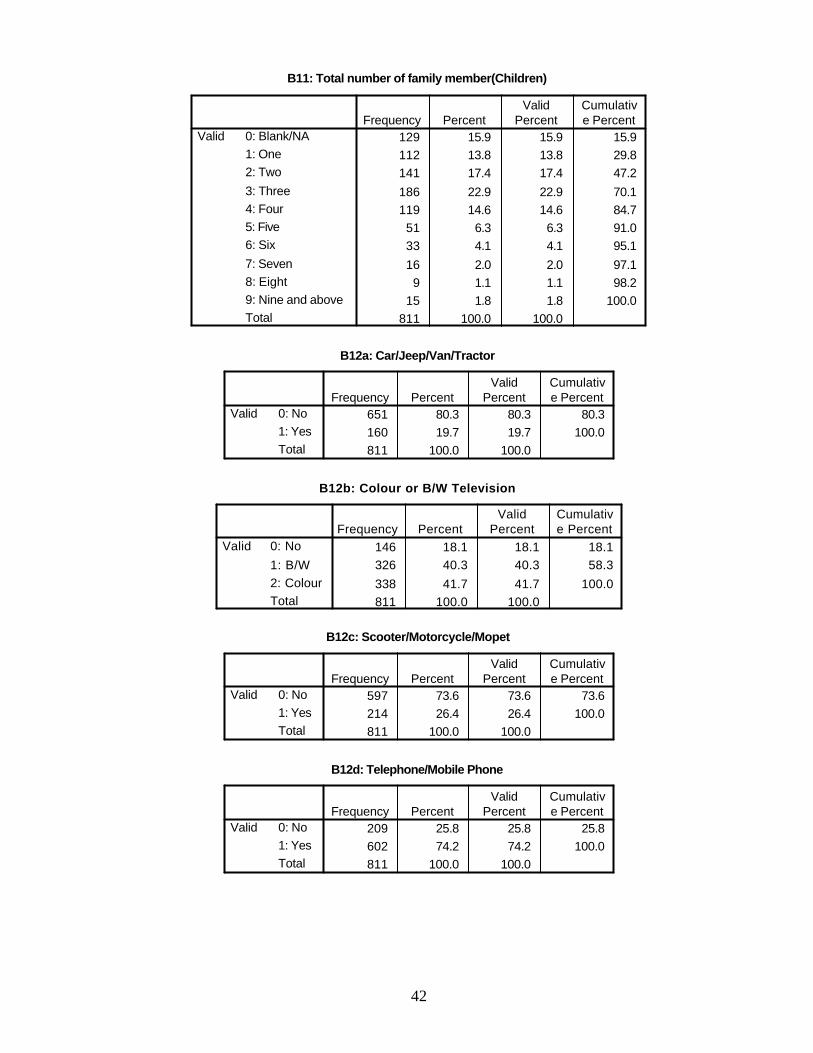
B11: Total number of family member(Children)
129 15.9 15.9 15.9112 13.8 13.8 29.8141 17.4 17.4 47.2
186 22.9 22.9 70.1119 14.6 14.6 84.7
51 6.3 6.3 91.033 4.1 4.1 95.1
16 2.0 2.0 97.19 1.1 1.1 98.2
15 1.8 1.8 100.0811 100.0 100.0
0: Blank/NA1: One2: Two
3: Three4: Four5: Five6: Six
7: Seven8: Eight9: Nine and aboveTotal
ValidFrequency Percent
ValidPercent
Cumulative Percent
B12a: Car/Jeep/Van/Tractor
651 80.3 80.3 80.3160 19.7 19.7 100.0811 100.0 100.0
0: No1: YesTotal
ValidFrequency Percent
ValidPercent
Cumulative Percent
B12b: Colour or B/W Television
146 18.1 18.1 18.1326 40.3 40.3 58.3
338 41.7 41.7 100.0811 100.0 100.0
0: No
1: B/W2: ColourTotal
ValidFrequency Percent
ValidPercent
Cumulative Percent
B12c: Scooter/Motorcycle/Mopet
597 73.6 73.6 73.6214 26.4 26.4 100.0811 100.0 100.0
0: No1: YesTotal
ValidFrequency Percent
ValidPercent
Cumulative Percent
B12d: Telephone/Mobile Phone
209 25.8 25.8 25.8602 74.2 74.2 100.0811 100.0 100.0
0: No1: YesTotal
ValidFrequency Percent
ValidPercent
Cumulative Percent

43
B12e: Electric fan/cooler
579 71.4 71.4 71.4232 28.6 28.6 100.0811 100.0 100.0
0: No1: YesTotal
ValidFrequency Percent
ValidPercent
Cumulative Percent
B12f: Bicycle
677 83.5 83.5 83.5134 16.5 16.5 100.0811 100.0 100.0
0: No1: YesTotal
ValidFrequency Percent
ValidPercent
Cumulative Percent
B12g: Radio/Transistor
199 24.5 24.5 24.5612 75.5 75.5 100.0811 100.0 100.0
0: No1: YesTotal
ValidFrequency Percent
ValidPercent
Cumulative Percent
B12h: Pumping set
710 87.6 87.6 87.6100 12.4 12.4 100.0811 100.0 100.0
0: No1: YesTotal
ValidFrequency Percent
ValidPercent
Cumulative Percent
B12i: Fridge
636 78.5 78.5 78.5175 21.5 21.5 100.0811 100.0 100.0
0: No1: YesTotal
ValidFrequency Percent
ValidPercent
Cumulative Percent
B12j: Cow/Buffalow
699 86.2 86.2 86.257 7.0 7.0 93.2
30 3.7 3.7 96.820 2.5 2.5 99.3
2 .2 .2 99.5
1 .1 .1 99.63 .4 .4 100.0
811 100.0 100.0
0: Blank/NA
1: One2: Two3: Three5: Five
6: Six9: Nine and aboveTotal
ValidFrequency Percent
ValidPercent
Cumulative Percent
44
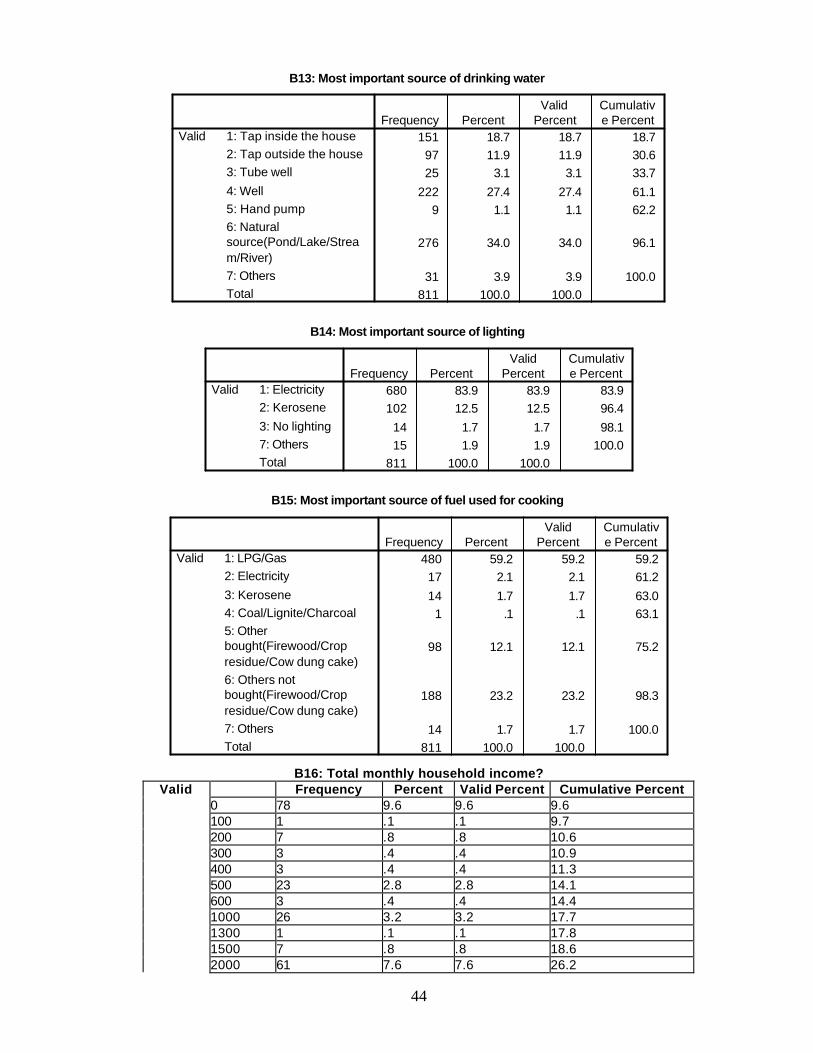
B13: Most important source of drinking water
151 18.7 18.7 18.797 11.9 11.9 30.625 3.1 3.1 33.7
222 27.4 27.4 61.19 1.1 1.1 62.2
276 34.0 34.0 96.1
31 3.9 3.9 100.0811 100.0 100.0
1: Tap inside the house2: Tap outside the house3: Tube well
4: Well5: Hand pump6: Naturalsource(Pond/Lake/Stream/River)7: OthersTotal
ValidFrequency Percent
ValidPercent
Cumulative Percent
B14: Most important source of lighting
680 83.9 83.9 83.9102 12.5 12.5 96.4
14 1.7 1.7 98.115 1.9 1.9 100.0
811 100.0 100.0
1: Electricity2: Kerosene
3: No lighting7: OthersTotal
ValidFrequency Percent
ValidPercent
Cumulative Percent
B15: Most important source of fuel used for cooking
480 59.2 59.2 59.217 2.1 2.1 61.2
14 1.7 1.7 63.01 .1 .1 63.1
98 12.1 12.1 75.2
188 23.2 23.2 98.3
14 1.7 1.7 100.0811 100.0 100.0
1: LPG/Gas2: Electricity
3: Kerosene4: Coal/Lignite/Charcoal5: Otherbought(Firewood/Cropresidue/Cow dung cake)6: Others notbought(Firewood/Cropresidue/Cow dung cake)7: OthersTotal
ValidFrequency Percent
ValidPercent
Cumulative Percent
B16: Total monthly household income?
Frequency Percent Valid Percent Cumulative Percent 0 78 9.6 9.6 9.6 100 1 .1 .1 9.7 200 7 .8 .8 10.6 300 3 .4 .4 10.9 400 3 .4 .4 11.3 500 23 2.8 2.8 14.1 600 3 .4 .4 14.4 1000 26 3.2 3.2 17.7 1300 1 .1 .1 17.8 1500 7 .8 .8 18.6
Valid
2000 61 7.6 7.6 26.2

45
2200 1 .1 .1 26.3 2500 6 .7 .7 27.0 3000 98 12.1 12.1 39.1 3200 1 .1 .1 39.2 3500 7 .8 .8 40.1 3600 1 .1 .1 40.2 3800 1 .1 .1 40.3 4000 70 8.6 8.6 49.0 4001 1 .1 .1 49.1 4500 4 .5 .5 49.6 4600 1 .1 .1 49.7 5000 92 11.3 11.3 61.1 5200 1 .1 .1 61.2 5400 1 .1 .1 61.3 5500 1 .1 .1 61.4 5600 1 .1 .1 61.5 5695 1 .1 .1 61.7 5700 1 .1 .1 61.8 6000 53 6.5 6.5 68.3 6095 1 .1 .1 68.4 6300 1 .1 .1 68.5 6400 1 .1 .1 68.6 6905 1 .1 .1 68.8 7000 50 6.1 6.1 74.9 7001 1 .1 .1 75.0 7050 1 .1 .1 75.1 7200 1 .1 .1 75.3 7310 1 .1 .1 75.4 8000 44 5.4 5.4 80.8 8200 2 .2 .2 81.0 8500 4 .5 .5 81.5 8600 2 .3 .3 81.8 8900 1 .1 .1 81.9 9000 29 3.5 3.5 85.4 9200 1 .1 .1 85.6 9500 1 .1 .1 85.7 10000 40 5.0 5.0 90.6 11000 4 .4 .4 91.1 12000 14 1.7 1.7 92.8 12600 2 .2 .2 93.0 12800 1 .1 .1 93.2 13000 6 .7 .7 93.9 13600 1 .1 .1 94.0 14000 8 1.0 1.0 95.0 15000 19 2.3 2.3 97.3 16000 2 .2 .2 97.5 17000 2 .2 .2 97.8 18000 1 .1 .1 97.9 20000 4 .5 .5 98.4 24000 1 .1 .1 98.5 25000 2 .3 .3 98.8 28000 1 .1 .1 98.9 30000 4 .5 .5 99.4 40000 1 .1 .1 99.5 50000 3 .3 .3 99.9 99999 1 .1 .1 100.0 Total 811 100.0 100.0

46
III: ANNEXURE-3 VOTE SHARE BY DIFFERENT CATEGORIES OF VOTER
Category NPF Congress BJP Others* All 34 36 5 25 A. Gender Male 34 38 6 22 Female 34 34 5 27 B. Age Up to 25 yrs 32 35 8 25 26-35 yrs 35 35 8 22 36-45 yrs 31 41 3 25 46-55 yrs 32 39 3 26 56 yrs. And above 42 30 3 25 C. Education Non-Literate 38 22 ---- 40 Up-to Primary 36 36 8 20 Up-to Matric 34 39 6 21 College and above 31 37 4 27 D. Tribe Angami 65 31 2 1 Konyak 55 45 --- -- Chakeshang 52 30 --- 18 Ao 32 45 --- 23 Sema 20 39 6 35
Lotha 17 20 26 37 Other Nagas** 29 38 7 26 Others* 14 11 14 61
D. Urban- Rural Rural 35 35 5 25 Urban 32 39 8 21
Source: CSDS Data Bank- Nagaland Assembly Election Study, Pre-Poll – 2008, Weighted Data Sets Note: All figures in percent. ‘No opinion’ excluded from analysis. *Others include NCP, RJD, JD(S), JD (U), LJP, UNDP, APP and Independents. ** Other Nagas include Rengma, Chang, Sangtam, Yimchuangam, Pochury, Zeliang, Mao, Tankhul, etc. *** Others include all the Non- Naga tribes and other Indian communities.
Question wording: “If Assembly elections are held tomorrow which party or candidate will you vote for? Please mark your vote on this slip and put it in this box. If you don’t find the symbol of the party you will vote for, please mark your vote in the blank space given below. (Supply Yellow dummy ballot paper, record its number and explain the procedure.)”