a report on the health of vermont’s...
TRANSCRIPT

Page 1
A Report on the Health of Vermont’s Environment
The Vermont Agency of Natural Resources
2011

Vermont Department of Environmental Conservation
“We learned from the 2011 floods that preventing flood damage and protecting the environment go hand in hand. Investments to maintain, protect, and restore our river floodplains and wetlands and our working landscape of farms and forests are the most important investments we can make to reduce future flood damage. Making these investments will also pay significant dividends for our fisheries, wildlife habitat, and lake and river water quality.” — David K. Mears, Commissioner
Vermont Fish & Wildlife Department
“Vermont’s fish and wildlife resources have evolved over time to adapt and recover from environmental change and ecological disturbance. This adaptation is a remarkable feature of our natural world. Vermonters share a similar characteristic in which we experience, learn, adapt, and thrive. We call this resiliency. This distinctive Vermont attribute highlights both our understanding of the connection to each other, our land, and our water, and the inextricable link of our cultural and natural heritage.” — Patrick Berry, Commissioner
Vermont Department of Forests, Parks & Recreation
“Vermont’s landscape of linked terrestrial and aquatic ecosystems and their associated players and processes has demonstrated extraordinary resilience over a very long period of change and human development. That resiliency has always been based on diversity and adaptability. As players ourselves in those ecosystems, our adaptability defines our capacity to influence that resiliency. To adapt to and benefit from change is both our responsibility and our opportunity.” — Michael C. Snyder, Commissioner
“ I am so proud of the thousands of Vermonters who have come together to rebuild Vermont better than before. Together we will succeed in making our communities and our ecosystems
more resilient for future generations.”
— Governor Peter Shumlin
Page 1
Resiliency — the ability to adapt to difficult situations and successfully overcome adversity
2011 was an extraordinary year for Vermonters. Spring flooding in Lake Champlain broke records, only to be overshadowed by the devastation wrought by Tropical Storm Irene in August. The losses experienced by Vermont families, our communities, and our ecosystems were immense. The Agency of Natural Resources (ANR) experienced this firsthand when our Waterbury offices flooded, forcing the agency to set up temporary offices in many scattered locations.
Research shows that people with strong social networks are more resilient than those without them. When people come together to rebuild, great innovation can result. Vermont’s history, from the early settlers in the 1700s to the great flood of 1927, demonstrates the truth of this research. Now, again, communities are coming together to reinvent themselves in the wake of the loss suffered by so many. Vermonters are a model of resiliency.
So too are our ecosystems. Like our communities, they will be better able to bounce back from the damage caused by recent flooding, as well as avoid future damage, if the surrounding environment supports healing. This year, our agency is asking: What can we do to make our ecosystems and our communities more resilient in the future, not only to extreme flooding, but also to other environmental threats that could affect the future of our state?
To invite dialogue about this important question, we decided to revive an old and valuable ANR tradition. Each year between 1994 and 2003, we published a report describing key indicators of the health of our water, air, forests, and wildlife. This year, we begin again.
We have many assets for building resilience. Vermonters understand the close ties between the quality of our environment and the quality of our lives, the vigor of our economy, and our health. We have a wealth of sound scientific information to help us understand the challenges we face and the steps we might take to meet them. And we have many dedicated environmental and community organizations working alongside us to address complex environmental problems.
I have great hope for our future and ask that you join us in our efforts to strengthen our environment for this and future generations.
Sincerely,
Deb MarkowitzSecretary, Agency of Natural Resources
From the Secretary Thank You
After Tropical Storm Irene, our employees headed to locations all over Vermont and worked extraordinarily long days to respond to crises caused by the damage. Many of them — including members of our Spill Response Team; our river experts; our water system and wastewater system engineers; and others — went well beyond what we asked them to do in this time. We offer them profound appreciation and thanks for their assistance.
In every area affected by flooding in 2011, Vermonters gathered and went immediately to work helping other Vermonters.
Page 2
TIntroduction A Year of Floods
The impacts on Vermont’s natural environment from the year’s extreme floodwaters were wide ranging and include the following:
Impacts on Aquatic Life and Habitat. Ten of Vermont’s 17 river basins underwent intense flooding. Many experienced channel enlargement and relocation, and sediment deposition. This alteration of habitat for fish and macroinvertebrates had profound impacts, although short-term improvement is expected in river reaches that have been left to recover naturally. Surveys in the Mad and Dog River watersheds confirmed that trout populations have been reduced in places by more than 50 percent of preflood levels. Otter, mink, and other animals that rely on fish for food may be affected. Additionally, more than 80,000 trout were lost when the state fish hatchery in Roxbury was destroyed.
Surface Water Contamination. Hazardous waste — such as household chemicals and heating fuels — washed from basements into raging rivers and contaminated floodwaters, sediments and soils, and groundwater. Millions of gallons of sewage from damaged wastewater systems were discharged.
Lake Pollution. Large volumes of phosphorus, arguably the pollutant of greatest concern in Lake Champlain, washed down watersheds and into the lake. The Winooski and the Missisquoi rivers delivered almost three times as much phosphorus to the lake as they do during an average year. Excessive phosphorus pollution caused algae blooms to occur, disrupting the natural ecology and interfering with recreation that supports local economies.
he Agency of Natural Resources is pleased to present this report on the health of Vermont’s environment.
Most of us will never forget the historic floods of 2011 and the damage they delivered to our homes, farms, businesses, and public infrastructure such as roads, water systems, and bridges. The impacts on Vermont’s natural environment were also severe.
As we continue to bounce back, we have a unique opportunity to reflect and learn. Hardship reminds us that we must continually strengthen our understanding of the major risks facing our ecosystems and our communities. It prompts us to ask: What can we do to minimize these risks? And how can we prepare for adversity if some risks cannot be fully mitigated?
The theme for this report is inspired by this learning moment. It is RESILIENCE.
Spread of Invasives. Floodwaters carried invasive plants and seeds to riparian (riverside) forests, floodplains, and agricultural areas, accelerating their spread.
Pathways to Greater Resilience
The flooding in 2011 might seem like a generational event, yet catastrophic floods have occurred many times in Vermont in the last 100 years. Repeated flood recovery efforts are extremely expensive for our state and communities. Figure 1 shows the costs of past damage. Seven floods between 1955 and 2008 caused damages in the range of $5 to $20 million, and four caused damages in excess of $20 million.
This report examines how we can reduce the risk of severe damage from future flooding in Vermont by improving the way we manage river corridors. It describes how some river valley communities are protecting and restoring floodplains that dampen floodwaters, while avoiding development in areas that are especially vulnerable to flood erosion hazards.
In addition to the flood risks on all of our minds right now, there are other significant risks facing our ecosystems and communities that we must address proactively in the coming years.
» Changes in local climate may introduce gradual or sudden new stresses to our forest, river, and lake ecosystems.
» Infestations of invasive pests in our forests could result in the widespread loss of trees and alterations to habitats.
» Mercury pollution could affect our health and the health of fish, fish-eating birds such as loons, and mammals if levels are not curtailed.
This floodplain located in Waitsfield’s commercial district helped dampen floodwaters from the Mad River during Irene. The community uses the floodplain for recreational fields. Protecting and restoring floodplains in or near developed areas creates multiple benefits for river valley communities.

Page 3
1955 1960 1965 1970 1975 1980 1985 1990 1995 2000 2005 2008
30
20
10
0
Mill
ions
in U
.S. D
olla
rs
YEAR
Mis
sing
Da
ta: 1
976,
197
8-19
82
$255 million $93.5 million $30.2 million
Figure 1: Costs of Flooding 1955-2008
» Continuing patterns of lakeshore development that strip natural vegetation from shorelines could cause significant deterioration in lake and lakeshore habitats.
» Aging water and wastewater systems could become more vulnerable to flooding and failures that could result in environmental damage.
» Forest fragmentation and habitat conversion could reduce the resilience of animal and plant populations, while also increasing risks from flooding.
This report provides the latest scientific information that our agency has about these risks. It does not describe all the varied work underway at the Agency of Natural Resources, but instead explores pathways that we are taking, along with many partners, to build the resilience of Vermont’s ecosystems and communities in the face of these risks. In addition to protecting and restoring floodplains that attenuate floodwaters, we are currently working on the following:
» Reducing Vermont’s emissions of greenhouse gases and developing wise climate adaptation strategies
» Detecting invasive pests early and responding swiftly to prevent their spread
» Supporting federal controls on the emissions of mercury from upwind power plants
» Conserving a connected network of unfragmented forests and wetlands that supply habitats for native wildlife and plants
» Protecting the lakeshore vegetation important for maintaining healthy lake habitats and reducing erosion when lake levels are high
» Developing plans for upgrading infrastructure and increasing its flood resiliency
We hope you will join us on these pathways to greater resilience.
Route 4 sustained severe damage from the powerful erosive flows of Mendon
Brook during Irene. Seventy-five percent of Vermont’s streams and rivers lack natural
access to their floodplains and are at risk of major changes to the shape and
location of their channels.
Source: National Center for Atmospheric Research Extreme Weather Sourcebook; VT Emergency Management

Page 4
Addressing Climate Change
cientific knowledge about climate change is constantly growing. Volumes of peer-reviewed scientific research now show that atmospheric concentrations of greenhouse gases are rising rapidly, and the earth’s climate is warming in response.
Vermont’s small towns and verdant hillsides seem far removed from the world’s bustling cities and smokestacks, but scientific data collected in our state show that we are already experiencing changes in local climate here.
We can take steps today to build the resilience of our communities, economy, and environment to the long-term impacts of climate change. Collecting data to evaluate how climate is shifting in Vermont is essential, as are reducing Vermont’s contribution to the global pool of greenhouse gases and choosing wise strategies for adapting to a changing climate.
S
Can Vermont lead by example, significantly reducing its greenhouse gas emissions from energy use associated with state vehicles and buildings?
Trends in Vermont’s Climate
During the past 50 years, Vermont’s climate has shown a clear warming trend in all seasons, and especially in winter. Average winter temperatures have risen about 4.5 degrees Fahrenheit over this period, and average summer temperatures have risen about 2 degrees Fahrenheit (Figure 1). This warming trend is projected to continue in the future.
Despite the variability in our weather from day to day or year to year, it is clear that natural processes in Vermont are responding to the warming trend. Data analyzed by atmospheric researcher Alan Betts show the following changes that have occurred, on average, over the last 40 years:
» The growing season for frost-sensitive plants has increased by two weeks.
» The ice-out of Vermont’s small lakes has come roughly three days earlier per decade, and the first freeze-up has occurred about four days later per decade. As a result, lakes and ponds, such as Stiles Pond in northeastern Vermont, are frozen each winter for about four weeks less than they were 40 years ago.
» The first leaf of Vermont lilacs, an indicator of early spring, is also occurring earlier, by an average of approximately three days per decade.
Other changes in Vermont’s climate provide harbingers of what we can expect in the future. Average annual
precipitation has increased by 15 to 20 percent in the past 50 years. Across the Northeast, heavy downpours have increased in frequency and intensity too; these storms now release 67 percent more rain than they did 50 years ago. These trends could increase flooding in Vermont in the future.
Changes in local climate will affect our environment in many ways. They also are likely to affect activities dependent on seasonal climate patterns, such as maple sugaring, farming, timber harvesting, and winter sports.
Meeting Goals for Reducing Greenhouse Gas Emissions
Vermont has an ambitious goal: reducing statewide emissions of greenhouse gases (GHG) to 50 percent below the level of our 1990 emissions by the year 2028. The Vermont Legislature codified this goal into law in 2006.
Summer mean Trend line
1960 1970 1980 1990 2000 2010
YEAR
Win
ter m
ea
n (˚
F)
25
20
15
70
65
60
Summ
er m
ea
n (˚F)
Winter mean Trend line
Figure 1: Vermont Temperature Trends
Source: www.alanbetts.com

Page 5
The VeRmonT ClimaTe CabineT
n May 2011, Governor Shumlin convened a Climate Cabinet to catalyze and coordinate climate change work across Vermont state government. Chaired by the Secretary of ANR, the Climate Cabinet includes senior officials from eight state agencies.
In 2011, the Climate Cabinet worked closely with the Department of Public Service to finalize a comprehensive new energy plan for Vermont. This plan will guide Vermont’s transition to cleaner renewable energy sources to help eliminate or significantly reduce carbon emissions.
In the next few years, the Cabinet will pursue four priorities: (1) increasing the use of electric and hybrid electric vehicles; (2) implementing the new energy plan; (3) reducing emissions from state buildings and operations; and (4) developing good metrics to track Vermont’s progress.
I
1990 1992 1994 1996 1998 2000 2002 2004 2006 2008 2010 2012 2014 2016 2018 2020 2022 2024 2026 2028
10
9
8
7
6
5
4
3
GH
G E
mis
sio
ns (
MM
TCO
)
50% below 1990 levels by 2028
25% below 1990 levels by 2012
Vermont’s Historic Gross GHG Emissions
Vermont’s GHG Reduction Targets
Assumed Emissions Trajectory
Figure 2: GhG emission Trends
Transportation: 46.9%
Fossil Fuel Industry: 0.2%Industrial Process: 3.6%Waste: 3.2%
Agriculture: 10.5%
Electricity: 4.1%
Industrial Fuel Use: 6%
Residential/Commercial Fuel Use: 25.6%
Figure 3: 2008 VT Gross GhG emissions by Sector
Most of Vermont’s GHG emissions are from the combustion of fossil fuels for transportation and for heating buildings (Figure 3). We can track our progress in reducing the emissions from these sources through an “emissions inventory” developed and periodically updated by the Agency of Natural Resources (ANR).
Vermont’s emissions have declined slowly but steadily since a peak that occurred in 2004 (Figure 2). The economic downturn, higher fuel prices, and recent warmer winters helped turn our emissions trend downward by prompting decreases in energy consumption.
Some of the decline, though, was the result of specific programs and policies. For example, in 1999 the Vermont Legislature created Efficiency Vermont, the nation’s first ratepayer-funded energy efficiency utility. Since then, a range of programs to promote lightbulb change-outs, appliance replacements, and building weatherization have resulted in savings of over 660 million kilowatt hours
(kWh) of electricity over ten years, and reduced GHG emissions by over 400,000 tons. This reduction in emissions equates to about 11 percent of Vermont’s GHG emissions from electricity usage in 2008.
Transportation accounts for the largest share of Vermont’s GHG emissions (approximately 47 percent). Transportation emissions have declined in Vermont since 2004, as the total number of miles driven in the state has declined. Additional reductions are expected as a result of Vermont’s adoption of California’s GHG emissions standards and zero emission vehicle (ZEV) requirements. These provisions of Vermont’s Low Emission Vehicle (LEV) program promote the use of clean advanced technology vehicles, including those powered by higher-efficiency internal combustion, hybrid electric, and battery electric engines.
Meeting Vermont’s emissions goal will require new policies and programs to promote actions that
reduce emissions, such as developing more public transit services, promoting compact development in village centers, and avoiding sprawl. It will be hard work. But our small size, our habit of working in partnership, and our strong ethic of environmental protection make it possible to develop innovative new strategies here. Vermont has an opportunity to become a national leader in addressing climate change, a leader that can inspire other states to take action.
Developing Climate Resiliency
Some impacts from climate change will be impossible to avoid, no matter how well we curtail global emissions in the coming years. This is because the greenhouse gases already in our atmosphere will persist for a very long time.
Our resilience will depend in large measure on our ability to adapt to those unavoidable impacts. ANR is currently assessing where and how Vermont’s forests, fisheries, wildlife, and water resources will be most vulnerable. The assessment will include strategies for helping our natural resources adapt over time, such as protecting and restoring floodplains to help attenuate river flooding.

Page 6
Reducing Air Pollution How can we most effectively ensure future reductions in Vermont sulfur and mercury pollution from both local and upwind sources?
S Trends in Sulfur Pollution
Sulfur air pollution begins as emissions of sulfur dioxide gas primarily from burning fossil fuels. In the atmosphere, sulfur dioxide is transformed into tiny particles of sulfuric acid and other sulfate compounds, which are the predominant cause of regional haze in Vermont.
Sulfates are also a major component of fine particle pollution, which causes respiratory and cardiovascular disease and mortality. When sulfates are eventually cleansed from the air — by rain, snow, and dry deposition — they form the major ingredient in acid rain, which adversely affects Vermont’s lakes, streams, and forest soils.
Over the past 20 years, a variety of control programs required by the 1990 Clean Air Act have reduced the national emissions of sulfur dioxide from more than 20 million tons a year in 1990 to less than 10 million tons a year in 2010.
The results of upwind sulfur emission reductions are starting to be seen in Vermont. There are downward trends in sulfate particles in the air and in sulfate concentrations in precipitation and surface waters (Figure 1). These reductions should, over time, result in
ulfur and mercury have long been two of Vermont’s most insidious air pollutants. They contaminate our air, rain, and snow, and they affect our health and that of our environment. Vermont’s own emissions of these pollutants are among the lowest in the nation. The problem we face is that most of the sulfur and mercury pollution in our air comes from upwind states, and especially from coal-burning power plants.
Gradual reductions in sulfur emissions from upwind power plants over the past 20 years are beginning to result in lower levels of sulfur pollution here. Mercury emissions from some sources such as incinerators have also been reduced, but upwind power plant emissions have not yet been controlled, and airborne mercury deposition in Vermont has not declined.
New rules and standards recently proposed by the U.S. Environmental Protection Agency (EPA) would result in large future reductions in sulfur and mercury emissions from upwind power plants. Unfortunately, these long-overdue EPA proposals are under attack in Congress and the federal courts.
1993 1995 1997 1999 2001 2003 2005 2007 2009
4
3
2
1
0PM
2.5
Sulfa
te (
µg/m
3 ) &
We
t Su
lfate
Co
nc
en
tra
tion
s (m
g/1
)(D
ata
sm
oo
the
d a
s 3-
yea
r ru
nn
ing
ave
rag
es)
YEAR
Bourn Pond Aquatic Sulfate (mg/l)Lye Brook Fine Particle Sulfate (µg/m3)Bennington Precipitation Sulfate (mg/l)
Figure 1: Sulfate Concentrations in Vermont
improvements in our health and that of our ecosystems.
Some environmental benefits can already be seen. For example, days of thick sulfate haze are less prevalent in Vermont. In the remote Lye Brook Wilderness Area, average visibility has improved from about 60 miles in the early 1990s to about 80 miles today. Visibility would increase to nearly 120 miles if sulfates and other air pollutants were eliminated.
In Bourn Pond, within the Lye Brook Wilderness Area, “acid neutralizing capacity” (ANC) has increased from near zero prior to 1990 to more than 20 microequivalents per liter (µeq/l) in recent years. ANC is a measure of how well water bodies or soils can buffer acid, reducing its effects on plants and animals.
Page 7
Medical WasteIncineratorsMunicipal WasteCombustorsCoal-BurningPower Plants
1990 2005
200
150
100
50
0
An
nu
al
Emiss
ion
s (t
on
s/yr
) fr
om
In
du
stria
l So
urc
es
YEAR
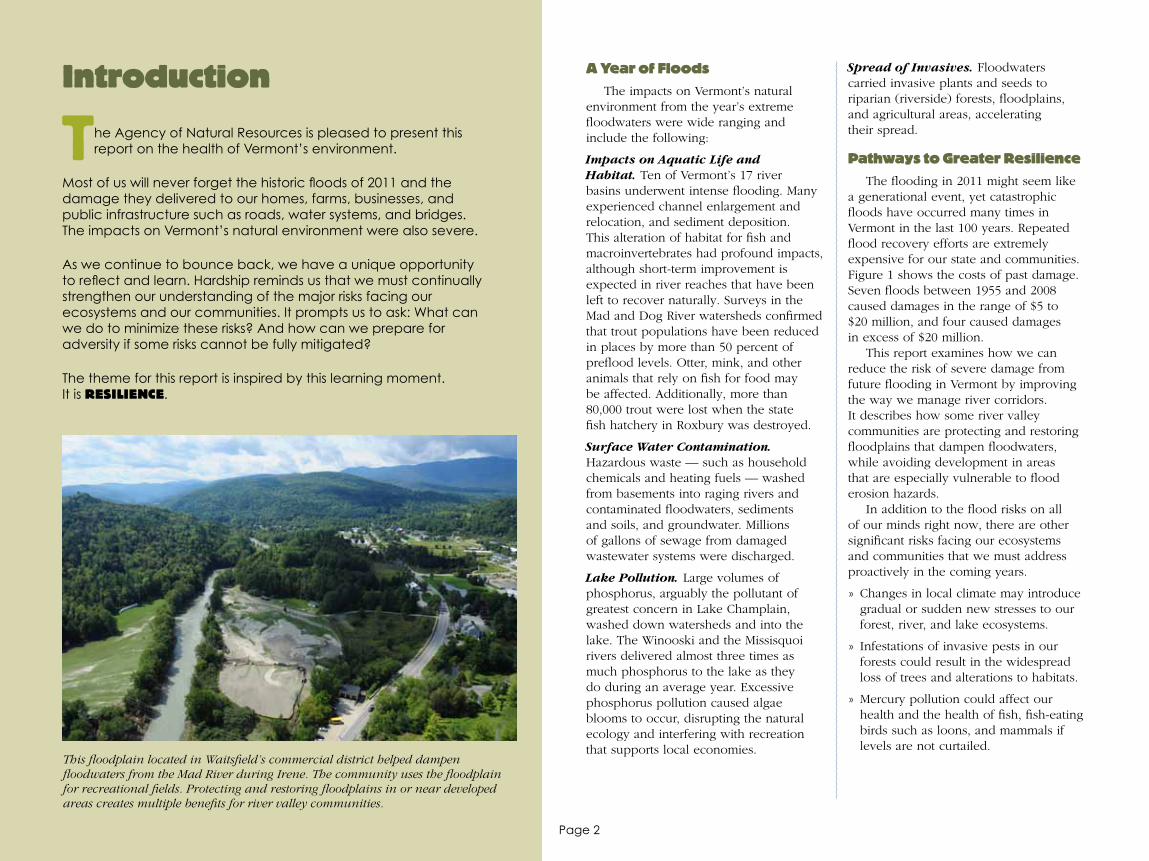
Figure 2: U.S. industrial mercury Sources
1993 1995 1997 1999 2001 2003 2005 2007 2009
25
20
15
10
5
03-Ye
ar A
vg W
et
De
po
sitio
n o
f Su
lfate
& M
erc
ury
YEAR
Sulfate Deposition (kg/ha)Mercury Deposition (µg/m2)
Figure 3: mercury & Sulfur Deposition in Underhill
An ANC of about 50 µeq/l is considered a threshhold above which some degree of “biological recovery” from acidification effects is expected. So although we have seen some progress, we still have a long way to go.
The good news is that EPA recently finalized the Cross-State Air Pollution Rule (CSAPR), setting lower limits for sulfur
and nitrogen emissions from power plants in upwind states. EPA estimates that CSAPR will result in health and environmental benefits of up to $360 million per year in Vermont by 2014.
However, the implementation of CSAPR has been stayed by the courts in response to a lawsuit by a number of states whose poorly controlled utilities will be affected. In the meantime, Vermont is working with other north-eastern states to reduce the sulfur content of our fuel oil, ensuring that our own contributions to the sulfur problem remain minimal.
Trends in Mercury Pollution
According to EPA estimates, U.S. air emissions of mercury (like those of sulfur) have been cut in half since 1990 (Figure 2). However, unlike with sulfur, there have been no substantial reductions in mercury emissions from coal-burning power plants upwind of Vermont, and we have seen no downward trend in
mercury deposition in Vermont (Figure 3). How concerned should we be about this trend? When mercury is deposited on soils and in water bodies, some of it is converted by microbial action to highly toxic methylmercury. Methylmercury then bioaccumulates (becomes more concentrated) in the bodies of larger animals that are high on the food chain, such as large fish, fish-eating birds such as loons and osprey, and fish-eating mammals such as otters and humans.
Elevated mercury causes abnormal behavior and
reduced growth and reproduction in fish and wildlife. In humans, methylmercury can damage the brain, heart, kidneys, lungs, and immune system. Young children and growing fetuses are especially susceptible to damage to their developing brains and nervous systems.
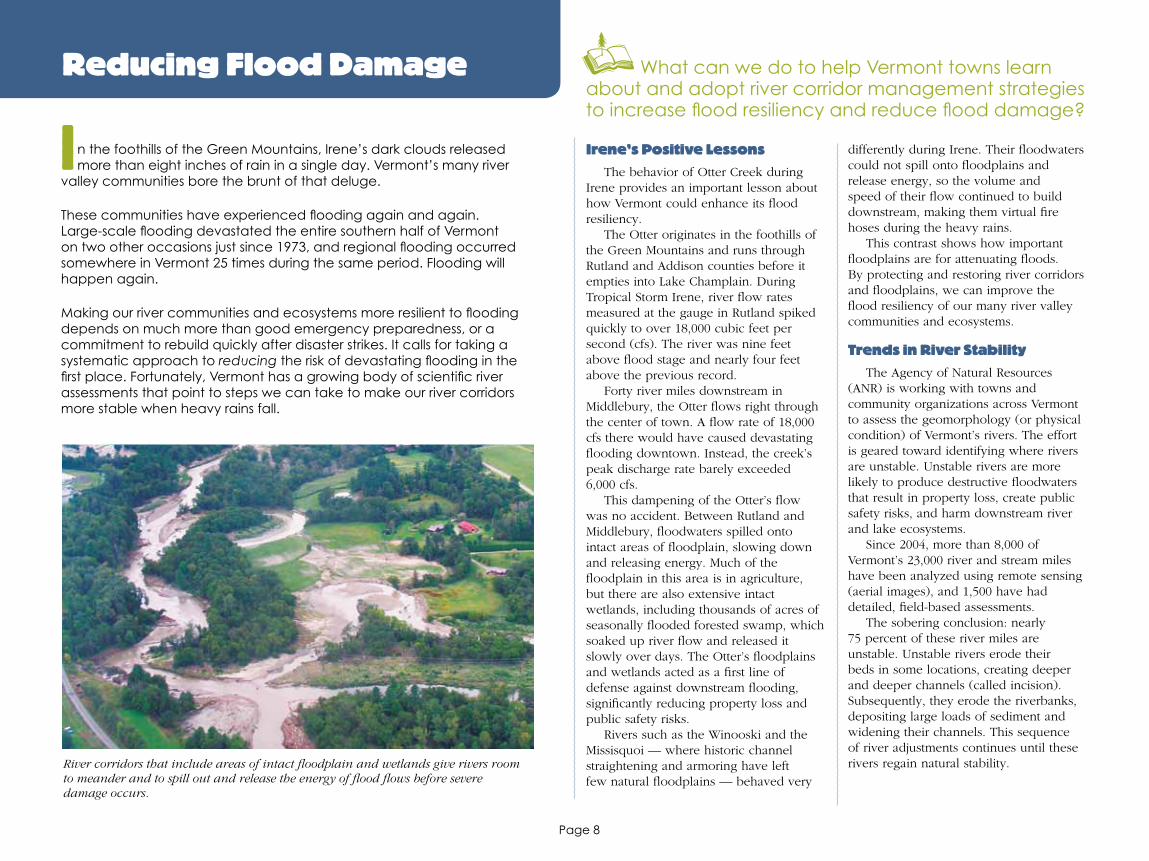
Here in Vermont, work to address mercury pollution in our environment has been underway for more than a decade. The Agency of Natural Resources (ANR) has partnered with the Vermont Advisory Committee on Mercury Pollution to reduce mercury use by businesses and schools, ban mercury-containing products, and educate the public about its health risks.
In December 2011, EPA set new Mercury and Air Toxic Standards (MATS) to reduce mercury, as well as arsenic, chromium, nickel, and sulfur dioxide, emissions from power plants. EPA estimates that the MATS rule will result in health benefits of up to $83 million in Vermont by 2016. Unfortunately, the implementation of MATS is not assured, as some members of Congress have already initiated actions to block or delay its implementation.
At the same time, our ability to continue measuring mercury in our air and precipitation is threatened by cuts in federal funding for key monitoring programs. Funding for Vermont’s only mercury wet deposition monitoring site was eliminated from the budget of the National Oceanographic and Atmospheric Administration in 2010, and EPA funding for Vermont’s only mercury dry deposition monitoring site was cut in 2011. The forecast for future mercury deposition in Vermont is . . . cloudy.
Loons with high levels of mercury accumulation experience brain lesions, difficulty flying and swimming, and lowered reproductive success. b
ReDUCinG meRCURy in VeRmonT
he Vermont Advisory Committee on Mercury Pollution works with ANR on reducing the release of mercury in Vermont and educating the public about the risks of mercury exposure from eating fish. The committee includes scientists, waste professionals, health professionals, and business owners. The partnership has made progress on many fronts, including the following:
» Promoting and implementing legislation banning the sale of many mercury-containing products and requiring the visible labeling of others
» Establishing mandatory manage- ment practices at dental clinics to reduce the release of mercury into wastewater
» Removing mercury from over 80 school laboratories and promoting legislation banning the use of mercury in classrooms
» Establishing recycling programs for existing mercury-containing products such as thermostats, fluorescent lights, automobile parts, and batteries
» Eliminating mercury-containing dairy manometers and mercury thermometers from sugaring operations
T
Source: U.S. EPA
Page 8
Reducing Flood Damage
I
What can we do to help Vermont towns learn about and adopt river corridor management strategies to increase flood resiliency and reduce flood damage?
Irene’s Positive Lessons
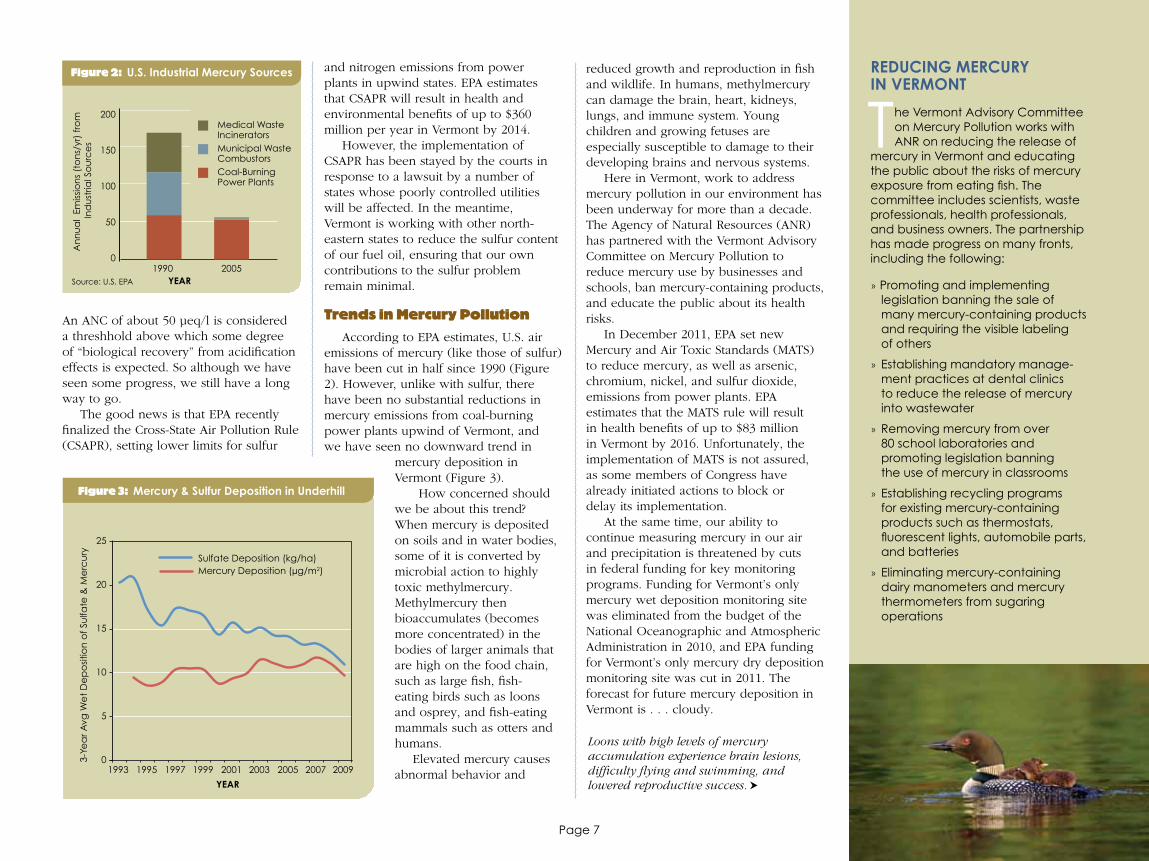
The behavior of Otter Creek during Irene provides an important lesson about how Vermont could enhance its flood resiliency.
The Otter originates in the foothills of the Green Mountains and runs through Rutland and Addison counties before it empties into Lake Champlain. During Tropical Storm Irene, river flow rates measured at the gauge in Rutland spiked quickly to over 18,000 cubic feet per second (cfs). The river was nine feet above flood stage and nearly four feet above the previous record.
Forty river miles downstream in Middlebury, the Otter flows right through the center of town. A flow rate of 18,000 cfs there would have caused devastating flooding downtown. Instead, the creek’s peak discharge rate barely exceeded 6,000 cfs.
This dampening of the Otter’s flow was no accident. Between Rutland and Middlebury, floodwaters spilled onto intact areas of floodplain, slowing down and releasing energy. Much of the floodplain in this area is in agriculture, but there are also extensive intact wetlands, including thousands of acres of seasonally flooded forested swamp, which soaked up river flow and released it slowly over days. The Otter’s floodplains and wetlands acted as a first line of defense against downstream flooding, significantly reducing property loss and public safety risks.
Rivers such as the Winooski and the Missisquoi — where historic channel straightening and armoring have left few natural floodplains — behaved very
differently during Irene. Their floodwaters could not spill onto floodplains and release energy, so the volume and speed of their flow continued to build downstream, making them virtual fire hoses during the heavy rains.
This contrast shows how important floodplains are for attenuating floods. By protecting and restoring river corridors and floodplains, we can improve the flood resiliency of our many river valley communities and ecosystems.
Trends in River Stability
The Agency of Natural Resources (ANR) is working with towns and community organizations across Vermont to assess the geomorphology (or physical condition) of Vermont’s rivers. The effort is geared toward identifying where rivers are unstable. Unstable rivers are more likely to produce destructive floodwaters that result in property loss, create public safety risks, and harm downstream river and lake ecosystems.
Since 2004, more than 8,000 of Vermont’s 23,000 river and stream miles have been analyzed using remote sensing (aerial images), and 1,500 have had detailed, field-based assessments.
The sobering conclusion: nearly 75 percent of these river miles are unstable. Unstable rivers erode their beds in some locations, creating deeper and deeper channels (called incision). Subsequently, they erode the riverbanks, depositing large loads of sediment and widening their channels. This sequence of river adjustments continues until these rivers regain natural stability.
n the foothills of the Green Mountains, Irene’s dark clouds released more than eight inches of rain in a single day. Vermont’s many river
valley communities bore the brunt of that deluge.
These communities have experienced flooding again and again. Large-scale flooding devastated the entire southern half of Vermont on two other occasions just since 1973, and regional flooding occurred somewhere in Vermont 25 times during the same period. Flooding will happen again.
Making our river communities and ecosystems more resilient to flooding depends on much more than good emergency preparedness, or a commitment to rebuild quickly after disaster strikes. It calls for taking a systematic approach to reducing the risk of devastating flooding in the first place. Fortunately, Vermont has a growing body of scientific river assessments that point to steps we can take to make our river corridors more stable when heavy rains fall.
River corridors that include areas of intact floodplain and wetlands give rivers room to meander and to spill out and release the energy of flood flows before severe damage occurs.

Page 9
The instability of Vermont’s rivers is the result of a centuries-old effort to engineer and contain stream flow. Thirty to fifty percent of Vermont’s river and stream miles have been straightened. Across the state, levees and berms have been constructed along river channels and on floodplains, stream banks have been armored, channels have been dredged, and riparian vegetation has been removed.
Unfortunately, this long-standing effort to reduce flooding has had the opposite effect. Containment structures such as levees and berms often cause a river to erode its beds. As channels deepen, the river can no longer spill out onto its original floodplain when water levels are
high. During major storm events, the speed and volume of flow inside the channel continue to build, threatening buildings, roads, bridges, culverts, and other infrastructure downstream that are located in the river channel or on remaining areas of floodplain.
Unstable rivers are hazardous not only to communities, but also to river and lake ecosystems. Their erosive high flows destroy the habitat of macroinvertebrates, fish, and riparian mammals such as otters and raccoons. They also send substantial quantities of sediment and phosphorus pollution to downstream lakes (see Cleaning Up Lake Champlain, page 11).
Now the good news: A quarter of our assessed rivers are in good shape; they have natural stability. Because their river flows don’t build as quickly when it rains, they are rich in biological life. They flood and erode less. And they deliver far less pollution to downstream lakes.
Community-Based River Corridor Planning
More than 170 communities in Vermont have used the results of geomorphic river assessments to undertake river corridor planning (Figure 1). This planning is helping these communities and their many partners — including watershed groups, land trusts, and conservation districts — return natural stability to rivers by protecting and restoring river corridors and floodplains. Actions they are taking include the following:
» Purchasing easements to protect remaining natural floodplains
» Developing maps of areas that are most vulnerable to flood erosion hazards and passing bylaws to limit development in those areas
» Carrying out restoration projects to rebuild functioning floodplains
These actions offer the most cost-effective way to reduce towns’ risks of future flooding, and also protect river
and lake ecosystems from the pollution and habitat damage that unstable rivers cause. In areas where patterns of land use development are well established, the only viable option may be to engineer projects that protect community infrastructure. However, opportunities often exist to protect or restore pockets of remaining floodplain even in developed areas. Significant floodplains and river corridors upstream and downstream of villages and farms offer real opportunities to give rivers more room to meander and develop healthier ecosystems and better floodplain function.
ANR is supporting these efforts to increase the natural stability of Vermont’s rivers by awarding state grants for river assessments, planning, and projects. Over $1 million was awarded to communities and their partners in 2011. Nevertheless, with over 75 percent of Vermont’s assessed river miles still in an unstable condition, much remains to be done to build flood resiliency across the state.
Total number of communities involved in river corridor planning: 170
Total Phase I geomorphic assessment completed: 145
Total Phase 2 geomorphic assessment completed: 150
Flood Erosion Hazard (FEH) projects underway or completed as part of town and/or river corridor plans: 64
Draft FEH maps completed: 84
FEH bylaws adopted by communities: 17
Figure 1: Community-based River Corridor Planning
Practices long used to contain high-energy floodwaters in channels — such as berming stream banks with dredge spoils — often lead to extensive erosion of stream beds and banks, and create risks for bridges, culverts, and buildings downstream.
Page 10Page 10
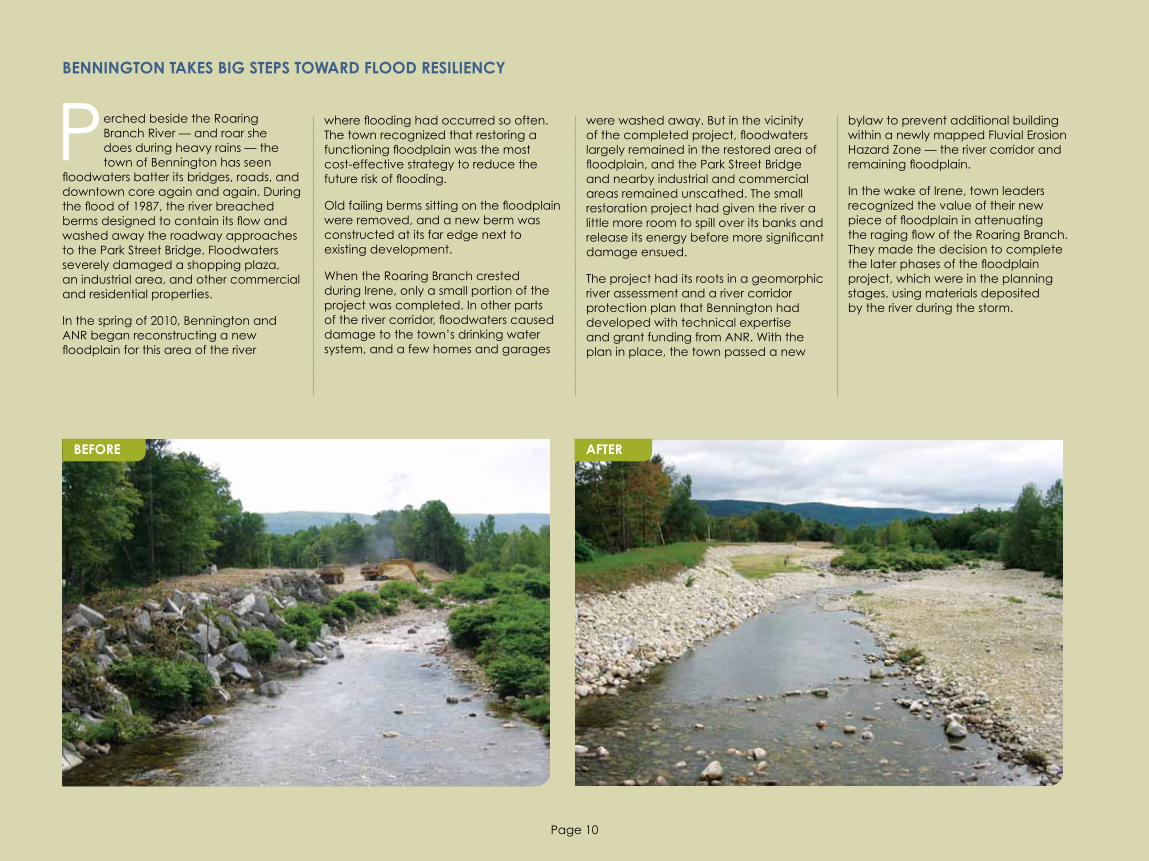
P erched beside the Roaring Branch River — and roar she does during heavy rains — the town of Bennington has seen floodwaters batter its bridges, roads, and downtown core again and again. During the flood of 1987, the river breached berms designed to contain its flow and washed away the roadway approaches to the Park Street Bridge. Floodwaters severely damaged a shopping plaza, an industrial area, and other commercial and residential properties.
In the spring of 2010, Bennington and ANR began reconstructing a new floodplain for this area of the river
where flooding had occurred so often. The town recognized that restoring a functioning floodplain was the most cost-effective strategy to reduce the future risk of flooding.
Old failing berms sitting on the floodplain were removed, and a new berm was constructed at its far edge next to existing development.
When the Roaring Branch crested during Irene, only a small portion of the project was completed. In other parts of the river corridor, floodwaters caused damage to the town’s drinking water system, and a few homes and garages
benninGTon TaKeS biG STePS ToWaRD FlooD ReSilienCy
were washed away. But in the vicinity of the completed project, floodwaters largely remained in the restored area of floodplain, and the Park Street Bridge and nearby industrial and commercial areas remained unscathed. The small restoration project had given the river a little more room to spill over its banks and release its energy before more significant damage ensued.
The project had its roots in a geomorphic river assessment and a river corridor protection plan that Bennington had developed with technical expertise and grant funding from ANR. With the plan in place, the town passed a new
bylaw to prevent additional building within a newly mapped Fluvial Erosion Hazard Zone — the river corridor and remaining floodplain.
In the wake of Irene, town leaders recognized the value of their new piece of floodplain in attenuating the raging flow of the Roaring Branch. They made the decision to complete the later phases of the floodplain project, which were in the planning stages, using materials deposited by the river during the storm.
60
40
20
0
30
20
10
0
30
20
10
0
30
20
10
0
60
40
20
0
Page 11
Cleaning Up Lake Champlain How can we develop new tools for identifying and reducing the most significant sources of nutrient pollution so that we can better target limited public resources?
L Trends in Phosphorus Pollution
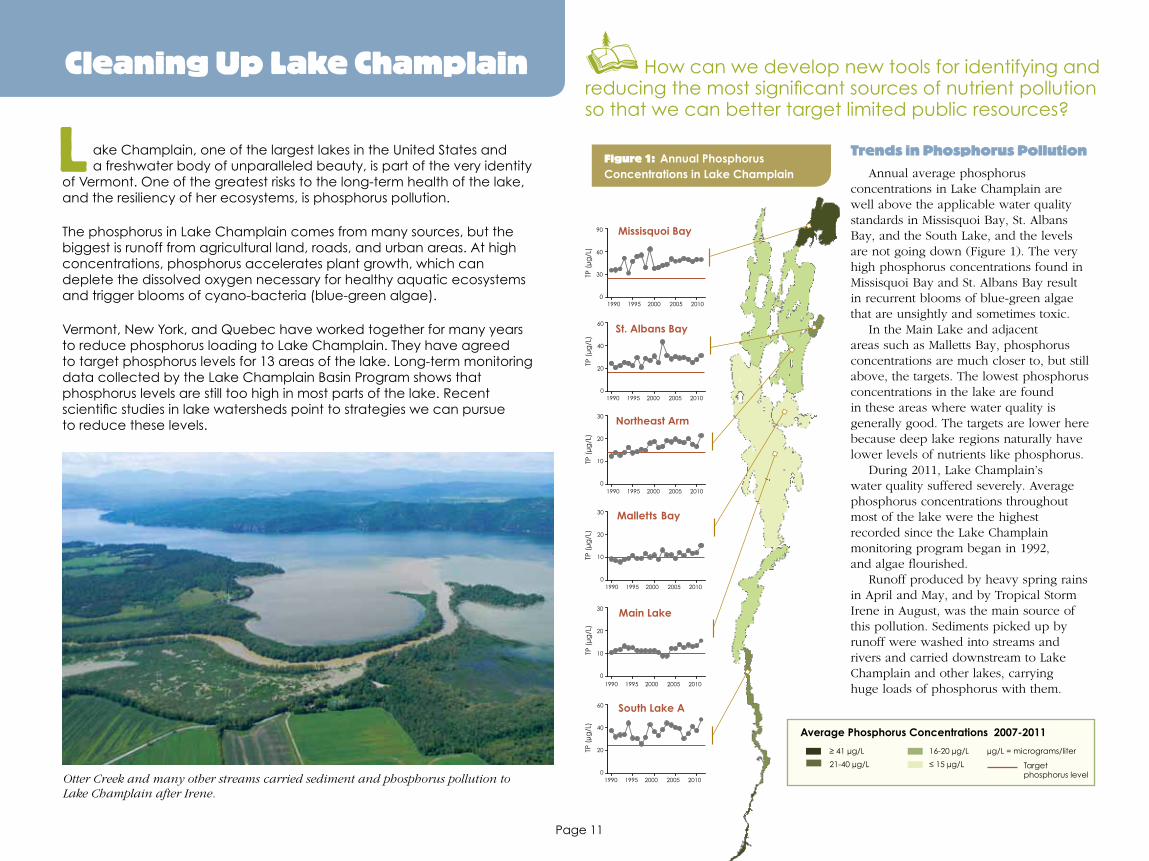
Annual average phosphorus concentrations in Lake Champlain are well above the applicable water quality standards in Missisquoi Bay, St. Albans Bay, and the South Lake, and the levels are not going down (Figure 1). The very high phosphorus concentrations found in Missisquoi Bay and St. Albans Bay result in recurrent blooms of blue-green algae that are unsightly and sometimes toxic.
In the Main Lake and adjacent areas such as Malletts Bay, phosphorus concentrations are much closer to, but still above, the targets. The lowest phosphorus concentrations in the lake are found in these areas where water quality is generally good. The targets are lower here because deep lake regions naturally have lower levels of nutrients like phosphorus.
During 2011, Lake Champlain’s water quality suffered severely. Average phosphorus concentrations throughout most of the lake were the highest recorded since the Lake Champlain monitoring program began in 1992, and algae flourished.
Runoff produced by heavy spring rains in April and May, and by Tropical Storm Irene in August, was the main source of this pollution. Sediments picked up by runoff were washed into streams and rivers and carried downstream to Lake Champlain and other lakes, carrying huge loads of phosphorus with them.
ake Champlain, one of the largest lakes in the United States and a freshwater body of unparalleled beauty, is part of the very identity of Vermont. One of the greatest risks to the long-term health of the lake, and the resiliency of her ecosystems, is phosphorus pollution.
The phosphorus in Lake Champlain comes from many sources, but the biggest is runoff from agricultural land, roads, and urban areas. At high concentrations, phosphorus accelerates plant growth, which can deplete the dissolved oxygen necessary for healthy aquatic ecosystems and trigger blooms of cyano-bacteria (blue-green algae).
Vermont, New York, and Quebec have worked together for many years to reduce phosphorus loading to Lake Champlain. They have agreed to target phosphorus levels for 13 areas of the lake. Long-term monitoring data collected by the Lake Champlain Basin Program shows that phosphorus levels are still too high in most parts of the lake. Recent scientific studies in lake watersheds point to strategies we can pursue to reduce these levels.
Figure 1: annual Phosphorus Concentrations in lake Champlain
average Phosphorus Concentrations 2007-2011
≥ 41 µg/L
21-40 µg/L
16-20 µg/L
≤ 15 µg/L
µg/L = micrograms/liter
Target phosphorus levelOtter Creek and many other streams carried sediment and phosphorus pollution to
Lake Champlain after Irene.

Page 12
Developed Land: 4%Undeveloped Land: 18%
Streambank Erosion: 40%
In-Stream Sources (40%)*
Upland Sources (60%)
Agricultural Land: 38%
Figure 3: Phosphorus Sources to missisquoi Watershed Streams
Missisquoi River5040302010
0Oct. Nov. Dec. Jan. Feb. Mar. Apr. May June July Aug. Sept. Oct.
SPRING FLOODS 62%TROPICAL STORM IRENE 9%
(2010) (2011)
Pho
sph
oru
s Lo
ad
(Me
tric
to
ns/
da
y)
Figure 2: Daily Phosphorus loads from the missisquoi River The magnitude of this phenomenon
can be seen in measurements of phospho-rus loads from the Missisquoi and Winooski rivers. Two thirds of the total loads the Missisquoi River delivered to the lake in 2011 are attributed to the spring runoff events of April and May. Tropical Storm Irene accounted for another 9 percent (Figure 2). In a single day in April, the Winooski River carried more phosphorus to Lake Champlain from storm runoff than the annual combined discharges of all 60 of Vermont’s wastewater treatment plants in the lake’s watershed.
These startling statistics remind us of how much the future health of the lake depends on how we manage stormwater runoff throughout Vermont’s watersheds. They also point to the importance of understanding which specific parts of our watersheds contribute the most phosphorus when heavy rains fall.
A 2011 study in the Missisquoi watershed sponsored by the International Joint Commission (IJC) shed some new light on this question. The study estimated that 60 percent of the phosphorus carried downstream by the Missisquoi River comes from land-based sources such as agricultural fields, paved roads, parking lots, and other developed areas. A surprising 40 percent, however, originates from inside the channels of the river and its tributary streams (Figure 3).
This phosphorus is embedded in stream banks and stream beds located in areas of channel instability. Excessive erosion in these areas during large storm events sends significant quantities of phosphorus downstream to Lake Champlain.
This finding has enormous implications for our lake cleanup efforts. Naturally stable streams that do not exhibit this kind of excessive erosion have well-functioning floodplains and river corridors. If we maintain and restore functioning flood-
plains in Lake Champlain’s tributary streams, we will significantly reduce the phosphorus in Lake Champlain and the problems it causes for aquatic ecosystems and our own recreational enjoyment of the lake. We will also reduce the risk of destructive stream flooding that compromises public safety and causes property loss (see Reducing Flood Damage, page 8).
Making Phosphorus Control Cost Effective
The news about recent trends in Lake Champlain’s phosphorus levels can be discouraging. State and federal agencies have invested more than $140 million since 2004 to accelerate the reduction of phosphorus pollution in Lake Champlain and to reduce related pollutants in other waters statewide. But lake phosphorus levels are still too high.
Does this mean that efforts to control nonpoint sources of phosphorus are not yet working? What strategies will get the job done cost effectively? Findings from two other studies completed in 2011 deliver a note of cautious optimism.
Rainfall and high river flows are strong drivers of phosphorus loading; they create a lot of statistical “noise” that makes it hard for scientists to determine whether management actions are making a difference. In a recent investigation, the U.S. Geological Survey “normalized” the data on loading so that the variability in stream and river flow caused simply by changing weather would not obscure the effects of nonpoint source pollution control efforts.
The exercise was enlightening: from 1999 to 2009, almost all the streams and rivers flowing to Lake Champlain showed reduced phosphorus levels once
the variability caused by changing flows was removed from the data. Specific actions on the landscape — such as “best management practices” (BMPs) on farms or green infrastructure projects such as bioswales that slow stormwater and capture its pollutants — are beginning to make an impact on pollution loading.
Targeting actions to specific locations on the landscape that contribute the biggest quantities of phosphorus will be critical to our future success. The IJC study in the Missisquoi watershed found that only 20 percent of the land contributes an estimated 74 percent of the total phosphorus load in the bay.
Even more eye opening is this finding: BMPs targeted at “critical source areas” will reduce phosphorus loading two to three times as much as the same practices applied in a scattershot fashion throughout a watershed. Achieving substantial reductions in phosphorus will require identifying which specific areas in the lake’s watersheds pose the greatest risk of contributing large amounts of phosphorus to nearby receiving waters — whether particular farms, concentrated areas of impervious surface, or specific areas of in-stream channel.
Blue-green algae bloom in Lake Champlain.
* Factors contributing to stream instability and bank erosion include encroachments on river corridors by roads and buildings, modifications to streams for agricultural drainage purposes, accelerated stormwater runoff from impervious surfaces, and loss of protective features such as floodplains and wetlands.

Page 13
ThRee PaRTneRShiPS To ConTRol PhoSPhoRUS
better back Roads b
The sediments that wash off Vermont’s many unpaved roads — 60 percent of our total road network — are suspected to be a major source of phosphorus in Lake Champlain and other water bodies. ANR and the Vermont Agency of Transportation are helping Vermont’s towns reduce erosion from roads through the Better Back Roads Program. Towns receive funding to implement a spectrum of practices such as stabilizing eroding ditches and road banks, and upgrading undersized culverts. One such practice is lining ditches with slopes greater than 5 percent with fabric and stone.
Community grants awarded by the program in 2010 totaled $443,379. More than 60 percent of Vermont towns have used grants to make improvements to their roads.
edge-of-Field monitoring b
Agricultural best management practices (BMPs) are the tools farmers use to reduce water pollution. In order to evaluate the effectiveness of BMPs under Vermont conditions, the Vermont office of the U.S. Natural Resources Conservation Service is teaming up with the Agency of Agriculture, Food and Markets, and ANR to conduct a rigorous evaluation of some selected BMPs that show promise for controlling phosphorus. One of the BMPs that will be evaluated involves using specialized equipment that aerates the soil to increase the infiltration of manure into the soil and reduce runoff to streams. In 2012, six farms in the Lake Champlain basin will put the BMPs into action and monitor them at the edge of their fields to determine how well they are working.
Green infrastructure b
The effectiveness of stormwater BMPs such as bioretention facilities (rain gardens), rain barrels, green roofs, and pervious pavements are being tested throughout Vermont. These technologies help to manage stormwater and the pollutants it carries by restoring and maintaining natural hydrology. ANR recently completed a bioretension area in Montpelier. The project infiltrates and treats stormwater runoff from a parking lot before it enters the Winooski River.
In 2010, ANR convened a roundtable with experts on green infrastructure practices from many organizations. The roundtable partnered with the agency to launch a new Vermont Green Infrastructure website, publish a guide to low-impact development on residential and small sites, and organize workshops for land use and landscape design professionals.

Page 14
Protecting Lakeshores
V
What can we do to conserve the remaining natural vegetation along our lake shorelines?
Physical Habitat Complexity
Turbidity
Acid Neutralizing Capacity
Total Phosphorus
Total Nitrogen
Dissolved Oxygen
16%
PERCENTAGE OF LAKES RATED POOR
11%
8%
7%
0%
0%
0% 5% 10% 15% 20%
Figure 1: Vermont lakes Rated Poor for Different Stressors
Trends in the Condition of Vermont Lakes
Beginning in 2007, Vermont and many other states joined with the U.S. Environmental Protection Agency (EPA) to complete a rigorous scientific assessment of the nation’s lakes. Fifty Vermont lakes were randomly selected for the assessment. Choosing a random sample ensured that the results could be used to draw sound conclusions about the health of all Vermont lakes, large and small.
The greatest threat to lake health, according to the assessment, is the lack of physical habitat complexity along lakeshores — both on land and in shallow water. Sixteen percent of Vermont lakes greater than 25 acres in size have “poor” habitat complexity (Figure 1).
Vermont lakes with good physical habitat at the shore have layers of vegetation, such as groundcovers, understory plants, shrubs, and trees. In the nearshore waters, they have a variety
ermont lakes are natural jewels left by glaciers that melted away over 10,000 years ago. Some have a rich history that includes
battles, settlement by native Americans, and the transport of traded goods. Now our lakes provide fishing, boating, and other recreational opportunities, as well as shores for homes, camps, and beaches. Ecologically healthy lakes are essential to Vermont’s prosperity. A new assessment of Vermont lakes builds on the results of more than 30 years of lake monitoring by Agency of Natural Resources (ANR) staff and volunteers across our state.
This assessment delivers some surprises about the condition of our lakes. Water quality problems — such as phosphorus pollution — are a major concern for a few lakes, including Lake Champlain. The biggest threat to the long-term resilience of most lakes, though, is the increasing degradation of shoreland habitat.
of sediments, woody snags, emergent and submerged plants, and boulders. These complex environments provide habitat for a wide diversity of terrestrial and aquatic organisms — from fish, to aquatic insects, to birds and mammals.
Complex lakeshore habitats are degraded when vegetation is removed from properties and lawns are planted right to the water’s edge, or impervious surfaces such as driveways are built close to the shore. Shallow-water habitats also deteriorate when people armor shorelines with rock walls or boulders, “clean up” fallen trees, remove aquatic plants, and import sand into the lake. The reduced habitat complexity along lakeshores explains why many of the lakes sampled during the assessment showed some evidence of stress in the communities of macroinvertebrates that live in lakeshore sediments.
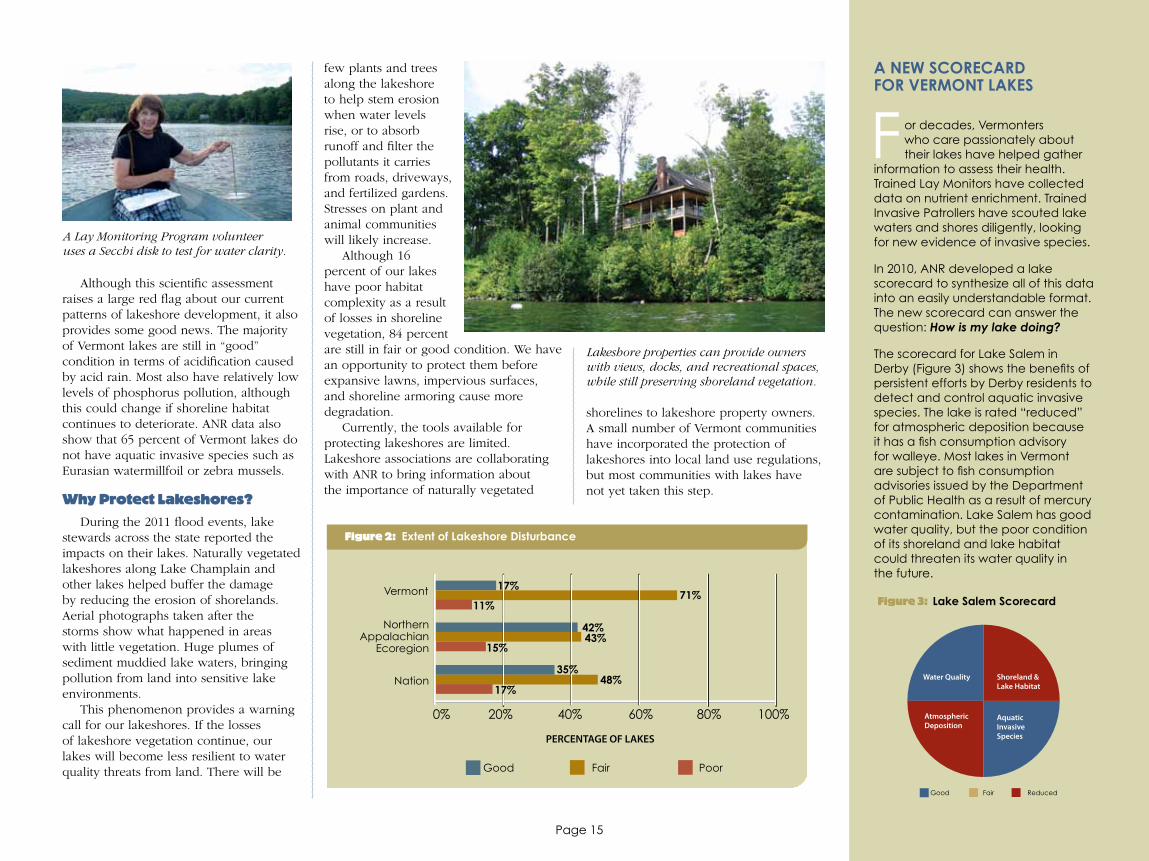
It’s no surprise, then, that lakeshore disturbance is the most serious stressor for Vermont lakes (Figure 2). The majority —
82 percent — are rated fair or poor for lakeshore disturbance, because of the buildings, docks, lawns, roads, and seawalls built at or near the water’s edge. On average, Vermont lakeshores show more disturbance than those across the United States, and the higher the degree of disturbance present, the less natural vegetation they have.
Page 15
Vermont 17%
PERCENTAGE OF LAKES
0% 20% 40% 60% 80% 100%
71%11%
42%43%
15%
35%48%
17%
Good Fair Poor
Nation
Northern Appalachian
Ecoregion
Figure 2: extent of lakeshore Disturbance
Fa neW SCoReCaRD FoR VeRmonT laKeS
or decades, Vermonters who care passionately about their lakes have helped gather information to assess their health. Trained Lay Monitors have collected data on nutrient enrichment. Trained Invasive Patrollers have scouted lake waters and shores diligently, looking for new evidence of invasive species.
In 2010, ANR developed a lake scorecard to synthesize all of this data into an easily understandable format. The new scorecard can answer the question: How is my lake doing?
The scorecard for Lake Salem in Derby (Figure 3) shows the benefits of persistent efforts by Derby residents to detect and control aquatic invasive species. The lake is rated “reduced” for atmospheric deposition because it has a fish consumption advisory for walleye. Most lakes in Vermont are subject to fish consumption advisories issued by the Department of Public Health as a result of mercury contamination. Lake Salem has good water quality, but the poor condition of its shoreland and lake habitat could threaten its water quality in the future.
Lakeshore properties can provide owners with views, docks, and recreational spaces, while still preserving shoreland vegetation.
Good Fair Reduced
Water Quality Shoreland &Lake Habitat
Atmospheric Deposition
Aquatic InvasiveSpecies
Figure 3: lake Salem Scorecard
Although this scientific assessment raises a large red flag about our current patterns of lakeshore development, it also provides some good news. The majority of Vermont lakes are still in “good” condition in terms of acidification caused by acid rain. Most also have relatively low levels of phosphorus pollution, although this could change if shoreline habitat continues to deteriorate. ANR data also show that 65 percent of Vermont lakes do not have aquatic invasive species such as Eurasian watermillfoil or zebra mussels.
Why Protect Lakeshores?
During the 2011 flood events, lake stewards across the state reported the impacts on their lakes. Naturally vegetated lakeshores along Lake Champlain and other lakes helped buffer the damage by reducing the erosion of shorelands. Aerial photographs taken after the storms show what happened in areas with little vegetation. Huge plumes of sediment muddied lake waters, bringing pollution from land into sensitive lake environments.
This phenomenon provides a warning call for our lakeshores. If the losses of lakeshore vegetation continue, our lakes will become less resilient to water quality threats from land. There will be
few plants and trees along the lakeshore to help stem erosion when water levels rise, or to absorb runoff and filter the pollutants it carries from roads, driveways, and fertilized gardens. Stresses on plant and animal communities will likely increase.
Although 16 percent of our lakes have poor habitat complexity as a result of losses in shoreline vegetation, 84 percent are still in fair or good condition. We have an opportunity to protect them before expansive lawns, impervious surfaces, and shoreline armoring cause more degradation.
Currently, the tools available for protecting lakeshores are limited. Lakeshore associations are collaborating with ANR to bring information about the importance of naturally vegetated
A Lay Monitoring Program volunteer uses a Secchi disk to test for water clarity.
shorelines to lakeshore property owners. A small number of Vermont communities have incorporated the protection of lakeshores into local land use regulations, but most communities with lakes have not yet taken this step.

Page 16
Enhancing Forest Resilience
I
How can ANR partner with public and private landowners to help our forests adapt to a range of local climate change impacts?
The Surest Way to Build Resilience
Today, most Vermont forests can recover from common, localized natural disturbances such as native insects, diseases, and ice storms. Diversity of tree species is one key attribute that helps them recover from disturbances. Our most abundant species, the sugar maple, represents only 18 percent of the trees in Vermont. Many other species represent between 7 and 12 percent of Vermont trees. In fact, Vermont forests are more diverse than those of any other northeastern state.
Forested parcels in Vermont average 42 acres in size, another attribute that contributes to overall forest resilience. Large parcels are less susceptible to exposure to stresses such as invasive species. They also support the habitat needs of diverse wildlife. Maine is the only northeastern state with a larger average parcel size, at 65 acres.
Finally, age diversity is a crucial attribute of forest resilience. Seventy-five percent of our trees are clustered in the 41- to 100-year age range, and some stands have few of the younger trees needed to replace mature trees in the future. Improving the age diversity of trees would enhance forest resiliency.
The best way to help our forests in the face of climate change, the spread of invasive plants and pests, and habitat fragmentation is to retain their size, and maintain a high level of diversity in the species and ages of trees.
Trends in Climate-Related Growing Conditions
Signs that forests are already responding to changes in Vermont’s climate can be seen in stands of sugar maples on which the Agency of Natural Resources (ANR) has collected long-term data. Over the past 20 years, the average timing of leaf flush has shifted earlier, fall leaf drop has come later, and the growing season has lengthened (Figure 1).
We can’t know all the ways these kinds of changes will affect Vermont’s forests, but we can develop some expectations. Although warmer temperatures and longer growing seasons could spur additional tree growth, forest experts expect that climate change will also create stresses that will compromise forest health.
In the spring of 2010, for example, sugar maples on Mount Mansfield leafed out 16 to 23 days earlier than average. The early growth there and all over the state made trees especially vulnerable to crown damage from a sudden April frost (Figure 2). Although most forests rebounded quickly, repeated years of this kind of asynchrony could significantly undermine their resilience.
t’s hard to overstate the value of Vermont’s many forests. They are fundamental to our natural heritage, and they support our way of life
and economy in innumerable ways. In 2011, forests helped to intercept many heavy downpours, slowing runoff into streams. Had there been fewer acres of healthy forests, the intense flooding would have been even worse.
Our forests provide other services that we rarely think about. Trees remove the greenhouse gas carbon dioxide from the air, for example, and store it in their leaves, wood, and roots. On average, forestland stores about 170,000 pounds of carbon per acre in its live tree material, plus the same or more per acre in soils. This translates into the removal of about 624,000 pounds of carbon dioxide from our atmosphere per acre of forestland.
To safeguard our forests, we must understand the risks to their health and address them proactively. Three risks that we must address today are climate change, the spread of invasive species, and the loss and fragmentation of forestland caused by development. Climate change and invasive species are discussed here, and habitat loss is discussed in the next section.

Page 17
Trends in Nonnative Invasive Insects
The emerald ash borer, shown here, originated in Asia and was first discovered in the U.S. in Michigan. This pest could seriously alter Vermont’s forests if it
becomes established here. The insect has killed millions of trees in 16 states and two Canadian provinces and has been detected just 50 miles from Vermont’s border. Purple box traps have been hung in many forests to help us detect it as soon as it enters Vermont. ANR is promoting educational programs to reduce the long-distance transport of firewood, one of the principal ways the pest spreads.
Hemlock woolly adelgids also pose a significant threat to forest health. Infestations have been detected in eight Vermont towns in Windham County, including a Wildlife Management Area
A
1989 1991 1993 1995 1997 1999 2001 2003 2005 2007 2009 2011
YEAR
Da
ys
210
200
190
180
170
160
150
140
130
Trend line
Figure 1: length of Sugar maple Growing Season
Increasing temperatures will eventually influence the distribution of tree species. At upper elevations, hardwoods are already beginning to outcompete cold-tolerant spruce and fir during forest regeneration. Over the long term, changes in forest regeneration prompted by new climate patterns will cause the distribution of species in our overstory (our mature trees) to shift.
We cannot stop the changes that will occur in our forests from climate change, but we can improve forest resilience. Beginning in 2012, three new demonstration sites on state lands will provide a testing ground for adaptive forest management strategies, from favoring warm-loving species (during forest thinning, for example) to maintaining a high level of diversity in the ages and species of trees. Forest professionals and landowners will come to these outdoor classrooms to learn about the strategies and their results.
all hanDS on DeCK FoR nonnaTiVe PeSTS
NR is working with federal, state, and local agencies; forest landowners; environmental organizations; and citizens to prevent the introduction of the most serious forest pests, prepare for their arrival, detect them early, and respond rapidly.
VTInvasives.org: This new web portal gives citizens across the state information and tools they can use to learn about invasive insects and plants, get involved in local surveying, and report discoveries.
First Detectors: These trained citizen scientists scout and screen for pests and conduct community outreach to build awareness of the risks and the best prevention strategies. Seventeen have participated in a pilot training and are now active. Three more trainings will occur in spring 2012.
Community Preparedness: ANR and its partners will work one-on-one with 20 communities whose urban forests are at high risk for emerald ash borer infestations. Each community will get help in identifying critical resources and developing a response plan.
.
Areas of tree crown damage detected by aerial survey.
Figure 2: 2010 Frost Damage
Volunteers find hemlock woolly adelgids during a survey in Windham County.
(WMA) deer wintering area. In warmer states to the south, the insect is more widespread; and the damage, more severe. As winter temperatures rise here, this pest could spread farther north in Vermont.
Both of these forest pests, as well as the Asian longhorned beetle, have the potential to kill or damage significant numbers of trees. Tree mortality — whether from these pests or from other stresses — causes openings that expose young trees and soils, making forests vulnerable to warming or drying.
Page 18
Conserving Habitat
W
How can ANR work together with towns and landowners to protect habitat that is especially important for sustaining Vermont’s biodiversity?
Tracking Vermont’s Biodiversity
Since 1987, ANR’s Natural Heritage Inventory has gathered data on the location and ecological condition of Vermont’s rare plant and animal species and its natural communities (i.e., recurring groups of species found together in particular environments, such as northern hardwood forests or rich fens).
Since new information is added to the inventory every time a new wildlife, natural community, or botany survey is completed, we can use it to identify important trends. If the abundance of a species or natural community begins to decline, the inventory acts as an early warning system, signaling the need for targeted conservation actions.
In 2011, two species of bats were placed on Vermont’s list of endangered species: the little brown and northern long-eared bats. Their populations had plummeted by 90 percent because of an infection called white-nose syndrome.
The Natural Heritage Inventory will continue to track the abundance of these and other Vermont species in the future.
Trends in Habitat Connectivity
In the last two decades, population growth in Vermont and the development of large residential parcels have reduced productive habitat by fragmenting it into smaller and smaller areas. From 1997 to 2007, we developed nearly 48,000 acres of previously undeveloped land, or roughly 75 square miles.
Other changes in habitat will occur in response to the local effects of global climate change. There is no way to
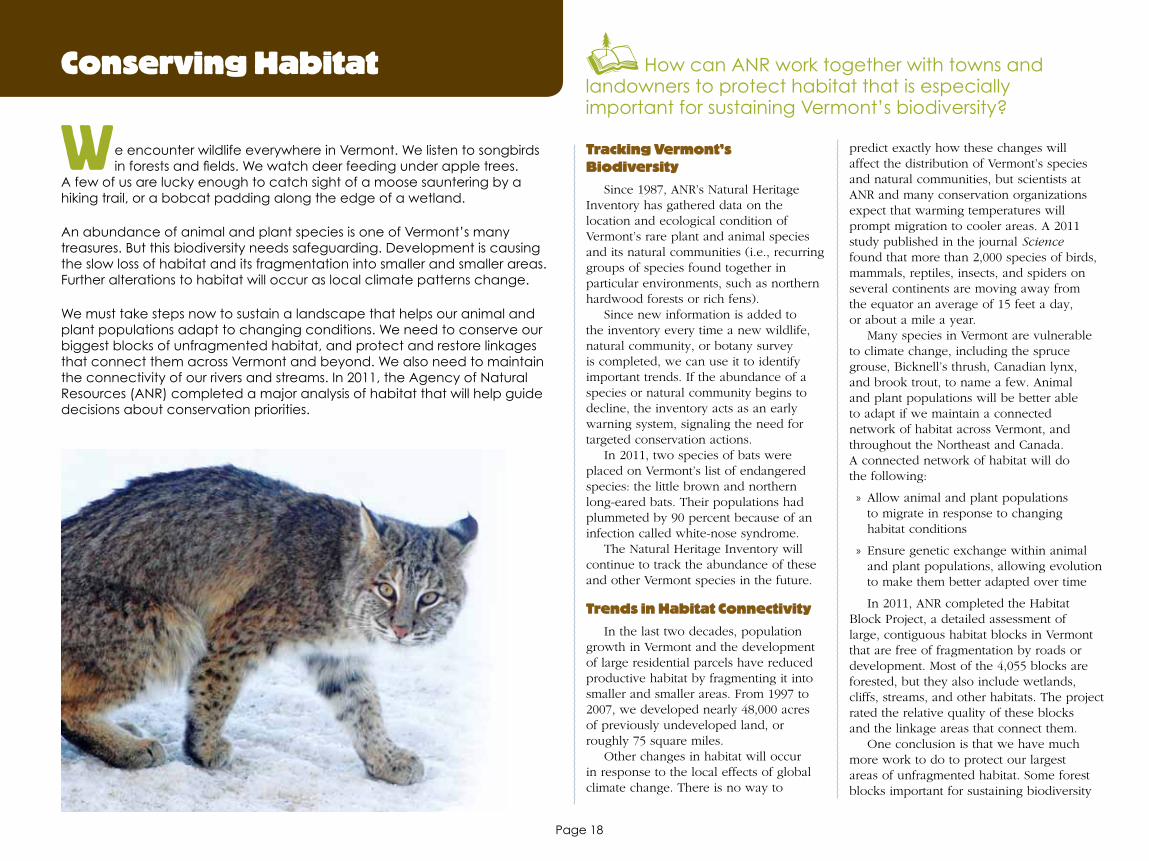
e encounter wildlife everywhere in Vermont. We listen to songbirds in forests and fields. We watch deer feeding under apple trees.
A few of us are lucky enough to catch sight of a moose sauntering by a hiking trail, or a bobcat padding along the edge of a wetland.
An abundance of animal and plant species is one of Vermont’s many treasures. But this biodiversity needs safeguarding. Development is causing the slow loss of habitat and its fragmentation into smaller and smaller areas. Further alterations to habitat will occur as local climate patterns change.
We must take steps now to sustain a landscape that helps our animal and plant populations adapt to changing conditions. We need to conserve our biggest blocks of unfragmented habitat, and protect and restore linkages that connect them across Vermont and beyond. We also need to maintain the connectivity of our rivers and streams. In 2011, the Agency of Natural Resources (ANR) completed a major analysis of habitat that will help guide decisions about conservation priorities.
predict exactly how these changes will affect the distribution of Vermont’s species and natural communities, but scientists at ANR and many conservation organizations expect that warming temperatures will prompt migration to cooler areas. A 2011 study published in the journal Science found that more than 2,000 species of birds, mammals, reptiles, insects, and spiders on several continents are moving away from the equator an average of 15 feet a day, or about a mile a year.
Many species in Vermont are vulnerable to climate change, including the spruce grouse, Bicknell’s thrush, Canadian lynx, and brook trout, to name a few. Animal and plant populations will be better able to adapt if we maintain a connected network of habitat across Vermont, and throughout the Northeast and Canada. A connected network of habitat will do the following:
» Allow animal and plant populations to migrate in response to changing habitat conditions
» Ensure genetic exchange within animal and plant populations, allowing evolution to make them better adapted over time
In 2011, ANR completed the Habitat Block Project, a detailed assessment of large, contiguous habitat blocks in Vermont that are free of fragmentation by roads or development. Most of the 4,055 blocks are forested, but they also include wetlands, cliffs, streams, and other habitats. The project rated the relative quality of these blocks and the linkage areas that connect them.
One conclusion is that we have much more work to do to protect our largest areas of unfragmented habitat. Some forest blocks important for sustaining biodiversity

Page 19
are not well protected, and their location in rapidly developing areas places them at risk. Even more vulnerable are the linkages that prevent these blocks from becoming isolated from each other.
A linkage could simply be a well-forested strip of land along a road, or riparian vegetation running along a stream. Or, it could be an area where animals can safely cross a road running between two blocks. Linkages are critical because they facilitate wildlife migration, especially for some of our biggest mammals with large home ranges, such as moose, bears, and bobcats. Figure 1 shows two areas of blocks; one is well connected, and the other is not.
In Vermont, some of our most poorly connected habitat areas are located where we have the greatest biodiversity — in the Lake Champlain Valley.
From Analysis to Action
The analysis of habitat across our landscape creates a powerful tool for choosing conservation priorities. ANR will use it, along with the Natural Heritage Inventory, to guide its purchase and protection of new lands. The analysis will also inform ANR’s long-standing partnership with the Vermont Agency of Transportation to reduce the barriers that culverts and roads create for migrating fish and wildlife.
In the end, though, a network of connected habitat can only be created and maintained town by town, and landowner by landowner. ANR is helping local partners choose and fund conservation choices that are shaped by local priorities and by an understanding of the significance of their habitat in a larger landscape.
A recent study by the Vermont Natural Resources Council showed that 87 percent of municipalities and towns now recommend the protection
of wildlife habitat in their town plans, but only 2 percent have zoning bylaws with specific protections in which wildlife habitat is well defined. There are significant opportunities to provide towns with tools and information they can use to strengthen their conservation of habitat.
Local groups that want to conserve critical habitat linkages for Vermont wildlife are springing up around the state. The group Cold Hollow to Canada, for example, is monitoring wildlife movement between seven northwestern towns.
ermont sits at the crossroads of a sweeping network of large forests spanning the northeastern United States and southeastern Canada — from the Tug Hill Plateau in New York, across the Adirondacks and the Green and White Mountains, and on to the Canadian Maritime provinces.
Animals that need large home ranges to survive — such as bear, moose, and bobcat — travel through these large forest areas in search of food, cover, and mates. Their future depends on our work to conserve not only the forests themselves, but also the linkage areas that connect them. Linkage areas allow animal and plant populations to move between forests, maintain their genetic diversity, and adapt to changing conditions.
Through the Staying Connected Initiative, Vermont is working closely with the Nature Conservancy; the states of Maine, New York, and New Hampshire; Canada; and many conservation organizations to protect high- priority habitat linkages. The Initiative helps towns and landowners choose conservation actions strategically, by empowering them with good science and conservation tools.
V
1 (bad)
2
3
4
5 (good)
MILES0 0.5 1 2 3 4
Modeled Wildlife Road Crossings
20 - 250
250.1 - 1000
1000.1 - 5000
5000.1 - 20000
20000.1 - 154889
Habitat Blocks (acres)
Figure 1: habitat block Connectivity The STayinG ConneCTeD iniTiaTiVe
Arrows show priority linkage areas that connect large blocks of forest in New York, Vermont, New Hampshire, and Maine.
Large adjacent habitat blocks in the Green Mountains near Middlebury (right) are well connected across roads that are relatively safe for wildlife to cross and provide good cover on both sides. Farther west (left), small habitat blocks are poorly connected to other blocks.
Page 20
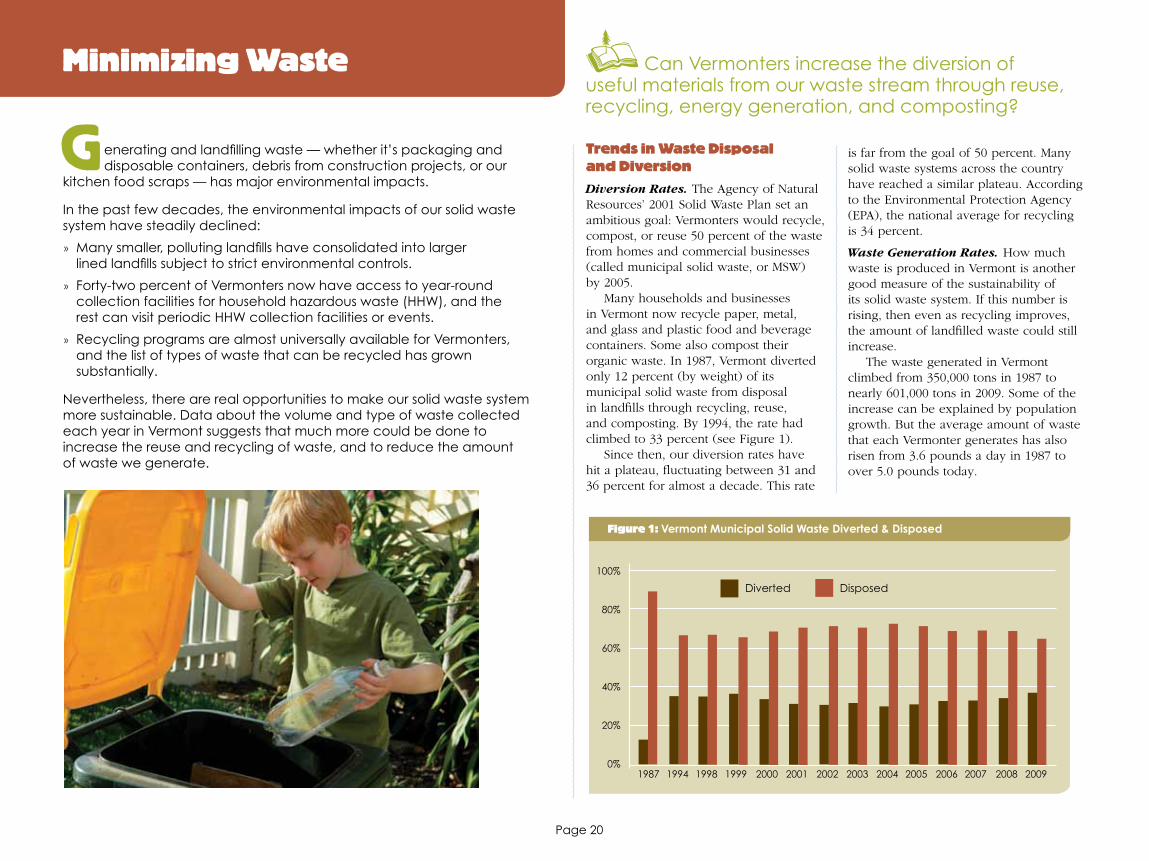
Minimizing Waste Can Vermonters increase the diversion of useful materials from our waste stream through reuse, recycling, energy generation, and composting?
Diverted Disposed
1987 1994 1998 1999 2000 2001 2002 2003 2004 2005 2006 2007 2008 2009
100%
80%
60%
40%
20%
0%
Figure 1: Vermont municipal Solid Waste Diverted & Disposed
G Trends in Waste Disposal and Diversion
Diversion Rates. The Agency of Natural Resources’ 2001 Solid Waste Plan set an ambitious goal: Vermonters would recycle, compost, or reuse 50 percent of the waste from homes and commercial businesses (called municipal solid waste, or MSW) by 2005.
Many households and businesses in Vermont now recycle paper, metal, and glass and plastic food and beverage containers. Some also compost their organic waste. In 1987, Vermont diverted only 12 percent (by weight) of its municipal solid waste from disposal in landfills through recycling, reuse, and composting. By 1994, the rate had climbed to 33 percent (see Figure 1).
Since then, our diversion rates have hit a plateau, fluctuating between 31 and 36 percent for almost a decade. This rate
enerating and landfilling waste — whether it’s packaging and disposable containers, debris from construction projects, or our
kitchen food scraps — has major environmental impacts.
In the past few decades, the environmental impacts of our solid waste system have steadily declined:
» Many smaller, polluting landfills have consolidated into larger lined landfills subject to strict environmental controls.
» Forty-two percent of Vermonters now have access to year-round collection facilities for household hazardous waste (HHW), and the rest can visit periodic HHW collection facilities or events.
» Recycling programs are almost universally available for Vermonters, and the list of types of waste that can be recycled has grown substantially.
Nevertheless, there are real opportunities to make our solid waste system more sustainable. Data about the volume and type of waste collected each year in Vermont suggests that much more could be done to increase the reuse and recycling of waste, and to reduce the amount of waste we generate.
is far from the goal of 50 percent. Many solid waste systems across the country have reached a similar plateau. According to the Environmental Protection Agency (EPA), the national average for recycling is 34 percent.
Waste Generation Rates. How much waste is produced in Vermont is another good measure of the sustainability of its solid waste system. If this number is rising, then even as recycling improves, the amount of landfilled waste could still increase.
The waste generated in Vermont climbed from 350,000 tons in 1987 to nearly 601,000 tons in 2009. Some of the increase can be explained by population growth. But the average amount of waste that each Vermonter generates has also risen from 3.6 pounds a day in 1987 to over 5.0 pounds today.
Page 21
EAll other ferrous 2%
Recyclable containers 7%
Recyclable paper 17%
Textiles 5%
Food waste 21%
Dirty paper 9%
Other waste categories 39%
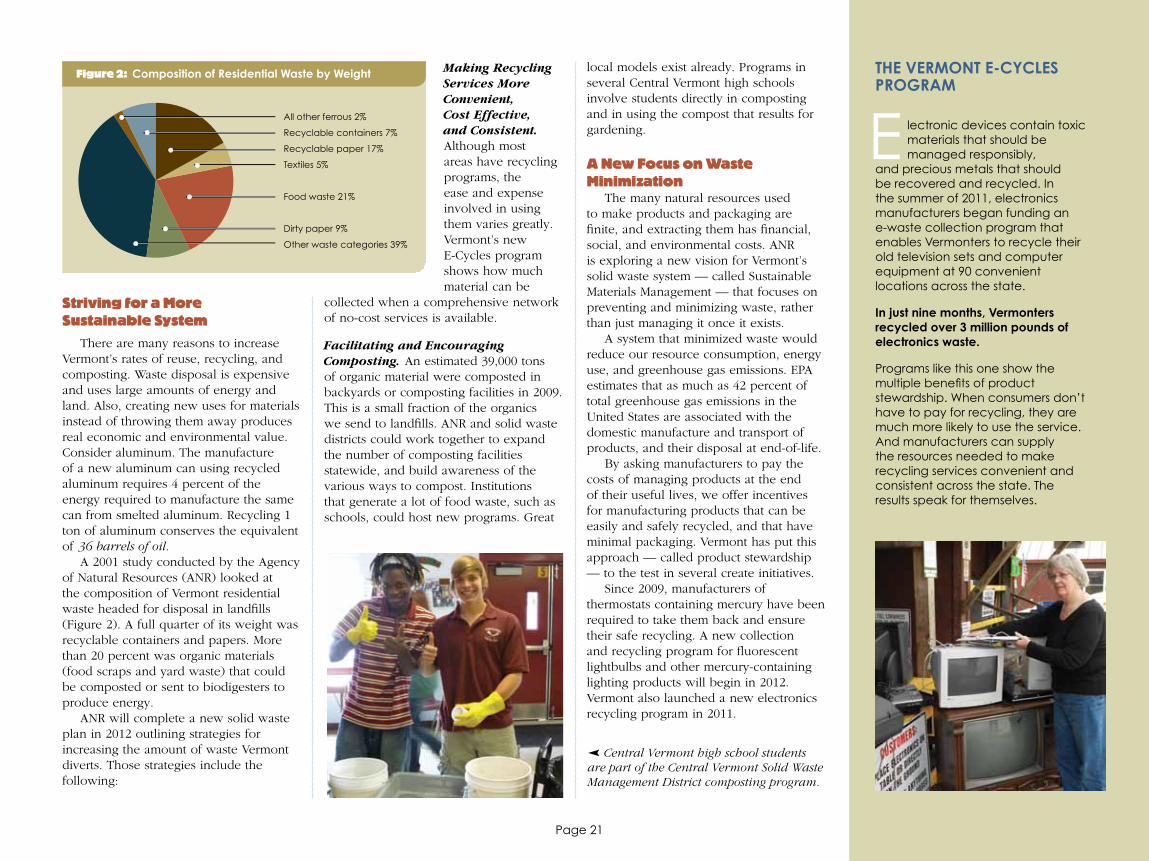
Figure 2: Composition of Residential Waste by Weight
Striving for a More Sustainable System
There are many reasons to increase Vermont’s rates of reuse, recycling, and composting. Waste disposal is expensive and uses large amounts of energy and land. Also, creating new uses for materials instead of throwing them away produces real economic and environmental value. Consider aluminum. The manufacture of a new aluminum can using recycled aluminum requires 4 percent of the energy required to manufacture the same can from smelted aluminum. Recycling 1 ton of aluminum conserves the equivalent of 36 barrels of oil.
A 2001 study conducted by the Agency of Natural Resources (ANR) looked at the composition of Vermont residential waste headed for disposal in landfills (Figure 2). A full quarter of its weight was recyclable containers and papers. More than 20 percent was organic materials (food scraps and yard waste) that could be composted or sent to biodigesters to produce energy.
ANR will complete a new solid waste plan in 2012 outlining strategies for increasing the amount of waste Vermont diverts. Those strategies include the following:
Making Recycling Services More Convenient, Cost Effective, and Consistent. Although most areas have recycling programs, the ease and expense involved in using them varies greatly. Vermont’s new E-Cycles program shows how much material can be
collected when a comprehensive network of no-cost services is available.
Facilitating and Encouraging Composting. An estimated 39,000 tons of organic material were composted in backyards or composting facilities in 2009. This is a small fraction of the organics we send to landfills. ANR and solid waste districts could work together to expand the number of composting facilities statewide, and build awareness of the various ways to compost. Institutions that generate a lot of food waste, such as schools, could host new programs. Great
local models exist already. Programs in several Central Vermont high schools involve students directly in composting and in using the compost that results for gardening.
A New Focus on Waste Minimization
The many natural resources used to make products and packaging are finite, and extracting them has financial, social, and environmental costs. ANR is exploring a new vision for Vermont’s solid waste system — called Sustainable Materials Management — that focuses on preventing and minimizing waste, rather than just managing it once it exists.
A system that minimized waste would reduce our resource consumption, energy use, and greenhouse gas emissions. EPA estimates that as much as 42 percent of total greenhouse gas emissions in the United States are associated with the domestic manufacture and transport of products, and their disposal at end-of-life.
By asking manufacturers to pay the costs of managing products at the end of their useful lives, we offer incentives for manufacturing products that can be easily and safely recycled, and that have minimal packaging. Vermont has put this approach — called product stewardship — to the test in several create initiatives.
Since 2009, manufacturers of thermostats containing mercury have been required to take them back and ensure their safe recycling. A new collection and recycling program for fluorescent lightbulbs and other mercury-containing lighting products will begin in 2012. Vermont also launched a new electronics recycling program in 2011.
The VeRmonT e-CyCleS PRoGRam
lectronic devices contain toxic materials that should be managed responsibly, and precious metals that should be recovered and recycled. In the summer of 2011, electronics manufacturers began funding an e-waste collection program that enables Vermonters to recycle their old television sets and computer equipment at 90 convenient locations across the state.
in just nine months, Vermonters recycled over 3 million pounds of electronics waste.
Programs like this one show the multiple benefits of product stewardship. When consumers don’t have to pay for recycling, they are much more likely to use the service. And manufacturers can supply the resources needed to make recycling services convenient and consistent across the state. The results speak for themselves.
∂ Central Vermont high school students are part of the Central Vermont Solid Waste Management District composting program.

Page 22
Building Resilient Infrastructure
W
How can we build a more rigorous assessment of flooding risks into our efforts to build new infrastructure or repair old infrastructure in Vermont?
Resilient Infrastructure
Community systems that fared well during Irene incorporated safeguards against severe flooding. Rutland’s main water supply was cut off when its intake pipe on Mendon Brook washed away. But the town had a backup water source fed by East Creek. This redundancy in supply prevented a major water crisis.
Rochester’s drinking water well sits within the floodplain of the White River, making it vulnerable to flood and erosion hazards. However, the town constructed its well head above the base flood elevation — the elevation of a flood with a 1 percent chance of occuring in any year (also called the 100-year floodplain elevation). This feature protected the town’s water supply from almost certain contamination.
A similar story can be told about Vermont’s wastewater infrastructure. Wilmington had bypass pipes and pumps ready to go at its pump houses, and an up-to-date emergency plan. Even though the pump houses flooded, wastewater services continued uninterrupted.
These stories underscore the importance of building safeguards against the impacts of flooding into the design, operation, and maintenance of our most critical community systems.
Some safeguards are already incorporated into state regulations that must be met by infrastructure projects. But other safeguards are not always addressed, such as having backup water supplies when possible, and carefully siting new infrastructure outside of high-risk floodplain areas.
hen critical community infrastructure is located close to rivers and lake shorelines, it can be acutely vulnerable to flooding.
The Champlain Water District barely kept lake water out of its pump station when Lake Champlain’s water levels crested above 103 feet in the spring of 2011. A makeshift wall of sandbags was the facility’s only protection.
Just three months later, when Tropical Storm Irene caused catastrophic erosion and inundation throughout Vermont’s river valleys, some water and wastewater systems sustained significant damage. Bennington lost its primary water transmission main and its wastewater treatment plant. Bethel’s well house was buried in silt left by the floods. More than 15,000 Vermonters had to boil their drinking water for days or weeks.
Yet some infrastructure proved remarkably resilient. These stories harbor important messages about what Vermont communities must do to prepare existing water and wastewater systems for future flooding. They also highlight the importance of planning new infrastructure with careful attention to flooding and erosion hazards and other kinds of risks.
Ensuring the long-term resilience of new or expanded infrastructure will require integrating a careful evaluation of risks into its planning and siting. The risk of encroaching on floodplains and river corridors needs particular attention. When possible, we should consider alternative locations for water and wastewater systems that lie outside of high-risk areas.
Trends in the Condition of Infrastructure
Across Vermont, water and waste water systems in river valley communities remain vulnerable to severe flooding. Consider the following:
» Many pipes are buried in riverbeds, where they could be exposed and damaged if stream banks experience significant erosion or channels shift laterally.
» Other pipes are affixed to structures such as bridges that can be vulnerable to flooding, especially when the structures are undersized.
The protective concrete casing around this town water pipe was washed away during high river flows caused by Irene.

Page 23
T
» Wells, water distribution systems, and wastewater treatment facilities are often situated directly on floodplains, sometimes perilously close to riverbanks, making them vulnerable to inundation and erosion hazards.
These vulnerabilities are critical, but an even bigger problem for Vermont’s infrastructure is its deteriorating condition as a result of aging. The state has 1,367 public water systems, and nearly 90 percent of these serve fewer than 500 people (Figure 1). Most were constructed decades ago. Statewide, distribution pipes, valves, and pumps are long overdue for upgrade and replacement. Vermont’s 118 municipal wastewater systems are in much the same condition.
Although we don’t know the total price tag to replace, upgrade, and maintain this infrastructure, we do know the costs are high. In smaller communities without a large tax base, the cost barriers can seem daunting. Yet the risks of not acting are high too — repairing systems that repeatedly fail is a costly approach to providing essential services.
Partnerships for Long-Range Planning
No community can modernize aging infrastructure overnight. Key to making Vermont’s infrastructure more resilient will be developing long-term plans for improvement.
Ideally, each community in Vermont would have a current inventory of infrastructure and its condition. With this as a baseline, communities could then carefully consider
where the greatest risks of failure exist, and wisely prioritize their investments.
The Agency of Natural Resources (ANR) remains committed to helping communities work through this kind of smart planning process. In 2011, the Drinking Water and Groundwater Protection Division began assisting Waterbury Village to develop an asset management plan that will prioritize the replacement or upgrade of infrastructure assets vulnerable to failure.
ANR also provides low-interest loans through its Drinking Water and Wastewater State Revolving Funds. In 2011, roughly $14 million was awarded for drinking water projects, and another $11.5 million was awarded for wastewater projects. These funds do not begin to meet the need, but they can be coupled with other financing strategies such as issuing municipal bonds and increasing utility rates.
meeTinG WaTeR DemanD by FixinG leaKy PiPeS
hese days, energy providers know that conserving energy is a far cheaper way to meet new energy demand than generating more energy. Conserving water can provide a similar benefit. Bradford, facing a potential future crisis of water supply, learned this important lesson.
The Bradford Village Water System (serving 1,512 people) was finding it increasingly difficult to meet a growing demand for drinking water. The town assumed that it needed to locate a new source of water, as many towns facing the same situation have in the past.
Bradford approached ANR for funds to help underwrite source exploration, but when the agency discovered that leaky pipes accounted for 40 percent of Bradford’s water loss, loan funds were redirected to support infrastructure replacement and water conservation. Today, Bradford lacks a new water source, but is well on
its way to comfortably meeting demand — and enhancing the long-term resilience of its critical infrastructure.
Rochester’s well pump house was built above the elevation for a 100-year flood, and was damage free after Irene.
Community non-Community Population Range Systems Systems Total
25 - 100 142 542 684101 - 500 171 347 518501 - 1,000 42 32 74> 1,000 79 12 91Total 434 933 1,367 Definitions: Community System: A water system serving a year-round residential population of 25 or more people non-Community System: A water system serving a nonresidential population of 25 or more people
Figure 1: Vermont Public Water Systems
Protecting Groundwater
Approximately two thirds of Vermonters depend on groundwater for their drinking water. In 2008, the Vermont Legislature passed a law designating the state’s groundwater a public trust resource. This created a legal requirement that groundwater be managed and protected for the benefit of all Vermonters.
In 2011, the Vermont Environmental Court issued a decision further clarifying that groundwater must be managed as a public trust resource with regard not only to water quantity, but also to water quality.
Fractured bedrock aquifers and small sand and gravel aquifers can be found throughout Vermont, but information about their size and water quality is actually quite limited. Since 2008, the Vermont Geological Survey has been compiling and assessing existing groundwater datasets statewide. We now have preliminary state maps of cumulative impact areas and areas where demand for groundwater is expected to increase.

Page 24
Drawing Kids Outdoors
T
What new partnerships can ANR pursue to ensure that young Vermonters never experience nature deficit disorder?
here may be no more important step we can take to ensure the resilience of our environment than helping children connect
with nature. Children who explore our unique natural places will become adults committed to protecting them.
The jubilant noises of children can be heard echoing through campgrounds and along trails everywhere in Vermont. Yet kids may be getting outside less often than their parents did.
Trends in Outdoor Activity
A 2006 survey confirmed what we already know: Vermonters love the outdoors. We ranked third nationally in our participation in wildlife-associated recreation — including hunting, fishing, and wildlife watching.
Are Vermont kids following in their parents’ footsteps?
Nationally, there is growing concern about how much time today’s children spend indoors, often in front of a TV or computer screen. Correlations between sedentary indoor lifestyles and obesity, attention deficit disorder, reductions in social and cognitive skills, and diminished appreciation for natural resources have also been shown. Conservationists use the term nature deficit disorder to call attention to what is being lost.
Although young Vermonters do get outdoors, lifestyles are changing here too. The 2011 Vermont High School Youth Risk Behavior Survey asked high school students to account for how they spent time during the week they answered the survey:
» Only one in four students did 60 minutes of physical activity every day, and 12 percent reported zero days with at least 60 minutes of physical activity.
» Thirty-six percent of students spent three or more hours per school day watching TV, playing video games, or using a computer.
Nature Contact and Resilience
The benefits of time spent in the woods or on lakeshores are far reaching. Studies show that nature contact makes
children healthier, more focused, and better able to perform in school. It invites exploration and unstructured play that is essential to wholesome child development.
Early experiences being outdoors also shape the attitudes of adults about natural resources. The two most important factors propelling adults to take actions benefitting the environment, according to one 2006 study, were having had experiences outdoors when they were young, and having been outdoors with someone well loved.
The Agency of Natural Resources (ANR) is always looking for ways to draw children and families outside. There were over 800,000 visits to state parks in 2011, and the average number has been slowly rising over the last decade. ANR is engaging staff, stakeholders, and communities in developing new visions for park improvements, so they meet the needs of Vermonters today as well as they did in the 1930s when many were constructed.
ANR also runs a wide variety of programs to teach children and families outdoor skills, and to help them connect to Vermont’s many special places.
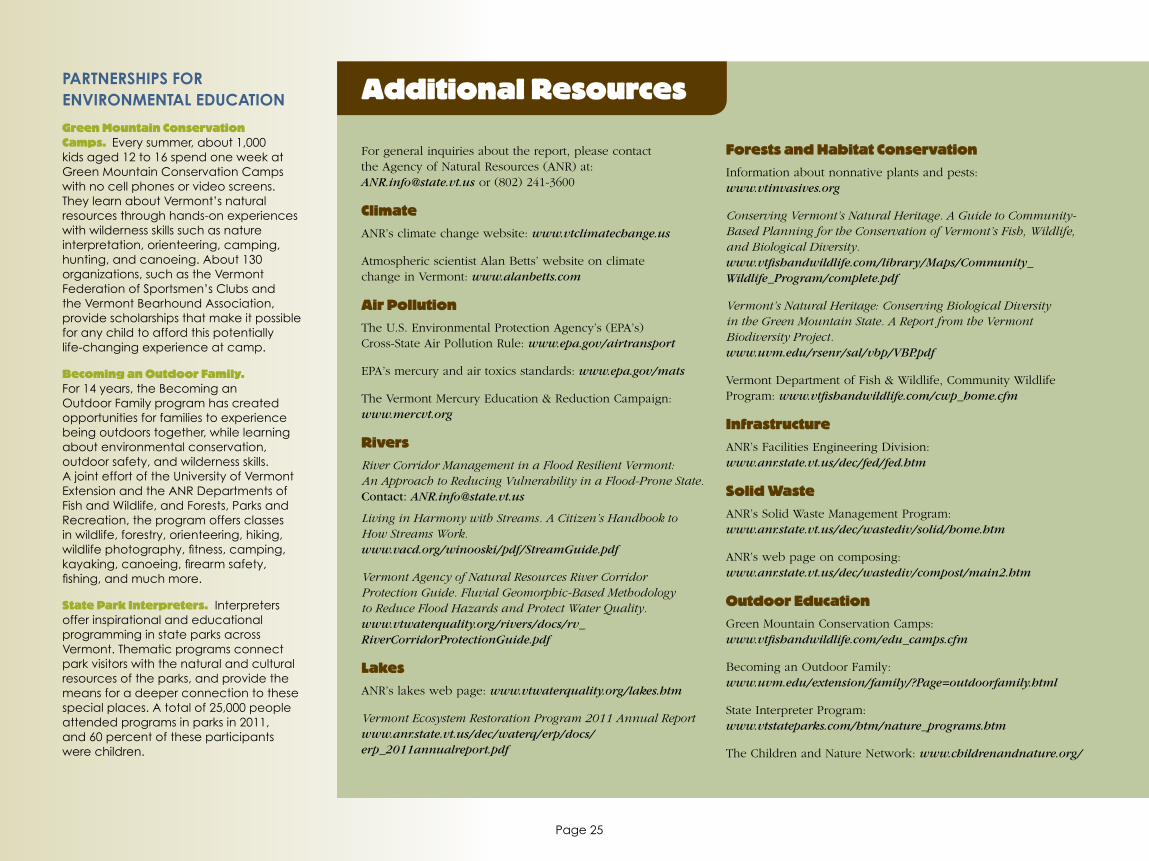
Page 25
PaRTneRShiPS FoR enViRonmenTal eDUCaTion
Green Mountain Conservation Camps. Every summer, about 1,000 kids aged 12 to 16 spend one week at Green Mountain Conservation Camps with no cell phones or video screens. They learn about Vermont’s natural resources through hands-on experiences with wilderness skills such as nature interpretation, orienteering, camping, hunting, and canoeing. About 130 organizations, such as the Vermont Federation of Sportsmen’s Clubs and the Vermont Bearhound Association, provide scholarships that make it possible for any child to afford this potentially life-changing experience at camp.
Becoming an Outdoor Family. For 14 years, the Becoming an Outdoor Family program has created opportunities for families to experience being outdoors together, while learning about environmental conservation, outdoor safety, and wilderness skills. A joint effort of the University of Vermont Extension and the ANR Departments of Fish and Wildlife, and Forests, Parks and Recreation, the program offers classes in wildlife, forestry, orienteering, hiking, wildlife photography, fitness, camping, kayaking, canoeing, firearm safety, fishing, and much more.
State Park Interpreters. Interpreters offer inspirational and educational programming in state parks across Vermont. Thematic programs connect park visitors with the natural and cultural resources of the parks, and provide the means for a deeper connection to these special places. A total of 25,000 people attended programs in parks in 2011, and 60 percent of these participants were children.
Additional Resources
For general inquiries about the report, please contact the Agency of Natural Resources (ANR) at:[email protected] or (802) 241-3600
Climate
ANR’s climate change website: www.vtclimatechange.us
Atmospheric scientist Alan Betts’ website on climate change in Vermont: www.alanbetts.com
Air Pollution
The U.S. Environmental Protection Agency’s (EPA’s) Cross-State Air Pollution Rule: www.epa.gov/airtransport
EPA’s mercury and air toxics standards: www.epa.gov/mats
The Vermont Mercury Education & Reduction Campaign:www.mercvt.org
Rivers
River Corridor Management in a Flood Resilient Vermont: An Approach to Reducing Vulnerability in a Flood-Prone State. Contact: [email protected]
Living in Harmony with Streams. A Citizen’s Handbook to How Streams Work. www.vacd.org/winooski/pdf/StreamGuide.pdf
Vermont Agency of Natural Resources River Corridor Protection Guide. Fluvial Geomorphic-Based Methodology to Reduce Flood Hazards and Protect Water Quality. www.vtwaterquality.org/rivers/docs/rv_RiverCorridorProtectionGuide.pdf
Lakes
ANR’s lakes web page: www.vtwaterquality.org/lakes.htm
Vermont Ecosystem Restoration Program 2011 Annual Reportwww.anr.state.vt.us/dec/waterq/erp/docs/erp_2011annualreport.pdf
Forests and Habitat Conservation
Information about nonnative plants and pests:www.vtinvasives.org
Conserving Vermont’s Natural Heritage. A Guide to Community-Based Planning for the Conservation of Vermont’s Fish, Wildlife, and Biological Diversity. www.vtfishandwildlife.com/library/Maps/Community_ Wildlife_Program/complete.pdf
Vermont’s Natural Heritage: Conserving Biological Diversity in the Green Mountain State. A Report from the Vermont Biodiversity Project. www.uvm.edu/rsenr/sal/vbp/VBP.pdf
Vermont Department of Fish & Wildlife, Community Wildlife Program: www.vtfishandwildlife.com/cwp_home.cfm
Infrastructure
ANR’s Facilities Engineering Division: www.anr.state.vt.us/dec/fed/fed.htm
Solid Waste
ANR’s Solid Waste Management Program:www.anr.state.vt.us/dec/wastediv/solid/home.htm
ANR’s web page on composing:www.anr.state.vt.us/dec/wastediv/compost/main2.htm
Outdoor Education
Green Mountain Conservation Camps:www.vtfishandwildlife.com/edu_camps.cfm
Becoming an Outdoor Family:www.uvm.edu/extension/family/?Page=outdoorfamily.html
State Interpreter Program:www.vtstateparks.com/htm/nature_programs.htm
The Children and Nature Network: www.childrenandnature.org/

This report was:
Designed by RavenmarkPrinted by Queen City Printers IncWritten by Sarah McKearnan, with special thanks to the following ANR staff for their assistance and contributions:
John Austin, Eric Blatt, Barbara Burns, Kari Dolan, Danielle Fitzco, Gary Gulka, Jens Hilke, Cathy Jamieson, Neil Kamman, Doug Kievit-Kylar, Mike Kline, Winslow Ladue, Jeff Merrell, Kellie Merrell, Ed O’Leary, Amy Picotte, Rich Poirot, Staci Pomeroy, Tim Raymond, Eric Smeltzer, Eric Sorenson, James Surwilo, Ali Thomas, Susan Warner, Susan Warren, Craig Whipple, Sandy Wilmot, and Brian Woods.
Photo Credits:All photographs other than those listed below belong to the Agency of Natural Resources.
Cover: John SnellInside cover: Hiking, Jeb Wallace-Brodeur; Bear, Frank Leung/istockPage 1: Waterbury flood volunteers, Jeb-Wallace-BrodeurPage 2: Waitsfield aerial, Lars Gange/Mansfield HeliflightPage 3: Route 4 flood damage, Lars Gange/Mansfield HeliflightPage 4: Solar panels, Yestermorrow Design/Build School Page 5: Electric car, Green Mountain PowerPage 6: Midwest coal-fired power plant, Ken Stewart/ZUMA Press/NewscomPage 7: Loon, Paul Tessier/istock Page 9: Wetland in Figure 1, Bilde/Burlington Free PressPage 10: Roaring Branch restoration work, Milone and MacBroomPage 11: Lake Champlain and Otter Creek, Lars Gange/ Mansfield HeliflightPage 12: Blue-green algae bloom, Lake Champlain Basin ProgramPage 16: Forester inspecting trees, The Nature Conservancy/ The University of Vermont Page 17: Volunteers with the Vermont Invasives program, The Nature Conservancy, The University of Vermont Page 18: Bobcat, Mary Sue HenszeyPage 20: Boy recycling, Rob Cruse/istock; Spaulding High School students, Central Vermont Solid Waste DistrictPage 22: Boy at water fountain, Jeb Wallace-Brodeur
5 trees
5,394 gallons of water(58 days of water consumption by the average American)
1,045 pounds of waste(10 waste containers)
3,261 pounds CO2(equivalent of driving 1 compact car for 6 months)
20 gigajoules of energy(energy used by 91,823 60W light bulbs for 1 hour)
8.8 pounds of NOx(emissions of 1 truck during 14 days)
Sources: Environmental Paper Network (EPN); Cascades Paper
Savings generated by printing this report on 50% post consumer recycled paper as compared to using 100% virgin fiber paper:
Respect. Protect. Enjoy.