a representational paradigm for dynamic resource transformation...
TRANSCRIPT
A Representational Paradigm forDynamic Resource Transformation Problems
Warren B. Powell, Joel A. Shapiro and Hugo P. Simao
January, 2003
Department of Operations Research and Financial Engineering,Princeton University, Princeton, NJ 08544
Technical Report CL-01-05

1
Contents
1. Examples 8
2. Dynamic resource transformation problems 10
2.1. Knowledge 12
2.2. Processes 18
2.3. Controls 20
3. Notational style 22
4. Knowledge 25
4.1. Data knowledge 25
4.2. Functional knowledge 32
5. Processes 33
5.1. Information processes 35
5.2. System dynamics 43
5.3. Constraints 44
6. Controls 46
6.1. Types of decisions 46
6.2. Control structure 47
6.3. The information set 48
6.4. The decision function 52
6.5. Measurement and evaluation 54
7. The optimization formulation 56
8. Data representation 57
9. Summary 59
Acknowledgement 60
References 60

2
There are a host of complex operational problems arising in transportation and logistics
which are characterized by dynamic information processes, complex operational character-
istics and decentralized control structures. Yet, they are also optimization problems. The
optimization community has made outstanding progress in the solution of large optimiza-
tion problems when information processes are static (we do not model the arrival of new
information) and when the entire problem can be viewed as being part of a single control
structure. Not surprisingly, this technology has been extremely successful in applications
such as planning airline operations which meet these requirements.
This paper has grown out of the challenges we faced modeling complex operational prob-
lems arising in freight transportation and logistics, which are characterized by highly dynamic
information processes, complex operational characteristics and decentralized control struc-
tures. Whereas people solve more traditional problems have struggled with the development
of effective algorithms, we have struggled with the more basic challenge of simply modeling
the problem.
We feel that our ability to solve these problems is limited by the languages that we use
to express them. Classical mathematical paradigms do not provide an easy and natural
way to represent the optimization of these problems in the presence of dynamic information
processes, or to capture the complexities of large scale operations. In particular, models
do not capture the organization and flow of information in large organizations, preferring
instead to assume the presence of a single, all-knowing decision-maker. As a result, most
dynamic models posed in the literature are myopic or deterministic.
The characteristics of more complex operations has spawned an extensive literature pre-
senting models that are unique to a particular industry. For example, we solve airline fleet
assignment problems (Hane et al. (1995)), railroad car distribution problems (Jordan &
Turnquist (1983), Mendiratta & Turnquist (1982), Haghani (1989), and Herren (1973), for
example), the load matching problem of truckload trucking (Powell (1991), Powell (1996),
Schrijver (1993)), routing and scheduling problems in less-than-truckload trucking (Powell
(1986), Crainic & Roy (1992)), the flow management problem in air traffic control (An-
dreatta & Romanin-Jacur (1987) and Odoni (1986)) and the management of ocean contain-
ers (Crainic et al. (1993)). Even within an industry, rail car distribution is different from rail
3
locomotive management or rail crew scheduling. Clearly, this tendency reduces our ability
to learn from similar problems in different industries and excessively fragments the field.
This paper offers a new vocabulary for representing complex problems in a stochastic,
dynamic setting. Our focus is on operational problems that need to be solved under uncer-
tainty, and complex problems which are difficult to formulate mathematically in a clear and
elegant way. We believe that similarities between problems are often disguised by semantic
differences that reflect the contextual domain of an application. It is not readily apparent,
for example, that the blocking problem of railroads and the load planning problem of less-
than-truckload trucking are both instances of a dynamic service network design problem.
The question that tends to arise is: When are apparently different problems similar, and
when are seemingly similar problems different? Consider, for example:
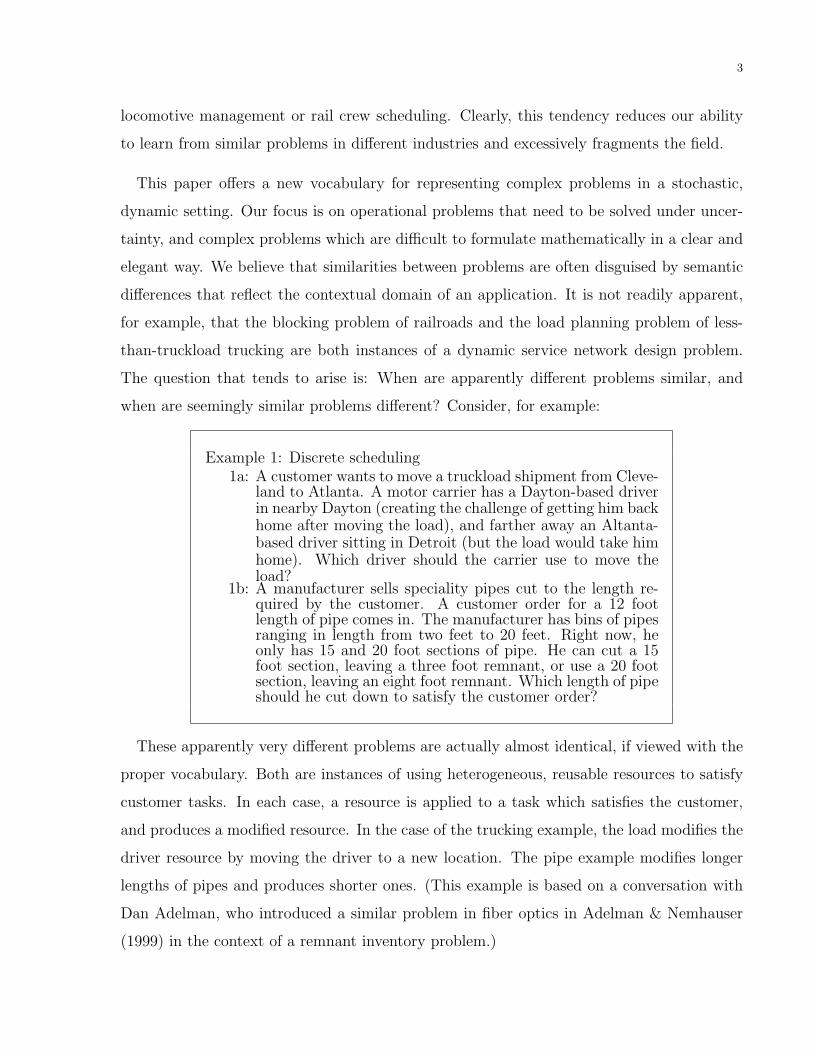
Example 1: Discrete scheduling1a: A customer wants to move a truckload shipment from Cleve-
land to Atlanta. A motor carrier has a Dayton-based driverin nearby Dayton (creating the challenge of getting him backhome after moving the load), and farther away an Altanta-based driver sitting in Detroit (but the load would take himhome). Which driver should the carrier use to move theload?
1b: A manufacturer sells speciality pipes cut to the length re-quired by the customer. A customer order for a 12 footlength of pipe comes in. The manufacturer has bins of pipesranging in length from two feet to 20 feet. Right now, heonly has 15 and 20 foot sections of pipe. He can cut a 15foot section, leaving a three foot remnant, or use a 20 footsection, leaving an eight foot remnant. Which length of pipeshould he cut down to satisfy the customer order?
These apparently very different problems are actually almost identical, if viewed with the
proper vocabulary. Both are instances of using heterogeneous, reusable resources to satisfy
customer tasks. In each case, a resource is applied to a task which satisfies the customer,
and produces a modified resource. In the case of the trucking example, the load modifies the
driver resource by moving the driver to a new location. The pipe example modifies longer
lengths of pipes and produces shorter ones. (This example is based on a conversation with
Dan Adelman, who introduced a similar problem in fiber optics in Adelman & Nemhauser
(1999) in the context of a remnant inventory problem.)

4
In this paper, we offer a paradigm for representing a class of problems that we refer to as
dynamic resource transformation problems. If “DRTP” is hard to pronounce, we encourage
readers to refer to the problem class as “DRiP’s,” (it is easier to pronounce, and we have
built a Java-based simulation library around the problem class that we call the “DRiP
Java library). Subclasses include dynamic resource allocation problems, which generally
address spatial problems, dynamic resource scheduling problems, which specifically address
problems which focus on timing (such as classical machine scheduling) or, more broadly
dynamic resource management problems. While much of what we cover will also apply to
static problems, our focus is on stochastic, dynamic problems, which have received very
little attention in the context of large-scale optimization problems. Our goal is to develop
a vocabulary that is not only relatively context-free, but is also (again, relatively) free of a
particular algorithmic strategy. In addition, our focus is primarily on very complex problems,
such as those that arise in freight transportation. These are problems that have classically
been modeled as large scale linear or integer programs.
A number of papers have been published which offer representations of well-defined prob-
lems oriented toward identifying problems with common properties. The “M/G/k” paradigm
for queueing systems, introduced by Kendall (see Gross & Harris (1985) for a summary and
references), served for decades to define the field of queueing theory. This framework actu-
ally takes the form “A/B/X/Y/Z” where A and B capture the arrival and service processes,
while X, Y and Z represent the number of services, system capacity, and queue discipline.
The machine scheduling literature uses “α | β | γ” to represent, respectively, the machine
environment, processing characteristics, and the number of machines (see Pinedo (1995)).
Eiselt et al. (1993) propose a “I / II / III / IV / V” taxonomy for classifying location prob-
lems, and use this to organize the extensive literature in location theory. Bodin & Golden
(1981) list 13 dimensions in their classification of vehicle routing problems, each of which is
divided into several categories.
A different approach to problem representation has been modeling languages, which are
more generally oriented toward much broader problem classes. An excellent review of this
field is given in Geoffrion (1989b). Modeling languages can take two general forms: algebraic
modeling systems, such as AMPL (Fourer et al. (1990)) which are high level code or data

5
generators for lower level systems, and conceptual representations, such as Geoffrion’s Struc-
tured Modeling Language (Geoffrion (1989a), Geoffrion (1989b), Geoffrion (1992a),Geoffrion
(1992b)). The challenge in developing any representational system is the tradeoff between
scope of application (generality) and ease of application (which requires domain-specific fea-
tures). The more a representation is tied to a specific problem class, the easier it is to apply
to that problem class, and the less useful it becomes to other problem classes. In our view,
other work on general modeling approaches is difficult to apply to the stochastic, dynamic
problems that arise in complex arenas such as freight transportation. This is not to say that
they cannot be applied, but rather that we cannot easily determine how to apply them.
A major goal of the paper is an explicit representation of this problem class. This requires
identifying the major elements of a DRTP in a way that could be represented in a computer
dataset. As an illustration, a linear program, expressed as min cx subject to Ax = b, x ≤
u, x ≥ 0, is expressed by specifying A, b, c, u and x. This representation has provided a
highly flexible mathematical vocabulary, as well as serving as the basis for the venerable
“MPS” format. In fact, one could argue that Dantzig’s most valuable contribution was not
the simplex algorithm, but the basic problem representation that has served as a useful
language for a wide range of algorithms that do not even use the simplex method.
The central thesis of this paper is that we lack a basic representational paradigm for the
types of stochastic, dynamic problems that arise in the context of complex operational ap-
plications such as freight transportation and logistics. These problems have been classically
formulated as large-scale mixed integer optimization problems, where the primary emphasis
is on finding an algorithm, while accepting strong simplifications on the representation of
the problem. In this paper, we do not focus on an algorithm for solving a problem, but
rather on simply representing the problem in a general way that captures the much richer
set of modeling issues that arise in a dynamic setting. We feel that in a static, deterministic
setting, the challenge of modeling the problem is relatively easy, while solving the problem is
quite hard. In a stochastic, dynamic setting, the reverse is true. Since we will never obtain
truly optimal solutions (for realistic problems), “solving” a stochastic, dynamic problem is
relatively easy (since we do not generally look for optimal solutions), whereas simply mod-
eling the problem can be extremely difficult. Of course, optimal solutions for this problem

6
class are exceptionally hard, and the challenge of obtaining (and verifying) better solutions
will remain an intellectually challenging task.
A goal of this paper is to provide a flexible representational structure that others can
build on and adapt to fit their needs. Since our interest is in very complex problems, our
intent is to build on existing modeling paradigms, rather than try to replace them with
something completely new. At the same time, we feel that no single modeling paradigm,
classically applied, allows us to capture the richness of complex stochastic, dynamic problems
that arise in practice. The standard paradigm of most research in the operations research
community is to propose a model, and then focus on developing an algorithm. In the case of
large, complex problems, and in particular those arising in a dynamic setting, we feel that
it is more important at this stage to agree on a mathematical representation that covers the
important dimensions that distinguish a stochastic, dynamic problem.
The contributions of this paper are as follows: a) We define the DRTP as a problem
class, and show how it includes a variety of problems in operations research. We provide
a compact but comprehensive organization of the elements of a DRTP , which uses only
three primary dimensions, which we consider fundamental, and a set of subdimensions. We
claim that this organization encompasses all the essential features of this problem class, and
as such, can become the basis for classifying problems (which we do not attempt). b) We
provide a full notational system that is highly mnemonic and which captures the important
elements of these problems in a natural way. Our mathematical representation provides easy
interfaces with classical concepts in mathematical programming and stochastic processes. c)
Our representation provides what we believe to be the first representation that focuses on the
information content in decisions for a multiagent system, along with a novel characterization
of information. Finally, d) we provide a structure for storing instances of a DRTP in files
that can be shared.
The DRTP problem class offers several dimensions which appear to be new: 1) the concept
of resource layering, whereby different types of resources can be combined to make composite
resources; 2) the representation of complex physics through the use of a type of transfer
function (called the modify function), that works at the level of each resource, with explicit
treatment of the information content of each decision and the modeling of multi-period

7
transfer times; 3) the classification of information into four distinct sets, which then forms
the basis for different classes of decision functions, 4) the introduction of the concept of
knowability and actionability, and 5) the modeling of informational subproblems, capturing
the property in most large-scale systems that decisions are made in subproblems using subsets
of information.
A challenge of this paper is striking a balance between specificity and generality. Individual
researchers may react to our representation by claiming that it “forces” a lot of “unnecessary”
complexity. Our intent in this paper is not to encourage any particular representation (we
even provide for the explicit use of deterministic approximations). However, we do wish to
highlight simplifying assumptions when they are made, so that perhaps other researchers
may in time investigate the impact of these assumptions. Ultimately, the goal of modeling
is finding the set of approximations that balances accuracy with tractability.
Section 1 gives a number of examples of these problems, illustrating the fundamental
elements of a DRTP . Section 2 outlines the three primary and the associated secondary
dimensions of a DRTP . The remainder of the paper focuses on the mathematical represen-
tation of this problem. Given the complexity of our problem class, we present our notational
conventions in section 3. Then, sections 4, 5 and 6 give mathematical descriptions of the
three primary dimensions of a DRTP . Section 7 summarizes the optimization formulation of
a DRTP, providing a complete statement of the objective function, constraints and system
dynamics. Section 8 shows how a DRTP can be represented as a set of files giving in the
form of numeric data and software. Finally, section 9 summarizes the paper.
We wish to add what might be construed as a word of caution as this paper is read. We offer
here a tremendously general view of dynamic resource management problems in a relatively
abstract setting. It is only for the most complex problems that all the dimensions of this
representation would be used (the authors have been involved in problems that genuinely
use all of them). But, most students of operations research will find themselves using only
a small portion of the modeling concepts in this paper. For these students, we offer this
description as a way of highlighting modeling issues that might be important, but which
you may not yet have identified (if you try to solve problems in the real world, you will
start to find these issues arising). A strong understanding of all the dimensions of a problem

8
produces more informed questions when you are trying to learn about a problem. The focus
of the paper is notation, and we have developed a notational framework that simplifies the
modeling of very complex problems. However, it is not generally the best notation for the
very simplest problems.
1. Examples
Dynamic resource transformation problems arise in a variety of settings. Each of these
involves the transformation of one or more types of resources in a way that not only generates
costs, but also some sort of benefit that justifies the cost of transformation. Although
our interest is primarily in transportation-related problems, we include nontransportation
examples to stress the generality of the problem class.
A central feature of our problem class is that resources often occur in layers. Problems with
more layers are inherently more difficult to solve than problems with fewer layers. Below,
we list a series of applications, organized by the number of layers in each example.
• One layer problems:
– Classical inventory planning (but with no demand backlogging).
– Distribution problems (possibly multiproduct) with stochastic demands (but no
demand backlogging).
– The dynamic travelling repairman problem.
– Machine scheduling (with no setups).
– Airline crew scheduling problems (with fixed times for flights).
– Truckload fleet management I: managing the flows of (perhaps multiple types
of) trucks over a set of loads with fixed departure and arrival times.
– Less-than-truckload trucking I: the traffic assignment problem (routing ship-
ments).
– Rail operations I: distributing box cars to customers with no demand backlog-
ging.
• Two layer problems:
– Vehicle routing problems (vehicles and product).
– Machine scheduling with setups (jobs and machines).

9
– Personnel planning (assigning people to jobs).
– Fleet management (vehicles and loads or customers to be moved).
– Truckload fleet management II: optimizing the assignment of drivers to loads,
both of which may be served over specified periods of time (time windows).
– Less-than-truckload trucking II: routing shipments and trailers.
– Rail operations II: Scheduling locomotives to move trains.
• Three layer problems:
– Truckload fleet management III: (simultaneously managing drivers, tractors and
trailers).
– Machine scheduling (with setups) with operators (jobs, machines and people).
– Less-than-truckload trucking III: routing shipments, trailers and drivers.
– Rail operations III: Scheduling locomotives and crews to move trains.
• Four layer problems:
– Routing and scheduling for chemical distribution (driver, tractor, trailer and
product).
– Multiple machine scheduling (with setups) with operators (jobs, two types of
machines and people).
– Less-than-truckload trucking IV: routing shipments,tractors, trailers and drivers.
– Rail operations IV: Scheduling locomotives, crews and boxcars to satisfy external
customer demands that may be backlogged.
DRTP ’s involve objects with attributes that evolve over time as a result of various physical
processes. Examples of these processes include:
• Temporal processes - These are physical processes that govern how long a task or
operation takes. These include travel times, time required to execute a task, time to
clean a trailer, time to train a person, and off-duty and sleeping time.
• Economic processes - Each transformation is assumed to generate one or more mea-
surable quantities that are accumulated directly in an objective to be optimized.
These include the generation of costs, revenues, service measurements and measures
of equipment productivity or employee satisfaction.

10
• Discrete classification processes - Resources often have one or more discrete classifica-
tions that can change. This might be the location of a truck, the state of a machine,
or the skill level of a consultant.
• Aging and replenishment processes - Many resources have a dimension that undergoes
aging and replenishment. Examples include consumption of allowable work hours,
fuel consumption and deterioration of equipment.
• Arrival and departure processes - These describe the arrival and departure of re-
sources to and from the system.
• Information processes - Most important, information processes describe the arrival
of data into the system that can be used for making decisions.
The last dimension of a DRTP is the means by which the system can be controlled. Most
complex systems are run by more than one decision-maker, referred in the literature to multi-
agent control, while classical optimization models assume a single-agent structure. Given
a control structure, we need then to charactierize the means by which decisions are made.
A decision function may be rule-based (given a state, choose an action) or based on some
form of cost minimization. Simple problems may use cost, profit or level of service, but more
complex systems combine multiple measures, and may not even have quantifiable evaluation
criteria.
2. Dynamic resource transformation problems
This section provides a conceptual overview of a DRTP , summarizing all the major
dimensions and subdimensions, and discussing some of the conceptual issues. This section is
then followed by a more formal mathematical representation of all the elements in sections
(4), (5) and (6).
The first step in the development of a representational system is to describe the dimensions
of a dynamic resource transformation problem. A DRTP , in our view, is comprised of three
fundamental elements:

11
• Knowledge - This is the set of exogenously supplied data, and a set of inference
functions (which includes forecasting) used to estimate data elements that are not
currently known to the system.
• Processes - Here we capture the physics of the problem, comprised of the laws that
govern how the system evolves over time, physical constraints that must be observed,
and the evolution of information coming to the system.
• Controls - Controls describe what decisions need to be made, who makes them, how
information is provided to the decision maker, and how the decision maker separates
good from bad decisions.
We use this fundamental organization to represent an instance of a DRTP . We use the
general style of queueing theory and machine scheduling, and propose that dynamic resource
transformation problems be identified using the notation:
Knowledge || Processes || Controls
where each element (knowledge, process or control) can be replaced by a series of descriptive
abbreviations that describe the nature of that element. As such, our organization can be
used as a basis of a taxonomy. For reasons of space, we do not attempt to actually design
such a taxonomy in this paper.
As this paper was being written, there was active consideration of whether the first di-
mension should be called “resources” (which for many people refers to physical objects),
“information” (to more broadly capture the set of data that may or may not encompass
physical resources) or “knowledge” (which brings into play subtle distinctions between “in-
formation” and “knowledge”). If the reader is considering a problem involving the man-
agement of physical resources (drivers, trucks, planes, inventory), then the only interesting
type of information might be the resources themselves. In this case, we invite the reader to
use the notation “Resources||Processes||Controls”. The difficulty with using “Resources”
as the first dimension is that it does not leave us a mechanism for expressing other forms
of information (specifically, parameters that do not constitute resources) or the functions
which we commonly use to add to our knowledge base (most notably, forecasting equations
and aggregation functions).

12
We now summarize the subelements of each one of these dimensions. Our goal in this
section is to provide a comprehensive summary of the elements of a DRTP . We claim that
our list of three primary dimensions, and the subdimensions given below, is complete and
comprise all the dimensions needed to express this problem class. We acknowledge that
different people might organize the information within the subdimensions differently (in the
course of writing this paper, we progressed through a range of organizations before settling
on the structure presented here).
In our structure, we identify the subdimensions of a problem using numbers, as in K.1
(for the first dimension of information) or P.1.a (as in subelement 1.a of processes). Section
2.1 outlines the elements of information, section 2.2 does the same for processes, and section
2.3 summarizes the elements of controls.
2.1. Knowledge. As we emphasized earlier, there are two ways to approach a DRTP. The
simplest is to assume that the only interesting object being managed is a resource (particu-
larly, a physical resource), where all other information is static and where there is no use of
forecasting or other inference functions. In this case, our first dimension consists purely of
the attributes of the resources being managed. Here, we are presenting the first dimension
in its full generality.
The knowledge available to our system may be organized as follows:
K.1) Data knowledge - This includes all data that is exogenously supplied to the system
which is then used by the system. This includes:
K.1.a) Data about resources to be managed. This includes the resource classes, and
the vector of attributes that describe a resource class.
K.1.b) Data about parameters that govern the physics of the system (for example, travel
times and costs).
K.1.c) Data describing plans that have been made in the past which are to be used to
influence future decisions. Plans can be specified in three ways: plans (aggre-
gated forecasts of future decisions), patterns (forecasts of future decisions based
on the historical behavior of past decisions) and policies (rules that govern how
decisions should be made in the future).

13
K.2) Functional knowledge - This covers functions which allow us to infer knowledge about
data elements which cannot be directly observed, and includes:
K.2.a) Functions that allow us to infer knowledge that has not been directly given to
us (for example, the level of inventory of product at a retailer) but which can be
estimated from other information.
K.2.b) Aggregation functions, which are a powerful tool for inferring information. Ag-
gregation functions provide natural groupings of data that allow knowledge
about one part of a group to be used to infer knowledge about another part.
In our work, we have found aggregation to be an especially powerful tool.
K.2.c) Forecasting functions, which allow us to infer information that has not yet ar-
rived.
We are particularly interested in data describing resources. There are many applications
(routing and scheduling, physical distribution, fleet management, personel management)
where the only resource is a physical resource. It is common in such settings to drop the
adjective “physical” because these are the only resources being managed. For the most part,
this paper focuses on physical resources, and this should be assumed unless it is specifically
indicated otherwise. However, we invite the reader to consider other applications.
The reader may be considering a problem where the dimension of functional knowledge
is not relevant, and the only interesting data knowledge is about resources. In this case,
the reader should resort to the “resources||processes||controls′′ notation, where resources
consists of the resource classes (what are the different types of resources being managed)
and the attributes of each resource class (we provide formal notation for this below).
Data classes can be broadly categorized as follows:
• Static classes are classes with data that will never change within the context of a
model.
• Dynamic classes have data that will change. This class can be further categorized by
how the attributes of the object change. Attributes may change as a result of:
– Exogenous processes, such as weather, equipment failures, or decisions made by
exogenous agents, or

14
– Endogenous processes, reflecting decisions made within our system.
The concept of a resource is especially important in our paradigm since our focus is on how
to control this class of elements. For this reason, we need a formal definition of a resource:
Definition 2.1. A resource is an endogenously controllable information class which con-
strains the system.
We take as our premise that if something does not constrain the system, it is not a resource.
When we optimize the operations of a company, we do not model air and water because we
view them as infinite resources (the situation changes if we were to study pollution on a global
scale). But, is anything that constrains the system a resource? Here the issue becomes a
bit more subtle. Consider the flow of goods through a warehouse with a fixed capacity
that restricts how much can be controlled. The warehouse then becomes a resource which
needs to be managed effectively (if we cannot move all the goods right away, we need to
decide which goods should use this resource). But, if we do not fully use the capacity of
the warehouse in time t, this does not increase the capacity of our system at time t + 1. By
contrast, if a truck is not assigned to move a load now, it can be used later (and conversely).
For practical purposes, although we have to think about which goods move through the
warehouse at time t, we are not actually managing the warehouse itself. In this setting, the
capacity of the warehouse shows up as a parameter of our problem, and not as something to
be managed in any way. In our view, the warehouse would not constitute a resource. On the
other hand, if we are undertaking a planning process where we have to decide the capacity of
the warehouse, then the warehouse becomes an endogenously controllable information class,
and it now becomes a warehouse.
Any object that can be acted on to change its attributes is a resource (presumably this
resource generates costs and/or rewards as it is being modified, and since there is a finite
number of these objects, there is a limit to how many of them we can act on to generate
these rewards).
It is important to distinguish between resources in terms of what we can do with them:
Definition 2.2. An active resource class is a resource with attributes that can be endoge-
nously modified while remaining in the system. A passive resource layer is one that limits

15
the flow of active resources. Passive resources cannot be directly acted on, but we can control
the quantity that are available.
We do not have all the formalism required to define active and passive resources, but this
definition provides a general idea. Active resources are the resources that we are managing.
Passive resources enable the active resources to do their job (and if there are not enough
of them, then they prevent active resources from doing their job). Passive resources often
appear only as constraints. If the constraint is itself a decision variable (specifically, we
control how many of these resources are there), then the object is a resource. If the quantity
is fixed, then we would argue that it is simply a physical parameter and exclude it from
our set of resource classes. For example, in the military, certain types of aircraft that move
freight require a piece of equipment called a “K-loader” to load and unload. The number
of aircraft that can be loaded and unloaded in a period of time is limited by the number of
K-loaders that are available. K-loaders constrain the system, but if we have no control over
how many K-loaders are in the system, then this is no different than a physical capacity
constraint.
The concept of active and passive resources is more precisely defined in sections 2.3 and
6 when we formally define what we mean by controls. In the case of trucking, we might
consider three layers of resources: loads, drivers and trucks. A truck and a driver may move
empty, and a load, truck and driver may represent a loaded move. Assume that a truck
by itself cannot do anything. In this case, the truck would be a passive resource, while the
driver with the truck can move empty.
It can be argued that there are six broad types of resources: physical, financial, informa-
tional, time, energy and risk. Of these, the first three classes are special, since these are the
only classes that can be active in that we can act on them and change their attributes. The
last three are purely passive; we can decide on their quantity (for example, how much time
can be allotted to a project or an acceptable level of risk) but we cannot actively manage
them. Of course, physical, financial and informational resources may also be passive. (We
note that information is typically a passive resource, but there is emerging research on the
management of information as an active resource).

16
Definition 2.3. A reusable resource is one that remains in the system after it is acted on.
A perishable resource is one that vanishes from the system after it is used. Perishability
comes in degrees; a resource may undergo a loss of capacity after being used, but may still
remain in the system after a single use, but may eventually disappear from the system.
A closely related concept is persistence:
Definition 2.4. A persistent resource is a resource that remains in the system when it is
not acted on. A transient resource is one that either immediately or eventually vanishes
from the system, even when it is not acted on.
These two concepts allow us to define a resource that is persistent (it remains in the system
when we do not act on it) but is perishable (it vanishes after we act on it). Often, we will
assume that a transient resource vanishes from the system immediately if it is not acted on,
but we may talk about degrees of transience.
Important classes of persistent resources include:
Definition 2.5. A recurrent resource is a persistent resource that needs to continually cycle
back to a particular base state. A strongly recurrent resource needs to return to a base
state in a fixed period of time (drivers returning home at the end of the day; aircraft that have
to cycle back for a legally mandated maintenance check). Weakly recurrent resources have
an incentive to cycle back, but the force of this requirement is not as strong. Nonrecurrent
resources, such as trucks, trailers and containers, often move aimlessly around the system
with no particular constraint to return to a particular state.
Most applications involve a resource layer that can be viewed as a task, customer, job,
requirement or demand. A customer demand is a form of passive resource: it is endogenously
controllable, since we determine if (and possibly when) the demand should be satisfied, and
it constrains the system, since it limits how many times a revenue generating activity may be
undertaken. We acknowledge that many readers will probably have initial difficulty with the
notion that a “demand” is a type of “resource.” We do not feel that there is any difficulty
labeling a resource class as a task or demand, but notationally, it is important to understand
that tasks are just a special case of a resource.

17
An important distinguishing characteristic of transient resources is the set of entry and
exit points from the system. We propose the following definitions:
Definition 2.6. Point resources have a single point of entry and exit (e.g. a customer
demand at a point in the system which may be backlogged). Path-based resources have a
single point of entry and exit which are different. Tree-based resources have a single point
of entry with multiple exit points or a single point of exit with multiple entry points. General
transient resources have multiple entry and exit points (e.g. agricultural commodities that
can be produced and consumed at multiple points in the network).
An important dimension of a DRTP is the ability to build up complex resources from
simple ones. We define:
Definition 2.7. A primitive resource is an elementary, indivisible resource with a fixed set
of attribute types and predefined behavior. A composite (or compound) resource is formed
by joining two or more resources in different classes to make a resource with a combined set
of attributes.
Definition 2.8. We bundle two resources by joining two resources in the same object class.
We couple two resources in different classes.
A composite resource is a resource with attributes drawn from multiple resource classes.
For this reason we define:
Definition 2.9. A resource layer is a set of attributes drawn from one or more resource
classes.
Resource layers would be defined based on natural couplings of resources, such as “pilot
× aircraft”. While these are largely determined by the physical realities of the problem, the
choice of resource layers will generally be up to the modeler. It is useful to define:
Definition 2.10. A primitive layer is a resource layer with attributes drawn from a single
object class; a composite layer has attributes drawn from more than one class.
The concept of layering arises frequently in complex operations. Not all problems need the
complexity of layering (many problems can be effectively modeled as one-layer problems), but

18
it is important to provide the framework to handle more complex problems, where multiple
types of resources may be combined to form a new resource with a richer set of behaviors.
Compound resources arise in many settings. When the resources are people, they are
called teams. If the resources are financial assets, we call compound resources portfolios.
When the resources are components being assembled, we refer to the compound resources
as a product (to be sold).
Sometimes it is a bit tricky defining the set of resources, keeping in mind that we want to
define the simplest set of resources possible. In machine scheduling (in particular, problems
involving machines with setups), there would be two resource layers: machines and jobs. If
the machines do not have setups, then we can model this problem with one resource layer,
consisting only of jobs. The operations research literature has long used the vocabulary of
managing resources (such as people and machines) to serve customers (or tasks). In our
view, tasks and jobs are instances of customer orders which is a form of passive resource.
We make a clear distinction between customer orders, which are endogenous “resources” to
be managed, and customers, which are typically exogenous to the system.
2.2. Processes. The elements of processes are:
P.1) Information processes - Systems are affected by information processes that impact
the transformation of a resource. There are two types of information processes:
P.1.a) Exogenous information processes, which represent information updates from out-
side the system.
P.1.b) Endogenous information processes, which is the sequence of decisions being
made. Central to this dimension is the determination of when a decision should
be made (e.g. discrete time, in response to new information).
P.2) System dynamics, which are the physical laws that govern the evolution of the system
over time. There are three subelements in this component:
P.2.a) The modification of attributes - These are the equations governing how the at-
tributes of a resource change over time in response to endogenous and exogenous
controls.
P.2.b) The economics of a transformation (generation of costs and rewards).

19
P.2.c) The time required to effect a transformation, called the transfer time.
P.3) Constraints on transformations - These restrict our ability to transform a process.
We provide for exactly two classes of constraints:
P.3.a) Conservation of mass (a resource can not be in two places at the same time;
you cannot create or destroy resources, although they can enter and leave the
system).
P.3.b) Rate of process transformation - Here we explicitly account for the presence
of multiple resources where there is a restriction on the number of resources
that can be modified at any given time. Specific classes of rate transformation
constraints include:
P.3.b.i) Technology constraints - The speed of a machine or the size of a truck
both represent technological parameters that restrict the rate at which a
resource may be transformed.
P.3.b.ii) Exogenous controls - The rate of process transformation may be limited
by exogenous factors such as policies set by higher levels of management.
P.3.b.iii) Market demands - We provide a special category to represent the effect
of market demands, since satisfying a customer enables a special type of
resource transformation, that is limited by the size of the market. However,
a market demand can be represented by a constraint only in very special
cases (no advance information, and no demand backlogging).
The concept of decisions as an information process is unusual, but we will see later that
exogenous information and decisions both play a similar role. Furthermore, this characteri-
zation will lead us to a nonstandard mathematical description of the problem.
Virtually all of the physics of a real problem are contained in the dimension called system
dynamics. It is common in classical mathemathical programming paradigms to mix system
dynamics with what we call constraints into a group of equations called constraints. What we
refer to as a constraint is much more limited than what is normally modeled as a constraint
in an optimization model. For example, the time required to effect a transformation is a
type of constraint, but we capture this in the transfer function. Similarly, time window
20
constraints may be modeled in the cost function (e.g. a high cost for transformations that
are outside the time window) or through rules that govern allowable transformations.
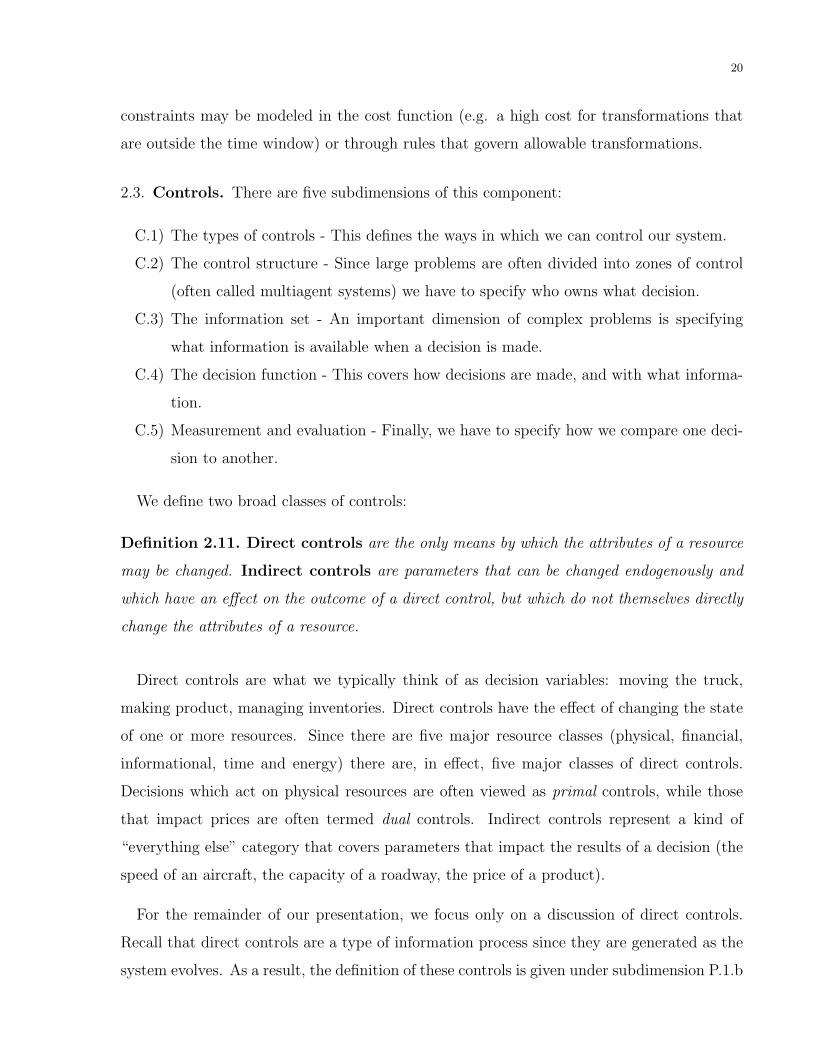
2.3. Controls. There are five subdimensions of this component:
C.1) The types of controls - This defines the ways in which we can control our system.
C.2) The control structure - Since large problems are often divided into zones of control
(often called multiagent systems) we have to specify who owns what decision.
C.3) The information set - An important dimension of complex problems is specifying
what information is available when a decision is made.
C.4) The decision function - This covers how decisions are made, and with what informa-
tion.
C.5) Measurement and evaluation - Finally, we have to specify how we compare one deci-
sion to another.
We define two broad classes of controls:
Definition 2.11. Direct controls are the only means by which the attributes of a resource
may be changed. Indirect controls are parameters that can be changed endogenously and
which have an effect on the outcome of a direct control, but which do not themselves directly
change the attributes of a resource.
Direct controls are what we typically think of as decision variables: moving the truck,
making product, managing inventories. Direct controls have the effect of changing the state
of one or more resources. Since there are five major resource classes (physical, financial,
informational, time and energy) there are, in effect, five major classes of direct controls.
Decisions which act on physical resources are often viewed as primal controls, while those
that impact prices are often termed dual controls. Indirect controls represent a kind of
“everything else” category that covers parameters that impact the results of a decision (the
speed of an aircraft, the capacity of a roadway, the price of a product).
For the remainder of our presentation, we focus only on a discussion of direct controls.
Recall that direct controls are a type of information process since they are generated as the
system evolves. As a result, the definition of these controls is given under subdimension P.1.b
21
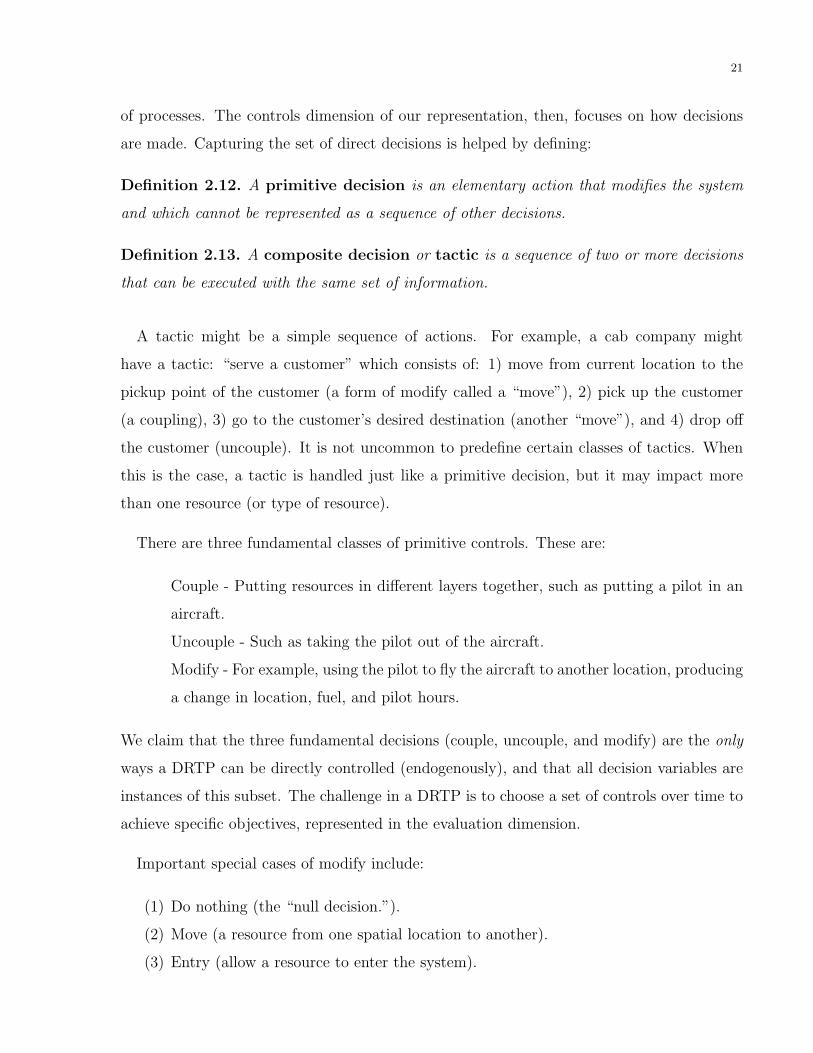
of processes. The controls dimension of our representation, then, focuses on how decisions
are made. Capturing the set of direct decisions is helped by defining:
Definition 2.12. A primitive decision is an elementary action that modifies the system
and which cannot be represented as a sequence of other decisions.
Definition 2.13. A composite decision or tactic is a sequence of two or more decisions
that can be executed with the same set of information.
A tactic might be a simple sequence of actions. For example, a cab company might
have a tactic: “serve a customer” which consists of: 1) move from current location to the
pickup point of the customer (a form of modify called a “move”), 2) pick up the customer
(a coupling), 3) go to the customer’s desired destination (another “move”), and 4) drop off
the customer (uncouple). It is not uncommon to predefine certain classes of tactics. When
this is the case, a tactic is handled just like a primitive decision, but it may impact more
than one resource (or type of resource).
There are three fundamental classes of primitive controls. These are:
Couple - Putting resources in different layers together, such as putting a pilot in an
aircraft.
Uncouple - Such as taking the pilot out of the aircraft.
Modify - For example, using the pilot to fly the aircraft to another location, producing
a change in location, fuel, and pilot hours.
We claim that the three fundamental decisions (couple, uncouple, and modify) are the only
ways a DRTP can be directly controlled (endogenously), and that all decision variables are
instances of this subset. The challenge in a DRTP is to choose a set of controls over time to
achieve specific objectives, represented in the evaluation dimension.
Important special cases of modify include:
(1) Do nothing (the “null decision.”).
(2) Move (a resource from one spatial location to another).
(3) Entry (allow a resource to enter the system).
22
(4) Exit (allow a resource to leave the system, a process).
The presence of a null decision is fundamental to a DRTP. In fact, we assume that there is
always a null decision, which means that we never have to worry about feasible solutions. In
most cases, the null decision literally means “to do nothing” but the precise interpretation of
“doing nothing” can depend on the context. For example, consider the problem of modeling
the flight of an aircraft through a series of decision points. At each decision point, the
pilot cannot literally “do nothing” since he must continue flying the aircraft. Here, the null
decision is to stay on course. Given the importance of the null decision, we introduce special
notation to represent them:
dφ = The decision to “hold” a resource.
Later, we provide specific conditions for the presence of the “hold” decision.
3. Notational style
Since this is a modeling paper, precise, elegant notation is critical. For this reason, we
follow a number of notational conventions that are designed to simplify the process of mod-
eling complex operations. If we have a vector a, we denote elements of the vector at all
times using subscripts. Since we have many quantities defined over time, we may view a as
the vector of all elements over all points in time, and at as the vector of elements at time
t, with individual element ait or aijt. We often need different flavors of a variable, such as
different types of costs, or different types of decisions. Rather than using different variable
names, we generally use the same variable with a superscript to denote a particular flavor.
Thus, we might use ch as a holding cost and cf as a fixed cost. If one flavor is used most of
the time, we may define this without a superscript. When there are multiple subscripts (or
superscripts), we feel that it best not to use commas to separate the subscripts unless there
is a specific need to do so. For example, we would write aijt but ai+1,jt.
We often need to update a variable iteratively. It is important to use a common variable
such as n (k is also often used) to represent the iteration counter. n is useful as an iteration
counter because variables such as i, j, k or ` often have other uses. Also, some algorithms
have inner and outer iterations; in this case, we recommend using n as the outer iteration

23
counter, and m as the inner iteration counter. We always put the iteration index in the
superscript (as in xn). If we are using the superscript to represent the flavor of a variable,
we may need to use a double superscript, as in x`,n; in this case, the iteration counter (n)
must be the outer index (since “x`” is the name of the variable). It is sometimes necessary
to have different flavors of the same variable. In this case, we recommend using notation
such as x and x.
We make extensive use of sets. Sets are denoted using the calligraphic font A, and subsets
are denoted using a subscript, as in Ac. Thus, for any set such as A, we would later make
a statement such as a ∈ A. Following our convention on superscripts, A represents a set,
while As represents a different set (the superscript forms part of the ”name” of the set);
Ac represents a subset of A (similarly Asc would be a subset of the set As). We always use
specific lowercase letters to index a set (almost always the lowercase version of the set), as
in a ∈ A, t ∈ T , c ∈ C. Thus, xt always refers to t ∈ T , while xi would always refer to i ∈ I.
The element xit, then, refers to the element i ∈ I, t ∈ T . If we need to simultaneously refer
to two different elements of a set, we would use a, a′, a′′, a or a to refer to elements of A.
We generally would not use b as an element of A. We say that we almost always use the
lower case version of a set to index the set, because some exceptions are bound to arise. For
example, it is very common in transportation to index a location by i and j (as in xij; our
notation would require us to say xii′ or even x`,`′ for locations ` ∈ L). We feel it is acceptable
to define i and j to be locations in, say, the set I (or some other set), but would insist that
i and j always refer to a city.
Every effort has been made to make the notation as mnemonic as possible. For example,
x is always a decision variable, t always refers to time, and so on. When we need different
variables for time, we use t′, t′′ and so on. We make extensive use of sets, and stringently
avoid numerical indices such as x1, x2, . . .. We have worked to make our notation “friendly”
to software implementation, and have adopted several C programming language conventions.
The extensive use of sets is important, since we often use subscripts which are themselves
vectors. Thus, xa might be the number of elements with attribute vector a. Summing over
these elements, then, is accomplished using notation such as∑
a∈A xa. We feel that this is
preferable to creating an index i where I = 0, 1, . . . , |A| are the elements in the set since
the numerical indexes have no inherent meaning.

24
Because of the importance of stochastic processes in our modeling paradigm, we need to
standardize our notation for random variables. It is fairly standard to represent a probability
space using notation such as (Ω,F ,P) where Ω is a set of elementary outcomes, F is a set
of events (think of it as a collection of the outcomes of a set of random variables), and P
is a probability measure defined on the space (Ω,F) (giving us, in effect, the probability of
an outcome in the set F). The notation Ω and P is fairly standard, but it is not unusual to
see E (set of events) H (set of histories) used instead of F . When information arrives over
time, it is common to define a series of subsets Ft (or Ht) which capture what is known by
a particular point in time (if Ft ⊆ Ft+1, then the process is a filtration, which is the reason
behind the popularity of the notation F).
One of the most difficult challenges is in the representation of a random variable, partly
because there is not a single standard in the research literature. Some common conventions
for representing random variables (capital letters, bold letters, letters with hats, the letters
X,Y or Z) are not generally workable in engineering applications. One easy way to express
that a function f is a random variable is to write it using functional notation: f(x, ω), which
indicates that the function depends on both x and ω. This is fine, but the reader needs to
realize that the probability community will often write a function, say St (the state of the
system at time t) without indicating what the function depends on (the functional notation
St(x, ω) is more common in engineering). It is common to simply define a function, say ft
to be, say, a Ft-measurable function (which means that ft is a function of the events in Ft),
and then the reader simply has to remember that the function is random (it is not indicated
in the notation). This is rarely an issue until it is necessary to take an expectation. Thus, if
ft is random and gt is not, then Eft + gt = Eft + gt. In some communities, it is perfectly
acceptable to write Eft(x, ω) + gt(x) = Eft(x, ω) + gt(x); the reader must be warned,
however, that this is not acceptable in the applied probability community, which views ω as
a number (not a random variable, which is always viewed as a function of ω), which means
that Eft is the expectation of the random function ft, while Eft(x, ω) = ft(x, ω), since given
ω, ft(x, ω) is no longer random.

25
4. Knowledge
The knowledge dimension of our representation captures what we know about our system.
There are two dimensions of knowledge: data knowledge, and functional knowledge.
4.1. Data knowledge. To capture the state of the system, we begin by defining:
CK = The set of data knowledge classes in our system.
Ect = Set of information elements within class c ∈ CI at time t.
Each data element has an attribute vector given by:
ae = Vector of attributes of element e ∈ E .
Ac = Attribute space of elements in class c, where ae ∈ Ac for e ∈ Ec.
We capture all the information in our system using:
Kt = The knowledge base (equivalently, the state of the database) at time t.
= ae, e ∈ Ect, c ∈ CI
The set K0 is given to us as data. Later, we formalize how Et and Kt evolve over time.
We need to divide information classes based on how the attribute vector ae evolves. Let:
CK,s = Set of information classes with static attributes.
CK,d = Set of information classes with dynamic attributes.
We now divide the classes with dynamic attributes into two groups: those with attributes
that change purely as a result of exogenous events, and those that evolve at least in part as
a result of endogenous events. Following our earlier definition, we create a special class of
elements which fall in the category of resources:
CR = Set of information objects that comprise our resources.
⊆ CI,d.
The basic data for resources is captured using:
26
Rct = Set of individual resources (in class c) at time t. This is the same as Ec
for c ∈ CR, but we need mnemonic notation that specifically refers to the
set of resource elements.
ar = Attribute vector of the rth resource, r ∈ Rt.
Ac = Space of possible attributes of resources in class c.
We can think of ar as data that would be read in from a file for a given resource r, and A is
the set of possible values of each element of a. A crew scheduling application, for example,
might have an attribute vector a = alocation, aDOThours, askillset. Then, Ac,location would be
the set of possible locations for an element in class c, and alocation,r would be the location of
the rth driver (at a particular point in time).
An important issue arises when representing the difference between what we know about
the system now, versus what we think will be true about the future. Thus, a vector of
attributes ar may describe the resource not as it exists “here and now” but rather as we
think it will exist at some point later (for example, a resource r is moving from i to j, and is
currently enroute between these locations; the vector ar may describe the attributes of the
resource as we think they will exist when it arrives at j). For this purpose, we define:
tr = The time at which the attributes of r (given by ar) becomes knowable.
tar = The time at which the attributes of r become actionable.
When modeling systems, we most commonly model the time that something becomes know-
able directly, while the actionable time behaves more like a parameter of the system. For
this reason, we do not put a superscript on tr. The concept of knowability vs. actionability
is often overlooked in the modeling of physical problems. It is common for resources to be
modeled based on when they are actionable without regard to when they became known.
The remainder of this section provides discussions of two special types of resources. Section
4.1.1 discusses simple classes of resources that are more commonly referred to as “commodi-
ties” in the operations research literature. Then, section 4.1.2 introduces a very complex
set of composite resources create by combining the attributes of different types of primitive
resources. Finally, section 4.1.3 reviews some important concepts in the definition of state
spaces.
27
4.1.1. Multiattribute resources and commodities. We wish to formalize the relationship be-
tween a multiattribute resource and what are often referred to as multicommodity flow
problems. To do this, we begin by observing that the elements of the attribute vector a can
be divided into two broad groups of elements:
a = (as, ad), where:
as = The static elements of a that do not change over time.
ad = The dynamic elements of a that do change over time.
We then define:
As = The space of possible outcomes of as.
Ad = The space of possible outcomes of ad.
For example, we might represent the attributes of a generic driver for a trucking com-
pany by the attributes: a = (alocation, adomicile, abid status, asleeper status, adriving hours, aduty hours).
Thus, as = adomicile, abid status, asleeper status would represent the static elements, while
ad = alocation,
adriving hours, aduty hours would be the dynamic elements.
We make this observation because it is common in some communities to view different
types of resources as commodities. To complete this important relationship, let the elements
of As be indexed by k, and let:
K = 1, 2, . . . , |As|
Then we may write:
As = askk∈K
Next, we define a set of states:
I = 1, 2, . . . , |Ad|
Ad = adi i∈I
(The use of the non-mnemonic labeling i ∈ I for states follows the standard convention for
multicommodity flow problems; it also avoids confusion between “static” and “state.”)

28
This notation allows us to provide a definition of the concept of a commodity that is
broader, and more formal, than is typically used in the literature:
Definition 4.1. A commodity k is a subset of resources Rk defined by:
Rk = r|asr = as
k ∈ As
If the concept of a commodity gives us a short-hand notation for the static attributes of a
resource, then we need a short-hand notation for the dynamic attributes of a resource. For
this purpose, we might define:
Definition 4.2. The state i of a commodity k is the vector of dynamic attributes adr = ad
i .
Thus, if ar is the attribute vector of resource r, then we would say that resource r is a
commodity of type k in state i if adr = ad
i , r ∈ Rk, i ∈ I.
In some applications, the dimensionality of the vectorAd is quite small, representing a type
of product (wheat or corn), a type of vehicle (Boeing 747, Boeing 727) or a pilot (identified
by a unique ID). In these problems, the concept of a “commodity” is useful. However, the
single word “commodity” is awkward when there are different resource layers, creating, for
example, different commodities that represent not only different types of aircraft, but also
different pilots, as well as the combination of aircraft and pilots. If a reader is comfortable
with the term commodity, we would suggest introducing the concept of commodity classes so
that different classes of commodity (aircraft and pilots) can be distinguished from different
types of resources within a commodity class.
4.1.2. Composite resources. One of the most challenging dimensions of more complex DRTP ’s
is the representation of different types of resources and their interactions. The bundling,
coupling and uncoupling of resources arises because in many problems, resources can be
organized in layers which can be coupled together to acquire new behaviors. In some cases,
resources in the same layer may work together, such as arises when multiple locomotives are
joined to create a single power unit (called a consist) to pull a train.
It is important to distinguish between resource classes, CR, and resource layers. Resource
classes might be a pilot, aircraft, navigator or fuel. A resource layer is generally a resource

29
coupled with one or more other classes (or layers). Resource layers arise when we want to
define resources that may be coupled with other resources. Let:
L = Set of resource layers (each comprised of a set of one or more resources
classes coupled together).
If a layer consists of resources from, say, classes 1, 2 and 3, then the attribute vector of this
layer is given by:
a1|2|3 = The attribute vector of layer 1
= a1|a2|a3
We illustrate our approach to layering using an air freight example with four resource classes:
(1) fuel, (2) aircraft, (3) pilot and (4) freight. Let the attribute vector of each class i be
given by ai ∈ Ai. There is a natural hierarchy in these layers: 1 → 2 → 3 → 4. That
is, we put fuel in the aircraft, then add a pilot, and then add freight. The combination
fuel|aircraft|pilot is an active composite resource (for example, I can fly this aircraft empty
from one city to another), or I can add in freight, and fly the aircraft loaded. We represent
these possible combinations using:
L = 1, (2|1), (3|2|1), (4|3|2|1)
The first layer is the fuel layer, which is a primitive resource. The second is the aircraft layer,
which includes the aircraft and fuel, and so on. We label each layer by its lead resource, so
the pilot layer is comprised of pilot|aircraft|fuel. We represent the attribute vector of each
layer using:
a3|2|1 = a3|a2|1
= a3|a2|a1
∈ A3|2|1 = A3 ×A2 ×A1
The vector a3|2|1 is formed of the original attribute vector a3 with additional elements that
represent fields indicating the potential for coupling with layer 2. Note that this field may be
empty, indicating (in this example) a pilot with no aircraft. Thus, a pilot layer may consist
of just a pilot, or a pilot coupled with an aircraft (which may in turn be coupled with fuel).

30
Clearly, the field that captures which aircraft a pilot is coupled with is a decision variable
and needs to be determined endogenously.
Wtih these concepts in mind, we define:
Definition 4.3. A layering is a set L of subsets of resource classes c ∈ CR, representing
all the possible composite resources that may arise in practice. A layer consists of a lead
resource class and any resource classes that may be combined with the lead resource class.
A resource class may be the lead resource class for only one layer.
Typically, each layer is given the name of the lead resource class, meaning that the number
of layers is equal to the number of resource classes.
We refer to attributes of layers using:
a(`) = Attributes of layer ` ∈ L.
A(`) = The space of attributes of layer `.
If ac is the attribute vector for resources in class c, then we would use a(`) to represent the
attribute vector for resources in layer `. In principle resource layer ` could be a primitive
resource class, but generally a resource layer will represent a concatenation of attribute
vectors. In our example above where layer 2 consists of (2|1), we would write a(2) = a2|1 =
a2|a1.
An important dimension of coupling is determining the physics of what can be coupled
with what. For example, you need one pilot (or crew) per aircraft, but you can put two
pilots on an aircraft, with one flying the aircraft and the other repositioning (flying free).
We may need three locomotives to pull a train, but put five locomotives on the train because
we need to reposition power (or put only two locomotives if that is enough to move the train
and we are short on power). These issues are captured by parameters of the resources and
physical laws represented in the system dynamics (see below).
4.1.3. A note on state spaces. It is useful to discuss the issue of state spaces, since in our
problem class, there are different ways of measuring the number of states. We can say that
a ∈ A is the state of a particular resource, Rat is the number of resources in this state at time

31
t, and Rt is the state of our system (actually, only a portion of our full system state). The
mathematics of control theory and dynamic programming always refer to the state of the
system. In our problems, we need to capture the state of the system, but we also find it useful
to represent the state of a resource. For example, it is not unusual to have someone note
that a system has a large state space. We are often more interested in the size of the resource
state space A than we are in the size of the system state space. Thus, if N =∑
a∈ARat is
the number of resources in the system at time t, then |A| is the size of the attribute space,
while the state space S is the set of all possible instances of the vector Rt. If any resource
can be in any element of A, then the size of our state space can be shown to be given by:
|S| =(
N + |A| − 1
|A| − 1
)If we have an instance of a single salesman spread among 50 cities, then both our resource
and our system have 50 states. If we have 100 salesman that we can distribute among 50
cities, then each resource may have 50 possible states, but our system has approximately
6.7 × 1039 states. This is not even a big problem. In Powell & Shapiro (1996), a problem
instance is given with |A| = 1, 188, 000, and N = 6000. Thus, we wish to avoid formulations
that require working explicitly with the full system state variable.
Even our resource state space can become extremely large in the presence of multiple
resource layers when we want to consider both primitive and composite resources. In practice,
modelers often avoid the complexity of composite states by handling these states in a simple
way. For example, an idle taxicab usually belongs to a fairly small set of states (perhaps the
set of discrete locations). When a cab picks up a customer, he will move through a sequence
of intermediate steps which include picking up the customer, and driving through a series of
nodes on the network before arriving at the destination. This sequence of steps is typically
handled in a simple way.
Let A be the set of all possible states, including all possible composite states made up of
coupled resources. We can typically divide this state space into:
Apc = Set of primary states (in class c).
Asc = Set of secondary states (in class c).

32
where Ac = Apc
⋃As
c. We only store the vector Rat for a ∈ Apc . Thus, we have a real incentive
to keep |Apc | as small as possible.
The choice of what is a primary versus a secondary state is up to modeling judgment. For
example, Apc might include an empty vehicle sitting idle at any location, a driver at rest at
his home domicile, or a machine that just completed a job. As a rule, the simulation of a
resource should proceed from one primary state to another, with secondary states serving
more as intermediate accounting points. Typically, it is not possible to model the arrival of
new information which requires a change in decision in between secondary states.
The distinction between primary and secondary states is a powerful modeling tool. For
example, a pilot may be sitting at home, or may be coupled with an aircraft, navigator and
stewarding crew half way through a trip. This is a very complex state, and if we had to
enumerate them all, the problem would normally be far too large. However, we can use
specialized algorithms to track a resource from one primary state to another within the
setting of a subproblem. In this way, secondary states can be generated and destroyed on
the fly. It is through the primary states that we communicate the impact of decisions in
one subproblem on another, so primary states that have been visited normally have to be
retained.
4.2. Functional knowledge. Functional knowledge is expressed as mathematical functions
which are used to enhance our knowledge base. In particular, there may be data elements
which are missing or which are not known with certainty. These may be data elements that
describe the system now (how many items are on the retailers shelf right now?), or the future
(how many customers will purchase my product over the next week?). We can make random
guesses, but functional knowledge allows us to make more informed guesses.
Equations for forecasting data elements come in a variety of forms, and we do not make
any effort to summarize the vast statistical forecasting literature that can be used to esti-
mate unknown data elements. There is one class of functions, however, that deserve special
mention. Given a resource with an attribute a, it is not uncommon for us to make decisions
which do not require all the elements of a. We express the important elements of the at-
tribute vector a through the use of an aggregation function. In most complex versions of a

33
DRTP , there are likely to be a family of aggregation functions. We represent these using:
Gn : A → AGn
where Gn is the nth level aggregation of the attribute space A. While it may be that
AGn ⊆ AGn+1, this will not always be true (for example, a driver may have a location which
is a city, and we may aggregate this into whether he is at home or not, outcomes that are
not instances of cities). Since multiple resources may aggregate into the same element, we
define:
Ra,t = number of resources at time t that are expected to have attribute a.
=∑r∈Rt
1G(ar)=a
Rt = vector of elements of Ra,t
where 1x is the indicator variable which is 1 if x is true, and 0 otherwise. If we are using the
nth level of aggregation, we will refer to the vector RGn. Normally, we would have preferred
to use the lowercase vector rt to indicate the vector of resources, but this creates confusion
with the elements r ∈ R.
5. Processes
The process component of a DRTP includes the elements that describe how a system
evolves over time, excluding the control of the process which is covered under the third
dimension. Our discussion of processes covers three subdimensions: information processes,
system dynamics, and the specification of constraints.
Our representation of processes requires that we first adopt a convention for labeling time.
For dynamic problems, it is often convenient to index variables using a time index that is
relative to the current time. We let tc refer to clock time and t refer to relative time. Let:
tccurrent = The absolute clock time corresponding to t = 0. tccurrent may be a piece
of data, or it may be a function which, when referenced, returns the
“current” time.
tc(t) = The clock time corresponding to relative time t.
= t + tccurrent.

34
In a planning setting, the clock tccurrent is a fixed number. In a real-time control setting, the
clock tccurrent is changing (possibly continuously, or perhaps only in periodic jumps, such as
once an hour).
We find it useful to distinguish between the past, defined by events where t < 0, and the
future represented by t > 0. With this indexing, t = 0 is called “here and now.” Since we
sometimes have to refer to different points in time in the context of a single variable, we will
use the indices t, t′ and t′′ where it will generally be true that t ≤ t′ ≤ t′′. We often have to
refer to what we know at time t about what will (or might) happen at time t′, which might
be represented using xt,t′ . We use the notation xt,Tt to refer to the entire vector xt,t′t′∈Tt
for a given set of (generally contiguous) time periods Tt.
Variables of the form xt,t′ arise frequently in dynamic models, representing information
about time t′ that is known at time t. In most models, time t = 0, representing here and
now, whereas t′ ∈ T ph represents a point within the planning horizon in the model. When
this is the case, it is more compact to use the simpler notation xt where t ∈ T ph and all
information is assumed to be relative to “here and now.” This creates a potential notational
ambiguity, since we also will use xt to represent the family of vectors xt = xt,t′ , t ∈ T pht .
We suggest that in the formulation of a model, the reader should consistently adopt either
a single or double time indexing style to avoid this confusion.
Our discussion requires that we define:
T pht = The set of time periods in the planning horizon for a decision made at
time t, where all the data that may directly or indirectly impact the
decision at time t must fall within the planning horizon.
T iht = The set of time periods in the implementation horizon for a decision
made at time t, reflecting the set of time periods over which decisions
that have been planned will be implemented without replanning with
new information.
T sh = The set of time periods in the simulation horizon, representing the total
number of time periods over which we will be evaluating a given policy.

35
The definitions of these horizons imply that T iht ⊆ T ph
t ⊆ T sh. The planning horizon
captures the time periods where data of any form may impact a decision at time t. The
implementation horizon captures the set of time periods where decisions planned within
those time periods may have a direct impact on a decision at time t.
Our terminology is consistent with the literature on planning horizons. We have avoided
explicit reference to forecast horizons and decision horizons, which have formal definitions
(see, for example, Bhaskaran & Sethi (1987), Bes & Sethi (1988), Aronson & Chen (1989),
Sethi & Bhaskaran (1985)). White (1996) discusses “decision rolls” which involve the imple-
mentation of a one-period decision (based on a T period horizon) and “horizon rolls” which
involve the implementation of all decisions made within the T period planning horizon.
We have replaced the concept of a “decision roll” with an “implementation horizon.” It
is customary to assume that the set of events |ΩT ih| = 1, which is to say that there is only
one set of possible outcomes within the implementation horizon. We do not require this. It
is possible to have |ΩT ih| > 1, but this means that we would have to determine a decision
x(ω) for ω ∈ ΩT ih (since we do not allow replanning within the implementation horizon, we
would have to compute a decision for each possible outcome). This, in fact, is exactly the
approach used by the stochastic programming community.
5.1. Information processes. An explicit dimension of our representation of the system is
the arrival of information to the system.
We consider two classes of information:
1) Exogenous information processes (new information arriving to the sys-
tem).
2) Endogenous information processes (internal decisions).
Although the process of making decisions is covered under the dimension “Controls,” we
need to capture the effect of a decision on our process. We found that there are parallels
between exogenous information and decisions that seem to be overlooked in the classical
modeling literature.

36
5.1.1. Exogenous information processes. We can divide exogenous information processes into
two broad classes:
1) Information generated by an actual exogenous process.
2) Information generated by a forecasted exogenous process.
From the perspective of building a model, we deal only with forecasted processes. These are
generally much simpler than actual processes. For example, we may wish to model weather
delays to aircraft, but not mechanical failures or the fact that a crew may not show up for
work.
The only information that we can model is information that updates an element within our
system. Recall that CK represents our set of information classes in our system and that Ect is
the set of all information elements in class c at time t. To model the process of information
arriving to the system, let:
Ect = The set of new information elements arriving at time t for class c. If
e ∈ Et but e6∈Et then this represents a new information element entering
the system.
κet = An individual data packet arriving at time t to update information ele-
ment e ∈ Et.
κt = The collection of all information arriving at time t.
=⋃
e∈Et κet
An information packet contains two types of information. First, we can think of an infor-
mation packet for element e as consisting of a revised set of elements of the vector ae (in
general, a packet will consist of an update of only a subset of these elements). The second
piece of information is when this data will become actionable, which we define as:
tactet = The time at which the information in κet becomes actionable, which is to
say the first time that it can be used in the system dynamics (see below)
to describe the evolution of the system. We assume that tactet ≥ t.

37
(A more general representation would provide for a tact for each element in ae; our represen-
tation will do for now.) Following our convention earlier (see section 4), we let aact = tact
store the time at which the data in a becomes actionable.
As each new piece of information arrives, we assume that there is a process for updating
the database in some way. This can be generally represented using:
K ′ ← UK(K, κe)(1)
or:
Kt+1 = UK(Kt, κt+1)(2)
The update function is easiest to understand using the version in (1). If the element e ∈ E ,
then typically the update function is taking the new elements in κe and modifying the
appropriate elements in ae. If e is a new element, then the update function has to augment
the set of elements E and then add the new element. Similarly, we assume that there is a
protocol for indicating when an information element e needs to be dropped from the set E .
In general, the sequence κt will be random, so, using standard convention, we define:
Ω = The set of possible outcomes of data packets κt, t ∈ T , for points in time
t ≥ 0.
κt, then, is a random realization with outcome κt(ω). The probability community prefers
to let ωt represent the information arriving in time t, but in this setting, ωt is simply an
element of ω, and is not itself a random variable. We let ωt = κt(ω) represent an outcome
of our random variable κt.
It is useful to introduce special notation for updates that represent the arrival of new
resources to the system. Let:
Rtt′ = The set of (discrete) new resources that become known to the system at
time t, and which become actionable at time t′.
Rt = The set of all resources that become known at time t.
Ratt′ = The number of new resources with attribute a that become known at
time t and which become actionable at time t′.
Rt = The vector of resources that become known at time t.

38
It is sometimes easiest to use the set notation Rt when we are modeling discrete resources. In
other settings, it is more convenient to use the vector Rt. If all resources become actionable
as soon as they become known, then we can drop the second time index t′.
Remark: At this point, it is useful to contrast our representation with classical stochastic
processes. Let ht = κ0, κ1, . . . , κt−1 be the history of the (forecasted) process, giving all
the events prior to time t (but after time 0). Assume that ht ∈ Ht and let Ft = σ(Ht) be
the σ−algebra on the set Ht. As a rule, Ft ⊆ Ft+1 which means that events up to time t
are not forgotten by time t + 1 (since these events remain in the information set). In this
case, Ft is a filtration (hence the notation Ft). In real systems, this standard assumption is
often violated. The update process UK(Kt, κt+1) typically does in fact “forget” past data. It
is not unusual for corporate databases to retain detailed records of only a limited subset of
past history. For this reason, our notation Kt more accurately depicts the real information
flow.
The sample space Ω must be defined over some horizon. When necessary, we use notation
such as Ω∞ to denote an infinite horizon, or ΩT to denote a sample space over a set of
time periods T . An element ω ∈ ΩT , then, represents a particular outcome of the sequence
κt, t ∈ T .
The vector Kt captures the data about all the objects in the system. The subset of
information about resources is, for the most part, contained in the vector Rt. In some cases,
however, it is notationally convenient to have a global set Kt to describe all the data for the
system. The data in Kt that is not captured by Rt primarily covers parameters used in the
modify function (defined below).
We now wish to distinguish between actual and forecasted processes. The sequence of
data packets κt, t < 0 represents information that has actually happened, whereas κt, t > 0
represents information that might happen in the future. While these two sets should be
defined with respect to the same probability space, in practice this will never be true. (We
assume that “actual” events are drawn from a probability space (Ωa,Fa,Pa).) Similarly,
simulated events are defined with respect to a probability space (Ω,F ,P). Also, we will
always need to estimate the probability measure P , whereas we will generally not need (nor
will we be able) to estimate Pa.

39
An important difference between actual and forecasted events is that we have no control
over what actually happens, but we can make simplifying assumptions with regard to what
we are forecasting will happen in the future. For example, while we may receive actual
updates on both resources and parameters, we generally only forecast updates to resources
(customer orders being called in, changes in driver ETA’s, and so on). Other data may also
be changing (for example, the price of fuel) but we may not want to model these changes in
the future.
The challenge of forecasting is to estimate the set of outcomes Ω and the probability
measure P . For simplicity, assume that outcomes are discrete, so that for ω ∈ Ω, the
probability p(ω) is well defined. There are four strategies that are generally used to create
a probability law for the forecasted sample space Ω:
1. We ignore future events (Ω is empty).
2. We use a point estimate of the future, which is assumed to occur with probability
one (in this case, we assume that |Ω| = 1).
3. We use past history to estimate the parameters of an assumed probability distribution
(e.g. normal, Poisson). In this case p(ω) is derived from the assumed probability
distribution, from which we can calculate expectations or randomly sample outcomes.
4. We use a set of samples drawn from past history to create a (finite) sample space of
future outcomes (typically, p(ω) = 1/|Ω|).
Myopic models use the first option, deterministic models use the second option, and most
stochastic models use the third. The stochastic programming community (and especially
the modeling of financial problems) uses the fourth option, primarily because there is not an
accurate mathematical model of the underlying physical processes.
Both deterministic models and stochastic models require the ability to estimate parameters
from which a probability distribution may be constructed. To formalize this process, define:
ρtt′ = Vector of parameters at time t to be used to forecast a realization of a
random outcome at time t′.
ρett′ = Subvector of ρtt′ used to estimate at time t the outcome of element e ∈ E
at time t′.

40
ρt = ρtt′ , t ∈ T pht
The subvector ρett′ might be the mean and variance of a travel time or a fuel price. We
may wish to represent this outcome explicitly as a normal distribution, or simply use a point
estimate (such as the 80th percentile estimate of the travel times).
We have written the estimation of our parameters as ρt,t′ , but in practice, we typically
only have estimates as of time t = 0. We could, in theory, update ρ as simulated events
occur (that is, κt for t > 0), but this is not normal modeling practice.
We represent the process of estimating the forecasting parameters using another class of
update function, which we denote U f . The update process would be written:
ρt+1 = U f (ρt, κt+1)
We close this discussion by observing that there are two views of the future that need to
be represented. We have represented Ω as the set of outcomes that we are forecasting may
happen in the future. This set may include the possibility of a number of extreme outcomes
that we do not necessarily want to consider when developing a plan. For this reason, we
define:
Ωp = The set of outcomes that we wish to plan on during the horizon T ph.
We give the set Ωp a special name because it is the set of outcomes that a company has
planned on when developing a strategy. This set may contain a single outcome, or a set of
“anticipated outcomes.” This representation allows us to capture the behavior of companies
to plan for certain contingencies, but not all of them. The set Ωp may be the same as Ω,
but not necessarily. If they are different, then we are planning around a set of anticipated
outcomes (or a single outcome), but we may still want to evaluate a solution in terms of a
larger set of outcomes.
5.1.2. Endogenous information processes. In addition to exogenous information, our system
evolves as a result of endogenous information, in the form of a sequence of decisions. A
thorough discussion of decisions and other methods of control is given in the third dimension
of our paradigm. Here, we are not so concerned with the issue of how decisions are made or

41
even the exact types of decisions, but rather with the fact that there is a set of decisions,
and these are triggered by specific events exogenous to the system. Let:
D = The set of different types of decisions that can be made which act on the
resources in our system.
There are two classes of decisions:
Definition 5.1. Direct decisions act on an (active) resource class and change the attributes
of the class. indirect decisions modify a parameter of the problem (a price, the speed of
operation, the capacity of a process).
For the case of direct decisions (which act on resources), we need to count the number of
times a particular transformation is made. For this reason, we define the counting variable:
xadt = Number of times decision d was executed at time t on a resource withattribute a.
We sometimes use the notation xadt(ω) when we want to express the dependence of the
decisions xt on a specific set of outcomes.
We call xt = xtt′ , t′ ∈ T ph
t a plan, just as we call ω = κt, t ∈ T ph a forecast. Viewed
in this way, we can think of a plan as a forecast of future decisions.
Remark: It is useful to briefly contrast our notation with classical modeling techniques.
First, we note that it is more common to represent flow, say from node i to node j, as
xij. This would be comparable to writing our counting variable as xaa′ (letting the time
dimension be implicit in a and a′). In simple problems, the xij representation works because
we think of the decision as going from i to j. In our more complex problems, the decision
might be to move from location i to location j, but this decision carries implications on the
evolution of other dimensions of the attribute vector. Thus, we do not really decide to go
from state a to state a′, but rather we are in state a, and decide to implement an action
d ∈ D. The outcome a′ may be uncertain, so it is inappropriate to write xa,a′ unless we want
to condition on the outcome.
Aside from the source of the information, the biggest difference between an exogenous
information event κt and an endogenous decision dt is the means by which the information

42
changes the knowledge base. In the case of exogenous information, the update is handled
through the update function UK . Typically, we assume that a data packet κet is directly
revising elements of an attribute vector ae. In the case of a decision, the impact on the
system is handled through the system dynamics, described later.
The concept of a “planned” set of (possibly random) outcomes is widely used in practice,
although in these cases the plans are generally deterministic. Often, along with the set Ωp
we may also define:
xpt,Tt
= A plan, made at time t, in the form of a set of decisions over a set of
time periods Tt.
A plan xp is often a set of decisions that has been developed at an earlier time and commu-
nicated to individuals that are exogenous to our system. For this reason, deviations from
plan come with a cost. If |Ωp| > 1, we might specify a plan for each outcome, that is, xp(ω)
for ω ∈ Ωp.
5.1.3. A note on model updating. It is important to distinguish between the updating of
information due to actual exogenous processes (which by definition occur in the past) from
the updating of information due to simulated processes in the future. The issue is most
significant in the context of forward algorithms that start at time t = 0 and progress forward
in time, using a Monte Carlo sample. Such procedures are used in simulation software, and
are becoming increasingly popular in problems that use dynamic programming (see Sutton
& Barto (1998) and Bertsekas & Tsitsiklis (1996)) and Bender’s decomposition in stochastic
programming (Higle & Sen (1991), Infanger & Morton (1996), Morton (1996) and Pereira &
Pinto (1991)).
When we are working in the future, it is common to simulate a new event that wemay
reference as κt(ω) (the dependence on ω indicates that this is a random sample), and then
update the knowledge base:
Kt+1(ω) = UK(Kt(ω), κt+1(ω))
but we generally would not update the forecast parameters ρ, since these would have been
estimated using purely historical data.

43
5.2. System dynamics. At the heart of our DRTP is a function, which we call the modify
function, which captures the changes induced by a control. This function can be represented
as the mapping:
Mt(a, d, Kt)→ (a′, c, τ)(3)
where:
a = The attribute vector of the (possibly composite) resource being modified.
d = An endogenous (or exogenous) control.
Kt = The knowledge base of our system at time t.
a′ = The attributes of the modified resource.
c = The (possibly vector of) costs (or contributions) resulting from the action.
τ = The transfer time, giving the time required to complete the action.
(Note the convenient mnemonic that the right hand side of (3) spells “act.”) This represents
a modification of an attribute at time t based on a decision to be implemented at time t.
The knowledge base Kt depends, of course, on the flow of exogenous information κt, t ∈ T .
An instance of this sequence of information is captured by an element ω ∈ Ω, meaning that
we can equivalently write (3) as:
Mt(a, d, ω)→ (a′, c, τ)(4)
This way of writing the system dynamics is popular in certain parts of the modeling literature.
It is both mathematically accurate and notationally more compact, but it does not express
as precisely the information content of a decision as the forms expressed in (3). The applied
probability community will use the representation in (4), where it is “understood” that the
modify function uses only the history of ω up to time t. It is somewhat more precise to
write Mt(a, d, ht) where ht is the history of the process (some communities use ωt to capture
the history up to time t, but this runs against our notational style), or Mt(a, d,Ht), where
Ht is the σ−algebra generated by ht (many people use Ft instead of Ht). As we observed
earlier, this carries the implicit assumption of a memoryless process which is independent of
the updating mechanism UK .

44
We use both systems in our discussion; we prefer the representation in (3) when the
additional precision is needed, and we use (4) when we simply want to capture the dependence
of a transformation on exogenous information.
If a resource is a composite resource, then this fact is reflected in the elements of the vector
a which indicates the presence of coupled resources. The modify mapping must be coded to
check for the presence of coupled resources and update the attributes of these resources as
well.
We generally need to know how a decision actually impacts the system. Let:
δa′tt′(a, d, ω) = Change in the system at time t′ given a decision executed at time t.
=
1 if Mt(a, d, ω) = a′, t + τ = t′
0 otherwise
Note that we represent the triplet (a, d, ω) as an argument for δ, because we think of δ as a
function with argument (a, d, ω).
Using this notation, we can express the evolution of the system using:
Ra,t+1,t′(ω) = Ratt′(ω) + Ratt′ +∑d∈D
∑a′∈A
δatt′(a′, dtt′ , ω)xa′dt a ∈ A, t′ > t(5)
Equation (5) contains three elements on the right hand side: 1) what we knew about the
status of resources for time t′ at time t, 2) the exogenous changes to resources (for time t′)
that arrived during time t, and 3) the endogenous changes to resources for time t′ that were
made during period t.
We note that Rt has been defined to include only information known prior to time t.
For reasons that we cannot fully explain in this paper, we define Rt to be an incomplete
resource state vector (see Powell et al. (2000)). This simplifies the development of certain
approximation strategies based on dynamic programming.
5.3. Constraints. In section 2.2, we divided constraints between conservation of mass (or
conservation of flow) and constraints on the rate of process transformation. Conservation of
flow at each point in time t is easily written as:∑d∈D
xadt = Rat ∀a ∈ A(6)

45
We listed three types of constraints that restrict the rate of process transformation. All
three of these can be modeled in the same way. Using the counting variable xadt we can
express constraints on the rate of process transformation. We might, for example, require
that:
xadt ≤ uadt
where uadt(ω) may represent a physical constraint (the capacity of a truck or terminal) or a
market demand (the transition a→ a′ may represent satisfying a demand, where uadt(ω) is
the amount of the demand). As we point out later, we can only represent a market demand
as a constraint if unsatisfied demands are lost. Note that we allow the bound to be a function
of both endogenous and exogenous controls.
In some cases, a constraint is specified at an aggregate level. Given subsets A′, T ′ and D′,
we may write:
xA′,D′,T ′(ω) =∑a∈A′
∑d∈D′
∑t∈T ′
xadt(ω)
then we may require that:
xA′,D′,T ′(ω) ≤ uA′,D′,T ′(ω)
It is extremely valuable, perhaps even essential, in a stochastic control problem that a
feasible solution always exist. For this purpose we make the following assumption:
Assumption 1: If a ∈ Ap (a primary state), then dφ ∈ Da.
This allows us to assume that the hold option always exists from a primary state. Then, we
impose:
Assumption 2: Given any finite upper bound uA′,D′,T ′(ω) we require that dφ 6∈D′.
Thus, we cannot limit our ability to hold (in a primary state). In our work, we have never
found it necessary to use a hard constraint on our ability to hold resources in a primary
state. By requiring that the hold decision be unconstrained (although it may face cost and
time penalties) we guarantee that there will always be a feasible solution to any DRTP .

46
The reader will notice that we have pointedly left out constraints such as time window
constraints. It is our belief that the phrase “time window constraint” is a phrase based on
the vocabulary of linear programming. Time windows arise as a result of a reward structure
that varies over time. In static problems, one way of capturing this nonlinear structure is
through a constraint. Our belief is that time windows are not true physical constraints (that
is, we do not violate any physical laws if a time window is violated), and therefore should
be modeled through the reward structure, and not as a constraint.
6. Controls
We now turn our attention to how decisions are made. This discussion is divided into five
components: the types of decisions, the control structure, the information set, the design of
the decision function, and measurement and evaluation.
6.1. Types of decisions. Let:
CD = Set of decision classes.
Dc = Set of specific decisions in class c ∈ CD.
D =⋃
c∈CD Dc
For example, an airline might have the control classes:
CD = move aircraft, purchase aircraft, accept reservation, set ticket prices,
cancel a flight
The class “move aircraft” might include decisions:
Dmove aircraft = Chicago, Detroit, Newark, . . .
It is often convenient in practice to define:
Dc,a = The set of decisions in class c that can be applied to resources with
attribute a (if the control class is implicit, we simply writeDa to represent
the set of decisions that can be applied to a resource with attribute a).

47
It is useful to think of the set Da as a function. As such, this is one of the most important
functions in practice that describe a physical problem. Through it, a user can imbed a
considerable amount of insight into the types of behaviors a system is allowed to have. It
is important to emphasize that this notation implicitly assumes that the set of allowable
decisions is based on the attribute of the resource being acted on, rather than the state of
the entire system. We make this assumption because it is the most practical. We depend on
the optimization algorithms being used to capture the rest of the state of the system.
6.2. Control structure. Large, complex systems invariably exhibit a multi-agent control
structure. We propose that any set of decisions D =⋃
c∈CD Dc can be broken along three
dimensions:
1) A subset of the attribute space. This subset may be based on geography, the type of
resource being managed, and the status of the resource.
2) A subset of the control classes which are the responsibility of an agent.
3) A subset of time periods within the planning horizon.
We define the decomposition of the problem using:
Q = Set of subproblems that encompass the problem.
Aq = Subset of the attribute space for subproblem q, where⋃
q∈QAq = A and
Aq1
⋂Aq2 = φ when q1 6= q2.
CDq = Set of control classes associated with subproblem q.
T ihq = The implementation horizon for subproblem q. This is the set of time
periods during which subproblem q controls the decisions.
The information elements within our control would be given by:
Eq = e|ae ∈ Aq
If we let dt be a decision to be implemented at time t, then we can define the set of decisions
in subproblem q:
Dq = Subset of decisions in subproblem q.
= dt′ ∈ Da,c, c ∈ CDq , a ∈ Aq, t
′ ∈ T ihq

48
Recall that we may make a decision at time t to be implemented at time t′. The element q
implies the implementation time, but not the time the decision is made. For this reason, we
let:
Dqt = Set of decisions that are planned at time t in the setDq to be implemented
(by definition of q) within the interval T ihq .
When we divide a problem into subproblems, we need to establish a few concepts estab-
lishing the relationship between subproblems. First define:
Definition 6.1. We say that two decisions in the same subproblem are tightly coupled.
Two decisions that impact each other (perhaps indirectly) which are not in the same sub-
problem are loosely coupled.
We especially need notation that describes what subproblems are affected by decisions in
other subproblems. For this we define:
Definition 6.2. The forward reachable set is given by:
→Mq = q′ ∈ Q | ∃ a ∈ Aq, d ∈ Dq with M(a, d, ·) 7→ (a′, ·, ·), a′ ∈ Aq′.
Thus, the forward reachable set is the set of subproblems q′ which can be reached directly
from q. Conversely we may define:
Definition 6.3. The backward reachable set is given by:
←Mq = q′ ∈ Q|q ∈
→Mq′
An important special case of a control structure is where Q = T , which is to say that
subproblem q is equivalent to time t. Frequently, we will address a problem from the per-
spective of a single subproblem (in the sense that we are looking from the perspective of
a single agent), but we still have to model the evolution of information over time. In this
special case,→Mq=
→Mt= t + 1.
6.3. The information set. Up to now, we have used the word “information” in a rela-
tively general way. As preparation for building a decision function, we have to specify the
information that is available to us when we make a decision.
49
There are four fundamental classes of information that we may use in making a decision:
Knowledge] (Kt)- Exogenously supplied information on the state of the
system.
Forecasts of exogenous information process (Ω) - Endogenously created
forecasts of future exogenous events.
Forecasts of endogenous information processes (xp) - Plans of future de-
cisions.
Forecasts of the impact of decisions on other subproblems (V) - These are
functions which capture the impact of decisions made in one subproblem
on another.
Our view of information, then, can be viewed as one class of exogenously supplied information
(data knowledge), and three classes of forecasts. In this setting, we view “plans”, represented
by xp, as a forecast (at some level of aggregation) of a future decision.
Of our four classes of information, the only one we have not discussed previously are the
value functions which capture the impact of decisions on other components of the system.
Let:
Vq′(Rq′) = The value of resource vector Rq′ to subproblem q′.
V →Mq
= Vq′(Rq′)q′∈ →Mq
= The family of value functions impacted by decisions made in subproblem
q.
The fourth class of information, V →Mq
, is widely used in dynamic programming (in the form
of a value function) and stochastic programming (via recourse functions or approximations
of the recourse function such as Bender’s cuts). If Ωq is a forecast of future (primal) events,
and xp is a forecast of future decisions, then V →Mq
can be thought of as a forecast of dual
variables. In dynamic programming, a value function can be computed using classical back-
ward techniques (e.g. Puterman (1994)) or using adaptive methods based on Monte Carlo
sampling within forward dynamic programming (Bertsekas & Tsitsiklis (1996), Sutton &
Barto (1998)). In stochastic programming, it has been popular to “approximate” the future
using Bender’s cuts (Van Slyke & Wets (1969), Birge (1985), Higle & Sen (1991), Chen &
50
Powell (1999)) which also has the effect of approximating (in a formal way) the impact of
a decision now on the future. Other authors have developed specialized approximations for
resource allocation problems. Powell & Carvalho (1998) and Powell & Shapiro (1996) use
linear approximations, while Cheung & Powell (1996) and Godfrey & Powell (to appear)
suggest separable nonlinear approximations.
Value functions can be expressed exogenously. For example, a decision by component q
to purchase xqq′ items from unit q′ at a price pq′ would produce a value function pq′xqq′ . In
many settings, however, the value function Vqq′ has to be estimated endogenously, and this
estimate depends on forecasts of future exogenous events. For this reason, it is sometimes
convenient to write Vqq′(Ω) to express the dependence of the value function estimate on
exogenous forecasts.
We have, then, four classes of information that may be used in a decision function. We
let I represent all the different classes of information sets, and define four subclasses:
IM = Kt
= The class of myopic policies.
IRH = Kt, (ΩT pht
)
= The class of rolling horizon policies (if |Ω| = 1, then these are classical
deterministic rolling horizon policies).
IPP = Kt, xp
T pht
)
= The class of “proximal” policies, since these policies produce algorithms
that fall in the class of proximal point algorithms (Rockafellar (1976)).
IDP = Kt,V →Mq
(Ω)
= The class of dynamic programming policies, which depend on the current
state of the system and the impact of decisions on other parts of the
system, expressed through value functions.
Virtually any reasonable decision function has to include the knowledge base, Kt. Beyond
this, it is possible to define a variety of policies that use some mixture of the other three
information classes. For example, it is not hard to find examples of real-world decision rules
that use only Kt to make decisions. In general, better decisions require better information.

51
Incorporating forecasts of future events is often a first step for many companies. Capturing
both forecasts of future exogenous events, as well as plans, is a next step. Finally, including
the impact of decisions of one component on another is the last step, since it can be the
most difficult.
Having defined the information set that is available to us, we have to specify how the
information is updated so that we can model the information set It for t ∈ T ph (that
is, within our planning horizon). Already, we have defined the update function UK that
specifies how the database Kt is updated with new information. Also, we have specified the
updating of the forecasting parameters using the funciton U f (we assume no change in the
basic functional form). As a general rule, we do not model the updating of the plan xp as
part of the forecasting process (this is typically fixed at a given point in time). This leaves
only the updating of the value functions.
There are two ways of estimating Vt: statically and dynamically. A static approximation is
created once (for a given time horizon). This might be done via classical backward dynamic
programming, or, in the context of multistage linear programming, by using a complete set
of scenarios to create Bender’s cuts (as in Van Slyke & Wets (1969) and Birge (1985)). Under
such a scheme, the functions Vt would only be updated when new information is available
from history (that is, it is not updated iteratively using purely forecasted information). In
such a scheme, the updating of V is similar to the updating of the forecast parameters ρ.
With respect to a specific history ht, t < 0, then, the value functions would be static.
The second method is where the functions are updating dynamically within the algorithm.
Such techniques arise in the context of forward dynamic programming (Bertsekas & Tsitsiklis
(1996),Sutton & Barto (1998)) and nested Bender’s decomposition (Higle & Sen (1991),Birge
(1985),Infanger & Morton (1996),Pereira & Pinto (1991)). Using these methods, we assume
that each solution of the decision function Xπt (Kt, ωt, Vt+1) produces a vector vt(ω) that can
be used to update Vt using:
Vt ← UV (Vt, vt)
The vector vt might be a vector of estimates of the value of a particular state, or it might
be a vector of duals used in the generation of Bender’s cuts.

52
With the addition of the function UV , we now have our full family of information updating
functions:
U = (UK , U f , UV )
We now have the basis for updating our information set if new exogenous or endogenous
information arrives to our system. This can be expressed using the general mapping:
U : I × K 7→ I
6.4. The decision function. The next step is to define how we make decisions within a
subproblem. For this purpose, we define:
xq = Vector of decisions for subproblem q,
= xdq|d ∈ Dq
Xπq (Iq) = The function that determines the set of decisions xq, where:
The information field Iq defines the information that the decision function Xπq has access to
(we can think of it as the “IQ” of the decision function). The set Iq is a specific dataset, and is
therefore a random variable. For this reason, we may write Iq(ω) to express this dependence
on the sequence of outcomes. This notation elegantly communicates the relationship that
the information set is a random function of the input datastream, and the decision function
depends on the information set (and is therefore also random).
The superscript π is derived from the term “policy” in dynamic programming. When opti-
mizing our system, our challenge is often one of finding the best function Xπq for subproblem
q. So, we can think of π as expressing both the structure of the function (the specification)
and any parameters in the specification. Let:
Π = The set of all possible decision functions that may be specified.
The reader will probably find it useful to separate classes of policies versus instances of a
policy within a class (which would require setting all the parameters within the policy).
We can divide the class Π into four major subclasses:
ΠM = The class of myopic policies, where It = Kt.
53
ΠRH = The class of rolling horizon policies, where It = (Kt, ΩT ph). Note that if
|ΩT ph | = 1, then we get a classical deterministic, rolling horizon policy
which is so widely used in dynamic settings.
ΠPP = The class of proximal point policies, where It = (Kt, xpt ), which include
plans of future decisions (these policies often include forecasts of exoge-
nous events).
ΠDP = The class of dynamic programming policies, where It = (Kt, ΩT ph ,V →Mt
),
where we use a functional approximation to capture the impact of deci-
sions at one point in time (or one subproblem) on the rest of the system.
The specification of the information content of a decision appears to be new in the modeling
literature. Deterministic models assume that each decision contains all the information
available in the system; stochastic models typically assume that a decision has access to all
static parameters, and the history of any stochastic processes up to time t when a decision
is made. In complex systems such as freight transportation, it is common for one decision
maker to simply not have access to information that are available to others simply because
of the way the computer system is designed, or as a result of his own work process.
We can provide some structure to the information field Iq. In a multiagent system, we
can define three classes of information that might be included in Iq:
Iq = Kq, (Ωq,X pq ),V →
Mq
where:
Kq = The information elements that are used in subproblem q, derived directly
from the sequence κt and stored in the database using the update function
UK .
Ωq = Information events that we have forecasted for time periods Tq based on
parameters estimated from historical events.
X pq = The “plan” for subproblem q, representing a projected set of future deci-
sions. In general, there may be a separate plan for each scenario ωq ∈ Ωq,
but in practice there will typically be a single plan that we may denote
xpq .

54
V →Mq
= A forecast of the economic impact of decisions made in subproblem q on
subproblems in the forward reachable set for q.
It is not necessary to use all four classes of information. Myopic models use Iq = Kq. Rolling
horizon models which use a forecast of future events use Iq = Kq, Ωq (where, once again,
|Ωq| = 1 means we are using a deterministic approximation of the future, while |Ωq| > 1
means we have a stochastic model). Dynamic programming algorithms and some stochastic
programming algorithms use a value function of some sort.
6.5. Measurement and evaluation. Our last task is to compare one solution to another.
That is, given two decision functions Xπ1 and Xπ2 , how do we know which is better? In this
section, we discuss how to measure the performance of a function, focusing on the choice of
sample space. This presentation is undertaken from two perspectives. Section 6.5.1 considers
the classical problem of optimizing a well-defined objective function. Section 6.5.2 focuses
instead on optimizing performance in actual operations (the ultimate acid test).
A goal of this section is to bring out the different types of “optimality” that arise in stochas-
tic, dynamic problems. This issue is rarely addressed in the context of static, deterministic
problems where the objective function is well defined.
6.5.1. Calculating costs. Most optimization problems in a stochastic, dynamic setting would
like to find a function Xπ that minimizes (or maximizes, if c is a contribution) the following
function:
F (π|T∞, Ω) = E
∑t∈T∞
αtct(Xπ(It), Kt)
(7)
where 0 ≤ α < 1 is a discount factor and the expectation operator E is defined with
respect to the probability space (Ω, E ,P)∞ defined over an infinite horizon T∞. We include
a discount factor which, combined with some standard assumptions on the boundedness of
the problem, ensures that (7) remains finite. Note that Kt and It are both Ft−measurable
random variables.
For most modelers, this objective function is a kind of unachievable “ultimate” since, for
hard problems, it is virtually impossible to prove infinite horizon optimality, and it is equally
impossible to even compare two functions in this setting to see which is better.
55
Practical, experimental research must, as a rule, focus on calculating:
F (π|T sh, Ωsh) =∑
ω∈Ωsh
p(ω)
∑t∈T sh
αtct(Xπ(It(ω)), Kt(ω))
(8)
If we have a multi-agent control structure, the problem is quite similar. We basically
replace the time index t with the subproblem index q as follows:
F (π|T sh, Ωsh,Q) =∑
ω∈Ωsh
p(ω)∑q∈Q
cq(X
πq (Iq), Kq)
6.5.2. Measuring actual performance. The desire to optimize a well-defined, computable
function in a controlled setting sometimes disguises the real problem, which is to change
decisions as they are made in a real problem. Our efforts to optimize some function Fn must
recognize that in most real applications, no-one actually cares what value we obtain for Fn.
This function, ultimately, must be a surrogate for a more realistic problem.
Let xat , t ∈ T sh represent a set of actual decisions made over a particular time period T sh.
During this period of time, a single set of events ωa ∈ Ωa occurred. Given these events and
decisions, we suggest that there are three major classes of objective functions that may be
computed:
F (xa|T sh, ωa) = Surrogate cost function used by the optimization system. Here,we are using actual decisions, but evaluating them using our costfunction.
G(xa|T sh, ωa) = Management goal satisfaction - this function measures the de-gree to which actual decisions produced results that match spe-cific management goals. These goals are specific, quantifiablemeasurements that are used to evaluate system performance.
H(Xπ, xa|T sh, ωa) = The user happiness function: this function provides a measureof how well actual decisions xa match optimized decisions Xπ.
If we have developed a good optimization algorithm, we would expect to do well in terms
of F (xa). However, if we do poorly in terms of the user happiness function H(Xπ, xa), then
we may not do well in terms of F (xa). Management, of course, wants to focus on their own
measurements (which we call G), and tends to be frustrated when modelers focus on F or
users focus on H. The reality is that we have to work on all three. Our model only sees
the function F , so this is the means by which we influence the behavior of the computer.
We need to design algorithms that optimize F (if our algorithms do not optimize F , then
changing F will have an unpredictable effect on system performance). We then need to work

56
to adjust F , as well as train the users, to achieve the highest possible H, since a low value
for H, by definition, means that the users are ignoring the model.
We can, of course, do well in terms of both F (xa) and H(Xπ, xa) but poorly in terms of
G(xa). If this happens, we have a case of a disconnect between user behavior and manage-
ment goals. If we have indeed achieved a high level of user happiness (which means building
trust and confidence in our model), then we have an opportunity to change actual decisions
by slowly modifying the model.
7. The optimization formulation
In practice, we typically find ourselves wanting to solve the finite horizon problem:
maxπ∈Π
E
∑t∈T sh
αtct(Xπ(It), Kt)
(9)
Since we cannot generally calculate the expectation, we will choose a particular sample path
ω ∈ Ω and assume that if we choose a policy that works well over a sufficiently long horizon,
then we probably have a good policy. As a result, the most practical optimization problem
looks like:
maxπ∈Π
∑t∈T sh
αtct(Xπ(It(ω)), Kt(ω))
(10)
The decision function Xπ(It(ω)) must be designed to satisfy the following constraints:
Conservation of flow: ∑d∈D
xadt = Ratt + Rtt′ ∀a ∈ A, d ∈ D(11)
Rate of process transformation
xadt ≤ uadt(12)
Nonnegativity (and possibly integrality)
xadt ≥ 0 and possibly integer ∀a ∈ A, d ∈ D(13)
In addition to these constraints, the problem must also satisfy the following equations gov-
erning system dynamics:

57
Resource dynamics:
Ra,t+1.t′(ω) = Ratt′(ω) + Ratt′ +∑d∈D
∑a′∈A
δatt′(a′, dtt′ , ω)xa′dt a ∈ A, t′ ≥ t(14)
Information updating:
Kt+1 = UK(Kt, κt+1)(15)
If forecasts are being updated based on simulated information (a process called “bootstrap-
ping” which is not generally used in conventional modeling practice), we would include:
ρt+1 = U f (ρt, κt+1)(16)
If we are using a value function, which is being updated dynamically based on sample
information, we would include:
Vt ← UV (Vt, vt(ω))(17)
The careful reader should have noted a lack of symmetry in our handling of the dynamics of
information about resources and other forms of knowledge. Our resource vector Rt is defined
to include arrivals prior to time t; arrivals in time t are added explicitly to the right hand
side of equation (11). By contrast, our knowledge base Kt is defined to include updates to
knowledge contained in κt. For some algorithms, this choice is not necessary; we could easily
have revised our definition of Rt to include Rt, allowing us to write the right hand side of
(11) as simply Rt. But, a relatively new class of adaptive dynamic programming algorithms
described in Powell et al. (2000) requires that Rt be an incomplete resource vector. We have
chosen to write Kt as a complete knowledge state because it is notationally simpler.
8. Data representation
Using our mathematical model, we now have the elements needed to specify an instance
of a DRTP in data. Below we list three types of information that comprise a DRTP : model
related parameters and sets; raw data; and functions. We propose that this list, which we
claim is comprehensive, can serve as a basis for a richer data specification that would allow
modelers to share instances of relatively complex problems.

58
Model specification:
Q = The set of informational subproblems.
Aq = The set of elements of A in each subproblem.
Cq = The set of control classes for subproblem q.
Tq = The set of time elements for subproblem q.
T ih, T pht , T sh
t = Implementation, planning and simulation horizons.
Problem data:
CK = The set of data classes
CR = The set of resource classes
CD = The set of decision classes
Rc,0 = The set of resources in class c at time period 0, c ∈ CR.
L = The set of resource layers (sets of resources that may becoupled together)
ar = Attribute vector of the rth resource in the first time period,r ∈ Rc,0, ar ∈ Ac.
K0 = Initial data set of resources and parameters.
Ωph = Forecasted exogenous information (required if forecasting is in-volved).
ρ0,t = Initial set of forecast parameters for points in time t ∈ T ph
(generally required if forecasting is involved).
uA,T (d, ω) = Upper bounds on the rate of process transformation. We presentthis here as data, but it can also be a function (if applicable).
xpT ph(Ω
p) = A plan (or set of plans (if |Ωp| > 1), which have been com-municated to components that are exogenous to our system.Although rarely included in models, a “plan” can represent animportant piece of data because of the cost of changing a plan(if applicable).

59
Functions:
Da = This is is the set of decisions that can be applied to a resourcewith attribute a
.
M(a, dt, Kt) = The modify function that determines how a resource is changedas a result of endogenous and exogenous factors. Implicit tothe modify function are its component cost and transfer timefunctions.
Xπq (Iq) = A function giving a decision (or set of decisions) xdq, d ∈ Dq to
be made at time t given an information set Iq for subproblemq.
Gn = The attribute aggregation function for aggregation level n (ifapplicable).
Vt,t′(Rt,t′) = The (approximate) value of having Rt,t′ resources at time t′ in aproblem being solved at time t (of course, this function may bezero) (if applicable).
UK(Kt, κt) = The updating function for the database (required for any sto-chastic model).
U f (ρt, κt) = The updating function for forecast parameters, given new infor-mation κt (if applicable - forecasts are generally fixed for a givenmodel)
UV (Vt, vt) = The updating function for value function approximations (if ap-plicable)
The modify function captures all of the physics of our problem. The decision function
captures the intelligence. For many problems, the only dynamic data (within the model) is
the set of resources, which is captured by the initial set R0 and the updates in Ωph.
9. Summary
This paper offers a new way of thinking about dynamic resource management problems,
a problem class which we have named dynamic resource transformation problems. We have
tried to offer as much generality as possible, subject to the constraint that the properties
of the problem be sufficiently well defined that the problem can be easily represented as a
well defined set of data and software. An important contribution of our representation is
that it exposes many of the prominent dimensions of dynamic problems that are often lost
or ignored in specific problems.
A software library built around this representation has been developed in Java. Elements
of the architecture of this system are described in Shapiro & Powell (1998).

60
We have intentionally left out any algorithmic details, since these are viewed as being
problem specific. This decision, of course, raises the common question in operations research,
Why model a problem that cannot be solved? A central claim of our representation is
that any problem can be decomposed into suitably small subproblems and then solved.
In Shapiro & Powell (1999) we propose an algorithmic metastrategy that describes how
DRTP ’s can be decomposed and solved using a class of approximation strategies drawn
from dynamic programming. The mathematical foundation of this metastrategy is based
on dynamic programming techniques developed especially for solving resource management
problems. Readers are referred to Powell et al. (2000) for a description of these techniques.
Acknowledgement
This research was supported in part by grant AFOSR-F49620-93-1-0098 from the Air Force
Office of Scientific Research. We would also like to acknowledge the helpful suggestions
of Teodor Crainic, as well as the students and staff of CASTLE Laboratory who struggled
repeatedly through earlier drafts of this document. I would also like to thank Erhan Cinlar
for several valuable conversations that helped improve the notational style as well as the
handling of the probabilistic aspects of information theory. In addition, the paper benefited
from the careful comments of a very conscientious referee.
References
Adelman, D. & Nemhauser, G. (1999), ‘Price-directed control of remnant inventory systems’,Operations Research 47(6), 889–898. 3
Andreatta, G. & Romanin-Jacur, G. (1987), ‘The flow management problem’, TransportationScience 21(4), 249–253. 2
Aronson, J. & Chen, B. (1989), A computational study of empirical decision horizons ininfinite horizon multiperiod network flow models, Working paper 89-275, Dept. of Mgmt.Sci. and Information Tech., University of Georgia. 35
Bertsekas, D. & Tsitsiklis, J. (1996), Neuro-Dynamic Programming, Athena Scientific, Bel-mont, MA. 42, 49, 51
Bes, C. & Sethi, S. (1988), ‘Concepts of forecast and decision horizons: Applications to dy-namic stochastic optimization problems’, Mathematics of Operations Research 13(2), 295–310. 35
Bhaskaran, S. & Sethi, S. (1987), ‘Decision and forecast horizons in a stochastic environment: A survey’, Optimal Control Applications and Methods 8(1), 61–67. 35

61
Birge, J. (1985), ‘Decomposition and partitioning techniques for multistage stochastic linearprograms’, Operations Research 33(5), 989–1007. 49, 51
Bodin, L. & Golden, B. (1981), ‘Classification in vehicle routing and scheduling’, Networks11, 97–108. 4
Chen, Z.-L. & Powell, W. B. (1999), ‘A convergent cutting-plane and partial-sampling al-gorithm for multistage stochastic linear programs with recourse’, Journal of OptimizationTheory and Applications 102(3), 497–524. 49
Cheung, R. & Powell, W. B. (1996), ‘An algorithm for multistage dynamic networks withrandom arc capacities, with an application to dynamic fleet management’, OperationsResearch 44(6), 951–963. 50
Crainic, T. & Roy, J. (1992), ‘Design of regular intercity driver routes for the LTL motorcarrier industry’, Transportation Science 26, 280–295. 2
Crainic, T., Gendreau, M. & Dejax, P. (1993), ‘Dynamic stochastic models for the allocationof empty containers’, Operations Research 41, 102–126. 2
Eiselt, H., Laporte, G. & Thisse, J.-F. (1993), ‘Competitive location models: A frameworkand bibliography’, Transportation Science 27, 44–54. 4
Fourer, R., Gay, D. & Kernighan, B. (1990), ‘A mathematical programming language’,Management Science 36, 519–554. 4
Geoffrion, A. (1989a), ‘The formal aspects of structured modeling’, Operations Research37(1), 30–51. 5
Geoffrion, A. (1989b), ‘An introduction to structured modeling’, Management Science33, 547–588. 4, 5
Geoffrion, A. (1992a), ‘The SML language for structured modeling: Levels 1 and 2’, Opera-tions Research 40(1), 38–57. 5
Geoffrion, A. (1992b), ‘The SML language for structured modeling: Levels 3 and 4’, Opera-tions Research 40(1), 58–75. 5
Godfrey, G. & Powell, W. B. (to appear), ‘An adaptive, dynamic programming algorithmfor stochastic resource allocation problems I: Single period travel times’, TransportationScience. 50
Gross, D. & Harris, C. (1985), Fundamentals of Queueing Theory, John Wiley and Sons,New York. 4
Haghani, A. (1989), ‘Formulation and solution of a combined train routing and makeup, andempty car distribution model’, Transportation Research 23B(6), 433–452. 2
Hane, C., Barnhart, C., Johnson, E., Marsten, R., Nemhauser, G. & Sigismondi, G.(1995), ‘The fleet assignment problem: Solving a large-scale integer program’, Math. Prog.70, 211–232. 2
Herren, H. (1973), ‘The distribution of empty wagons by means of computer: An analyticalmodel for the Swiss Federal Railways (SSB)’, Rail International 4(1), 1005–1010. 2
Higle, J. & Sen, S. (1991), ‘Stochastic decomposition: An algorithm for two stage linearprograms with recourse’, Mathematics of Operations Research 16(3), 650–669. 42, 49, 51
Infanger, G. & Morton, D. (1996), ‘Cut sharing for multistage stochastic linear programswith interstate dependency’, Mathematical Programming 75, 241–256. 42, 51
Jordan, W. & Turnquist, M. (1983), ‘A stochastic dynamic network model for railroad cardistribution’, Transportation Science 17, 123–145. 2
Mendiratta, V. & Turnquist, M. (1982), ‘A model for the management of empty freight cars’,Trans. Res. Rec. 838, 50–55. 2
Morton, D. (1996), ‘An enhanced decomposition algorithm for multistage stochastic hydro-electric scheduling’, Annals of Operations Research 64, 211–235. 42
Odoni, A. (1986), The flow management problem in air traffic control, in L. B. A.R. Odoni &G. Szego, eds, ‘Flow Control of Congested Networks’, Springer-Verlag, New York, pp. 269–288. 2
Pereira, M. & Pinto, L. (1991), ‘Multistage stochastic optimization applied to energy plan-ning’, Mathematical Programming 52, 359–375. 42, 51
62
Pinedo, M. (1995), Scheduling: Theory, Algorithms, and Systems, Prentice Hall, EnglewoodCliffs, NJ. 4
Powell, W. B. (1986), ‘A local improvement heuristic for the design of less-than-truckloadmotor carrier networks’, Transportation Science 20(4), 246–257. 2
Powell, W. B. (1991), ‘Optimization models and algorithms: An emerging technology forthe motor carrier industry’, IEEE Transactions on Vehicular Technology 40, 68–80. 2
Powell, W. B. (1996), ‘A stochastic formulation of the dynamic assignment problem, withan application to truckload motor carriers’, Transportation Science 30(3), 195–219. 2
Powell, W. B. & Carvalho, T. A. (1998), ‘Dynamic control of logistics queueing network forlarge-scale fleet management’, Transportation Science 32(2), 90–109. 50
Powell, W. B. & Shapiro, J. A. (1996), A dynamic programming approximation for ultralarge-scale dynamic resource allocation problems, Technical Report SOR-96-06, Depart-ment of Operations Research and Financial Engineering, Princeton University. 31, 50
Powell, W. B., Godfrey, G., Papadaki, K., Spivey, M. & Topaloglu, H. (2000), Adaptive dy-namic programming for multistage stochastic resource allocation, Technical Report CL-01-03, Department of Operations Research and Financial Engineering, Princeton University.44, 57, 60
Puterman, M. L. (1994), Markov Decision Processes, John Wiley and Sons, Inc., New York.49
Rockafellar, R. T. (1976), ‘Augmented Lagrangians and applications of the proximal pointalgorithm in convex programming’, Math. of Operations Research 1, 97–116. 50
Schrijver, P. (1993), Supporting Fleet Management by Mobile Communications, P.R. Schri-jver, The Netherlands. 2
Sethi, S. & Bhaskaran, S. (1985), ‘Conditions for the existence of decision horizons fordiscounted problems in a stochastic environment’, Operations Research Letters 4(2), 61–64. 35
Shapiro, J. A. & Powell, W. B. (1998), An object-oriented framework for dynamic resourcetransformation problems, Technical Report SOR-98-07, Department of Operations Re-search and Financial Engineering, Princeton University. 59
Shapiro, J. A. & Powell, W. B. (1999), A metastrategy for large-scale resource manage-ment based on informational decomposition, Technical Report CL-99-03, Department ofOperations Research and Financial Engineering, Princeton University. 60
Sutton, R. & Barto, A. (1998), Reinforcement Learning, The MIT Press, Cambridge, Mas-sachusetts. 42, 49, 51
Van Slyke, R. & Wets, R. (1969), ‘L-shaped linear programs with applications to optimalcontrol and stochastic programming’, SIAM Journal of Applied Mathematics 17(4), 638–663. 49, 51
White, D. (1996), ‘Decision roll and horizon roll processes in infinite horizon discountedMarkov decision processes’, Management Science 42(1), 37–50. 35