a research on formulation and evaluation of …
TRANSCRIPT
www.wjpr.net Vol 7, Issue 19, 2018. 1165
Manisha et al. World Journal of Pharmaceutical Research
A RESEARCH ON FORMULATION AND EVALUATION OF
FLOATING MICROSPHERES OF TOLPERISONE HYDROCHLORIDE
Manisha Kumari*1, Prasanjit Paul
2 and Dr. Nitin Kumar
1
1Assistant Professor, Dept. of Pharmaceutics, Oxford College of Pharmacy, Ghaziabad, Uttar
Pradesh, India.
2Associate Professor, Dept. of Pharmaceutics, Swami Vivekananda Subharti University,
Meerut, Uttar Pradesh, India.
1Professor, Dept. of Pharmaceutical Chemistry, K.R. Mangalam University, Gurugram, Uttar
Pradesh, India.
ABSTRACT
Tolperisone HCl, a centrally acting muscle relaxant. Tolperisone HCl
with its shorter half life, of 1.5- 2.5 hours, high first pass metabolism
with frequent dosing characteristics makes it suitable candidate for
development of oral controlled release dosage form. Nine formulations
of drug loaded microspheres using three different polymeric
combinations and ratio were prepared by emulsion solvent evaporation
technique. The various polymer used in the formulations were Ethyl
cellulose, Eudragit RS100 & Eudragit S100 (all hydrophobic). Average
particle size ranged from 56.68 µm to 87.50 µm. Percentage yield
ranged from 77.28 to 90.22% and drug entrapment efficiency ranges
from 69.12 to 82.64%. Percentage drug loading was found to be
satisfactory. Kinetics study showed that drug release follows first order kinetics. Batch F4
shows best dissolution profile because of highest similarity factor f2 (f2=75.62) among all the
batches (which ranged from 51.74 to 75.62). FTIR study confirmed the stable character of
Tolperisone HCl in formulations. Scanning electron microscopy revealed that the
microspheres were spherical. Nine different formulations (F1 to F9) of Tolperisone HCl
loaded microspheres were prepared using various polymeric combinations with a view for the
sustained delivery of the drug over a time period of 12 hours.
World Journal of Pharmaceutical Research SJIF Impact Factor 8.074
Volume 7, Issue 19, 1165-1198. Research Article ISSN 2277– 7105
Article Received on
14 Oct. 2018,
Revised on 04 Nov. 2018,
Accepted on 25 Nov. 2018
DOI: 10.20959/wjpr201819-13802
*Corresponding Author
Manisha Kumari
Assistant Professor, Dept. of
Pharmaceutics, Oxford
College of Pharmacy,
Ghaziabad, Uttar Pradesh,
India.

www.wjpr.net Vol 7, Issue 19, 2018. 1166
Manisha et al. World Journal of Pharmaceutical Research
KEYWORDS: Floating microspheres, Gastro retentive drug delivery system, Emulsion
solvent evaporation technique, Muscle relaxant.
INTRODUCTION
For the delivery of therapeutic agents oral route has being used because of the low cost of
therapy and ease of administration which lead to high level of patient compliance.[1]
Controlled release drug delivery system (CRDDS) provide drug release at predetermined,
predictable and controlled rate. Many benefits can be achieved by controlled release drug
delivery system like maintenance of optimum therapeutic drug concentration in blood with
predictable and reproducible release rates for extended time period; enhancement of activity
of duration for shorter half life drugs; elimination of side effects; reducing frequency of
dosing and wastage of drugs; optimized therapy and better patient compliances.[2,3]
Three aspects are required for the successful development of oral controlled drug delivery
system, namely,
1. The physiochemical characteristic of the drug.
2. Anatomy and physiology of GIT and
3. Characteristics dosage forms.[4]
However, shorter residence of time of the dosage forms and incomplete release of drugs in
the upper gastro intestinal tract, a prominent site for the absorption of many drugs will leads
to lower bioavailability. Efforts to improve oral bioavailability have grown parallel with the
pharmaceutical industry. As the number and chemical diversity of drugs has increased, new
strategies are required to develop the orally active therapeutics. Thus gastro retentive dosage
forms which prolong the residence time of the drug in the stomach and improve their
bioavailability, have been developed. One of the most feasible approaches for achieving a
prolonged and predictable drug delivery profile in the GIT tract is to control the gastric
residence time i.e. Gastro retentive dosage forms [GRDSs].[5]
Gastro retentive floating drug delivery system[GRFDDS] have a bulk density lower than
that of gastric fluids thus remains buoyant in the stomach without effecting gastric emptying
rate for a prolonged period of time.[6]
Microspheres are characteristically free flowing powders consisting of proteins or synthetic
polymers having a particle size ranging from 1-1000 μm.[7]

www.wjpr.net Vol 7, Issue 19, 2018. 1167
Manisha et al. World Journal of Pharmaceutical Research
Floating microspheres are gastro retentive drug delivery system based upon non-
effervescent approach. The floating microspheres have been utilized to obtain prolonged and
uniform release in the stomach for development of a once daily formulation. When
microspheres come in contact with gastric fluid the gel formers polysaccharides, and
polymers hydrate to form a colloidal gel barrier that controls the rate of fluid penetration into
the device and consequent drug release.[8]
Tolperisone, a centrally acting muscle relaxant agent. It has been used for the treatment of
Myasthenia, Pregnancy and Breastfeeding. It has also been used in treatment of conditions
which includes dymenorrhoea, climacteric complaints, lock jaw and neurolatyrism. The
usually recommended dose of Tolperisone HCl in adults is 50mg tablet given three times a
day (i.e. a daily dose of 150mg) that can be increased to a maximum daily dose of 600mg. if
required in children. The drug is administered in a daily dose of 5-10 mg/kg/day, given in
three divided doses. The dose of the drug should be reduced in the elderly and in patients
with hepatic or renal insufficiency. The dosage of the drug should be maintained until the
therapeutic effect is reached. Afterwards, the dosage of the drug should be reduced
gradually.[9-13]
In the present investigation floating sustained release microspheres of Tolperisone HCl were
prepared by emulsion solvent evaporation technique using three different polymers Eudragit
RS100, Eudragit S100 and Ethyl cellulose. The aim of the work was to evaluate microspheres
for size, in-vitro release, buoyancy and incorpraton efficiency. The effect of various
formulation variables on the size and drug release was also investigated.
MATERIALS
Tolperisone HCl was obtained as a gift sample from Alkem Labs Ltd, Mumbai(India).
Eudragit RS 100 and Eudragit S100 were obtained from Alkem Labs Ltd, Mumbai, Ethyl
Cellulose, Dicloromethane and Tween 80 were obtained from Central Drug House Ltd,
Mumbai. All other chemical/reagents used were of analytical grade, available commercially
and used as such without further processing. FT-IR ALPHA-E (Bruker USA), Double beam
UV-Visible spectrophotometer (UV-2700, Thermoscientific USA) and USP Eight Stage
Dissolution Test Apparatus (DS 8000) were the instruments employed in the current study.

www.wjpr.net Vol 7, Issue 19, 2018. 1168
Manisha et al. World Journal of Pharmaceutical Research
METHOD
Following studies were performed to formulate and evaluate Tolperisone HCl floating
microspheres.
Preformulatuion Studies
The first step in the rational development of dosage forms of a drug is the preformulation
testing. It can be defined as an investigation of Physical and chemical properties of drug
substance, alone and when combined with excipients. The overall objective of preformulation
testing is to generate information useful to the formulation developing stable and bioavailable
dosage forms, which can be produced at large scale.[14]
Identification of Pure Drug[15]
The selected drug Tolperisone HCl was subjected for investigation of physical
characterization parameters such as colour, state, odour, IR spectroscopy, solubility analysis,
melting point Determination.
Compatibility Studies of Drug and Polymers
It is essential to confirm that drug is not interacting with the polymer under certain
experimental studies before formulating a dosage form. Interacting among drug and polymer
may affect the efficacy of final dosage form.
FTIR spectrum of pure drug, polymers and physical mixture of drug with polymers as per
different formulation combinations were taken over. The wave number range of 4000-400
cm-1
. Also spectrums of drug in different types of formulations were also taken. FTIR helps
to confirm the identity of the drug and to detect the interaction of the drug with the carriers.
SCANNING OF TOLPERISONE HYDROCHLORIDE IN S.G.F. (STANDARD
CALIBRATION CURVE)
Preparation of 10 µg/ml Solution
A stock solution of Tolperisone Hydrochloride containing 100mg in 100ml was prepared
using simulated gastric fluid (SGF) without enzymes of pH 1.2. From this solution one ml
was diluted upto 100 ml in a volumetric flask with simulated gastric fluid (SGF).
Scanning
This resulting 10 µg/ml solution was scanned in UV/Visible double beam spectrophotometer
(Thermo scientific, India) in the range 200-400 nm. Tolperisone Hydrochloride shows

www.wjpr.net Vol 7, Issue 19, 2018. 1169
Manisha et al. World Journal of Pharmaceutical Research
maximum ultraviolet absorbance at 260 nm. Based on this information, a standard graph was
constructed using simulated gastric fluid (pH 1.2) without enzymes as detailed below to
estimate its amount either in dissolution fluids or matrix tablets.
Preparation of Stock Solution: A stock solution of Tolperisone Hydrochloride containing
100mg in 100ml was prepared using simulated gastric fluid (SGF) without enzymes of pH
1.2.
Standard Dilutions: From the stock solution different concentrations of Tolperisone
Hydrochloride viz, 2, 4, 6, 8, 10, 12, 14 16, 18, and 20 µg/ml were prepared by diluting with
SGF without enzymes of pH 1.2 and their absorbance were measured at 260 nm using
UV/Visible double beam spectrophotometer (Thermoscientific, India). The absorbance of the
above solutions was tabulated in the following table (Table.). A graph was plotted by taking
concentration of Tolperisone Hydrochloride (µg/ml) on X-axis and absorbance on the Y- axis
(Fig.5).
Preparation of Microspheres of Tolperisone Hcl
Various batches of floating microspheres of Tolperisone HCl were prepared by the emulsion
solvent evaporation method. Calculated quantities of polymers were dissolved into a mixture
of dichloromethane and ethanol (7:3) in which the calculated quantity of drug is previously
dissolved. This viscous solution was then added drop wise to a 50 ml beaker containing liquid
paraffin having 0.4% Tween 80 as emulsifying agent. The resulting mixture was agitated at
400C for 3-4 hrs at 200-300 rpm. After the complete removal of the solvent, the prepared
microspheres were filtered, washed repeatedly with n-hexane and dried in hot air oven at
500C.
Table No.1: Composition of Formulation.
Formulations Tolperisone
HCl (mg)
Eudragit
RS100 (mg)
Ethyl Cellulose
(mg)
Eudragit
S100 (mg)
F 1 500 500 - -
F 2 500 1000 - -
F 3 500 1500 - -
F 4 500 750 750 -
F 5 500 1000 500 -
F 6 500 500 1000 -
F 7 500 750 - 750
F 8 500 1000 - 500
F 9 500 500 - 1000

www.wjpr.net Vol 7, Issue 19, 2018. 1170
Manisha et al. World Journal of Pharmaceutical Research
EVALUATION OF THE FORMULATED FLOATING MICROSPHERES
1. Micromeritic Studies
The prepared microspheres are characterized by their micromeritic properties[16,17]
such as
microsphere size, tapped density, Carr’s compressibility index, Hausner’s ratio and angle of
repose.
Bulk Density
The bulk density is defined as the mass of powder divided by bulk volume. The bulk density
was calculated by dividing the weight of the samples in grams by the final volume in cm3.
Bulk density = Mass of microspheres/Volume of microspheres before tapping
Tapped Density
Tapped density is the volume of powder determined by tapping by using a measuring
cylinder containing weighed amount of sample. The cylinder containing known amount of
microspheres was tapped for about 1 minute on a tapped density apparatus until it gives
constant volume.
Tapped density = Mass of microspheres/ Volume of microspheres after tapping
Carr’s Compressibility Index
This is an important property in maintaining uniform weight. It is calculated using following
equation,
% Compressibility Index = [(Tapped density-Bulk Density)/ (Tapped Density)] X 100
Lower the compressibility values indicate better flow.
Hausners ratio
A similar index like percentage compressibility index has been defined by Hausner. Values
less than 1.25 indicate good flow, where as greater than 1.25 indicates poor flow. Added
glidant normally improve flow of the material under study. Hausner’s ratio can be calculated
by formula,
Hausner’s ratio = (Tapped density/ Bulk density)
Angle of Repose (θ)
Good flow properties are critical for the development of any pharmaceutical tablet, capsules
or powder formulation. Interparticle forces between particles as well as flow characteristics

www.wjpr.net Vol 7, Issue 19, 2018. 1171
Manisha et al. World Journal of Pharmaceutical Research
of powders are evaluated by angle of repose. Angle of repose is defined as the maximum
angle possible between the surface and the horizontal plane.
The angle of repose of each powder blend was determined by glass funnel method. Powders
were weighed accurately and passed freely through the funnel so as to form a heap. The
height of funnel was so adjusted that the tip of the funnel just touched the apex of the heap.
The diameter of the powder cone so formed was measured and the angle of repose was
calculated using the following equation,
Tan Ө = h/r
Ө = Tan-1
(h/r)
Where,
θ = Angle of repose
h = Height of the pile
r = Radius of the powder cone
Angle of repose affects particle size distribution, as larger the particle size, it will flow freely
and vice-versa. It is a helpful parameter to monitor quality of powdered or granular
pharmaceutical formulations. For good flowing materials, the angle of repose should be less
than 30°.
2. Particle Size & Surface Morphology[18]
Particle Size Determination
Microsphere size was determined by using an optical microscope under regular polarized
light, and the mean microsphere size was calculated by measuring 100 particles with the help
of a calibrated ocular micrometer.
Morphological Study using SEM
The morphological study was carried out by Scanning Electron Microscope (SEM).
Microspheres were scanned and examined under Electron Microscope HITACHI SU 1500,
Japan. The sample was loaded on copper sample holder and sputter coated with carbon
followed by Gold.
3. Percentage Yield[19]
The prepared microspheres of all batches were accurately weighed. The measured weight of
prepared microspheres was divided by the total amount of all the excipients and drug used in

www.wjpr.net Vol 7, Issue 19, 2018. 1172
Manisha et al. World Journal of Pharmaceutical Research
the preparation of the microspheres, which give the total percentage yield of floating
microspheres. It was calculated by using following equation,
4. Drug Loading and Drug Entrapment[20,19]
Microspheres equivalent to 50 mg of the drug were taken for evaluation. The amount of drug
entrapped was estimated by crushing the microspheres and extracting with aliquots of 0.1M
HCl (pH-1.2) repeatedly. The extract was transferred to a 100ml volumetric flask and the
volume was made up using 0.1M HCl (pH-1.2). The solution was filtered and the absorbance
was measured after suitable dilution spectrophotometrically (UV 2700, Shimadzu, Japan) at
260 nm against appropriate blank. The amount of drug loaded and entrapped in the
microspheres was calculated by the following formulas:
5. Floating behaviour (buoyancy %)
50 mg of the microspheres were placed in 100 ml of stimulating gastric fluid (pH 1.2). The
mixture was stirred at 100 rpm and separated by filtration particles in the sinking particulate
layer were separated by filtration. Particles of both types were dried in desiccators. Both the
fractions of microspheres were weighed and buoyancy percentage was calculated as the ratio
of the mass of the microspheres that remained floating and the total mass of the
microsphere.[21]
Buoyancy (%) = Weight of floating microspheres after time t × 100
Initial weight of microspheres
5. In-vitro Release Study[22,19]
The drug release study was performed for microsphere containing quantity equivalent to
100mg of Tolperisone HCl by using USP type-II dissolution test apparatus (USP TDT 08L)
in 900 ml of dissolution media (pH-1.2) at 50 rpm and 37±0.10C temperature. 5 ml of sample
was withdrawn at predetermined time interval for 1 hour and same volume of fresh medium
was replaced to maintained sink condition. Withdrawn samples were assayed

www.wjpr.net Vol 7, Issue 19, 2018. 1173
Manisha et al. World Journal of Pharmaceutical Research
spectrophotometrically at 260 nm. Drug release was also performed for pure drug. The
cumulative % drug release was calculated using standard calibration curve method.
Details of dissolution testing
Apparatus: USP TDT 08L
Dissolution media: 0.1 M HCl
Speed: 50 rpm
Volume of medium: 900 ml
Temperature: 37±0.1°C
Wavelength: 260 nm.
6. Release Kinetics
The matrix systems were reported to follow the Peppas release rate and the diffusion
mechanism for the release of the drug.[23]
To analyse the mechanism for the release and
release rate kinetics of the dosage form, the data obtained was fitted in to, Zero order, First
order, Higuchi matrix, Peppas and Hixson Crowell model. In this by comparing the R2-values
obtained, the best-fit model was selected.
Zero Order Kinetics
Drug dissolution from Pharmaceutical dosage forms that do not disaggregate and releases the
drug slowly, assuming that the area does not change and no equilibrium conditions are
obtained can be represented by the following equation
Qt = Q0 + K0 t
Where,
Qt = Amount of drug dissolved in time t,
Q0 = Initial amount of drug in the solution and
K0 = Zero order release constant.
First Order Kinetics
To study the first order release rate kinetics the release rate data were fitted to the following
equation.
log Qt = log Q0 + K1 X t / 2.303
Where,
Qt = Amount of drug released in time t,
Q0 = Initial amount of drug in the solution and

www.wjpr.net Vol 7, Issue 19, 2018. 1174
Manisha et al. World Journal of Pharmaceutical Research
K1 = First order release constant.
Higuchi Model
Higuchi developed several theoretical models to study the release of water soluble and low-
soluble drugs incorporated in semisolids and or solid matrices. Mathematical expressions
were obtained for drug particles dispersed in a uniform matrix behaving as the diffusion
media. The Higuchi equation is
Qt = KH x t 1/2
Where,
Qt = Amount of drug released in time t and,
KH or (D) = Higuchi diffusion coefficient.
Korsmeyer-Peppas Release Model
To study this model the release rate data is fitted to the following equation
Mt / M∞ = K.tn
Where,
Mt / M∞ = Fraction of drug release,
K= Release constant,
t = Drug release time and
n = Diffusional exponent for the drug release that is dependent on the shape of the matrix
dosage form.
Hixson-Crowell Model
To study the Hixson–Crowell model the release rate data are fitted to the following equation:
W01/3
– Wt 1/3
= Ks t
Where,
W0= Amount of drug in the pharmaceutical dosage form,
Wt = Remaining amount of drug in the pharmaceutical dosage form,
Ks = Constant incorporating the surface-volume relation.
7. Stability Studies
Stability of a drug has been defined as the ability of a particular formulation[14,24]
, in a
specific container, to remain within its physical, chemical, therapeutic and toxicological
specifications. The purpose of stability testing is to provide evidence on how the quality of a
drug substance or drug product varies with time under the influence of a variety of
www.wjpr.net Vol 7, Issue 19, 2018. 1175
Manisha et al. World Journal of Pharmaceutical Research
environmental factors such as temperature, humidity, light, and enables recommended
storage conditions.
As per ICH guidelines the lengths of study and storage conditions are:
Accelerated testing - 37°C/75% RH for 6 months.
Procedure
In the present study, stability study was carried out by keeping samples for a period up to the
3 months at 37°C/75% RH for optimized formulation F4. After three months, samples were
analyzed for the physical appearance, drug entrapment efficiency, in vitro release study and
possible drug-excipient interactions using Infrared (FTIR) spectrophotometry.
RESULTS AND DISCUSSION
Preformulation studies
Description of drug
Various properties of drug related with physical appearance, state and solubility given in
Table no. 2.
Table No.2: Description on Drug.
S.NO PROPERTIES INFERENCE
1. Colour White colour
2. Solubility Freely soluble in Methanol, Water
and Dichrolomethane
3. Odour Odourless
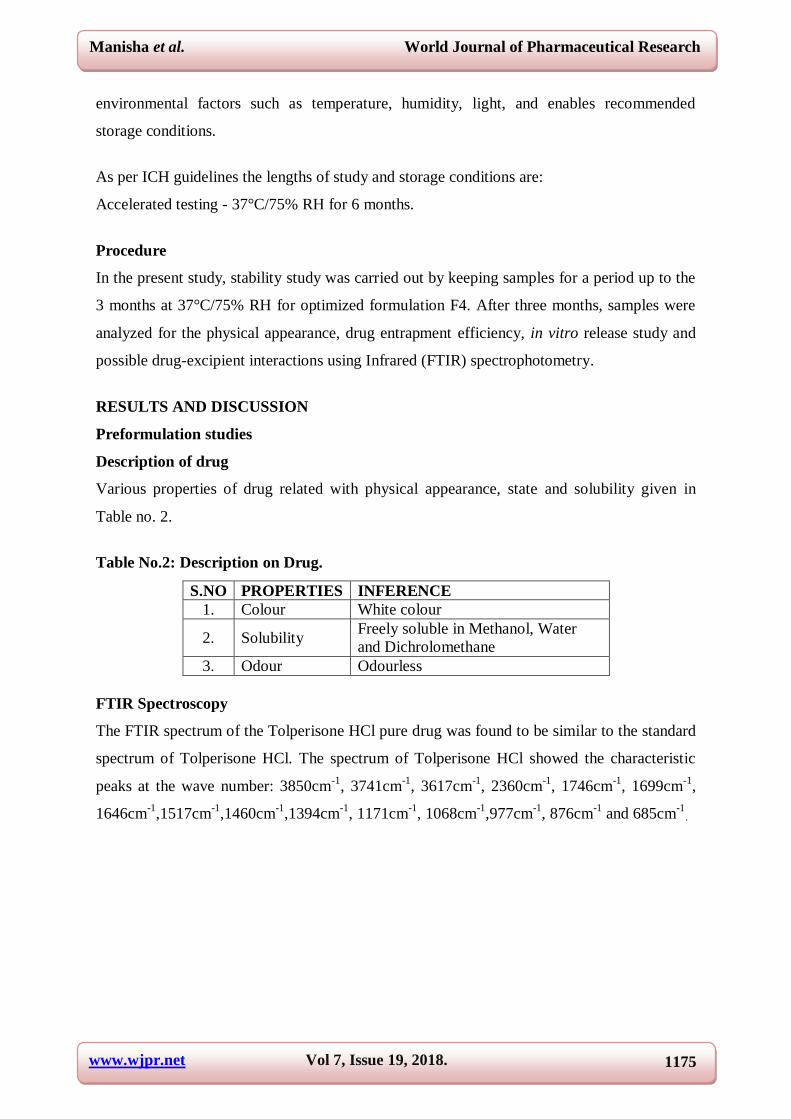
FTIR Spectroscopy
The FTIR spectrum of the Tolperisone HCl pure drug was found to be similar to the standard
spectrum of Tolperisone HCl. The spectrum of Tolperisone HCl showed the characteristic
peaks at the wave number: 3850cm-1
, 3741cm-1
, 3617cm-1
, 2360cm-1
, 1746cm-1
, 1699cm-1
,
1646cm-1
,1517cm-1
,1460cm-1
,1394cm-1
, 1171cm-1
, 1068cm-1
,977cm-1
, 876cm-1
and 685cm-1
.

www.wjpr.net Vol 7, Issue 19, 2018. 1176
Manisha et al. World Journal of Pharmaceutical Research
UV Spectroscopy
The absorption spectrum of Tolperisone HCl pure drug was scanned between 400-200 nm
with concentration of 10 μg/ml prepared in 0.1 M HCl (pH-1.2) (Fig. 4). The absorption
maxima λ max was noted at 260 nm.

www.wjpr.net Vol 7, Issue 19, 2018. 1177
Manisha et al. World Journal of Pharmaceutical Research
Melting Point Determination
The melting point of the obtained drug sample was found to be 170oC which was within the
reported range of 1670C-174
oC. It complies with the purity of the drug sample.
DRUG EXCIPIENT COMPATIBILITY STUDIES
FTIR Study
The FTIR spectra of the pure drug and pure polymers were taken initially. The combination
spectra of drug were also taken with the polymers in physical mixture as well as in
formulations of different polymer combinations (F1, F4, F7) (Fig.28, Fig.29, Fig.30) which
were taken after keeping samples for 3 months at 370C/75% RH. It was observed that all the
characteristic peaks of were Tolperisone HCl present in the combination spectra as well thus
indicating the compatibility of the drug with the polymers used in various formulations (Fig.
24, Fig. 25, Fig. 26, & Fig.27).
In comparison with pure drug, the absorption peak of the spectra for Tolperisone HCl in
different formulations showed no significant shift and no disappearance of characteristic
peaks suggesting that there was no interaction between drug and polymer matrices or no
degradation in Tolperisone HCl molecule. The differences in transmittance may be due to
concentration of drug present in formulations.
Fig. 25: IR Spectra of Ethyl Cellulose.

www.wjpr.net Vol 7, Issue 19, 2018. 1178
Manisha et al. World Journal of Pharmaceutical Research
Fig. 26: IR Spectra of Eudragit RS100.
Fig. 27: IR Spectra of Eudragit S100.
Fig. 28: IR Spectra of Drug + Eudragit (RS100) F1 (after 3 months).

www.wjpr.net Vol 7, Issue 19, 2018. 1179
Manisha et al. World Journal of Pharmaceutical Research
Fig. 29: IR Spectra of Drug + Eudragit (RS100) + Ethyl cellulose F4 (after 3 months).
Fig. 30: IR Spectra of Drug + Eudragit (RS100) + Ethyl cellulose F7 (after 3 months).
STANDARD CURVE OF TOLPERISONE HCl IN 0.1M HCl (pH-1.2)
Scanning of Tolperisone HCl in 0.1 M HCl (pH-1.2)
The absorption spectrum of pure drug was scanned between 400-200 nm with concentration
of 10 μg/ml prepared in 0.1 M HCl (pH-1.2) (Fig. 4). The absorption maxima λmax was
noted at 260 nm.
Preparation of Standard Curve
Table No. 4 shows the absorbance of standard solutions of Tolperisone HCl ranging from 2-
20 μg/ml in 0.1M HCl (pH-1.2). Figure 5 shows the standard calibration curve of Tolperisone
HCl. The curve was found to be linear in the range of 2-20 μg/ml at λmax 260nm. The
regression value was found to be 0.995.

www.wjpr.net Vol 7, Issue 19, 2018. 1180
Manisha et al. World Journal of Pharmaceutical Research
The calculations of drug content, in vitro release and stability studies are based on this
calibration curve.
Table 4: Standard Curve of Tolperisone Hydrochloride in S.G.F.
Conc.( g/ml) Absorbance at 260 nm
0 0
2 0.153
4 0.267
6 0.357
8 0.493
10 0.617
12 0.795
14 0.901
16 1.022
18 1.166
20 1.352
Fig. 5: Standard Curve of Tolperisone HCl.
EVALUATION TEST
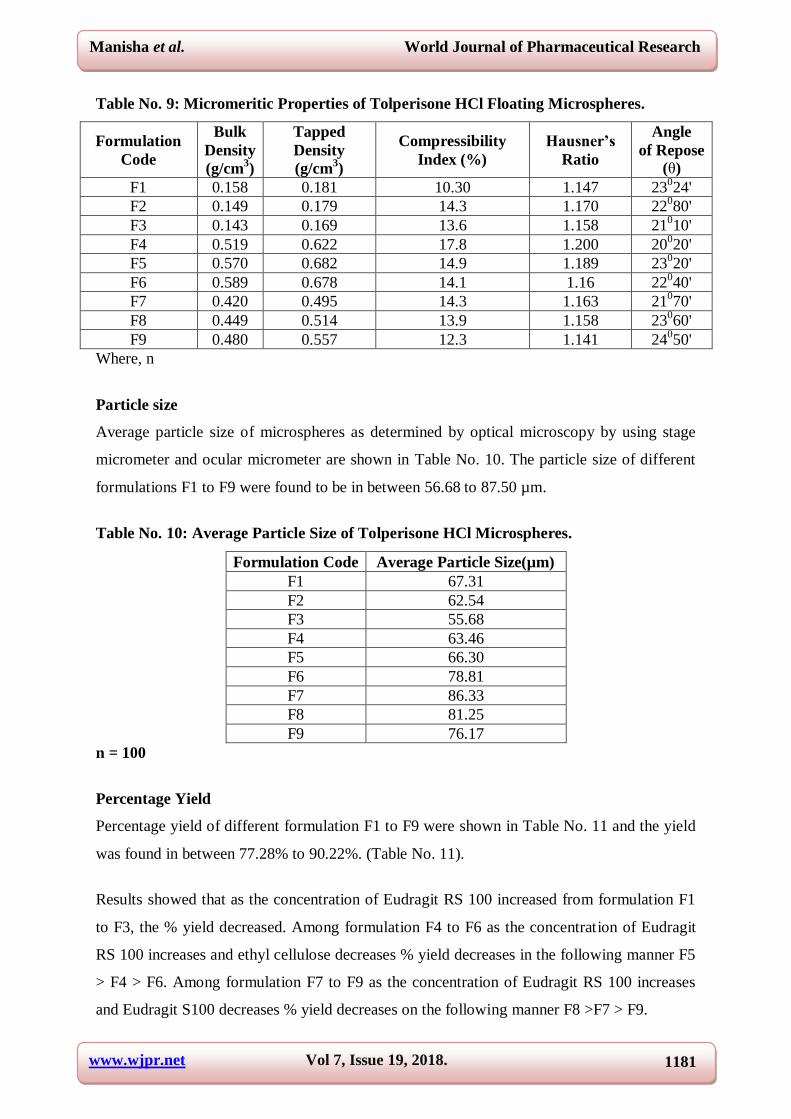
Micromeritic Properties
The Micromeritic properties of all formulations F1 to F9 of microspheres were shown in
Table No. 9, which were evaluated for variable parameters such as bulk density, tapped
density, % Compressibility index, Hausner’s ratio and angle of repose. The %
Compressibility index was in the range of 12-18 for all the formulations F1 to F9 indicating
good flow property. The value of Hausner’s ratio for the all formulation F1 to F9 was below
1.140 which indicates good flow property. The values of angle of repose for formulations F1
to F9 was found to be in the range of 20o-25
o which indicates good flow property of
microspheres.
www.wjpr.net Vol 7, Issue 19, 2018. 1181
Manisha et al. World Journal of Pharmaceutical Research
Table No. 9: Micromeritic Properties of Tolperisone HCl Floating Microspheres.
Formulation
Code
Bulk
Density (g/cm
3)
Tapped
Density
(g/cm3)
Compressibility
Index (%)
Hausner’s
Ratio
Angle
of Repose
(θ)
F1 0.158 0.181 10.30 1.147 23024'
F2 0.149 0.179 14.3 1.170 22080'
F3 0.143 0.169 13.6 1.158 21010'
F4 0.519 0.622 17.8 1.200 20020'
F5 0.570 0.682 14.9 1.189 23020'
F6 0.589 0.678 14.1 1.16 22040'
F7 0.420 0.495 14.3 1.163 21070'
F8 0.449 0.514 13.9 1.158 23060'
F9 0.480 0.557 12.3 1.141 24050'
Where, n
Particle size
Average particle size of microspheres as determined by optical microscopy by using stage
micrometer and ocular micrometer are shown in Table No. 10. The particle size of different
formulations F1 to F9 were found to be in between 56.68 to 87.50 µm.
Table No. 10: Average Particle Size of Tolperisone HCl Microspheres.
Formulation Code Average Particle Size(µm)
F1 67.31
F2 62.54
F3 55.68
F4 63.46
F5 66.30
F6 78.81
F7 86.33
F8 81.25
F9 76.17
n = 100
Percentage Yield
Percentage yield of different formulation F1 to F9 were shown in Table No. 11 and the yield
was found in between 77.28% to 90.22%. (Table No. 11).
Results showed that as the concentration of Eudragit RS 100 increased from formulation F1
to F3, the % yield decreased. Among formulation F4 to F6 as the concentration of Eudragit
RS 100 increases and ethyl cellulose decreases % yield decreases in the following manner F5
> F4 > F6. Among formulation F7 to F9 as the concentration of Eudragit RS 100 increases
and Eudragit S100 decreases % yield decreases on the following manner F8 >F7 > F9.

www.wjpr.net Vol 7, Issue 19, 2018. 1182
Manisha et al. World Journal of Pharmaceutical Research
Drug Loading And Drug Entrapment Efficiency
The values of % drug loading and % drug entrapment efficiency of different formulations
were shown in Table No.11.
Results showed that among formulation F1, F2 and F3, as the concentration of Eudragit
RS100 increases, there is a decrease in the % drug loading and % drug entrapment efficiency.
Among formulation F4 to F6 as the concentration of Eudragit RS 100 increases and ethyl
cellulose decreases % drug loading and % drug entrapment efficiency decreases in the
following manner F5 > F4 > F6. Among formulation F7 to F9 as the concentration of
Eudragit RS 100 increases and Eudragit S100 decreases % drug loading and % drug
entrapment efficiency decreases on the following manner F8 >F7 > F9.
Table No. 11: % Yield, % Drug Loading and % Drug Entrapment Efficiency.
Formulation Code
% Yield %
Drug Loading % Drug Entrapment
Efficiency
F1 90.22 35.21 82.64
F2 88.71 30.44 77.25
F3 82.49 29.33 69.12
F4 80.63 33.20 74.83
F5 84.71 35.72 76.83
F6 79.42 30.67 72.73
F7 83.34 29.25 76.65
F8 87.87 31.93 80.34
F9 77.28 28.20 71.65
Buoyancy Studies
From the study of floating properties (Table no 27.), it was observed that the % floating
ranges from 81.2 - 91.2% of different formulation. Maximum % floating was found in F4 i.e.
90.12%
Table 27: Floating Properties in SGF.
Formulation % Floatation F 1 85.16 F 2 84.45 F 3 83.67 F 4 90.12 F 5 88.56 F 6 87.12 F 7 84.82 F 8 85.56 F 9 83.12
n=3

www.wjpr.net Vol 7, Issue 19, 2018. 1183
Manisha et al. World Journal of Pharmaceutical Research
IN VITRO DRUG RELEASE STUDIES
Dissolution studies on all the nine formulations (F1 to F9) of Tolperisone HCl microspheres
were carried out using by USP dissolution apparatus Type II. 0.1M HCl (pH 1.2) was used as
the dissolution medium. The dissolution test was performed at 37±0.10C at 50 rpm.
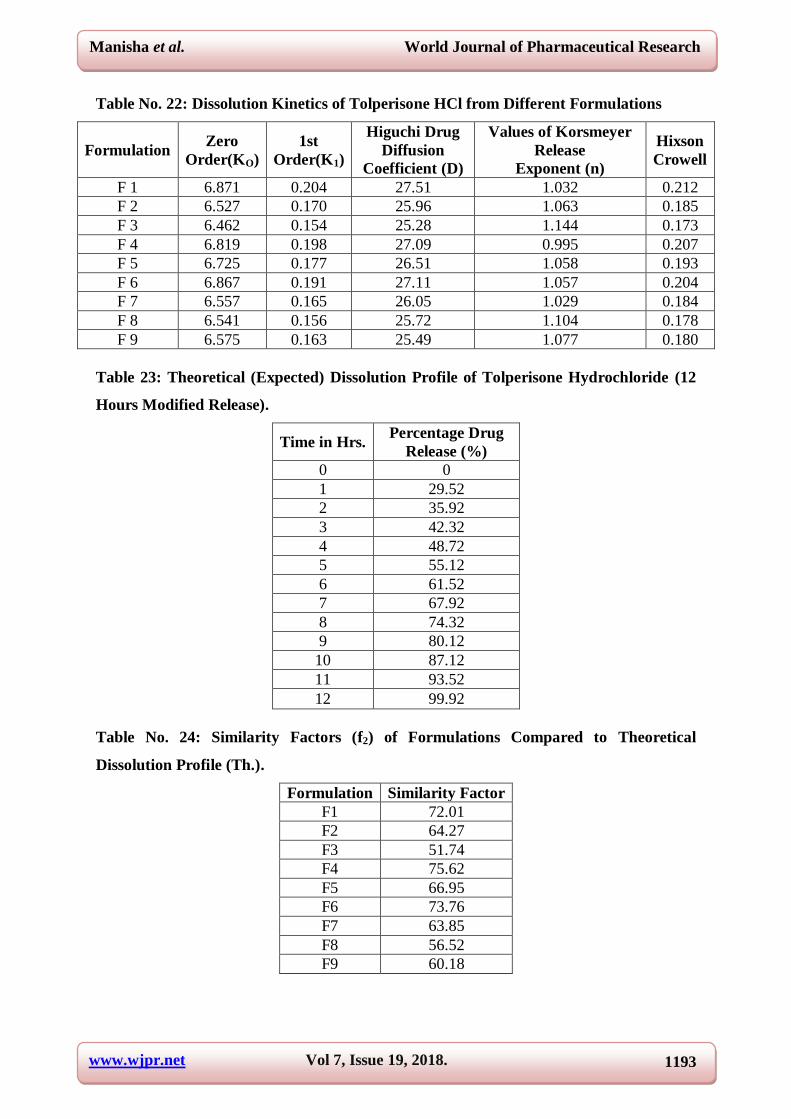
From the in vitro drug dissolution profiles of all batches (Table No. 12-20), it was observed
that batch F4 gave best dissolution profile from the rest of the formulations. It was evident
from the similarity factor (f2) of 75.62 as compared to theoretical dissolution profile of
modified release Tolperisone HCl (Table No.24). The similarity factor (f2) as proposed by
Moore and Flanner of different formulations (Table No.24) were found be similar as
compared to theoretical dissolution profile.
In order to find the effect of change in the content of polymers, formulations F1, F2 & F3
have been designed with gradual increase of Eudragit RS 100. Results showed that drug
release decreases as the content of Eudragit RS 100 increases (Fig. 6). Similarly, among
formulation F4, F5 & F6, as the concentration of Eudragit RS100 & Ethyl cellulose increases,
the drug release was increased (Fig. 11). Also, from formulations F7, F8 & F9 as the
concentration of Eudragit S100 increased, the drug release was decreased (Fig. 16).
Table No. 12: In vitro Drug Release of Formulation F1
Time(T)
in Hrs Sq.Rt.T Log T
Cum. %
Drug
Released
Cum.
%Drug
Remaining
Log %
Drug
Remaining
Log %
Drug
Released
Cube Rt. %
Drug
Remaining
0.0 0.0 ---- 0.00 100.00 2.00
4.64
1.0 1.0 0.0 27.21 72.79 1.86 1.43 4.18
2.0 1.4 0.2 37.59 62.41 1.80 1.58 3.97
3.0 1.7 0.2 44.21 55.79 1.75 1.65 3.82
4.0 2.0 0.3 51.32 48.68 1.69 1.71 3.65
5.0 2.2 0.3 57.92 42.08 1.62 1.76 3.48
6.0 2.4 0.4 66.59 33.41 1.52 1.82 3.22
7.0 2.6 0.4 71.90 28.10 1.45 1.86 3.04
8.0 2.8 0.5 78.77 21.23 1.33 1.90 2.77
9.0 3.0 0.5 82.13 17.87 1.25 1.91 2.61
10.0 3.2 0.5 87.52 12.48 1.10 1.94 2.32
11.0 3.3 0.5 89.52 10.48 1.02 1.95 2.19
12.0 3.5 0.5 92.77 7.23 0.86 1.97 1.93

www.wjpr.net Vol 7, Issue 19, 2018. 1184
Manisha et al. World Journal of Pharmaceutical Research
Table No. 13: In vitro Drug Release Formulation of F2.
Time(T)
in Hrs.
Sq.
Rt.T Log T
Cum.
%Drug
Released
Cum.
%Drug
Remaining
Log %
Drug
Remaining
Log %
Drug
Released
Cube Rt. %
Drug
Remaining
0.0 0.0
0.00 100.00 2.00
4.64
1.0 1.0 0.0 25.32 74.68 1.87 1.40 4.21
2.0 1.4 0.2 33.39 66.61 1.82 1.52 4.05
3.0 1.7 0.2 40.11 59.89 1.78 1.60 3.91
4.0 2.0 0.3 48.31 51.69 1.71 1.68 3.73
5.0 2.2 0.3 55.32 44.68 1.65 1.74 3.55
6.0 2.4 0.4 61.89 38.11 1.58 1.79 3.37
7.0 2.6 0.4 67.22 32.78 1.52 1.83 3.20
8.0 2.8 0.5 70.31 29.69 1.47 1.85 3.10
9.0 3.0 0.5 75.62 24.38 1.39 1.88 2.90
10.0 3.2 0.5 78.52 21.48 1.33 1.89 2.78
11.0 3.3 0.5 85.13 14.87 1.17 1.93 2.46
12.0 3.5 0.5 90.99 9.01 0.95 1.96 2.08
Table No. 14: In vitro Drug Release Formulation of F3.
Time(T)
in Hrs
Sq. Rt.
T Log T
Cum.
%Drug
Released
Cum.
%Drug
Remaining
Log %
Drug
Remaining
Log % Drug
Released
Cube Rt. %
Drug
Remaining
0.0 0.0
0.00 100.00 2.00
4.64
1.0 1.0 0.0 22.11 77.89 1.89 1.34 4.27
2.0 1.4 0.2 29.31 70.69 1.85 1.47 4.13
3.0 1.7 0.2 36.39 63.61 1.80 1.56 3.99
4.0 2.0 0.3 41.24 58.76 1.77 1.62 3.89
5.0 2.2 0.3 52.19 47.81 1.68 1.72 3.63
6.0 2.4 0.4 57.31 42.69 1.63 1.76 3.49
7.0 2.6 0.4 62.31 37.69 1.58 1.79 3.35
8.0 2.8 0.5 65.21 34.79 1.54 1.81 3.26
9.0 3.0 0.5 71.91 28.09 1.45 1.86 3.04
10.0 3.2 0.5 73.99 26.01 1.42 1.87 2.96
11.0 3.3 0.5 81.17 18.83 1.27 1.91 2.66
12.0 3.5 0.5 88.91 11.09 1.04 1.95 2.23
Table No. 15: In vitro Drug Release Formulation of F4.
Time(T)
in Hrs
Sq. Rt.
T Log T
Cum.
%Drug
Released
Cum.
%Drug
Remaining
Log %
Drug
Remaining
Log %
Drug
Released
Cube Rt. %
Drug
Remaining
0.0 0.0
0.00 100.00 2.00
4.64
1.0 1.0 0.0 30.21 69.79 1.84 1.48 4.12
2.0 1.4 0.2 35.21 64.79 1.81 1.55 4.02
3.0 1.7 0.2 40.23 59.77 1.78 1.60 3.91
4.0 2.0 0.3 49.59 50.41 1.70 1.70 3.69
5.0 2.2 0.3 56.38 43.62 1.64 1.75 3.52
6.0 2.4 0.4 64.42 35.58 1.55 1.81 3.29

www.wjpr.net Vol 7, Issue 19, 2018. 1185
Manisha et al. World Journal of Pharmaceutical Research
7.0 2.6 0.4 69.17 30.83 1.49 1.84 3.14
8.0 2.8 0.5 76.33 23.67 1.37 1.88 2.87
9.0 3.0 0.5 82.11 17.89 1.25 1.91 2.62
10.0 3.2 0.5 85.31 14.69 1.17 1.93 2.45
11.0 3.3 0.5 89.32 10.68 1.03 1.95 2.20
12.0 3.5 0.5 92.20 7.80 0.89 1.96 1.98
Table No. 16: In vitro Drug Release Formulation of F5.
Time(T)
in Hrs Sq. Rt. T Log T
Cum. %Drug
Released
Cum.
%Drug
Remaining
Log %
Drug
Remaining
Log %
Drug
Released
Cube Rt.
% Drug
Remaining
0.0 0.0
0.00 100.00 2.00
4.64
1.0 1.0 0.0 27.39 72.61 1.86 1.44 4.17
2.0 1.4 0.2 31.91 68.09 1.83 1.50 4.08
3.0 1.7 0.2 38.31 61.69 1.79 1.58 3.95
4.0 2.0 0.3 46.37 53.63 1.73 1.67 3.77
5.0 2.2 0.3 53.17 46.83 1.67 1.73 3.60
6.0 2.4 0.4 60.24 39.76 1.60 1.78 3.41
7.0 2.6 0.4 65.72 34.28 1.54 1.82 3.25
8.0 2.8 0.5 71.82 28.18 1.45 1.86 3.04
9.0 3.0 0.5 78.03 21.97 1.34 1.89 2.80
10.0 3.2 0.5 83.37 16.63 1.22 1.92 2.55
11.0 3.3 0.5 87.32 12.68 1.10 1.94 2.33
12.0 3.5 0.5 89.32 10.68 1.03 1.95 2.20
Table No. 17: In vitro Drug Release Formulation of F6
Time(T)in
Hrs
Sq. Rt.
T Log T
Cum.
%Drug
Released
Cum.
%Drug
Remaining
Log % Drug
Remaining
Log %
Drug
Released
Cube Rt.
% Drug
Remaining
0.0 0.0
0.00 100.00 2.00
4.64
1.0 1.0 0.0 28.14 71.86 1.86 1.45 4.16
2.0 1.4 0.2 33.32 66.68 1.82 1.52 4.06
3.0 1.7 0.2 39.17 60.83 1.78 1.59 3.93
4.0 2.0 0.3 47.11 52.89 1.72 1.67 3.75
5.0 2.2 0.3 54.17 45.83 1.66 1.73 3.58
6.0 2.4 0.4 62.23 37.77 1.58 1.79 3.36
7.0 2.6 0.4 68.23 31.77 1.50 1.83 3.17
8.0 2.8 0.5 74.39 25.61 1.41 1.87 2.95
9.0 3.0 0.5 80.77 19.23 1.28 1.91 2.68
10.0 3.2 0.5 84.39 15.61 1.19 1.93 2.50
11.0 3.3 0.5 88.81 11.19 1.05 1.95 2.24
12.0 3.5 0.5 91.47 8.53 0.93 1.96 2.04

www.wjpr.net Vol 7, Issue 19, 2018. 1186
Manisha et al. World Journal of Pharmaceutical Research
Table No. 18: In vitro Drug Release Formulation of F7.
Time(T)
in Hrs
SQ. Rt.
T Log T
Cum.
%Drug
Released
Cum.
%Drug
Remaining
Log %
Drug
Remaining
Log %
Drug
Released
Cube Rt. %
Drug
Remaining
0.0 0.0
0.00 100.00 2.00
4.64
1.0 1.0 0.0 27.32 72.68 1.86 1.44 4.17
2.0 1.4 0.2 33.42 66.58 1.82 1.52 4.05
3.0 1.7 0.2 39.32 60.68 1.78 1.59 3.93
4.0 2.0 0.3 46.31 53.69 1.73 1.67 3.77
5.0 2.2 0.3 53.17 46.83 1.67 1.73 3.60
6.0 2.4 0.4 61.07 38.93 1.59 1.79 3.39
7.0 2.6 0.4 67.82 32.18 1.51 1.83 3.18
8.0 2.8 0.5 73.77 26.23 1.42 1.87 2.97
9.0 3.0 0.5 77.82 22.18 1.35 1.89 2.81
10.0 3.2 0.5 81.02 18.98 1.28 1.91 2.67
11.0 3.3 0.5 85.32 14.68 1.17 1.93 2.45
12.0 3.5 0.5 88.01 11.99 1.08 1.94 2.29
Table No. 19: In vitro Drug Release Formulation of F8.
Time(T)in Hrs Sq. Rt. T Log T
Cum.
%Drug
Released
Cum. %
Drug
Remaining
Log % Drug
Remaining
Log %
Drug
Released
Cube Rt. %
Drug
Remaining
0.0 0.0 0.00 100.00 2.00 4.64
1.0 1.0 0.0 24.70 75.30 1.88 1.39 4.22
2.0 1.4 0.2 31.11 68.89 1.84 1.49 4.10
3.0 1.7 0.2 36.42 63.58 1.80 1.56 3.99
4.0 2.0 0.3 41.82 58.18 1.76 1.62 3.87
5.0 2.2 0.3 50.77 49.23 1.69 1.71 3.67
6.0 2.4 0.4 58.18 41.82 1.62 1.76 3.47
7.0 2.6 0.4 64.07 35.93 1.56 1.81 3.30
8.0 2.8 0.5 70.88 29.12 1.46 1.85 3.08
9.0 3.0 0.5 74.08 25.92 1.41 1.87 2.96
10.0 3.2 0.5 79.22 20.78 1.32 1.90 2.75
11.0 3.3 0.5 83.87 16.13 1.21 1.92 2.53
12.0 3.5 0.5 86.32 13.68 1.14 1.94 2.39

www.wjpr.net Vol 7, Issue 19, 2018. 1187
Manisha et al. World Journal of Pharmaceutical Research
Table No. 20: In vitro Drug Release Formulation of F9.
Time(T)in
Hrs
Sq. Rt.
T Log T
Cum. %Drug
Released
Cum.
%Drug
Remaining
Log % Drug
Remaining
Log % Drug
Released
Cube Rt. %
Drug
Remaining
0.0 0.0
0.00 100.00 2.00
4.64
1.0 1.0 0.0 25.19 74.81 1.87 1.40 4.21
2.0 1.4 0.2 31.93 68.07 1.83 1.50 4.08
3.0 1.7 0.2 37.25 62.75 1.80 1.57 3.97
4.0 2.0 0.3 44.17 55.83 1.75 1.65 3.82
5.0 2.2 0.3 57.99 42.01 1.62 1.76 3.48
6.0 2.4 0.4 60.07 39.93 1.60 1.78 3.42
7.0 2.6 0.4 65.19 34.81 1.54 1.81 3.27
8.0 2.8 0.5 71.22 28.78 1.46 1.85 3.06
9.0 3.0 0.5 75.33 24.67 1.39 1.88 2.91
10.0 3.2 0.5 80.31 19.69 1.29 1.90 2.70
11.0 3.3 0.5 84.07 15.93 1.20 1.92 2.52
12.0 3.5 0.5 87.88 12.12 1.08 1.94 2.30
Table No. 24: Similarity Factors (f2) of Formulations Compared to Theoretical
Dissolution Profile (Th.).
Formulation Similarity Factor
F1 72.01
F2 64.27
F3 51.74
F4 75.62
F5 66.95
F6 73.76
F7 63.85
F8 56.52
F9 60.18
Release Kinetics
The results obtained from in vitro drug release studies were plotted adopting five different
mathematical models of data treatment as follows:
% Cum. Drug Release vs. Time (Zero order rate kinetics).
Log % Cum. Drug Retained vs. Time (First order rate kinetics).
% Cum. Drug release was plotted against √T (Square root time). (Higuchi model)
Log % Cum. Drug Release vs. Log Time (Korsmeyer & Peppas exponential equation).
Hixson-Crowell’s erosion equation, (% Cum. Drug Retained)1/3
Vs. Time.
www.wjpr.net Vol 7, Issue 19, 2018. 1188
Manisha et al. World Journal of Pharmaceutical Research
The curve fitting results of the release rate profiles of the designed formulation were shown
in the Figures 6-20, which gave an idea on the release rate and the mechanism of drug release
from matrices.
In accordance with the results of Alderman[114]
, the quick formation of gelatinous viscous
layer resulting from hydration is considered to be the first essential step for delivery/release
of drug.
The experimental data was fitted to different kinetic models like zero order and first order etc
in order to establish the release pattern of the drug from the microspheres. The experimental
data was also fitted to Higuchi’s model, Korsmeyer model and Hixson Crowell to ascertain
the mechanism of drug release from the matrix system.
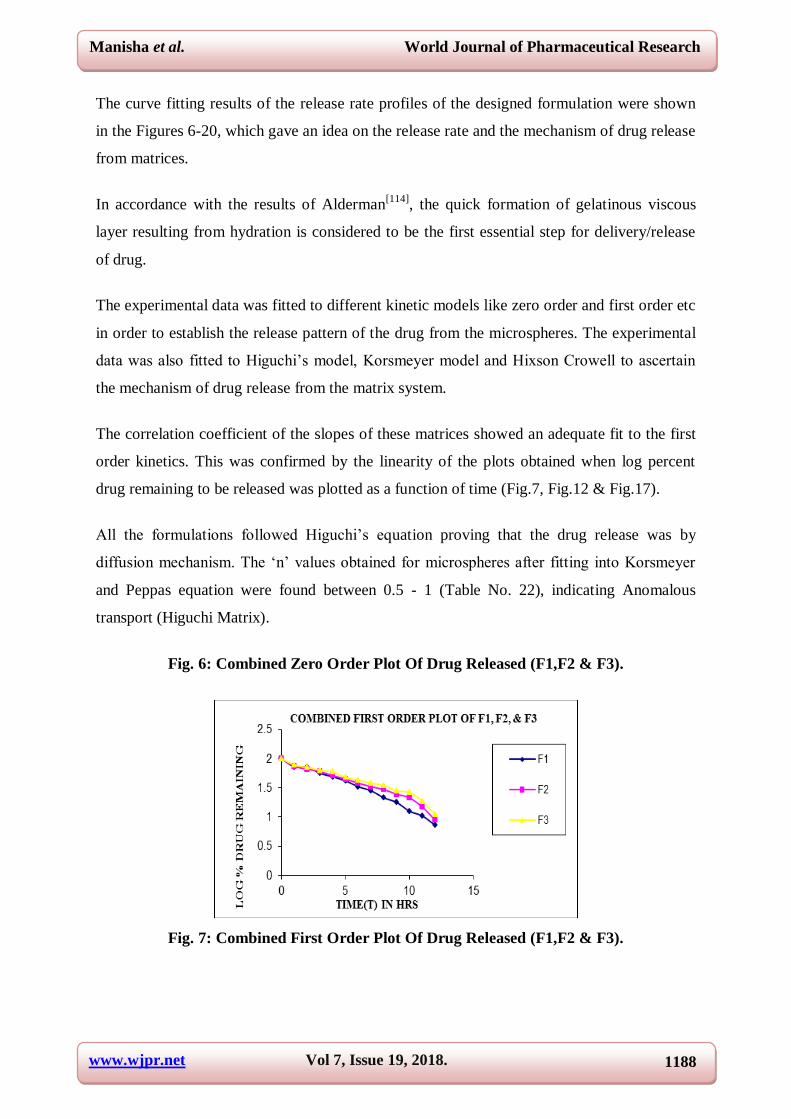
The correlation coefficient of the slopes of these matrices showed an adequate fit to the first
order kinetics. This was confirmed by the linearity of the plots obtained when log percent
drug remaining to be released was plotted as a function of time (Fig.7, Fig.12 & Fig.17).
All the formulations followed Higuchi’s equation proving that the drug release was by
diffusion mechanism. The ‘n’ values obtained for microspheres after fitting into Korsmeyer
and Peppas equation were found between 0.5 - 1 (Table No. 22), indicating Anomalous
transport (Higuchi Matrix).
Fig. 6: Combined Zero Order Plot Of Drug Released (F1,F2 & F3).
Fig. 7: Combined First Order Plot Of Drug Released (F1,F2 & F3).

www.wjpr.net Vol 7, Issue 19, 2018. 1189
Manisha et al. World Journal of Pharmaceutical Research
Fig. 8: Combined Higuchi Plot Of Drug Released (F1,F2 & F3).
Fig. 9: Combined Korsmeyer Plot of Drug Released (F1, F2 & F3).
Fig. 10: Combined Hixson Crowell Plot of Drug Released (F1,F2 & F3).

www.wjpr.net Vol 7, Issue 19, 2018. 1190
Manisha et al. World Journal of Pharmaceutical Research
Fig. 11: Combined Zero Order Plot Of Drug Released (F4, F5 & F6).
Fig. 12: Combined First Order Plot Of Drug Released (F4, F5 & F6).
Fig. 13: Combined Higuchi Plot of Drug Released (F4, F5 & F6).
Fig. 14: Combined Korsmeyer Plot Of Drug Released (F4,F5 & F6).

www.wjpr.net Vol 7, Issue 19, 2018. 1191
Manisha et al. World Journal of Pharmaceutical Research
Fig.15: Combined Hixson Crowell Plot Of Drug Released (F4, F5 & F6).
Fig. 16: Combined Zero Order Plot Of Drug Released (F7, F8 & F9).
Fig. 17: Combined First Order Plot Of Drug Released (F7, F8 & F9).
Fig. 18: Combined Higuchi Plot Of Drug Released (F7, F8 & F9).

www.wjpr.net Vol 7, Issue 19, 2018. 1192
Manisha et al. World Journal of Pharmaceutical Research
Fig. 19: Combined Korsmeyer Plot Of Drug Released (F7, F8 & F9).
Fig. 20: Combined Hixson Crowell Plot Of Drug Released (F7, F8 & F9).
Table No. 21: Release Profiles of Tolperisone HCl from Different Formulations (R2
values).
Formulation Zero Order 1st Order Higuchi Korsmeyer Hixson Crowell F 1 0.930 0.983 0.996 0.996 0.993 F 2 0.942 0.957 0.995 0.992 0.983 F 3 0.960 0.946 0.987 0.988 0.978 F 4 0.939 0.975 0.991 0.973 0.991 F 5 0.953 0.975 0.989 0.975 0.990 F 6 0.950 0.974 0.989 0.973 0.991 F 7 0.941 0.988 0.992 0.980 0.991 F 8 0.956 0.986 0.987 0.980 0.992 F 9 0.952 0.984 0.990 0.982 0.991
www.wjpr.net Vol 7, Issue 19, 2018. 1193
Manisha et al. World Journal of Pharmaceutical Research
Table No. 22: Dissolution Kinetics of Tolperisone HCl from Different Formulations
Formulation Zero
Order(KO)
1st
Order(K1)
Higuchi Drug
Diffusion
Coefficient (D)
Values of Korsmeyer
Release Exponent (n)
Hixson
Crowell
F 1 6.871 0.204 27.51 1.032 0.212
F 2 6.527 0.170 25.96 1.063 0.185
F 3 6.462 0.154 25.28 1.144 0.173
F 4 6.819 0.198 27.09 0.995 0.207
F 5 6.725 0.177 26.51 1.058 0.193
F 6 6.867 0.191 27.11 1.057 0.204
F 7 6.557 0.165 26.05 1.029 0.184
F 8 6.541 0.156 25.72 1.104 0.178
F 9 6.575 0.163 25.49 1.077 0.180
Table 23: Theoretical (Expected) Dissolution Profile of Tolperisone Hydrochloride (12
Hours Modified Release).
Time in Hrs. Percentage Drug
Release (%)
0 0
1 29.52
2 35.92
3 42.32
4 48.72
5 55.12
6 61.52
7 67.92
8 74.32
9 80.12
10 87.12
11 93.52
12 99.92
Table No. 24: Similarity Factors (f2) of Formulations Compared to Theoretical
Dissolution Profile (Th.).
Formulation Similarity Factor
F1 72.01
F2 64.27
F3 51.74
F4 75.62
F5 66.95
F6 73.76
F7 63.85
F8 56.52
F9 60.18

www.wjpr.net Vol 7, Issue 19, 2018. 1194
Manisha et al. World Journal of Pharmaceutical Research
Table No. 25: % Drug Entrapment of Formulation F4 before & after 3 Months
Formulation Initial After 3 Months
F4 74.83 73.56
Fig. 21: Comparison of in vitro dissolution profiles of formulation F4 & Theoretical
dissolution profile (Th.).
STABILITY STUDIES
Microspheres from optimized batch F4 were put on short-term stability study at 37oC/75%
RH condition for the period of three months. After three months, the microspheres were
evaluated for physical appearance, drug entrapment efficiency, in vitro release study and
possible drug-excipients interactions using Infrared (FTIR) spectrophotometry. Results
showed that the microspheres did not show any significant changes in physical appearance,
drug content (Table No.25) and cumulative % drug release (Table No.26). FTIR study
(Fig.28) also revealed that there was no evidence of incompatibility between the pure drug
Tolperisone HCl and various polymers that were used in the formulations. Hence we can
conclude that the formulations should be kept at a temperature not above 30oC and in a dry
place.

www.wjpr.net Vol 7, Issue 19, 2018. 1195
Manisha et al. World Journal of Pharmaceutical Research
Table-26: Cumulative % Drug Released from F4 initially and after 3 months (kept at
370C/75%RH)
Time (T) in Hours Initially After 3 months
0 0.00 0.00
1 30.21 29.45
2 35.21 34.56
3 40.23 39.43
4 49.59 48.74
5 56.38 56.35
6 64.42 63.63
7 69.17 67.25
8 76.33 725.97
9 82.11 81.37
10 85.31 83.84
11 89.32 86.27
12 92.20 91.47
Scanning Electron Microscopy
The determination of shape and surface morphology was done by scanning electron
microscope HITACHI SU 1500, Japan.SEM analysis of the samples revealed that all
microspheres were smooth, spherical and slightly aggregated. The surface topography reveals
that the drug is well dispersed on the surface suggesting the prepared microspheres were
matrix based wherein the drug is evenly distributed in the entire polymeric matrix. Also they
were porous in nature due to the rapid escape of the volatile solvents molecules during
formulation. Inward dents were seen on the surface probably due to collapse of the walls of
the microspheres during the in situ drying process. (Fig. 31).
Fig. 31: Scanning Electron Microscopic View of Microsphere.

www.wjpr.net Vol 7, Issue 19, 2018. 1196
Manisha et al. World Journal of Pharmaceutical Research
CONCLUSION
1. In the present study, nine different formulations (F1 to F9) of Tolperisone HCl loaded
microspheres were prepared using various polymeric combinations with a view for the
sustained delivery of the drug over a time period of 12 hours.
2. All the polymers and the drug used were of pharmaceutical grade.
3. Biocompatible polymers such as Eudragit (RS100 & S100) & Ethyl Cellulose (EC) all
hydrophobic can be used to formulate sustained release microspheres especially in case of
a highly water soluble drug like Tolperisone HCl.
4. Good percentage yield was obtained with all the formulations particularly microspheres
prepared with a Eudragit RS 100.
5. Good loading efficiency and entrapment efficiency were obtained with all the batches.
6. All the formulations showed very good flow properties and were within acceptable range
and therefore they can easily be filled into capsules.
7. Particle size analysis revealed that the particle size of all different formulations were in
acceptable range.
8. From the in vitro drug dissolution profiles of all batches of all batches, it was observed
that batch F4 gave best dissolution profile from the rest of the formulations. It was
evident from the Similarity Factor (f2) of 75.62 as compared to theoretical dissolution
profile of modified release Tolperisone HCl and hence batch F4 was optimized out as the
best formulation among all the formulations.
9. % Floating studies revealed that microspheres were able to float in the dissolution
medium for the entire drug release period
10. Dissolution results showed that drug release decreases as the content of Eudragit RS 100
increases among formulations F1 to F3. Among formulation F4, F5 & F6, as the
concentration of Eudragit RS100 & Ethyl cellulose increases, the drug release was
increased. Also, among formulations F7, F8 & F9 as the concentration of Eudragit S100
increases, the drug release was decreased.
11. Analysis of dissolution profiles (R2values) showed that drug release from matrix followed
first order kinetics.
12. Analysis of dissolution profiles on the basis of Higuchi’s model and that of Korsmeyer
model suggested that drug release was basically Fickian diffusion controlled (Higuchi
Diffusion).
13. FTIR study revealed that there was no evidence of interaction between pure drug
Tolperisone HCl and the polymers used in the study.

www.wjpr.net Vol 7, Issue 19, 2018. 1197
Manisha et al. World Journal of Pharmaceutical Research
14. SEM analysis of the samples revealed that all microspheres were smooth, spherical and
slightly aggregated. The surface topography reveals that the drug was well dispersed on
the surface suggesting the prepared microspheres were matrix based.
15. Stability studies revealed that the formulation F4 was stable after keeping them at
370C/75% RH for three months.
16. All these results show that the prepared microspheres seem to be a potential candidate for
oral sustained release of the drug.
REFERENCES
1. Arora S, ALI A, Ahuja A, Khar. RK, Baboota S, Floating Drug Delivery System: A
review. AAPS PharmSci tech, 2005; 6(3): E372-E390.
2. Chein YW. Rate Controlled Drug Delivery Sytems. Controlled release vs. sustained
release. Med Progrm tech, 1989; 15: 21-46.
3. Chien YW. Oral Delivery System and delivery system in novel drug delivery system,
Edition 50, Marcel Dekker Publication, New York 1992.
4. Patel GM. Floating drug delivery system: an innovative approach to prolong gastric
retention. www. pharmainfo.net 2007.s
5. Gholap SB; Hollow microsphere; A review, International Journal of Pharmaceutical
Sciences Review and Research, 2010; 74.
6. Singh BN, Kim KH:s Floating drug delivery system; an approach to oral controlled drug
delivery via gastric retention. J. Control. Release, 2000; 63: 235-239.
7. Kataria S, Middha A, Sandhu P, Ajay B & Bhawana K. Microspheres a review, Inter.
jour. of research in pharmacy and chemistry, 2011; 1184.
8. Shwetha Kamath K., Senthil kumar RK. Design and Evaluation of Floating Microspheres
of Rabeprazol sodium. International Journal of Pharmacy and Pharmaceutical Science,
2012; 4(3): 357-367.
9. Welzig S, Rothenburger J, Kalz B, Gungl J, Gerdes K. Tolperisone controlled release
tablet. European patent, 2010; 2: 228 056.
10. Kocsis P, Farkas S, Fodor L. Tolperisone-type drugs inhibit spinal reflexes via blockade
of voltage-gated sodium and calcium channels. Journal of Pharmacology and
Experimental Therapeutics, 315(3): 1237–1246.
11. Center for Drug Information and Pharmacy Practice. ABDA, Federal union of Germany
Association of Pharmacist, Berlin, 63.

www.wjpr.net Vol 7, Issue 19, 2018. 1198
Manisha et al. World Journal of Pharmaceutical Research
12. Pal K, Sandor F, Laszlo F. Tolperisone-type drugs inhibit spinal reflexes voltage-gated
sodium and calcium channels. JPET, 2005; 315: 1237–1246.
13. Cooper RNM. Asst Prof., Dept. of Chest & TB, K J Somaiya Medical College, Mumbai;
Asst Editor, Journal of Association Physician of India; President Elect, Malad Medical
Association.
14. Lachman L, Partic D. Kinetic principles and stability. Theory and practice of industrial
pharmacy. 3rd ed. Philadelphia. Varghese publishing house, 1987; 171: 767.
15. Government of India, Ministry of Health and Family Welfare. Indian Pharmacopoeia.
Ghaziabad: Indian Pharmacopoeia Commission, 2007; 849-50.
16. Kamel AH, Sokar MS, Gamal SS, Naggar VF. Preparation and evaluation of ketoprofen
floating oral delivery system. Int J Pharm., 2001; 220: 13-21.
17. Jain AK, Jain CP, Tanwar YS, Naruka PS. Formulation, characterization and in vitro
evaluation of floating microspheres of famotidine as a gastro retentivedosage form. Asian
J Pharm., 2009; 3(3): 222-6.
18. Saravanan M, Dhanaraju MD, Sridhar SK, Ramachandran S, Sam SKG, Anand P,
Bhaskar K, Rao GS. Preparation, characterization and in vitro release kinetics of
ibuprofen polystyrene microspheres. Indian J Pharm Sci., 2004; 66(3): 287-92.
19. Patel A, Ray S, Thakur RS. In vitro evaluation and optimization of controlled release
floating drug delivery System of metformin hydrochloride. DARU, 2006; 14(2): 57-64.
20. Ma N, Xu L, Wang Q, Zhang X, Zhang W, Li Y, Jin L, Li S. Development and evaluation
of new sustained-release floating microspheres, Int J Pharm., 2008; 358: 82-90.
21. Martin A, Bustamant P, Chum AHC, Physical pharmacy, BI Waverly; New Delhi ,Pvt
Ltd, 1996; 423-452.
22. Srivastava AK, Ridhurkar DN, Wadhwa S. Floating microspheres of cimetidine:
formulation, characterization and in vitro evaluation. Acta Pharm, 2005; 55: 277-85.
23. Costa P, Lobo JMS. Modeling and comparison of dissolution profiles. Eur J Pharm Sci.,
2001; 13: 123-33.
24. Kulkarni GT, Gowthamarajan K, Suresh B. Stability testing of Pharmaceutical products:
An Overview. Indian J Pharm Educ, Oct-Dec, 2004; 38(4): 194-202.