a restriction fragment length polymorphism based linkage …jholland/pubs/diploidoatmap.pdf · ·...
TRANSCRIPT
A restriction fragment length polymorphism basedlinkage map of a diploid Avena recombinantinbred line population
C.A. Kremer, M. Lee, and J.B. Holland
Abstract: A population of 100 F6-derived recombinant inbred lines was developed from the cross of two diploid (2n =14) Avenaaccessions, CI3815 (A. strigosa) and CI1994 (A. wiestii). Restriction fragment length polymorphism (RFLP)probes previously mapped in other grass species were used to develop a framework linkage map suitable for compara-tive genetics. Nine linkage groups were identified among the 181 loci mapped, with an average interlocus distance of 5cM, and a total genetic map length of 880 cM. A cluster of five tightly linked crown rust resistance genes (Pca) waslocalized on the map, as were five loci identified by disease resistance gene analogs from maize, sorghum, and wheat.None of the five loci identified by the gene analogs were linked to thePca locus. The linkage map was compared withpreviously published diploid and hexaploid linkage maps in an attempt to identify homologous or homoeologous chro-mosomes between populations. Locus orders and linkage relationships were poorly conserved between theA. strigosa×A. wiestii map and otherAvenamaps. In spite of mapping complications due to duplications within a basic genome aswell as the allopolyploid constitution of manyAvenaspecies, such map comparisons withinAvenaprovide further evi-dence of substantial chromosomal rearrangement between species withinAvena.
Key words: grasses, oat, genetic mapping, homoeology.
Résumé: Une population constituée de 100 lignées recombinantes fixées dérivées en F6 a été produite à partir d’uncroisement entre deux accessions diploïdes (2n = 14) de l’Avena: CI3815 (A. strigosa) et CI1994 (A. wiestii). Dessondes RFLP précédemment utilisées pour la cartographie chez d’autres graminées ont été employées pour développerune carte cadre comparer l’organisation des génomes. Neuf linkats ont été identifiés parmi les 181 locus étudiés. Ladensité moyenne des marqueurs était de 5 cM et la taille totale de la carte était de 880 cM. Un îlot dense de cinq gè-nes conférant la résistance à la rouille couronnée (Pca) a été localisé sur la carte tout comme cinq locus correspondantà des analogues de gènes de résistance en provenance du maïs, du sorgho et du blé. Aucun des cinq locus identifiésn’était lié au locusPca. La carte génétique a été comparée à des cartes publiées antérieurement pour des avoines di-ploïdes ou hexaploïdes afin d’identifier des chromosomes homologues ou homéologues entre populations. L’ordre deslocus et les distances étaient très mal conservés entre la carte tirée du croisementA. strigosa× A. wiestii et les autrescartes pour le genreAvena. En dépit des complications qu’entraînent les duplications au sein du génome de base etl’allopolyploïdie de plusieurs espèces d’Avena, de telles comparaisons de cartes génétiques procurent des évidences ad-ditionnelles quant à l’existence d’importantes différences au niveau de l’arrangement des chromosomes parmi les espè-ces du genreAvena.
Mots clés: graminées, avoine, cartographie génétique, homéologie.
[Traduit par la Rédaction]
Kremer et al. 204
Introduction
The genusAvenaconsists of diploid, tetraploid, and hexa-ploid species, all of which share the basic chromosomenumberx = 7. The most important cultivatedAvenaspecies
are the hexaploid (2n = 6x = 42) oats,A. sativa L., andA. byzantinaC. Koch. Rajhathy and Thomas (1974) sug-gested that the hexaploidAvena genome is comprised ofthree subgenomes, A, C, and D, each of which representsmodifications of a common homoeologous chromosome se-
Genome44: 192–204 (2001) © 2001 NRC Canada
192
DOI: 10.1139/gen-44-2-192
Received November 28, 1999. Accepted December 5, 2000. Published on the NRC Research Press Web site March 9, 2001.
Corresponding Editor: G.J. Scoles.
C.A. Kremer1, M. Lee,2 and J.B. Holland.3 Department of Agronomy, Iowa State University, Ames, IA 50010, U.S.A.
1Present address: Molecular Genetics Laboratory, The Mayo Clinic, Hilton 970, 2001st St. S.W., Rochester, MN 55905, U.S.A.2Corresponding author (e-mail: [email protected]).3Present address: United States Department of Agriculture – Agriculture Research Service (USDA–ARS), Department of CropScience, Box 7620 North Carolina State University, Raleigh, NC 27695-7620, U.S.A.
I:\gen\gen44\gen-02\G00-115.vpTuesday, March 06, 2001 1:36:21 PM
Color profile: Generic CMYK printer profileComposite Default screen
ries. The genomes of diploid and tetraploidAvenaspeciesare also classified into A, B, C, and D genome groups andinto further subdivisions, based on karyotypes and chromo-some pairing in interspecific hybrids (Rajhathy and Thomas1974). The diploid taxaA. wiestii Steud., A. strigosaSchreb.,A. hirtula Lag., andA. atlanticaBaum et Fedak areclassified as AsAs, where As is a subdivision of the A ge-nome group that the hexaploidAvenapossess (Leggett andThomas 1995; Rajhathy and Thomas 1974). The amount ofchromosomal rearrangement among homoeologues in differ-ent genome groups both within hexaploidAvena and be-tween hexaploidAvena and related diploid and tetraploidspecies is not certain, although Rajhathy and Thomas (1974)suggested that chromosomal rearrangement was an impor-tant factor in evolution and speciation withinAvena. Molec-ular cytogenetic studies ofA. sativa confirmed that thechromosomes of hexaploidAvena represent segmentallyrather than completely homoeologous groups (Kianian et al.1997).
Comparative mapping using linkage maps of differentAvenaspecies based on a common set of restriction frag-ment length polymorphism (RFLP) probes may help eluci-date the relationships between the genomes of differentspecies and between the different genomes within the culti-vated hexaploidAvena. The diploid relatives of cultivatedAvenacould represent model species forAvenagenetics be-cause of their close taxonomic relationship toA. sativaandtheir simpler genomes. RFLP linkage maps have been devel-oped in diploid Avena F2-derived populations developedfrom crosses betweenA. atlantica and A. hirtula(O’Donoughue et al. 1992; Van Deynze et al. 1995) and be-tween A. strigosa and A. wiestii (Rayapati et al. 1994a).Comparisons between theA. atlantica × A. hirtula RFLPmap and a map based on the cross of the hexaploidAvenacultivars ‘Kanota’ and ‘Ogle’ revealed that there werenumerous hexaploidAvenachromosomes that contain seg-ments homoeologous to different diploidAvena chromo-somes. This result provides further evidence for considerablestructural rearrangement between the chromosomes ofhexaploidAvenaand its diploid relatives (O’Donoughue etal. 1995).
Populations of recombinant inbred lines (RILs) offer sev-eral advantages over F2-derived mapping populations. Allgenotypes within a line are nearly genetically identical, al-lowing replication of the line for phenotypic evaluation andfor distribution to a user community. New DNA markers canbe mapped relative to the existing map, because the RILsrepresent a permanent population. Also, the additionalmeioses associated with the generations of self-fertilizationduring RIL development provide additional opportunity forrecombination between tightly linked genes. As an example,a single locus,Pca, conferring resistance to at least eightisolates ofPuccinia coronataCorda var.avenaeW.P. Fraserand Ledingham, the causal agent of crown rust disease inAvena, was identified and mapped in theA. strigosa ×A. wiestii F2:3 population (Rayapati et al. 1994a, 1994b).Evaluation of the F6-derived RILs for resistance toP. coronataidentified a cluster of five tightly linked loci con-ferring resistance to specific isolates ofP. coronata(Wise etal. 1996).
The objectives of this experiment were to develop aframework RFLP linkage map of a diploid oat RIL popula-tion and to map candidate genes for resistance to crown rustin the population. The framework map will be useful forotherAvenaresearchers, because the population on which itis based is a permanent population of nearly homozygouslines. To permit comparisons with genetic maps of othergrass species, we primarily used “grass anchor” clones thathave already been mapped in other species as probes (VanDeynze et al. 1998). Mapping of known genes and RFLPprobes that have been mapped in other species will allowcomparative mapping between the diploidAvena As ge-nome, the hexaploidAvenagenomes, and the genomes ofother grass species. Furthermore, thePca cluster of crownrust resistance genes in this population may serve as a modelfor the genomic organization of crown rust resistance genesin the cultivated hexaploidAvena. A high-resolution geneticmap of thePca region will be helpful to understanding therelationships between crown rust resistance genes in diploidand hexaploidAvena. Wise et al. (1996) reported that theclosest DNA marker loci linked to thePca region were anRFLP locus 24 cM proximal toPca and a randomly ampli-fied polymorphic DNA (RAPD) locus 11 cM distal to the re-gion. Therefore, we mapped clones of candidate genesknown or presumed to confer resistance to rust or other dis-eases in other grass species in hope of identifying homolo-gous loci within or near thePca gene cluster.
Materials and methods
Mapping populationA population of 100 F6:8 progeny was produced by single seed
descent from a cross betweenAvena strigosa(CI 3815) andAvenawiestii (CI 1994). The recombinant inbred lines used herein are adifferent sample of progeny from the same population used to pro-duce an earlier map for diploidAvena(Rayapati et al. 1994a). CI3815 is resistant to at least 40 isolates of crown rust (Pucciniacoronata) and CI 1994 is susceptible to these same isolates (Wiseand Gobelman-Werner 1993). Three F1 seeds from a single paniclewere used to produce the F2 generation. The recombinant inbredlines (RILs) were developed by successive generations ofself-pollination of individual plants descended from 100 F2 plantsthrough the F6 generation. The panicles were bagged to preventcross-pollination.
DNA preparationGenomic DNA was isolated from lyophilized leaf and stem tis-
sue harvested from plants before flowering using a modified CTAB(cetyltrimethylammonium bromide) extraction (Saghai-Maroof etal. 1984). A minimum of five plants per line was sampled, and thetissue was bulked before grinding. DNA quantification, digestion,fragment separation, Southern blotting, and probe preparation andhybridization were described by Veldboom et al. (1994). Southernblots used to screen the parents for polymorphism were made withnuclear DNA (10µg/lane) from the two parental lines digestedwith each of six different restriction endonucleases,BamHI, DraI,EcoRI, EcoRV, HindIII, and SstI. Southern blots used to collectsegregation data from the mapping population were constructedwith the genomic DNA (10µg/lane) from the two parental lines,and each of the 100 RILs from the mapping population was di-gested with a single restriction enzyme.
© 2001 NRC Canada
Kremer et al. 193
I:\gen\gen44\gen-02\G00-115.vpTuesday, March 06, 2001 1:36:21 PM
Color profile: Generic CMYK printer profileComposite Default screen
RFLP probesIn order to make comparisons between the linkage map of dip-
loid oat and the linkage maps of other grass species, we primarilyused cDNA clones that were previously mapped in other species. Aset of cDNA “grass anchor” clones (Van Deynze et al. 1998) wasprovided by Susan McCouch of Cornell University. The grass an-chor clone set contained cDNA clones fromAvena, barley(Hordeum vulgareL.), and rice (Oryza sativaL.), and one wheat(Triticum aestivumL.) genomic clone (Table 1). In addition, wescreened five BCD and six CDO clones that O’Donoughue et al.(1992) mapped in theA. atlantica × A. hirtula population. MikeGale of the John Innes Center provided a set of 73 wheat genomicand cDNA clones (described by Sharp et al. 1989). Eighty-nine oatcDNA clones (OISU0003, OISU0441–OISU2285) and 52 maize(Zea maysL.) cDNA clones (ISU032A–ISU151) from Iowa StateUniversity that were described by Rayapati et al. (1994a) andPereira et al. (1994), respectively, were also used. TheAvenaDNAclones with “ISU” designations in Rayapati et al. (1994a) are re-ferred to here as “OISU” clones to distinguish them from themaize “ISU” clones. OneAvena genomic clone (UMN145) thatO’Donoughue et al. (1995) mapped in hexaploidAvenawas pro-vided by Ron Phillips of the University of Minnesota. An addi-tional Avena genomic clone (OG176) was provided by MarkSorrells of Cornell University and was described by Rayapati et al.(1994a).
Four maize genomic clones (PIC), possibly derived from diseaseresistance genes, were provided by Scot Hulbert of Kansas StateUniversity (Collins et al. 1998). PIC13 and PIC20 are clones from,or closely linked to, therp3 andrp1 common rust (Puccinia sorghiSchwein.) resistance loci. The PIC21 clone is also linked to therp3locus. A locus detected by PIC19 is located nearrhm1 and wsm1loci, which confer resistance to northern corn leaf blight(Exserohilum turcicum(Pass.) K.J. Leonard & E.G. Suggs) andwheat streak mosaic virus, respectively. Two wheat genomicclones, possibly derived from disease resistance genes, were pro-vided by Catherine Feuillet from the University of Zurich. ThepLRK10A clone is a putative leaf rust (Puccinia reconditaRobergeex Desmaz) resistance gene clone (Feuillet et al. 1997) and thePLW25 clone is a polymerase chain reaction (PCR) product ob-tained from conserved regions of the nucleotide binding site of agene with a nucleotide binding site and a leucine-rich repeat motifsequence (C. Feuillet, personal communication). Five genomic
clones of disease resistance gene analogs from rice (rRGH8),maize (mr505), and sorghum (Sorghum bicolor (L.) Moench.;sRGH8, sRGH25, sRGH32) were provided by Jeff Bennetzen ofPurdue University. The RFLP clones used herein are low-copy se-quences that generally produced one to three intense bands on theautoradiograms. The autoradiograms of the Southern hybridiza-tions with probes derived from the putative disease resistancegenes generally exhibited one to two intense bands and five ormore faint bands. The intense bands identified the polymorphismused in linkage analysis.
Sequence-tagged-site markerA PCR primer pair was designed to amplify the second intron of
a 12S globulin seed storage protein, GenBank accession X17637(Schubert et al. 1990). The primer sequences are TGTTACC-AGCCAACAAGAACTC and TTCGACGTAAACAACAACGC.PCR amplification, fragment separation, and scoring methods fol-lowed Senior et al. (1996).
Data analysisAutoradiograms from the mapping population were scored twice
and independently verified for parental allele patterns. Phenotypicscores of resistance or susceptibility to five isolatesPucciniacoronataand genotypic data from a RAPD marker locus (ISUC18)reported by Wise et al. (1996) were used to map crown rust resis-tance loci and the RAPD locus on our map.
Chi-square tests were performed to determine if loci segregatedin the expected F6 ratio of 48.4375 : 3.125 : 48.4375. RFLP locithat did not segregate as expected for a single locus atp < 0.01were eliminated from the data set because they may lead tofalse-positive linkage (Lorieux et al. 1995). RFLP loci that did notsegregate as expected for a single locus at 0.01 <p < 0.05 wereadded to the map only after the initial linkage group assignmentshad been made.
MAPMAKER/EXP version 3.0b (Lander et al. 1987) was used forlinkage analysis. Loci linked with a minimum LOD of 3.0 and amaximum distance of 40 centimorgans (cM, Haldane) were placedinto linkage groups using the two-point “group” command.Multipoint analysis was then performed to determine linear ar-rangements by using the “order” command with a LOD of 3.0 anda maximum distance of 40 cM. The LOD was then lowered to 2.0
© 2001 NRC Canada
194 Genome Vol. 44, 2001
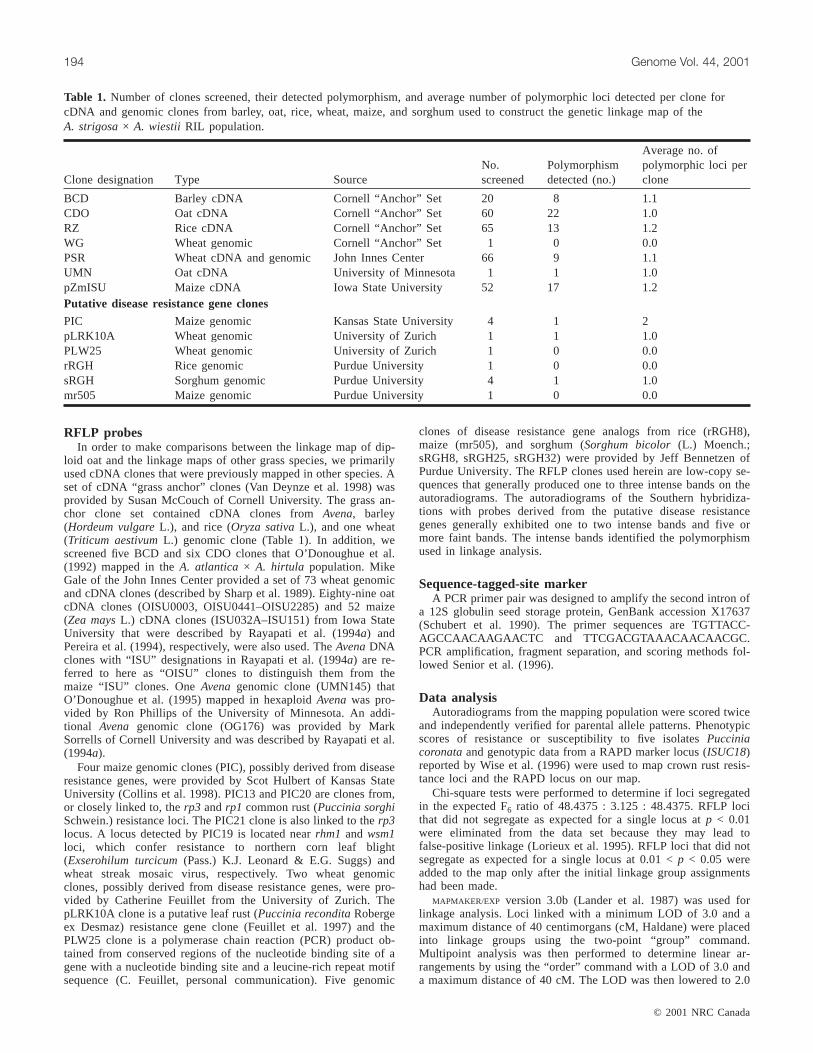
Clone designation Type SourceNo.screened
Polymorphismdetected (no.)
Average no. ofpolymorphic loci perclone
BCD Barley cDNA Cornell “Anchor” Set 20 8 1.1CDO Oat cDNA Cornell “Anchor” Set 60 22 1.0RZ Rice cDNA Cornell “Anchor” Set 65 13 1.2WG Wheat genomic Cornell “Anchor” Set 1 0 0.0PSR Wheat cDNA and genomic John Innes Center 66 9 1.1UMN Oat cDNA University of Minnesota 1 1 1.0pZmISU Maize cDNA Iowa State University 52 17 1.2Putative disease resistance gene clones
PIC Maize genomic Kansas State University 4 1 2pLRK10A Wheat genomic University of Zurich 1 1 1.0PLW25 Wheat genomic University of Zurich 1 0 0.0rRGH Rice genomic Purdue University 1 0 0.0sRGH Sorghum genomic Purdue University 4 1 1.0mr505 Maize genomic Purdue University 1 0 0.0
Table 1. Number of clones screened, their detected polymorphism, and average number of polymorphic loci detected per clone forcDNA and genomic clones from barley, oat, rice, wheat, maize, and sorghum used to construct the genetic linkage map of theA. strigosa× A. wiestii RIL population.
I:\gen\gen44\gen-02\G00-115.vpTuesday, March 06, 2001 1:36:22 PM
Color profile: Generic CMYK printer profileComposite Default screen
© 2001 NRC Canada
Kremer et al. 195
to place additional markers once a linear order was established.The “ripple” command was used to verify the linear arrangement.The “compare” command was required to generate a linear orderfor smaller linkage groups containing eight or fewer loci. Two loci(OISU1410, OISU1464) were discarded because of presumablyspurious linkage to more than one linkage group. Loci that did notsegregate as expected for a single locus at 0.01 <p < 0.05 wereadded using the “assign” (LOD 3.0, max. distance 40 cM), “place,”and “together” commands after the linkage groups were framed.Map distances in centimorgans were calculated using the Kosambifunction (Kosambi 1944) to simplify comparisons to other grassgenetic maps, which were constructed with the Kosambi function(Van Deynze et al. 1995).
The multipoint analysis of the “order” command separated onelinkage group into two. The four possible combinations of terminalloci from each new linkage group were tested for linkage by at-tempting to force an order and using the “map” command. The twolinkage groups could not be joined without creating a gap of morethan 50 cM. Therefore we considered these to be separate linkagegroups. We attempted to link smaller linkage groups together bytesting their terminal loci for linkage based onχ2 tests. Where suchlinkage was found atp < 0.01, the linkage groups were combinedand remapped.
Comparative mappingWe compared theA. strigosa× A. wiestiiRIL map (i.e.,AswRI)
to the A. atlantica × A. hirtula (Aah) map (O’Donoughue et al.1992; Van Deynze et al. 1995) and to theA. byzantinacv. Kanota ×A. sativacv. Ogle map (O’Donoughue et al. 1995). For comparisonwith a specific map, we first defined a skeletalAswRI map contain-ing only loci identified by markers shared with the map to whichcomparisons were being made. Next, we identified intervals de-fined by adjacent loci on the skeletal map. If the loci defining theinterval were also located on the same linkage group of the othermap, the interval was considered to be conserved between the twomaps. Otherwise, the interval was considered to be rearranged be-tween the two maps. The number of conserved intervals was di-vided by the total number of intervals to obtain the percentage ofconserved intervals. This method provides a liberal assessment oflinkage conservation between maps, because intervals were consid-ered conserved when the flanking loci were on the same linkagegroup in both maps, irrespective of locus order.
Results and discussion
The DNA clones and sequences identified 203 loci; 177 of
which were assigned to nine linkage groups of theAswRIlinkage map. Twenty of 203 loci were not included in themap because they did not segregate in expected ratios (atp <0.01). Ten loci exhibited excess of the CI 3815 homozygousclass and 10 exhibited excess of the CI 1994 homozygousclass. One locus (OISU1364) had an excessive number ofheterozygotes, and also an excessive number of homozy-gotes from one parental class. Most clones detected a singlepolymorphic locus, although 14 clones (PIC20, ISU107,ISU136, OISU1389, OISU1537, OISU1635, OISU1798,OISU1913,OISU2191, RZ421, CDO520, CDO1502, BCD348,and PSR920) detected two loci, and two clones (OISU1703,and RZ390) detected three polymorphic loci (Table 1).
The average percentage of detected polymorphism variedamong the groups of clones, from 13.6% for the PSR wheatcDNA clones to 40% for the BCD barley cDNA clones (Ta-ble 1). The wheat clones (WG and PSR) had the lowest de-tected polymorphism percentage (Table 1). The lowpolymorphism detected by the PSR clones was due in part tothe negligible hybridization signal given by numerousclones. The PSR clones had only been used to map in closerelatives of wheat (Sharp et al. 1989) and were not selectedbased on ability to hybridize across distantly related grassspecies, as was the Cornell grass anchor clone set (VanDeynze et al. 1995). Twenty percent of the rice (RZ) clonesdetected polymorphism (Table 1). This low frequency maybe attributed to rice probes often not hybridizing toAvenaDNA because of the distant evolutionary relationship be-tween oat and rice. The pZmISU clones (ISU032A–ISU151)from maize cDNAs were used to map RFLP loci in maizeand sorghum (Pereira et al. 1994) and 33% of these clonesdetected polymorphism in thisAvenapopulation (Table 1).The oat cDNA (CDO) clones and the barley cDNA (BCD)clones from the Cornell grass anchor set detected a polymor-phism percentage rate of 37% and 40%, respectively (Ta-ble 1). The barley cDNA (BCD) andAvenacDNA (CDO)clones used by Rayapati et al. (1994a) to create the F2-gen-eration map (i.e.,AswF2) of this oat population exhibitedhigher percentages of polymorphism using only two restric-tion enzymes compared with the BCD and CDO clones in-cluded in the Cornell grass anchor clone set. Rayapati et al.(1994a) selected their BCD and CDO clones based on poly-
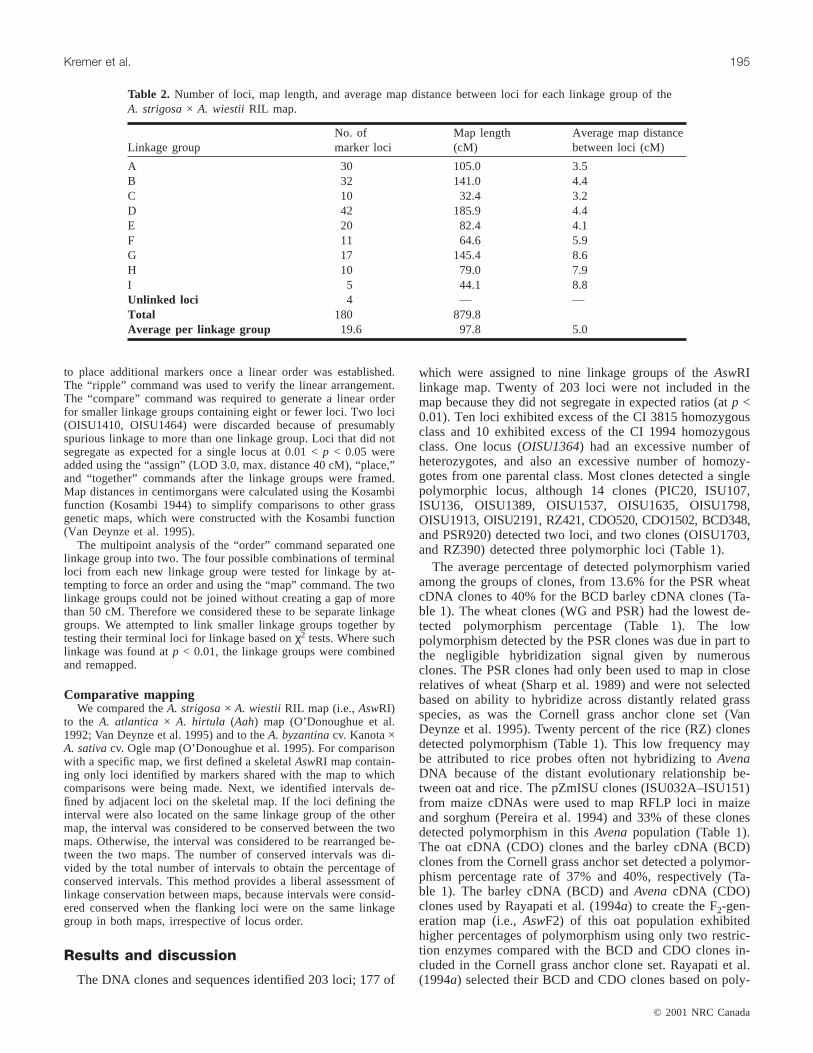
Linkage groupNo. ofmarker loci
Map length(cM)
Average map distancebetween loci (cM)
A 30 105.0 3.5B 32 141.0 4.4C 10 32.4 3.2D 42 185.9 4.4E 20 82.4 4.1F 11 64.6 5.9G 17 145.4 8.6H 10 79.0 7.9I 5 44.1 8.8Unlinked loci 4 — —Total 180 879.8Average per linkage group 19.6 97.8 5.0
Table 2. Number of loci, map length, and average map distance between loci for each linkage group of theA. strigosa× A. wiestii RIL map.
I:\gen\gen44\gen-02\G00-115.vpTuesday, March 06, 2001 1:36:22 PM
Color profile: Generic CMYK printer profileComposite Default screen
morphism detected in theA. atlantica × A. hirtula popula-tion (O’Donoughue et al. 1992). A single clone from each ofthe maize, wheat, and sorghum putative disease resistancegene clone sets detected polymorphism in this population(Table 1). One of these three clones (PIC20) identified twoloci, providing a total of four putative disease resistancegene homologues that were mapped herein.
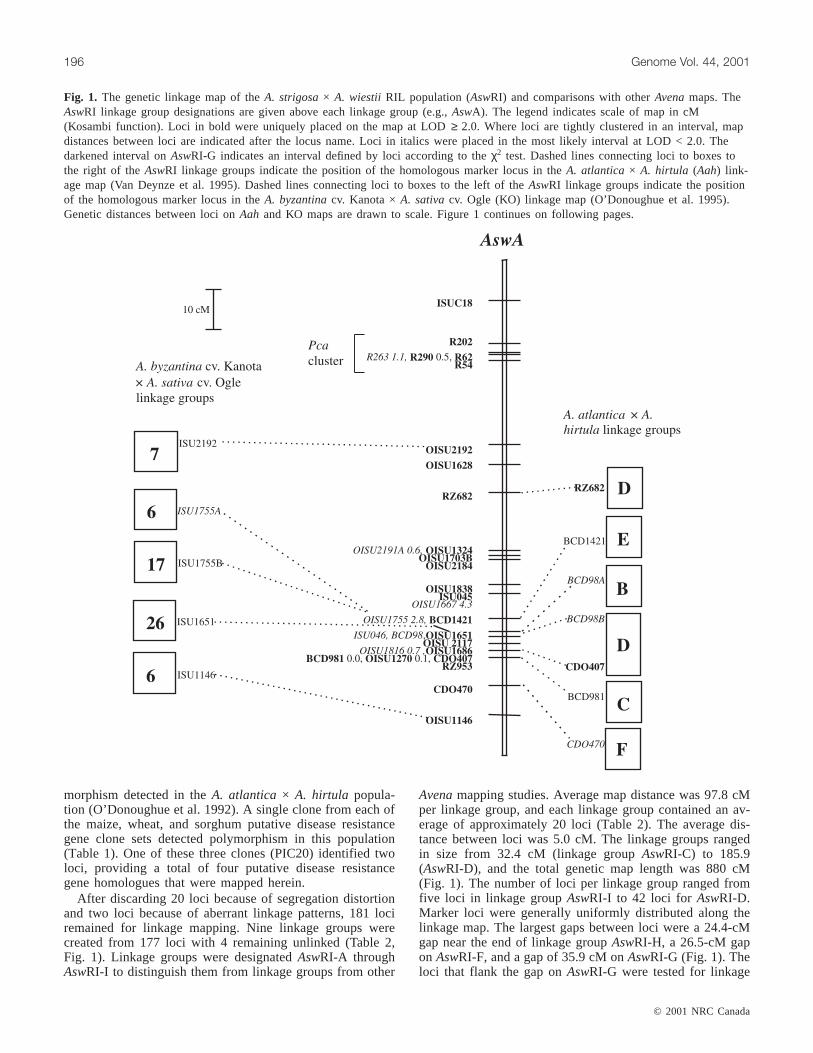
After discarding 20 loci because of segregation distortionand two loci because of aberrant linkage patterns, 181 lociremained for linkage mapping. Nine linkage groups werecreated from 177 loci with 4 remaining unlinked (Table 2,Fig. 1). Linkage groups were designatedAswRI-A throughAswRI-I to distinguish them from linkage groups from other
Avenamapping studies. Average map distance was 97.8 cMper linkage group, and each linkage group contained an av-erage of approximately 20 loci (Table 2). The average dis-tance between loci was 5.0 cM. The linkage groups rangedin size from 32.4 cM (linkage groupAswRI-C) to 185.9(AswRI-D), and the total genetic map length was 880 cM(Fig. 1). The number of loci per linkage group ranged fromfive loci in linkage groupAswRI-I to 42 loci for AswRI-D.Marker loci were generally uniformly distributed along thelinkage map. The largest gaps between loci were a 24.4-cMgap near the end of linkage groupAswRI-H, a 26.5-cM gapon AswRI-F, and a gap of 35.9 cM onAswRI-G (Fig. 1). Theloci that flank the gap onAswRI-G were tested for linkage
© 2001 NRC Canada
196 Genome Vol. 44, 2001
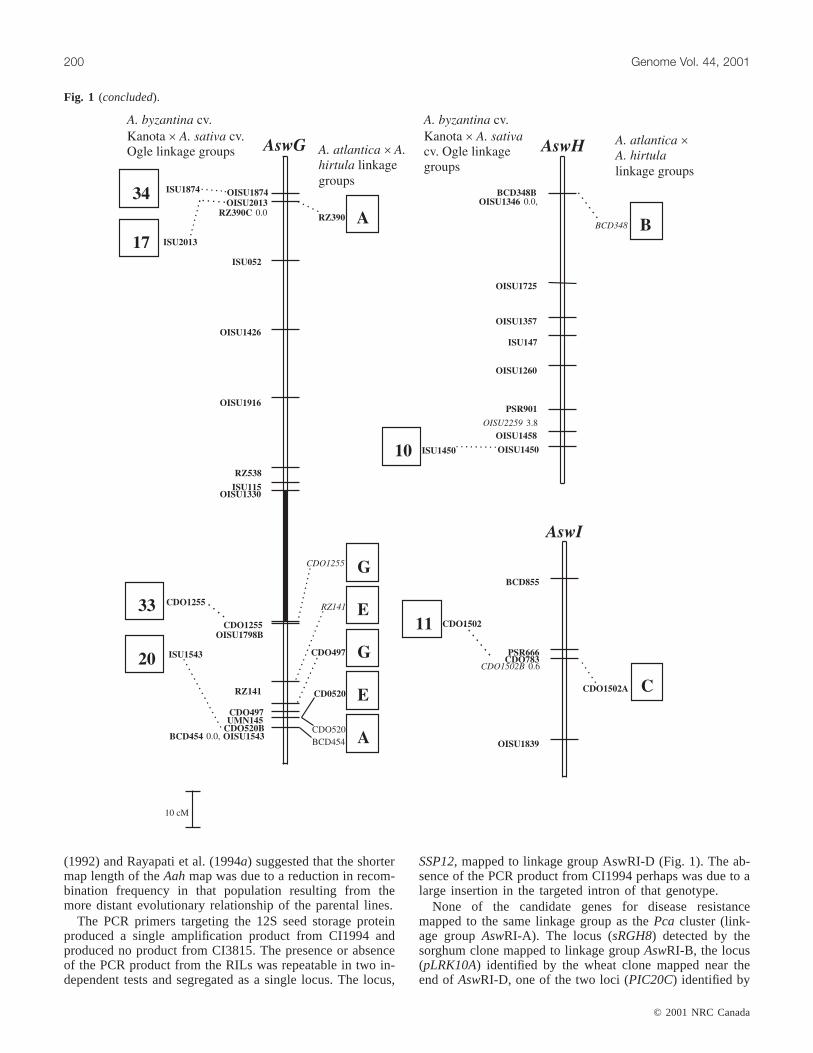
Fig. 1. The genetic linkage map of theA. strigosa× A. wiestii RIL population (AswRI) and comparisons with otherAvenamaps. TheAswRI linkage group designations are given above each linkage group (e.g.,AswA). The legend indicates scale of map in cM(Kosambi function). Loci in bold were uniquely placed on the map at LOD≥ 2.0. Where loci are tightly clustered in an interval, mapdistances between loci are indicated after the locus name. Loci in italics were placed in the most likely interval at LOD < 2.0. Thedarkened interval onAswRI-G indicates an interval defined by loci according to theχ2 test. Dashed lines connecting loci to boxes tothe right of theAswRI linkage groups indicate the position of the homologous marker locus in theA. atlantica× A. hirtula (Aah) link-age map (Van Deynze et al. 1995). Dashed lines connecting loci to boxes to the left of theAswRI linkage groups indicate the positionof the homologous marker locus in theA. byzantinacv. Kanota ×A. sativacv. Ogle (KO) linkage map (O’Donoughue et al. 1995).Genetic distances between loci onAah and KO maps are drawn to scale. Figure 1 continues on following pages.
I:\gen\gen44\gen-02\G00-115.vpTuesday, March 06, 2001 1:36:22 PM
Color profile: Generic CMYK printer profileComposite Default screen
using aχ2, test and the null hypothesis of no linkage was re-jected withp < 0.05.
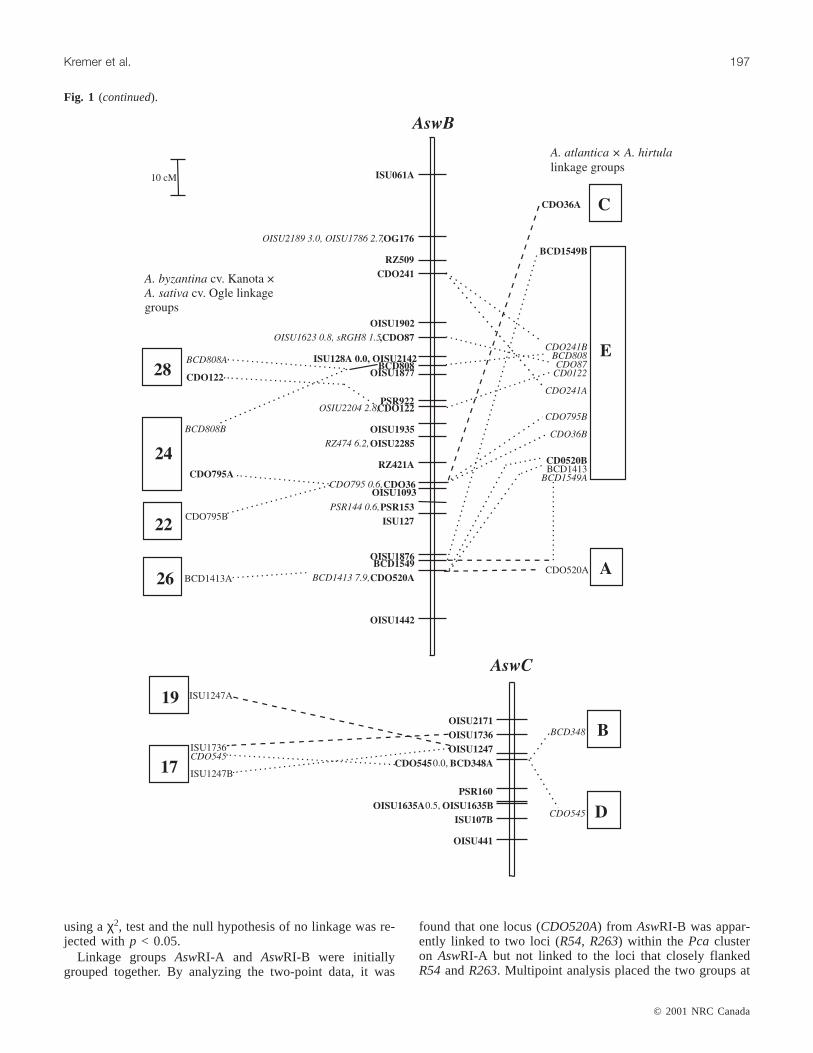
Linkage groupsAswRI-A and AswRI-B were initiallygrouped together. By analyzing the two-point data, it was
found that one locus (CDO520A) from AswRI-B was appar-ently linked to two loci (R54, R263) within the Pca clusteron AswRI-A but not linked to the loci that closely flankedR54andR263. Multipoint analysis placed the two groups at
© 2001 NRC Canada
Kremer et al. 197
Fig. 1 (continued).
I:\gen\gen44\gen-02\G00-115.vpTuesday, March 06, 2001 1:36:22 PM
Color profile: Generic CMYK printer profileComposite Default screen
a distance greater than 50 cM, and there was no evidence forlinkage of the loci flanking this gap between the two groups.Therefore they were established as separate linkage groups.
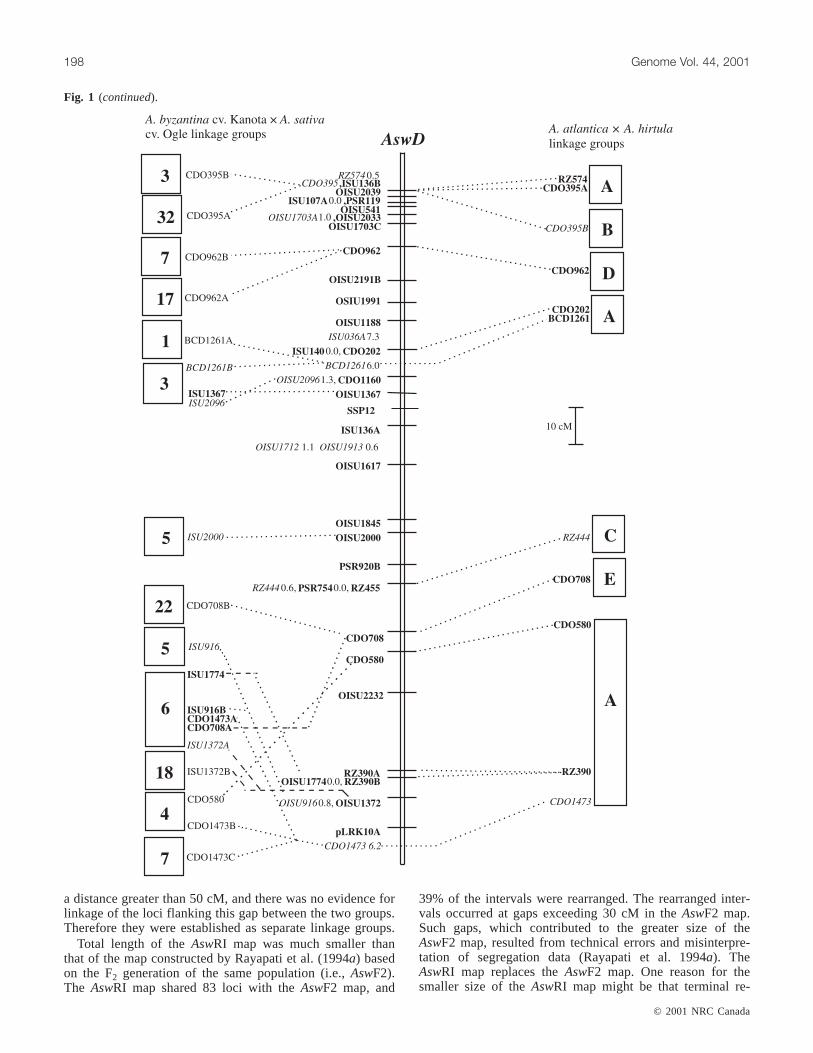
Total length of theAswRI map was much smaller thanthat of the map constructed by Rayapati et al. (1994a) basedon the F2 generation of the same population (i.e.,AswF2).The AswRI map shared 83 loci with theAswF2 map, and
39% of the intervals were rearranged. The rearranged inter-vals occurred at gaps exceeding 30 cM in theAswF2 map.Such gaps, which contributed to the greater size of theAswF2 map, resulted from technical errors and misinterpre-tation of segregation data (Rayapati et al. 1994a). TheAswRI map replaces theAswF2 map. One reason for thesmaller size of theAswRI map might be that terminal re-
© 2001 NRC Canada
198 Genome Vol. 44, 2001
Fig. 1 (continued).
I:\gen\gen44\gen-02\G00-115.vpTuesday, March 06, 2001 1:36:23 PM
Color profile: Generic CMYK printer profileComposite Default screen
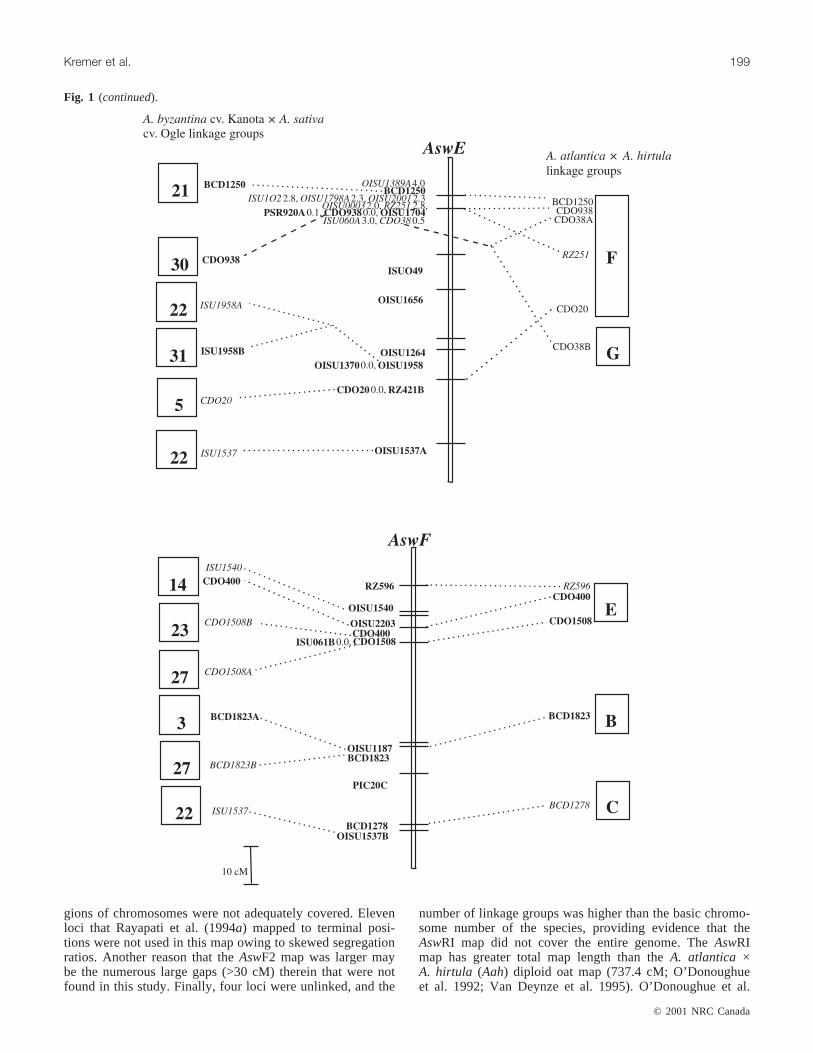
gions of chromosomes were not adequately covered. Elevenloci that Rayapati et al. (1994a) mapped to terminal posi-tions were not used in this map owing to skewed segregationratios. Another reason that theAswF2 map was larger maybe the numerous large gaps (>30 cM) therein that were notfound in this study. Finally, four loci were unlinked, and the
number of linkage groups was higher than the basic chromo-some number of the species, providing evidence that theAswRI map did not cover the entire genome. TheAswRImap has greater total map length than theA. atlantica ×A. hirtula (Aah) diploid oat map (737.4 cM; O’Donoughueet al. 1992; Van Deynze et al. 1995). O’Donoughue et al.
© 2001 NRC Canada
Kremer et al. 199
Fig. 1 (continued).
I:\gen\gen44\gen-02\G00-115.vpTuesday, March 06, 2001 1:36:23 PM
Color profile: Generic CMYK printer profileComposite Default screen
(1992) and Rayapati et al. (1994a) suggested that the shortermap length of theAahmap was due to a reduction in recom-bination frequency in that population resulting from themore distant evolutionary relationship of the parental lines.
The PCR primers targeting the 12S seed storage proteinproduced a single amplification product from CI1994 andproduced no product from CI3815. The presence or absenceof the PCR product from the RILs was repeatable in two in-dependent tests and segregated as a single locus. The locus,
SSP12, mapped to linkage group AswRI-D (Fig. 1). The ab-sence of the PCR product from CI1994 perhaps was due to alarge insertion in the targeted intron of that genotype.
None of the candidate genes for disease resistancemapped to the same linkage group as thePca cluster (link-age groupAswRI-A). The locus (sRGH8) detected by thesorghum clone mapped to linkage groupAswRI-B, the locus(pLRK10A) identified by the wheat clone mapped near theend ofAswRI-D, one of the two loci (PIC20C) identified by
© 2001 NRC Canada
200 Genome Vol. 44, 2001
Fig. 1 (concluded).
I:\gen\gen44\gen-02\G00-115.vpTuesday, March 06, 2001 1:36:23 PM
Color profile: Generic CMYK printer profileComposite Default screen
the maize clone mapped near the end of linkage groupAswRI-F, and thePIC20B locus remained unlinked. It ispossible that these clones of putative resistance genes de-tected loci near genes that confer resistance to rust but arenot segregating or have not been identified in the population.Wise et al. (1996) suggested that at least one locus unlinkedto Pcawas involved in resistance to crown rust in this popu-lation.
RFLP known to be linked to genes for resistance to crownrust in hexaploidAvenaalso did not map to the same linkagegroup asPca. UMN145, which was linked to crown rust re-sistance genePc91 in hexaploidAvena(Rooney et al. 1994),mapped toAswRI-G, while CDO783and CDO1502, whichwere tightly linked to thePc71 gene in hexaploidAvena(Bush and Wise 1998), mapped toAswRI-I. The sRGH8probe identified a locus onAswRI-B, 28 cM from OG176,which Rooney et al. (1994) reported to be loosely linked (14cM) to the A. strigosaderived crown rust resistance gene,Pc92, in hexaploidAvena. The pLRK10A locus mapped toAswRI-D, 13 cM from OISU1774, which was tightly linkedto a gene conferring toPuccinia coronataisolate Pc203 inhexaploidAvena(Bush et al. 1994). ThePIC20C locus waslinked (13.3 cM) on theAswRI map toBCD1278, which wasclosely linked to a leaf rust resistance gene in wheat(Autrique et al. 1994).
Twelve loci (the Pca cluster, OISU2192, OISU2191A,OISU2117, BCD98, OISU1146, CDO1473, OISU916,OISU1774, OISU2232, CDO580, and CDO708) on theAswRI map were also mapped by Yu et al. (1996) in a popu-lation of F8:9 RILs descended from the F6:8 RILs used in thisstudy. The linear order of the loci in that map is identical tothat shown here, except that Yu et al. (1996) placed all 12loci on a single linkage group, whereas the lociPca throughOISU1146mapped toAswRI-A, while CDO1473 throughCDO708mapped toAswRI-D (Fig. 1).OISU1146is a termi-nal locus onAswRI-A, andCDO1473is a terminal locus onAswRI-D; so, it is possible that they are linked, but therewas no substantial evidence for their linkage (a LOD supportof only 0.9 and two-point map distance of 39 cM). Yu et al.(1996) also observed that the evidence for linkage ofOISU1146andCDO1473was weak (LOD 0.6 and map dis-tance of 35 cM) but assigned the loci to the same linkage
group with a large gap in order to remain consistent with theresults of Rayapati et al. (1994a). We suggest that the twoloci should be considered unlinked until stronger evidencefor linkage is found.
The AswRI map and theA. atlantica × A. hirtula (Aah)map shared 46 markers, and 56% of the marker intervalswere conserved between the maps (Fig. 1). TheAswRI link-age groups shared from 1 (AswRI-H and AswRI-I) to 10(AswRI-B and AswRI-D) markers with theAah map. Thecolinear regions tended to have similar locus orders and ge-netic distances in both maps. Colinear segments tended toconsist of only 2 or 3 markers, but a few larger segmentswere observed. One segment of five RFLP loci from linkagegroupAswRI-E was colinear with linkage groupAahF. Fourof the five loci (BCD1250, CDO938, CDO38, and RZ251)were clustered within a 5-cM interval, and the fifth locus(CDO20) was located 45 cM distally on theAswRI map.Three of the corresponding loci on theAah map clusteredtightly, while the fourth locus (RZ251) andCDO20mapped10 cM and 30 cM from the cluster, respectively. The largestcolinear segment contained nine loci fromAswRI-B that alsomapped toAahE. The linear order was maintained except forrearrangements of tightly linked loci. Seven clones (CDO36,CDO38, CDO241, CDO395, CDO795, BCD98, BCD1549)each identified a single locus on theAsw map but they de-tected multiple loci on theAah map. Therefore, some dupli-cated regions of theAah map were not detected in theAswRI map. AswRI-G had adjacent loci which mapped tolinkage groupsAahG and AahE. AswRI-D had three seg-ments that were colinear withAahA, but were separated byshared markers that mapped to other linkage groups on theAah map. There were no groups of loci that were linked onthe Aah map that mapped to linkage groupsAswRI-C,AswRI-H, or AswRI-I.
The AswRI and hexaploidAvenamaps shared 39 markers,and 39% of marker intervals were conserved between thetwo maps (Fig. 1). The number of shared loci with thehexaploid map ranged from 12 loci for linkage groupAswRI-D to 1 locus forAswRI-H andAswRI-I. Most of thecolinear segments involved only 2 or 3 loci in sequence. Thelargest colinear segment was 5 loci that spanned a 55-cMportion of AswRI-D and mapped to a 20-cM segment of
© 2001 NRC Canada
Kremer et al. 201
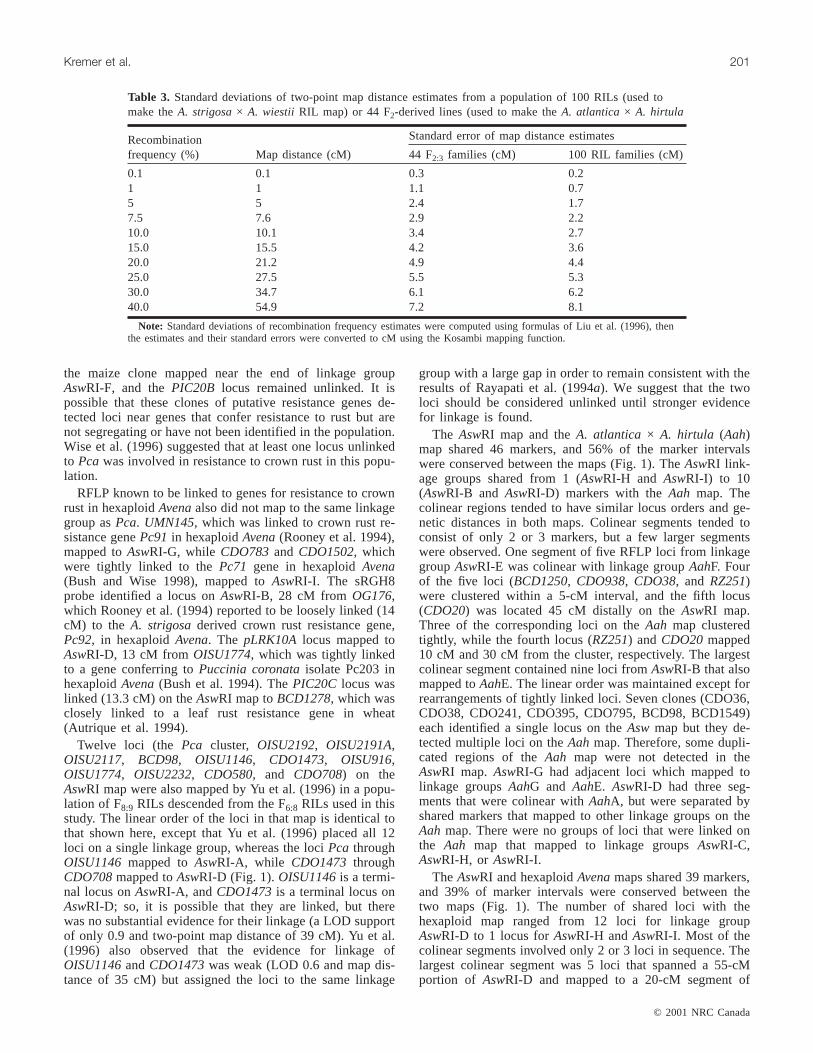
Recombinationfrequency (%) Map distance (cM)
Standard error of map distance estimates
44 F2:3 families (cM) 100 RIL families (cM)
0.1 0.1 0.3 0.21 1 1.1 0.75 5 2.4 1.77.5 7.6 2.9 2.210.0 10.1 3.4 2.715.0 15.5 4.2 3.620.0 21.2 4.9 4.425.0 27.5 5.5 5.330.0 34.7 6.1 6.240.0 54.9 7.2 8.1
Note: Standard deviations of recombination frequency estimates were computed using formulas of Liu et al. (1996), thenthe estimates and their standard errors were converted to cM using the Kosambi mapping function.
Table 3. Standard deviations of two-point map distance estimates from a population of 100 RILs (used tomake theA. strigosa× A. wiestii RIL map) or 44 F2-derived lines (used to make theA. atlantica× A. hirtula
I:\gen\gen44\gen-02\G00-115.vpTuesday, March 06, 2001 1:36:24 PM
Color profile: Generic CMYK printer profileComposite Default screen
linkage group 6 in hexaploidAvena. CDO708 andOISU1372defined the ends of the 55-cM segment in theAswRI map, but were tightly linked in the hexaploidAvenamap, indicating that finer-scale genomic rearrangementslikely exist even in regions that are relatively well con-served. Pairs of loci onAswRI linkage groups A, E, and Fmapped to hexaploidAvenalinkage groups 6, 22, and 27, re-spectively, but these pairs were each separated by 1 or 2 locithat mapped to other hexaploidAvena linkage groups, dis-rupting the linear order. These could be the result of inser-tion events or more simply, the result of not identifying theappropriate duplicate locus in the hexaploid population ow-ing to lack of polymorphism. No groups of loci that werelinked on the hexaploid map detected homoeologous loci onAswRI linkage groups A, E, G, H, or I. The amount of ge-netic rearrangement between hexaploidAvena and diploidrelatives observed in this study was similar to that reportedby O’Donoughue et al. (1995).
We found that genomic organization of RFLP loci wasconsiderably rearranged between closely related diploidAvenaspecies and between diploid and cultivated hexaploidAvena, and that clones of putative genes for disease resis-tance did not detect loci near known resistance genes in thispopulation. Leister et al. (1998) reported that disease resis-tance gene homologues of rice and barley identified usingdegenerate PCR primers designed to amplify homologues ofdisease resistance genes of dicots did not exhibit conservedlinkage relationships between the two species, despite previ-ous reports that the rice and barley genomes are highlycolinear (Saghai-Maroof et al. 1995). Leister et al. (1998)suggested that disease resistance genes evolve rapidly andtheir chromosomal positions are rearranged more frequentlythan other genes. If this is true, then one might expect thatheterologous clones such as those used herein (e.g., sRGH8,pLRK10A, PIC20C) will frequently map to locations un-linked to disease resistance genes identified by phenotype, aswe observed.
The high degree of genomic rearrangement between dip-loid and hexaploidAvenais not surprising, either, in light ofthe classical and molecular cytogenetic work that has shownthat the chromosomes ofAvenahave been more highly rear-ranged than those ofTriticum. Segmental homoeology,rather than whole-chromosomal homoeology, is likely therule rather than the expectation inAvena (Kianian et al.1997; Leggett and Thomas 1995; McMullen et al. 1982;Rajhathy and Thomas 1974). Lack of extensive homologybetween chromosomes of differentAvenaspecies contributesto the difficulty that has been encountered in transferringcrown rust resistance genes fromA. strigosa to A. sativa(Thomas 1992).
The most surprising result of this study is that morecolinearity between theA. strigosa × A. wiestii andA. atlantica × A. hirtula linkage maps was not found. Allfour species involved in these mapping populations areinterfertile and are considered to be members of the samegenomic subgroup (As) and the same biological species(Leggett and Thomas 1995). The population size of theAswRI map was more than twice as large as that of theAahmap. Therefore, precision of linkage distance estimates isexpected to be higher for theAswRI map for recombinationfrequencies of less than 30% (Table 3) and we expect that
theAswRI map is robust. It is possible that duplication in theAs diploid Avenagenome is sufficiently common to compli-cate assignment of homology between different species ofthe As genome group. Our results and those ofO’Donoughue et al. (1992) indicate that the diploidAvenaspecies studied exhibit only a low frequency (9% and 7%,respectively) of polymorphic duplicated RFLP loci. This islikely an underestimate of the true level of genetic duplica-tion, however, because clones identifying single loci on themaps may identify duplicated loci that were not polymor-phic in the populations tested. It is also possible thatgenomic rearrangements have occurred on a scale that is de-tectable by RFLP linkage maps, but does not completelyprevent pairing of partially homologous chromosomes orsubstantially reduce hybrid fertility. Leggett (1987) notedthat small cryptic chromosomal differences occur betweenAvena species, and these are not large enough to preventregular chromosome pairing at meiosis, although they mayreduce fertility of interspecific hybrids. Leggett (1987) alsoobserved that hybrids betweenA. atlantica and A. strigosahad reduced fertility, and some hybrids exhibited quadriva-lent pairing at meiosis, indicating that at least one largechromosomal interchange exists between the species.Finally, it is well known that structural rearrangements existamong cultivars of the domesticated hexaploidAvenawith-out noticeably reducing fertility of the hybrids between suchcultivars (Chen and Armstrong 1994; Jellen et al. 1993,1994; O’Donoughue et al. 1995; Singh and Kolb 1991; Zhouet al. 1999). Therefore, it is possible that diploidAvenaspe-cies that are related based on gross chromosomal morphol-ogy and interspecific fertility may yet possess quite differentchromosomal arrangements, although diploids do not havethe potential for chromosomal buffering provided byhomoeologous chromosomes in polyploids (Leggett 1988).The results of this study provide some exceptions to the re-ports of colinearity among some grass species (Bennetzenand Freeling 1993; Gale and Devos 1998; Moore et al. 1995;Saghai-Maroof et al. 1995). Rather, they support the conten-tion that colinearity among species must be assessed on acase-by-case basis (Tanksley et al. 1988).
Acknowledgements
We thank Jeff Bennetzen, Catherine Feuillet, Mike Gale,Scot Hulbert, Susan McCouch, Ron Phillips, and MarkSorrells for providing DNA clones used in this study. SaraHelland and Natalya Sharopova developed primers for andcollected mapping data for theSSP12 locus. Mary JaneLong and Wendy Woodman-Clikeman assisted with prepara-tion of the DNA clones and with technical aspects of theSouthern hybridizations. This is journal paper J-18665 of theIowa Agriculture and Home Economics Experiment Station,Ames, Iowa, projects 3368 and 3134, supported by HatchAct and State of Iowa. This research was supported byUnited States Department of Agriculture National ResearchInitiative (USDA–NRI) competitive grant 9701723.
References
Autrique, E., Singh, R.P., Tanksley, S.D., and Sorrells, M.E. 1994.Molecular markers for four leaf rust resistance genesintrogressed into wheat from wild relatives. Genome,38: 75–83.
© 2001 NRC Canada
202 Genome Vol. 44, 2001
I:\gen\gen44\gen-02\G00-115.vpTuesday, March 06, 2001 1:36:24 PM
Color profile: Generic CMYK printer profileComposite Default screen
Bennetzen, J.L., and Freeling, M. 1993. Grasses as a single geneticsystem: Genome composition, collinearity and compatibility.Trends Genet.9: 259–261.
Bush, A.L., and Wise, R.P. 1998. High-resolution mapping adja-cent to the Pc71 crown-rust resistance locus in hexaploid oat.Mol. Breed.4: 13–21.
Bush, A.L., Wise, R.P., Rayapati, P.J., and Lee, M. 1994. Restric-tion fragment length polymorphisms linked to genes for resis-tance to crown rust (Puccinia coronata) in near-isogenic lines ofhexaploid oat (Avena sativa). Genome,37: 823–831.
Chen, Q., and Armstrong, K. 1994. Genomic in situ hybridizationin Avena sativa. Genome,37: 607–612.
Collins, N.C., Webb, C.A., Seah, S., Ellis, J.G., Hulbert, S.H., andPryor, A. 1998. The isolation and mapping of disease resistancegene analogs in maize. Mol. Plant-Microbe Interact.11: 968–978.
Feuillet, C., Schachermayr, G., and Keller, B. 1997. Molecularcloning of a new receptor-like kinase gene encoded at theLr10disease resistance locus of wheat. Plant J.11: 45–52.
Gale, M.D., and Devos, M. 1998. Plant comparative genetics after10 years. Science (Washington, D.C.),282: 656–659.
Jellen, E.N., Phillips, R.L., and Rines, H.W. 1993. C-bandedkaryotypes and polymorphisms in hexaploid oat accessions(Avenaspp.) using Wright’s stain. Genome,36: 1129–1137.
Jellen, E.N., Gill, B.S., and Cox, T.S. 1994. Genomic in situ hy-bridization differentiates between A/D- and C-genomechromatin and detects intergenomic translocations in polyploidoat species (genusAvena). Genome,37: 613–618.
Kianian, S.F., Wu, B.-C., Fox, S.L., Rines, H.W., and Phillips, R.L.1997. Aneuploid marker assignment in hexaploid oat with the Cgenome as a reference for determining remnant homoeology.Genome,40: 386–396.
Kosambi, D.D. 1944. The estimation of map distances from recom-bination values. Ann. Eugen.12: 172–175.
Lander, E.S., Green, P., Abrahamson, J., Barlow, A., Daly, M.J.,Lincoln, S.E., and Newburg, L. 1987.MAPMAKER: An interactivecomputer package for constructing primary genetic linkagemaps of experimental and natural populations. Genomics,1:174–181.
Leggett, J.M. 1987. Interspecific hybrids involving the recentlydescribed diploid taxonAvena atlantica. Genome,29: 361–364.
Leggett, J.M. 1988. Interspecific diploid hybrids inAvena.Genome,32: 346–348.
Leggett, J.M., and Thomas, H., 1995. Oat evolution andcytogenetics.In The Oat Crop: Production and Utilization.Edited by R.W. Welch. Chapman and Hall, London, U.K.pp. 120–149.
Leister, D., Kurth, J., Laurie, D.A., Yano, M., Sasaki, T., Devos,K., Graner, A., and Schulze-Lefert, P. 1998. Rapid reorganiza-tion of resistance gene homologoues in cereal genomes. Proc.Natl. Acad. Sci. U.S.A.95: 370–375.
Liu, S.-C., Kowalski, S.P., Lan, T.-H., Feldmann, K.H., andPaterson, A.H. 1996. Genome-wide high-resolution mapping byrecurrent intermating usingArabidopsis thalianaas a model.Genetics,142: 247–258.
Lorieux, M., Goffinet, B., Perrier, X., Gonzalez de Leon, D., andLanaud, C. 1995. Maximum-likelihood models for mapping ge-netic markers showing segregation distortion. 1. Backcross pop-ulation. Theor. Appl. Genet.90: 73–80.
McMullen, M.S., Phillips, R.L., and Stuthman, D.D. 1982. Meioticirregularities inAvena sativaL./A. sterilisL. hybrids and breed-ing implications. Crop Sci.22: 890–897.
Moore, G., Devos, K.M., Wang, Z., and Gale, M.D. 1995. Grasses,line up and form a circle. Curr. Biol.5: 737–739.
O’Donoughue, L.S., Wang, Z., Roder, M., Kneen, B., Leggett, M.,Sorrells, M.E., and Tanksley, S.D. 1992. An RFLP-based link-age map of oats based on a cross between two diploid taxa(Avena atlantica× A. hirtula). Genome,35: 765–771.
O’Donoughue, L.S., Kianian, S.F., Rayapati, P.J., Penner, G.A.,Sorrells, M.E., Tanksley, S.D., Phillips, R.L., Rines, H.W., Lee,M., Fedak, G., Molnar, S.J., Hoffman, D., Salas, C.A., Wu, B.,Autrique, E., and van Deynze, A. 1995. A molecular linkagemap of cultivated oat. Genome,38: 368–380.
Pereira, M.G., Lee, M., Bramel-Cox, P., Woodman, W., Doebley,J., and Whitkus, R. 1994. Construction of an RFLP map in sor-ghum and comparative mapping in maize. Genome,37:236–243.
Rajhathy, T., and Thomas, H. 1974. Cytogenetics of oats(AvenaL.). Miscellaneous publication of The Genetics Societyof Canada, No. 2. The Genetics Society of Canada, Ottawa.
Rayapati, P.J., Gregory, J.W., Lee, M., and Wise, R.P. 1994a. Alinkage map of diploidAvenabased on RFLP loci and a locusconferring resistance to nine isolates ofPuccinia coronatavar.‘avenae’. Theor. Appl. Genet.89: 831–837.
Rayapati, P.J., Portyanko, V.A., and Lee, M. 1994b. Placement ofloci for avenins and resistance toPuccinia coronatato a com-mon linkage group inAvena strigosa. Genome,37: 900–903.
Rooney, W.L., Rines, H.W., and Phillips, R.L. 1994. Identificationof RFLP markers linked to crown rust resistance genesPc 91and Pc 92 in oat. Crop Sci.34: 940–944.
Saghai-Maroof, M.A., Soliman, K.M., Jorgensen, R.A., and Allard,R.W. 1984. Ribosomal DNA spacer-length polymorphisms inbarley: Mendelian inheritance, chromosomal location, and popu-lation dynamics. Proc. Natl. Acad. Sci. U.S.A.81: 8014–8018.
Saghai-Maroof, M.A., Yang, G.P., Biyashev, R.M., Maughan, P.J.,and Zhang, Q. 1995. Analysis of the barley and rice genomes bycomparative RFLP linkage mapping. Theor. Appl. Genet.92:541–551.
Schubert, R., Baumlein, H., Czihal, A., and Wobus, U. 1990.Genomic sequence of a 12S seed storage protein from oat(Avena sativaL. cv. ‘Solidor’). Nucleic Acids Res.18: 377.
Senior, M.L., Chin, E.C.L., Lee, M., Smith, J.S.C., and Stuber,C.W. 1996. Simple sequence repeat markers developed frommaize sequences found in the GENBANK database: Map con-struction. Crop Sci.36: 1676–1683.
Sharp, P.J., Chao, S., Desai, S., and Gale, M.D. 1989. The isola-tion, characterization and application in the Triticeae of a set ofwheat RFLP probes identifying each homoeologous chromo-some arm. Theor. Appl. Genet.78: 342–348.
Singh, R.J., and Kolb, F.L. 1991. Chromosomal interchanges in sixhexaploid oat genotypes. Crop Sci.31: 726–729.
Tanksley, S.D., Bernatzky, R., Lapitan, N., and Prince, J.P. 1988.Conservation of gene repertoire but not gene order in pepperand tomato. Proc. Natl. Acad. Sci. U.S.A.85: 6419–6423.
Thomas, H. 1992. Cytogenetics ofAvena. In Oat Science andTechnology. ASA Monograph 33.Edited byH.G. Marshall andM.E. Sorrells. American Society of Agronomy, Madison, Wis.pp. 473–507.
Van Deynze, A.E., Nelson, J.C., O’Donoughue, L.S., Ahn, S.N.,Siripoonwiwat, W., Harrington, S.E., Yglesias, E.S., Braga, D.P.,McCouch, S.R., and Sorrells, M.E. 1995. Comparative mappingin grasses. Oat relationships. Mol. Gen. Genet.249: 349–356.
Van Deynze, A.E., Sorrells, M.E., Park, W.D., Ayres, N.M., Fu, H.,Cartinhour, S.W., Paul, E., and McCouch, S.R. 1998. Anchorprobes for comparative mapping of grass genera. Theor. Appl.Genet.97: 356–369.
Veldboom, L.R., Lee, M., and Woodman, W.L. 1994. Molecularmarker facilitated studies of morphological traits in maize. I.
© 2001 NRC Canada
Kremer et al. 203
I:\gen\gen44\gen-02\G00-115.vpTuesday, March 06, 2001 1:36:24 PM
Color profile: Generic CMYK printer profileComposite Default screen
© 2001 NRC Canada
204 Genome Vol. 44, 2001
Linkage analysis and determination of QTL for morphologicaltraits. Theor. Appl. Genet.88: 7–16.
Wise, R.P., and Gobelman-Werner, K.S. 1993. Resistance to oatcrown rust in diploid and hexaploidAvena. Plant Dis. 77:355–358.
Wise, R.P., Lee, M., and Rayapati, P.J. 1996. Recombinationwithin a 5-centimorgan region in diploidAvenareveals multi-ple specificities conferring resistance toPuccinia coronata.Phytopathology,86: 340–346.
Yu, G.X., Bush, A.L., and Wise, R.P. 1996. Comparative mappingof homoeologous group 1 regions and genes for resistance toobligate biotrophs inAvena, Hordeum, andZea mays. Genome,39: 155–164.
Zhou, X., Jellen, E.N., and Murphy, J.P. 1999. Progenitor germ-plasm of domesticated hexaploid oat. Crop Sci.39: 1208–1214.
I:\gen\gen44\gen-02\G00-115.vpTuesday, March 06, 2001 1:36:24 PM
Color profile: Generic CMYK printer profileComposite Default screen