a review of applications of satellite sar, optical
TRANSCRIPT
Hydrol. Earth Syst. Sci., 19, 3755–3769, 2015
www.hydrol-earth-syst-sci.net/19/3755/2015/
doi:10.5194/hess-19-3755-2015
© Author(s) 2015. CC Attribution 3.0 License.
A review of applications of satellite SAR, optical,
altimetry and DEM data for surface water modelling,
mapping and parameter estimation
Z. N. Musa1, I. Popescu1, and A. Mynett1,2
1UNESCO-IHE Institute for Water Education, Delft, the Netherlands2Department of Civil Engineering, Technical University Delft, Delft, the Netherlands
Correspondence to: Z. N. Musa ([email protected])
Received: 22 April 2015 – Published in Hydrol. Earth Syst. Sci. Discuss.: 8 May 2015
Revised: 24 July 2015 – Accepted: 21 August 2015 – Published: 1 September 2015
Abstract. Hydrological data collection requires deploy-
ment of physical infrastructure like rain gauges, water level
gauges, as well as use of expensive equipment like echo
sounders. Many countries around the world have recorded a
decrease in deployment of physical infrastructure for hydro-
logical measurements; developing countries especially have
less of this infrastructure and, where it exists, it is poorly
maintained. Satellite remote sensing can bridge this gap, and
has been applied by hydrologists over the years, with the ear-
liest applications in water body and flood mapping. With the
availability of more optical satellites with relatively low tem-
poral resolutions globally, satellite data are commonly used
for mapping of water bodies, testing of inundation models,
precipitation monitoring, and mapping of flood extent. Use
of satellite data to estimate hydrological parameters contin-
ues to increase due to use of better sensors, improvement in
knowledge of and utilization of satellite data, and expansion
of research topics. A review of applications of satellite re-
mote sensing in surface water modelling, mapping and pa-
rameter estimation is presented, and its limitations for sur-
face water applications are also discussed.
1 Introduction
Hydrological data collection still remains a difficult task
nowadays due to non-availability of measurement devices,
inaccessibility of the terrain and limitations of space/time
(Quin et al., 2010; Pereira-Cardenal et al., 2011). A good
alternative to overcome these difficulties is use of satel-
lite remote sensing, which can give a synoptic view of tar-
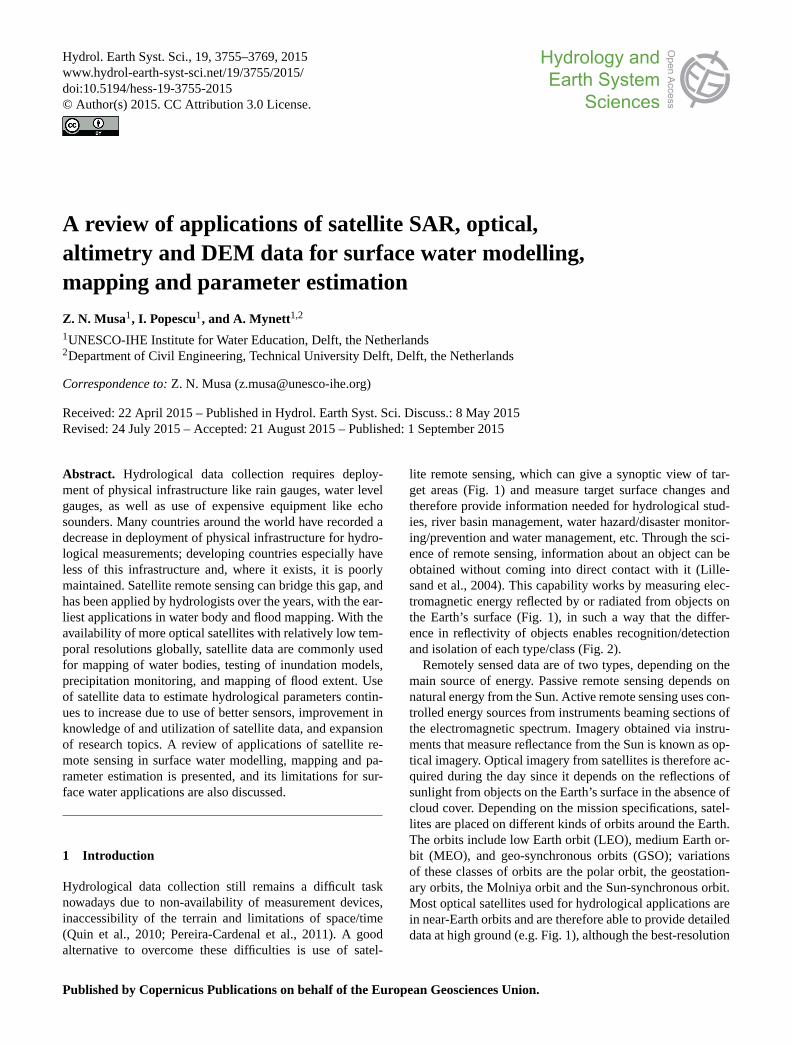
get areas (Fig. 1) and measure target surface changes and
therefore provide information needed for hydrological stud-
ies, river basin management, water hazard/disaster monitor-
ing/prevention and water management, etc. Through the sci-
ence of remote sensing, information about an object can be
obtained without coming into direct contact with it (Lille-
sand et al., 2004). This capability works by measuring elec-
tromagnetic energy reflected by or radiated from objects on
the Earth’s surface (Fig. 1), in such a way that the differ-
ence in reflectivity of objects enables recognition/detection
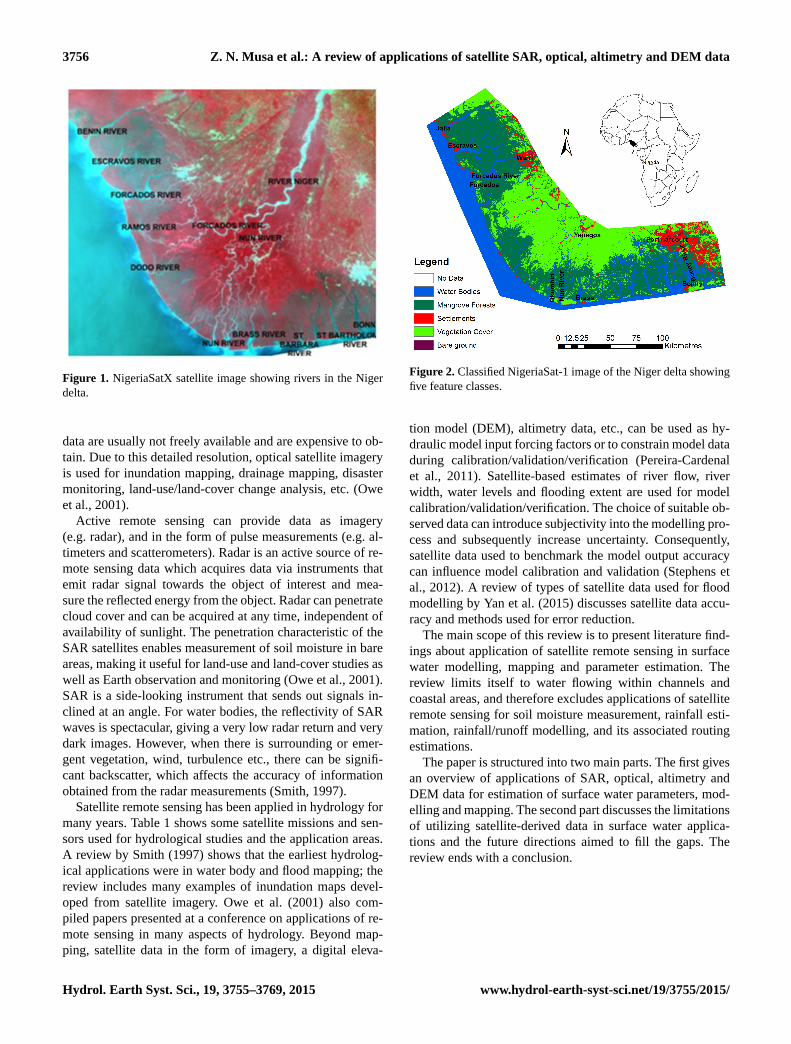
and isolation of each type/class (Fig. 2).
Remotely sensed data are of two types, depending on the
main source of energy. Passive remote sensing depends on
natural energy from the Sun. Active remote sensing uses con-
trolled energy sources from instruments beaming sections of
the electromagnetic spectrum. Imagery obtained via instru-
ments that measure reflectance from the Sun is known as op-
tical imagery. Optical imagery from satellites is therefore ac-
quired during the day since it depends on the reflections of
sunlight from objects on the Earth’s surface in the absence of
cloud cover. Depending on the mission specifications, satel-
lites are placed on different kinds of orbits around the Earth.
The orbits include low Earth orbit (LEO), medium Earth or-
bit (MEO), and geo-synchronous orbits (GSO); variations
of these classes of orbits are the polar orbit, the geostation-
ary orbits, the Molniya orbit and the Sun-synchronous orbit.
Most optical satellites used for hydrological applications are
in near-Earth orbits and are therefore able to provide detailed
data at high ground (e.g. Fig. 1), although the best-resolution
Published by Copernicus Publications on behalf of the European Geosciences Union.
3756 Z. N. Musa et al.: A review of applications of satellite SAR, optical, altimetry and DEM data
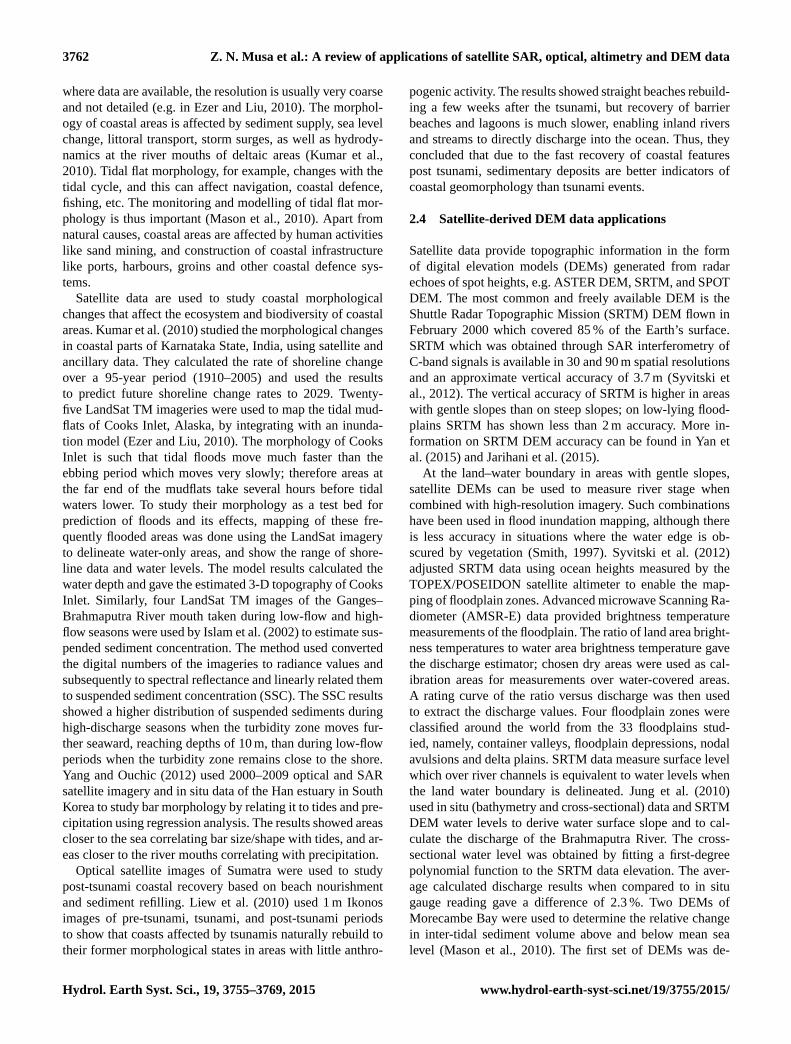
Figure 1. NigeriaSatX satellite image showing rivers in the Niger
delta.
data are usually not freely available and are expensive to ob-
tain. Due to this detailed resolution, optical satellite imagery
is used for inundation mapping, drainage mapping, disaster
monitoring, land-use/land-cover change analysis, etc. (Owe
et al., 2001).
Active remote sensing can provide data as imagery
(e.g. radar), and in the form of pulse measurements (e.g. al-
timeters and scatterometers). Radar is an active source of re-
mote sensing data which acquires data via instruments that
emit radar signal towards the object of interest and mea-
sure the reflected energy from the object. Radar can penetrate
cloud cover and can be acquired at any time, independent of
availability of sunlight. The penetration characteristic of the
SAR satellites enables measurement of soil moisture in bare
areas, making it useful for land-use and land-cover studies as
well as Earth observation and monitoring (Owe et al., 2001).
SAR is a side-looking instrument that sends out signals in-
clined at an angle. For water bodies, the reflectivity of SAR
waves is spectacular, giving a very low radar return and very
dark images. However, when there is surrounding or emer-
gent vegetation, wind, turbulence etc., there can be signifi-
cant backscatter, which affects the accuracy of information
obtained from the radar measurements (Smith, 1997).
Satellite remote sensing has been applied in hydrology for
many years. Table 1 shows some satellite missions and sen-
sors used for hydrological studies and the application areas.
A review by Smith (1997) shows that the earliest hydrolog-
ical applications were in water body and flood mapping; the
review includes many examples of inundation maps devel-
oped from satellite imagery. Owe et al. (2001) also com-
piled papers presented at a conference on applications of re-
mote sensing in many aspects of hydrology. Beyond map-
ping, satellite data in the form of imagery, a digital eleva-
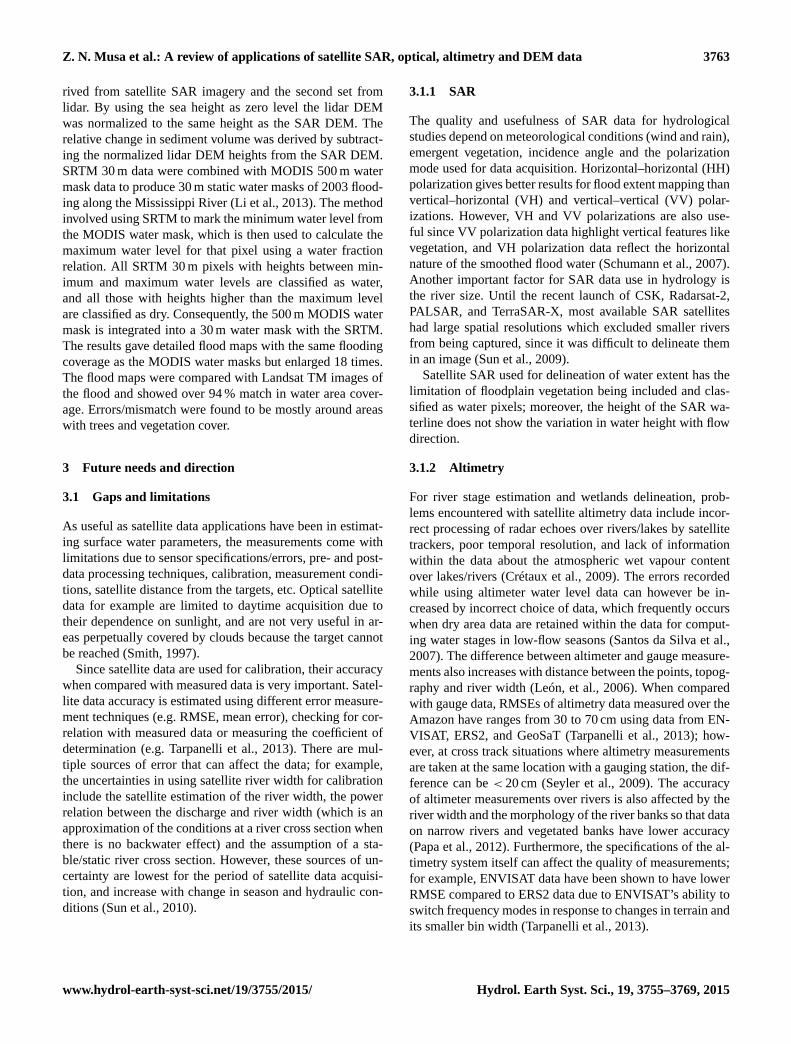
Figure 2. Classified NigeriaSat-1 image of the Niger delta showing
five feature classes.
tion model (DEM), altimetry data, etc., can be used as hy-
draulic model input forcing factors or to constrain model data
during calibration/validation/verification (Pereira-Cardenal
et al., 2011). Satellite-based estimates of river flow, river
width, water levels and flooding extent are used for model
calibration/validation/verification. The choice of suitable ob-
served data can introduce subjectivity into the modelling pro-
cess and subsequently increase uncertainty. Consequently,
satellite data used to benchmark the model output accuracy
can influence model calibration and validation (Stephens et
al., 2012). A review of types of satellite data used for flood
modelling by Yan et al. (2015) discusses satellite data accu-
racy and methods used for error reduction.
The main scope of this review is to present literature find-
ings about application of satellite remote sensing in surface
water modelling, mapping and parameter estimation. The
review limits itself to water flowing within channels and
coastal areas, and therefore excludes applications of satellite
remote sensing for soil moisture measurement, rainfall esti-
mation, rainfall/runoff modelling, and its associated routing
estimations.
The paper is structured into two main parts. The first gives
an overview of applications of SAR, optical, altimetry and
DEM data for estimation of surface water parameters, mod-
elling and mapping. The second part discusses the limitations
of utilizing satellite-derived data in surface water applica-
tions and the future directions aimed to fill the gaps. The
review ends with a conclusion.
Hydrol. Earth Syst. Sci., 19, 3755–3769, 2015 www.hydrol-earth-syst-sci.net/19/3755/2015/

Z. N. Musa et al.: A review of applications of satellite SAR, optical, altimetry and DEM data 3757
Table 1. Some satellite missions and sensors used for hydrological studies.
Mission Sensor(s) Application (hydrological)
Aqua AIRS, AMSR-E, AMSU-A, Surface temperatures of land
CERES, HiRDLS, HSB, MODIS and ocean (flood mapping)
CryoSat DORIS-NG, laser reflectors Ice thickness (applied also
(ESA), SIRAL for near-shore mapping and
inland water monitoring)
Envisat AATSR, ASAR, ASAR Physical oceanography, ice
(image mode), ASAR and snow (ocean/river water
(wave mode), DORIS-NG, level altimetry)
MERIS, MIPAS
ERS1 AMI/SAR/image, Earth resources, physical
AMI/SAR/wave, oceanography (altimetry)
ERS2 AMI/scatterometer, ATSR Earth resources, physical
AMI/SAR/image,AMI/SAR/wave, oceanography (altimetry)
AMI/scatterometer, ATSR/M
Jason1 DORIS-NG, JMR, LRA, Physical oceanography (ocean/
POSEIDON-2 (SSALT-2), TRSR river water level altimetry)
Jason2 AMR, DORIS-NG, GPSP, JMR, Physical oceanography
LRA, POSEIDON-3 (altimetry)
Radarsat 1/2 C-band SAR, X-band SAR Flood mapping/modelling
Sentinel 1 C-band SAR Flood mapping/modelling
SRTM C-band SAR, X-band SAR Digital elevation models,
flood modelling
SPOT 4 DORIS (SPOT), Digital terrain models,
HRVIR, VEGETATION environmental monitoring
SPOT 5 DORIS-NG (SPOT), HRG, Digital terrain models,
HRS, VEGETATION environmental monitoring
Terra MODIS, MOPITT, MISR, Physical processes, surface
ASTER, CERES temperatures of land and
ocean (surface water mapping)
Topex/Poseidon DORIS, LRA, POSEIDON-1 Physical oceanography
(SSALT-1), TMR, TOPEX (altimetry)
2 Overview of satellite data applications for surface
water studies
2.1 SAR data applications
SAR data are useful for flood extent measurements even in
cloud-covered areas, and are therefore often used to make
flood maps (e.g. Schumann et al., 2007; Horritt, 2006; Di
Baldassarre et al., 2009; Vermeulen et al., 2005; Mason et
al., 2007; Long et al., 2014). The variation of radar backscat-
ter from different targets enables flood extent mapping. Sev-
eral methods have been used to delineate the flooding ex-
tent from SAR data; e.g. utilization of multi-polarized ad-
vanced SAR images, application of a statistical active control
model, multi-temporal image enhancement and differencing,
histogram thresholding/clustering, radiometric thresholding,
pixel-based segmentation, and use of artificial neural net-
works (Long et al., 2014). Multi-temporal image flood map-
ping involves acquiring flooding and non-flood images of the
same area and combing them to get an image which indicates
change by colours appearing in the image. A modification of
the multi-temporal technique introduces an index that shows
the changing areas (Skakun, 2010). Sarhadi et al. (2012) ap-
plied satellite stereoscopic images of Cartosat-1 to delineate
flood hazard maps; the method used rational polynomial co-
efficients to extract a high-resolution digital terrain model
(DTM) and detailed parameterization of the channel in the
Halil Rud basin and Jiroft in south-eastern Iran.
www.hydrol-earth-syst-sci.net/19/3755/2015/ Hydrol. Earth Syst. Sci., 19, 3755–3769, 2015

3758 Z. N. Musa et al.: A review of applications of satellite SAR, optical, altimetry and DEM data
Segmentation threshold algorithms are used to delineate
flood extents after a threshold has been manually chosen.
Flood extent maps were created over 4 years of seasonal
flooding in the Chobe floodplain, Namibia (Long et al.,
2014). Eleven scenes of SAR data were enhanced using
adaptive Gamma filtering (to remove speckles) and differ-
ence images created by subtracting from the reference non-
flood season image. The histograms of the difference images
were then used to create thresholds separating flooded and
non-flooded areas. The threshold for flooded areas was de-
termined by subtracting the standard deviation multiplied by
a coefficient Kf from the mean pixel value. For flooding un-
der vegetated areas, the threshold was determined by adding
the standard deviation multiplied by a coefficient Kfv to the
mean pixel value. The flood maps were then created using
segmentation clustering in ENVI. Segmentation based on
self-organizing Kohonen map (SOM) neural networks was
used by Skakun (2010) to map flooding from five rivers in
China, India, Hungary, Ukraine, Laos and Thailand. Train-
ing and testing of the neural networks were based on ground-
truth data which enabled classification of water and dry land
pixels. SOM produces a low-dimensional representation of
the input space that still preserves the topological properties
of the input space. The method enabled automatic discovery
of statistically salient features of pattern vectors, clustering
and classification of new patterns. The resulting flood maps
show an 85–95 % classification rate compared with indepen-
dent testing data, showing the applicability of the method for
emergency flood mapping.
The interferometric phase difference between two SAR
images is called the interferogram and includes signatures
from topography, noise, displacement, atmospheric effects
and baseline error. The advantage of phase changes in inter-
ferometer SAR (InSAR) data enables detection of changes
in the Earth’s land use and land cover. This characteristic
is very useful for identification of flooded areas over wet-
lands as used by Dellepiane et al. (2004). The method, based
on fuzzy connectivity concepts, automatically selected the
coastline from two InSAR images using the coherence of the
two images.
InSAR has been used to calculate the changes in water lev-
els using satellite altimetry data for calibration (Kim et al.,
2009; Jung et al., 2010). To obtain the displacement phase
used to obtain the change in water height, all other signals
are removed. The interferogram data give the relative wa-
ter level change between two locations. Where there is mea-
sured water level data (within an acceptable radius), the rel-
ative water level change can be converted into the absolute
water level change. Jung el al. (2010) used interferomet-
ric SAR data from JERS-1 to study change in water levels
for the Amazon and Congo rivers. The data were acquired
for the low-flow and high-flow seasons and processed us-
ing the “two pass” method which includes flat Earth phase
removal and interferometric phase removal. Flooded vegeta-
tion, non-flooded areas and open water were differentiated
based on backscatter “noise floor” and “mean interferomet-
ric coherence” of flooded and non-flooded areas. The tem-
poral variation in water level dh/dt was obtained by convert-
ing the phase changes in imagery to water level referenced
to the WGS84 datum using altimeter measurements from
Topex/Poseidon. Using dh/dt to characterize the Amazon
floodplain showed increasing dh/dt from upstream to down-
stream within a complex pattern of interconnected channels
with distinct boundaries and varying dh/dt . The Congo River
characterization of dh/dt showed a uniformity and limited
connectivity between the river and the adjoining wetlands.
Schumann et al. (2007) used Envisat ASAR data to identify
spatial clusters of channel roughness in order to calibrate a
HEC-RAS model of Alzette River flooding. ERS SAR data
of the same event and an aerial photo of an earlier event were
used for validation of the calibrated model and overall model
performance was compared to measured high water marks at
seven points during the flood event. The mean cross-sectional
water levels used for model evaluation were estimated from
the intersection of ASAR flood extent boundaries with a li-
dar DEM. At each cross section, ranges of channel roughness
values are run in a Monte Carlo simulation and the cumula-
tive distribution functions (CDFs) of the values are gener-
ated; these CDFs are compared with a CDF of a uniformly
distributed model (where model functioning is the same over
the entire parameter space). The deviation of the individual
CDFs from the CDF of uniform distribution gives the mea-
sure of the parameter sensitivity, the sum of which shows the
local functioning of the model at that cross section. CDFs
with similar error characteristics are grouped into clusters
using k-mean clustering. The results showed that two clus-
ters of roughness values are enough to measure the parameter
sensitivity.
To utilize SAR data for flood depth estimation, methods
have been developed that derive flood heights from flood ex-
tent data. The methods used combine SAR data with ele-
vation data sources like DEMs, altimetry, and triangular ir-
regular networks (TINs). Mason et al. (2007) and Schumann
et al. (2006) estimated the mean cross-sectional water levels
used for model evaluation from the intersection of SAR flood
extent boundaries with a lidar DEM. Schumann et al. (2006)
used linear regression and an elevation-based model (RE-
FIX) to convert SAR flood extent to heights and derived
the flood water depth. Assuming a horizontal water height
at cross sections, the water levels on the left and right banks
were taken and used to subtract the floodplain DEM values
to get the water height. The flood water line was then ex-
tracted using the regression equation: H = a · d + b, where
a= slope of the regression line, d = downstream water dis-
tance, and b= intercept. Using the cross sections as break
lines and the flood water heights extracted, a TIN of the wa-
ter heights at each cross section was produced. The flood wa-
ter depth was derived by subtracting the DEM at the cross-
sectional interception points from the flood water height TIN.
The result showed an RMSE of 18 cm for a channel with
Hydrol. Earth Syst. Sci., 19, 3755–3769, 2015 www.hydrol-earth-syst-sci.net/19/3755/2015/
Z. N. Musa et al.: A review of applications of satellite SAR, optical, altimetry and DEM data 3759
no hydraulic structures and 31 cm for a channel with many
hydraulic structures and changes in slope. The study recom-
mends that nonlinear regression/piece-wise regression can be
used in the case of sudden changes in slope (due to hydraulic
structures) that cause the channel geometry to change.
Altimetry data from ENVISAT were combined with In-
SAR data from PALSAR and Radarsat-1 to compute absolute
water level changes over the wetlands of Louisiana (Kim et
al., 2009). The two-pass InSAR method was used to check
the two SAR images acquired at different times for phase
differences. The ENVISAT altimetry data were used as the
reference absolute water level change dh0/dt to compute the
all the changes in water level over the domain. The results
obtained for water level changes showed better comparison
with the wetland gauge than with the channel gauge, which
had many levees interrupting the flow. Westahoff et al. (2010)
mapped probabilistic flood extents from SAR data by us-
ing the amount of backscatter and local incidence angles to
create histograms that distinguish between wet and dry ar-
eas. The histograms were used to calculate the probability of
flooding of every pixel.
Satellite data are used to calibrate hydrologic models, es-
pecially in un-gauged catchments (Vermeulen et al., 2005;
Sun et al., 2009). Calibration of flood inundation models can
be done using several model parameters, but the most sen-
sitive parameter that shows a direct relationship with water
stage and therefore flooding extent and timing is the chan-
nel roughness (Schumann et al., 2007). Woldemicheal et
al. (2010) showed that for braided rivers where the hydraulic
radius is obtained from indirect sources like satellite data,
Manning’s roughness coefficients can be used to minimize
computed water level outliers. Roughness coefficient values
to be used for calibration can be determined via flood mod-
elling where the measured data are available.
Satellite-based maps of flood extent have been used to cal-
ibrate flood inundation models either based on single or mul-
tiple flood events (Di Baldassarre et al., 2009). Horritt (2006)
calibrated and validated a model of uncertain flood inun-
dation extent for the Severn River using observed flooded
extent mapped from satellite imagery. Model accuracy was
checked using reliability diagrams, and model precision was
checked using an entropy-like measure which computes the
level of uncertainty in the flood inundation map. The ensem-
ble model outputs were compared with ERS and Radarsat
data for calibration using the measure of fit. The results
showed that the mapped flood extent produced only a mod-
est reduction in the uncertainty of model predictions because
the timing of satellite passes did not coincide with the flood
event. Di Baldassarre et al. (2009) showed that satellite flood
imagery acquired during an event can be reliable for flood
mapping. They used imagery of a single event covered by
two satellite passes captured almost at the same time to de-
velop a method to calibrate flood inundation models based
on “possible” inundation extents from the two imageries.
Hydrodynamic flood model extents were compared with the
satellite flood extent maps in order to calibrate the floodplain
frictional parameters and determine the best satellite resolu-
tion for flood extent mapping. In spite of their different res-
olutions the result showed that both satellite imageries could
be used for model calibration, but different frictional values
have to be used in the model.
For un-gauged basins where hydrological data are inacces-
sible, satellite measurement of river width can be used for hy-
drological model calibration (Schumann et al., 2013; Sun et
al., 2009). River width can be estimated from several sources
of satellite data, making it more readily available than dis-
charge or water level. Sun et al. (2009) used measured river
width from satellite SAR imagery to calibrate HYMOD hy-
drological model. The model calibration based on river width
gave an 88.24 % Nash coefficient, with a larger error during
low-flow than high-flow periods, implying its usefulness for
flood discharge calculations. From the results, braided rivers
showed lower errors for good Q–W relations from satellites.
However, a small error in width measurement can lead to
a large error in discharge estimation as the discharge vari-
ability was much larger than the width variability. Sun et
al. (2010) used the GLUE methodology to reduce this un-
certainty in calibration of river width-to-discharge estimation
with the HYMOD hydrological model. From 50 000 samples
of the parameter sets, 151 (likelihood equals RMSE values)
succeeded as behavioural sets to be used in the model to
simulate the measured satellite river widths. River discharge
simulated with the successful parameters (likelihood equals
Nash–Sutcliffe efficiency) gave good discharge simulation
with a correlation R2= 0.92.
Model use in forecasting is affected by the propagation
of the input uncertainties which make it less accurate. Data
assimilation can be used to reduce the accumulation of er-
rors in hydraulic models. Assimilation combines model pre-
dictions with observations and quantifies the errors between
them in order to determine the optimal model and improve
future forecasts (Mcmillan et al., 2013). Types of assimi-
lation techniques include Kalman filter (and its variations),
particle filter and variational technique. Particle filter assimi-
lation is a Bayesian learning system which accounts for input
data uncertainty propagation by selecting suitable input data
from randomly generated ones without assuming any partic-
ular distribution of their PDF (Noh et al., 2011). The particle
filter technique was used in studies like Matgen et al. (2010)
and Giustarini et al. (2011), where input data are in the form
of ensemble flow outputs of a hydrological model. In Gius-
tarini et al. (2011) to assimilate water levels derived from
two SAR images of flooding in the Alzette River into a hy-
draulic model, 64 upstream flows were generated from an en-
semble hydrologic model and used as the upstream boundary
conditions. The most commonly used data assimilation tech-
nique however is the Kalman filter, which is a state-space
filtering method which assumes a Gaussian distribution of er-
rors. Vermeulen et al. (2005) used SAR-derived flood maps
and time series data to make flood forecasting more accurate
www.hydrol-earth-syst-sci.net/19/3755/2015/ Hydrol. Earth Syst. Sci., 19, 3755–3769, 2015
3760 Z. N. Musa et al.: A review of applications of satellite SAR, optical, altimetry and DEM data
through data assimilation. The assimilation process based
on the Kalman filtering technique used adaptation factors
to multiply the original model output and an adaptation fac-
tor in order to generate a new parameter value. The process
included calculation of water levels/discharge on the Rhine
River by combining hydrologic modelling of the sub-basins
and hydraulic modelling using downstream measured data.
Data assimilation was done using measured water levels to
determine the roughness coefficients which calibrate the cal-
culated water levels. The model output water levels were
compared with water levels derived from flood maps but be-
cause the natural flow of the channel or floodplain has been
modified, good results were only obtained when the geo-
referencing of the map is deliberately shifted or the flood-
ing extent is exaggerated by adding some random noise over
a large area of 7–12 km. Barneveld et al. (2008) applied the
same method and models for flood forecasting on the Rhine
River and produced good results of 10-day forecasts; there-
fore assimilating data for natural catchments results in better
forecast model values. More information on hydrologic data
assimilation techniques can be found in Matgen et al. (2010),
Chen et al. (2013) and García-Pintado et al. (2015).
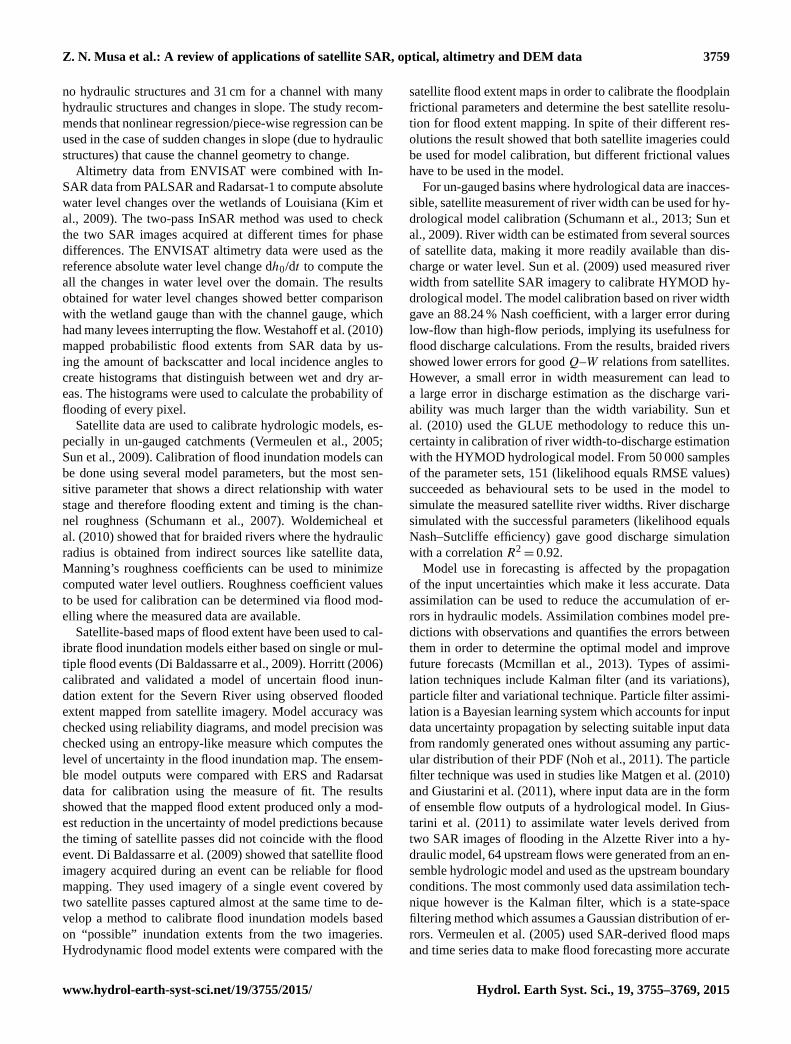
2.2 Satellite altimetry data applications
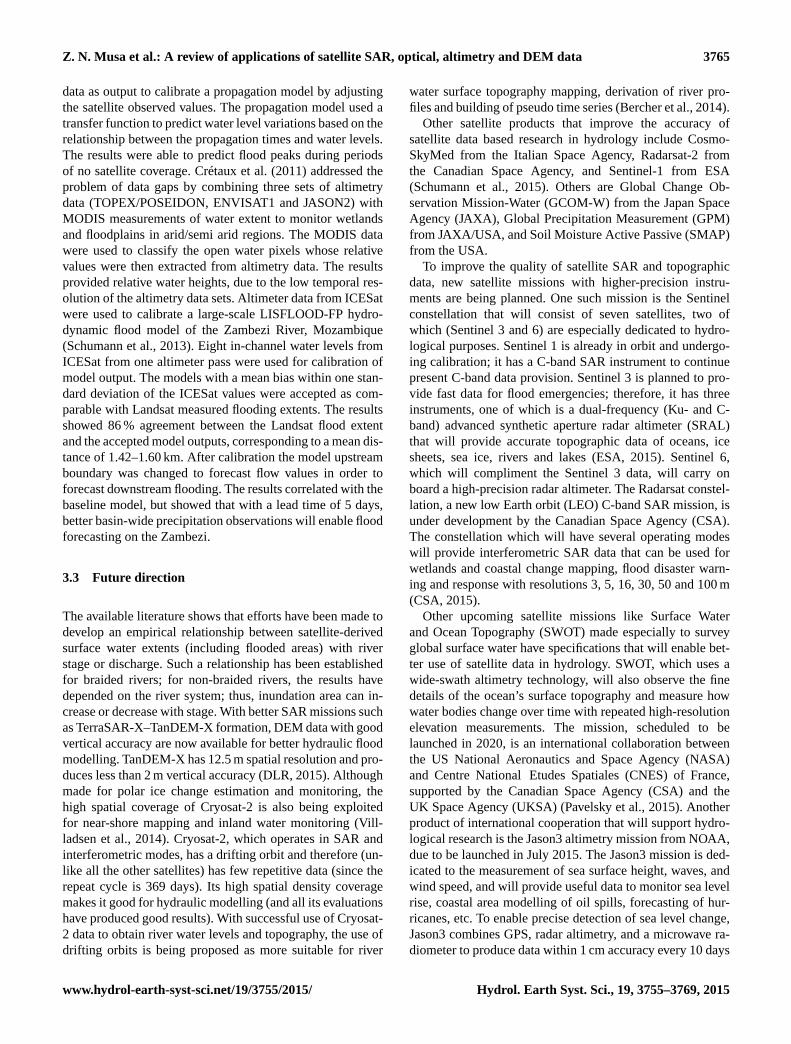
Satellite altimetry (Fig. 3) works on the principle of return
echo of pulses sent from the satellite nadir point and reflected
from the surfaces of open water.
The height of the water surface is extracted from the dis-
tance between the satellite and the water body with reference
to a local datum given as
h= R−
(c1t
2
)−
∑cor, (1)
where h is water level, R is the distance between the satellite
altimeter and the water body, c is the speed of light, 1t /2
is two-way travel time of radar pulse, and∑
cor is the sum
of corrections for ionospheric, wet and dry tropospheric, and
tidal corrections.
This principle (Fig. 3) has its limitations as the accuracy
of the data is affected by atmospheric conditions, sensor and
satellite characteristics, and reflectance conditions (Belaud et
al., 2010).
Although satellite altimetry was developed and optimized
to measure ocean level changes (not rivers), it has been
demonstrated as a source of data over large rivers and lakes
(Tarpanelli et al., 2013; Jarihani et al., 2013). Typical altime-
ter footprints are in kilometres; e.g. ENVISAT ranges from
1.6 to 10.8 km, TOPEX/POSEIDON from 2.0 to 16.4 km.
Thus satellite altimetry data are used as the primary source of
water level data in ungauged basins, and as a secondary data
source to compare with measured data in sparsely gauged
basins.
Oftentimes the selection of altimeter water level data to be
used depends on the time and season of acquisition (Papa
Figure 3. An illustration of height measurement using satellite al-
timetry.
et al., 2012). Data acquired during high flows give better
measurements than low-flow season data which usually have
artefacts (in the form of islets, river banks, vegetation, etc.)
that reduce the accuracy of the data in comparison with lo-
cal gauge data. Analysing data over the Ganga–Brahmaputra
rivers, Papa et al. (2012) got mean errors less than 20 cm
when high-flow altimetry data were compared with measured
data, but low-flow data showed errors larger than 30 cm.
Siddique-E-Akbor et al. (2011) used data from ENVISAT
to compare with 1-D HECRAS model output water levels
in order to check for accuracy and ability to get the sea-
sonal trend. The model was run for periods of available EN-
VISAT data and the output compared with the ENVISAT
time series. The results showed RMSE ranging from 0.70
to 2.4 m, with the best correlation obtained during high-flow
seasons. The study suggests the use of calibrated hydrody-
namic/hydrologic model outputs to benchmark altimetry data
in ungauged and poorly gauged catchments.
Virtual altimeter gauging stations are located at the inter-
section of satellite tracts with water bodies. Santos da Silver
et al. (2007) used virtual altimeter stations as water level data
sources for ungauged catchments. They chose the median
values of virtual stations that fell within river water bodies as
water levels for the river and compared with measured val-
ues from gauging stations located within 20 km of the virtual
stations using weighted linear regression. In order to avoid
comparing two areas with different hydrological conditions,
a ratio χ was computed of the discrepancy between the EN-
Hydrol. Earth Syst. Sci., 19, 3755–3769, 2015 www.hydrol-earth-syst-sci.net/19/3755/2015/

Z. N. Musa et al.: A review of applications of satellite SAR, optical, altimetry and DEM data 3761
VISAT master points and the linear regression and the un-
certainties associated with the ENVISAT master points. The
developed method enabled a comparison that produced re-
gression coefficient greater than 0.95 between the ENVISAT
and gauges series. Santos da Silver et al. (2012) used 533 EN-
VISAT virtual stations and 106 gauging data to map extreme
stage variations along 32 Amazon basin rivers and analysed
for drought in the catchment. Using 2005 drought and 2009
flooding events as a basis, data from 2002 to 2005 were anal-
ysed and time series of ENVISAT per virtual station were av-
eraged to get monthly values. Values of the mean amplitude
stage variation for the measured gauges showed good consis-
tency with those of satellite altimetry and results for drought
showed a range between −4 and 1 m of anomalies. Getirana
et al. (2009) went even further and developed a rating curve
of discharge values using virtual stations from ENVISAT for
the upper part of the Branco River basin, Brazil. Virtual sta-
tion data were compared with nearby gauge data to check for
seasonal similarity and trend, and those virtual stations with
standard deviations < 0.1 m were chosen. The method used
a distributed hydrological model to derive discharge values
for the virtual stations. Model calibration and validation re-
sults showed good correlation with measured data, and the
rating curve showed a 2.5–5 % increase in bias when com-
pared with rating curves from measured data. The calibration
results were affected by rainfall data spatial distribution.
Although use of satellite altimetry for river stage monitor-
ing is usually applied to large rivers with a few kilometres’
width (Papa et al., 2012), altimetry data were used to esti-
mate discharge in an ungauged part of the Po River basin
(width: 200–300 m) using cross-sectional data (Tarpanelli
et al., 2013). They used a simplified routing model (RCM)
based on upstream data, wave travel time and hydraulic con-
ditions on two river sections to get the flow in the second
river section. The results showed good agreement between
simulated and in situ discharges, and gave lower RMSEs (rel-
ative to the mean observed discharge) than calculated results
using an empirical equation also based on cross-sectional ge-
ometry. Seyler et al. (2009) used altimetry virtual stations to
estimate river slope. The calculated river slopes were used
to get the river bank full discharge, and the results com-
pared well with gauge data. Lake water volumes were cal-
culated for Lake Mead (USA) and Lake Tana (Ethiopia)
using five altimetry data products: T/P (Topex/Poseidon),
Jason-1, Jason-2, GFO (Geosat Fellow On), ICESat and EN-
VISAT (Duan and Bastiaanssen, 2013). The method used
Landsat TM/ETM+ imagery data to map the water surface
areas using the Modified Normalized Difference Water In-
dex (MNDWI) method which enables robust extraction of
water bodies from optical data (Zhang et al., 2006). The cal-
culated water surface areas agreed with in situ measured data,
with an R2 of 0.99 for Lake Mead and 0.89 for Lake Tana,
and with RMSEs of 2.19 % for Lake Mead and 4.64 % for
Lake Tana. The water volume was estimated using the low-
est altimeter water level as the reference water level; this is
then subtracted from all the other measurements to obtain the
water level above lowest level (WLALL) to be used for vol-
ume estimation. Using regression analysis a relationship was
established between the estimated water surface areas and the
WLALL as A= f (WLALL)= aWLALL2+ bWLALL+ c;
where a, b, and c, are constants. The integral of this re-
lation provides the water volume above the lowest water
level (WVALL). The estimated water volumes agreed well
with in situ water volumes for both Lake Mead and Lake
Tana with R2> 0.95 and RMSE ranging between 4.6 and
13.1 %.
2.3 Optical satellite data
Depending on its contents, water reflects electromagnetic
waves differently; pure clear water reflects differently from
muddy water or water containing vegetation (floating or sub-
merged). The amount of energy measured from the satellite
sensor also depends on the bands used; the blue band pen-
etrates water up to 10 m, the red band is partially absorbed,
and the near-infrared band is totally absorbed. These sensor
properties consequently affect the image, so that an image
acquired using the blue band will measure reflectance from
any submerged vegetation within its reach, while red/near-
infrared images will show water as dark grey/black, respec-
tively (Meijerink et al., 2007).
With the availability of more optical satellites with rel-
atively low temporal resolutions globally, many scenes of
archived data can be accessed and used for change detection
studies and flood extent mapping in areas with little cloud
cover. Penton and Overton (2007) combined flood mask ex-
tents from LandSat ETM of four flood events with a lidar
DEM to produce water heights for the floodplain. The heights
of the flood mask water points were used to interpolate a
water height surface which was subtracted from the DEM
to produce the inundation map. To check for water surface
change, satellite microwave data from the AMSR-E satellite
were used to calibrate the CREST hydrologic model using
ratio brightness temperature measurements over water bod-
ies and calibrated dry areas (Khan et al., 2012). The AMSR-
E detected water surface signal frequency was compared
with gauge flow with a probability of exceedance< 25 %
and showed good agreement. The output of model calibrated
with AMSR-E detected water surface signal showed good
agreement with observed flow frequency. Results of val-
idation were equally good with high correlation between
model results and observed flows with probability of ex-
ceedance< 25 %. The output of the model calibrated with
AMSR-E detected water surface signal showed good agree-
ment with observed flow frequency (Nash–Sutcliffe coeffi-
cient of 0.90 and a correlation coefficient of 0.80).
Due to inaccessibility of the coastal terrain, many remote
wetlands and swamps have few or no gauges, and are not
covered by national gridding systems. As a result, such ar-
eas are not included in topographic mapping projects; even
www.hydrol-earth-syst-sci.net/19/3755/2015/ Hydrol. Earth Syst. Sci., 19, 3755–3769, 2015
3762 Z. N. Musa et al.: A review of applications of satellite SAR, optical, altimetry and DEM data
where data are available, the resolution is usually very coarse
and not detailed (e.g. in Ezer and Liu, 2010). The morphol-
ogy of coastal areas is affected by sediment supply, sea level
change, littoral transport, storm surges, as well as hydrody-
namics at the river mouths of deltaic areas (Kumar et al.,
2010). Tidal flat morphology, for example, changes with the
tidal cycle, and this can affect navigation, coastal defence,
fishing, etc. The monitoring and modelling of tidal flat mor-
phology is thus important (Mason et al., 2010). Apart from
natural causes, coastal areas are affected by human activities
like sand mining, and construction of coastal infrastructure
like ports, harbours, groins and other coastal defence sys-
tems.
Satellite data are used to study coastal morphological
changes that affect the ecosystem and biodiversity of coastal
areas. Kumar et al. (2010) studied the morphological changes
in coastal parts of Karnataka State, India, using satellite and
ancillary data. They calculated the rate of shoreline change
over a 95-year period (1910–2005) and used the results
to predict future shoreline change rates to 2029. Twenty-
five LandSat TM imageries were used to map the tidal mud-
flats of Cooks Inlet, Alaska, by integrating with an inunda-
tion model (Ezer and Liu, 2010). The morphology of Cooks
Inlet is such that tidal floods move much faster than the
ebbing period which moves very slowly; therefore areas at
the far end of the mudflats take several hours before tidal
waters lower. To study their morphology as a test bed for
prediction of floods and its effects, mapping of these fre-
quently flooded areas was done using the LandSat imagery
to delineate water-only areas, and show the range of shore-
line data and water levels. The model results calculated the
water depth and gave the estimated 3-D topography of Cooks
Inlet. Similarly, four LandSat TM images of the Ganges–
Brahmaputra River mouth taken during low-flow and high-
flow seasons were used by Islam et al. (2002) to estimate sus-
pended sediment concentration. The method used converted
the digital numbers of the imageries to radiance values and
subsequently to spectral reflectance and linearly related them
to suspended sediment concentration (SSC). The SSC results
showed a higher distribution of suspended sediments during
high-discharge seasons when the turbidity zone moves fur-
ther seaward, reaching depths of 10 m, than during low-flow
periods when the turbidity zone remains close to the shore.
Yang and Ouchic (2012) used 2000–2009 optical and SAR
satellite imagery and in situ data of the Han estuary in South
Korea to study bar morphology by relating it to tides and pre-
cipitation using regression analysis. The results showed areas
closer to the sea correlating bar size/shape with tides, and ar-
eas closer to the river mouths correlating with precipitation.
Optical satellite images of Sumatra were used to study
post-tsunami coastal recovery based on beach nourishment
and sediment refilling. Liew et al. (2010) used 1 m Ikonos
images of pre-tsunami, tsunami, and post-tsunami periods
to show that coasts affected by tsunamis naturally rebuild to
their former morphological states in areas with little anthro-
pogenic activity. The results showed straight beaches rebuild-
ing a few weeks after the tsunami, but recovery of barrier
beaches and lagoons is much slower, enabling inland rivers
and streams to directly discharge into the ocean. Thus, they
concluded that due to the fast recovery of coastal features
post tsunami, sedimentary deposits are better indicators of
coastal geomorphology than tsunami events.
2.4 Satellite-derived DEM data applications
Satellite data provide topographic information in the form
of digital elevation models (DEMs) generated from radar
echoes of spot heights, e.g. ASTER DEM, SRTM, and SPOT
DEM. The most common and freely available DEM is the
Shuttle Radar Topographic Mission (SRTM) DEM flown in
February 2000 which covered 85 % of the Earth’s surface.
SRTM which was obtained through SAR interferometry of
C-band signals is available in 30 and 90 m spatial resolutions
and an approximate vertical accuracy of 3.7 m (Syvitski et
al., 2012). The vertical accuracy of SRTM is higher in areas
with gentle slopes than on steep slopes; on low-lying flood-
plains SRTM has shown less than 2 m accuracy. More in-
formation on SRTM DEM accuracy can be found in Yan et
al. (2015) and Jarihani et al. (2015).
At the land–water boundary in areas with gentle slopes,
satellite DEMs can be used to measure river stage when
combined with high-resolution imagery. Such combinations
have been used in flood inundation mapping, although there
is less accuracy in situations where the water edge is ob-
scured by vegetation (Smith, 1997). Syvitski et al. (2012)
adjusted SRTM data using ocean heights measured by the
TOPEX/POSEIDON satellite altimeter to enable the map-
ping of floodplain zones. Advanced microwave Scanning Ra-
diometer (AMSR-E) data provided brightness temperature
measurements of the floodplain. The ratio of land area bright-
ness temperatures to water area brightness temperature gave
the discharge estimator; chosen dry areas were used as cal-
ibration areas for measurements over water-covered areas.
A rating curve of the ratio versus discharge was then used
to extract the discharge values. Four floodplain zones were
classified around the world from the 33 floodplains stud-
ied, namely, container valleys, floodplain depressions, nodal
avulsions and delta plains. SRTM data measure surface level
which over river channels is equivalent to water levels when
the land water boundary is delineated. Jung et al. (2010)
used in situ (bathymetry and cross-sectional) data and SRTM
DEM water levels to derive water surface slope and to cal-
culate the discharge of the Brahmaputra River. The cross-
sectional water level was obtained by fitting a first-degree
polynomial function to the SRTM data elevation. The aver-
age calculated discharge results when compared to in situ
gauge reading gave a difference of 2.3 %. Two DEMs of
Morecambe Bay were used to determine the relative change
in inter-tidal sediment volume above and below mean sea
level (Mason et al., 2010). The first set of DEMs was de-
Hydrol. Earth Syst. Sci., 19, 3755–3769, 2015 www.hydrol-earth-syst-sci.net/19/3755/2015/
Z. N. Musa et al.: A review of applications of satellite SAR, optical, altimetry and DEM data 3763
rived from satellite SAR imagery and the second set from
lidar. By using the sea height as zero level the lidar DEM
was normalized to the same height as the SAR DEM. The
relative change in sediment volume was derived by subtract-
ing the normalized lidar DEM heights from the SAR DEM.
SRTM 30 m data were combined with MODIS 500 m water
mask data to produce 30 m static water masks of 2003 flood-
ing along the Mississippi River (Li et al., 2013). The method
involved using SRTM to mark the minimum water level from
the MODIS water mask, which is then used to calculate the
maximum water level for that pixel using a water fraction
relation. All SRTM 30 m pixels with heights between min-
imum and maximum water levels are classified as water,
and all those with heights higher than the maximum level
are classified as dry. Consequently, the 500 m MODIS water
mask is integrated into a 30 m water mask with the SRTM.
The results gave detailed flood maps with the same flooding
coverage as the MODIS water masks but enlarged 18 times.
The flood maps were compared with Landsat TM images of
the flood and showed over 94 % match in water area cover-
age. Errors/mismatch were found to be mostly around areas
with trees and vegetation cover.
3 Future needs and direction
3.1 Gaps and limitations
As useful as satellite data applications have been in estimat-
ing surface water parameters, the measurements come with
limitations due to sensor specifications/errors, pre- and post-
data processing techniques, calibration, measurement condi-
tions, satellite distance from the targets, etc. Optical satellite
data for example are limited to daytime acquisition due to
their dependence on sunlight, and are not very useful in ar-
eas perpetually covered by clouds because the target cannot
be reached (Smith, 1997).
Since satellite data are used for calibration, their accuracy
when compared with measured data is very important. Satel-
lite data accuracy is estimated using different error measure-
ment techniques (e.g. RMSE, mean error), checking for cor-
relation with measured data or measuring the coefficient of
determination (e.g. Tarpanelli et al., 2013). There are mul-
tiple sources of error that can affect the data; for example,
the uncertainties in using satellite river width for calibration
include the satellite estimation of the river width, the power
relation between the discharge and river width (which is an
approximation of the conditions at a river cross section when
there is no backwater effect) and the assumption of a sta-
ble/static river cross section. However, these sources of un-
certainty are lowest for the period of satellite data acquisi-
tion, and increase with change in season and hydraulic con-
ditions (Sun et al., 2010).
3.1.1 SAR
The quality and usefulness of SAR data for hydrological
studies depend on meteorological conditions (wind and rain),
emergent vegetation, incidence angle and the polarization
mode used for data acquisition. Horizontal–horizontal (HH)
polarization gives better results for flood extent mapping than
vertical–horizontal (VH) and vertical–vertical (VV) polar-
izations. However, VH and VV polarizations are also use-
ful since VV polarization data highlight vertical features like
vegetation, and VH polarization data reflect the horizontal
nature of the smoothed flood water (Schumann et al., 2007).
Another important factor for SAR data use in hydrology is
the river size. Until the recent launch of CSK, Radarsat-2,
PALSAR, and TerraSAR-X, most available SAR satellites
had large spatial resolutions which excluded smaller rivers
from being captured, since it was difficult to delineate them
in an image (Sun et al., 2009).
Satellite SAR used for delineation of water extent has the
limitation of floodplain vegetation being included and clas-
sified as water pixels; moreover, the height of the SAR wa-
terline does not show the variation in water height with flow
direction.
3.1.2 Altimetry
For river stage estimation and wetlands delineation, prob-
lems encountered with satellite altimetry data include incor-
rect processing of radar echoes over rivers/lakes by satellite
trackers, poor temporal resolution, and lack of information
within the data about the atmospheric wet vapour content
over lakes/rivers (Crétaux et al., 2009). The errors recorded
while using altimeter water level data can however be in-
creased by incorrect choice of data, which frequently occurs
when dry area data are retained within the data for comput-
ing water stages in low-flow seasons (Santos da Silva et al.,
2007). The difference between altimeter and gauge measure-
ments also increases with distance between the points, topog-
raphy and river width (León, et al., 2006). When compared
with gauge data, RMSEs of altimetry data measured over the
Amazon have ranges from 30 to 70 cm using data from EN-
VISAT, ERS2, and GeoSaT (Tarpanelli et al., 2013); how-
ever, at cross track situations where altimetry measurements
are taken at the same location with a gauging station, the dif-
ference can be < 20 cm (Seyler et al., 2009). The accuracy
of altimeter measurements over rivers is also affected by the
river width and the morphology of the river banks so that data
on narrow rivers and vegetated banks have lower accuracy
(Papa et al., 2012). Furthermore, the specifications of the al-
timetry system itself can affect the quality of measurements;
for example, ENVISAT data have been shown to have lower
RMSE compared to ERS2 data due to ENVISAT’s ability to
switch frequency modes in response to changes in terrain and
its smaller bin width (Tarpanelli et al., 2013).
www.hydrol-earth-syst-sci.net/19/3755/2015/ Hydrol. Earth Syst. Sci., 19, 3755–3769, 2015

3764 Z. N. Musa et al.: A review of applications of satellite SAR, optical, altimetry and DEM data
3.1.3 DEM
The limitation of a satellite DEM is in the data quality.
DEM data needed for modelling and other analyses that re-
quire topographic data depend on the acquisition method, the
data processing and the characteristics of the mapped terrain.
Satellite-derived DEMs have less vertical accuracy, higher
bias and higher RMSE than other DEMs derived from air-
borne lidar and airborne IFSAR (Fraser and Ravanbakhsh,
2011).
In spite of their limited accuracy satellite DEMs have
global or almost global coverage unlike airborne DEMs.
Therefore they are useful sources of topographic data,
especially for low-lying coastal areas with gentle slopes
(Gorokhovich and Voustianiouk, 2006; Schumann et al.,
2008), and consequently applicable for inundation modelling
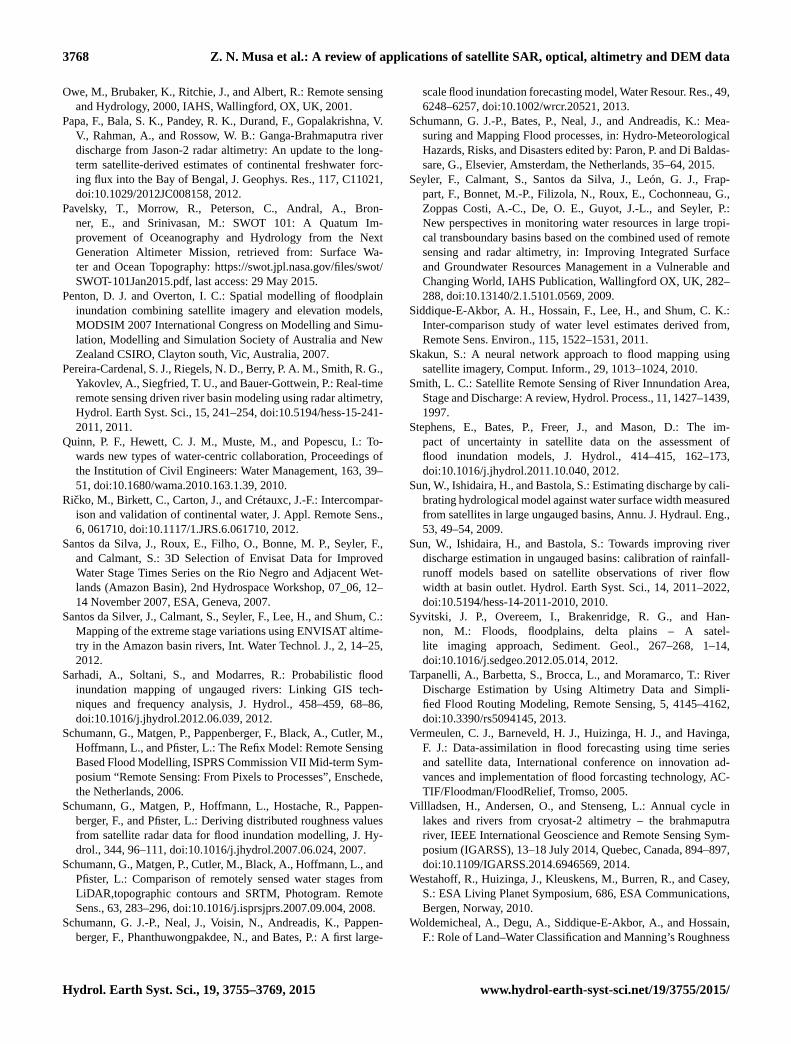
(Karlsson and Arnberg, 2011). Figure 4 shows results of
flood modelling undertaken for the lower Niger River (Nige-
ria) using SRTM 30 and 90 m. The Niger River overflowed
its banks in 2007 and flooded a large part of the floodplain.
MODIS satellite data were used to map the flood and pro-
vided the only reference record of the flood. Figure 4 shows
that the model results are comparable with the MODIS flood-
ing extent.
Generally, satellite-based DEMs are either generated from
radar echoes of spot heights or from SAR interferometry.
However, Mason et al. (2010) also derived DEMs from SAR
images. The method involved using SAR water height to in-
terpolate a set of water lines, which were then used to pro-
duce a 50 m DEM of the intertidal zone with an accuracy of
40 cm. The method is however limited by the temporal de-
correlation of the waterline heights.
3.2 Current data use strategies
Innovative methodologies are being introduced by scientists
to better exploit satellite data to overcome the data limi-
tations within present uncertainties. For example cloud fil-
tering techniques have been developed that remove a high
percentage of the clouds in optical data, thus adding to
data availability. In terms of temporal limitations, combin-
ing MODIS data with its high temporal resolution with other
types of satellite data is a technique that is now exploited
more (Jarihani et al., 2014). The technique generates new
data sets that blend higher spatial resolution at the high tem-
poral resolution of MODIS. When combined with DEM data,
for example, flood maps that provide daily information can
be easily generated (Li et al., 2013). SRTM has been com-
bined with MODIS data to generate a 250 m water mask
called MOD44W; because of the high temporal resolution
of MODIS this product can be updated regularly to provide
static water masks (Li et al., 2013).
Use of satellite SAR for flood extent mapping and model
calibration can be improved through combination with other
higher-resolution data to increase precision in flood height
Figure 4. Model simulation result of flooding on the Niger
River (2007) using SRTM topographic data.
determination. To improve the vertical accuracy of SAR wa-
terline extent during floods, Mason et al. (2007) used water-
line data extracted from ERS-1 SAR corrected with 1 m res-
olution lidar heights (along the Thames River bank) to cal-
ibrate a LISFLOOD model of flood extent. The output wa-
terline when compared with waterline measured from aerial
photos showed a lower root mean squared error than those
obtained using SAR data only.
Satellite DEMs that are enhanced through vegetation
smoothing or hydrological correction have shown lower er-
rors compared with the original data (Jarihani et al., 2015).
Due to the availability of the hydrologically corrected SRTM
DEM, a global static 30 m water mask has been generated
which is very useful for flood detection, especially in data-
scarce areas.
To improve the use of satellite altimetry data, interpola-
tion methods have been developed to correct the data ac-
curacy and precision by comparing the data with lakes and
reservoir measurements. Thus the correlation with measured
gauge data, range of RMSE and reduction in discrepancies
have improved to levels> 0.95 correlation during validation
(Ricko et al., 2012). Altimeter measurements over modified
channels is however less reliable than that of natural catch-
ments (Kim et al., 2009).
The use of altimeter data is also limited by the poor tempo-
ral resolution of satellite altimeters; which range from days to
several weeks. Belaud et al. (2010) developed a method to in-
terpolate river water levels in-between satellite observations
in order to provide continuous data. The developed method
used upstream ground station measurements and altimetry
Hydrol. Earth Syst. Sci., 19, 3755–3769, 2015 www.hydrol-earth-syst-sci.net/19/3755/2015/
Z. N. Musa et al.: A review of applications of satellite SAR, optical, altimetry and DEM data 3765
data as output to calibrate a propagation model by adjusting
the satellite observed values. The propagation model used a
transfer function to predict water level variations based on the
relationship between the propagation times and water levels.
The results were able to predict flood peaks during periods
of no satellite coverage. Crétaux et al. (2011) addressed the
problem of data gaps by combining three sets of altimetry
data (TOPEX/POSEIDON, ENVISAT1 and JASON2) with
MODIS measurements of water extent to monitor wetlands
and floodplains in arid/semi arid regions. The MODIS data
were used to classify the open water pixels whose relative
values were then extracted from altimetry data. The results
provided relative water heights, due to the low temporal res-
olution of the altimetry data sets. Altimeter data from ICESat
were used to calibrate a large-scale LISFLOOD-FP hydro-
dynamic flood model of the Zambezi River, Mozambique
(Schumann et al., 2013). Eight in-channel water levels from
ICESat from one altimeter pass were used for calibration of
model output. The models with a mean bias within one stan-
dard deviation of the ICESat values were accepted as com-
parable with Landsat measured flooding extents. The results
showed 86 % agreement between the Landsat flood extent
and the accepted model outputs, corresponding to a mean dis-
tance of 1.42–1.60 km. After calibration the model upstream
boundary was changed to forecast flow values in order to
forecast downstream flooding. The results correlated with the
baseline model, but showed that with a lead time of 5 days,
better basin-wide precipitation observations will enable flood
forecasting on the Zambezi.
3.3 Future direction
The available literature shows that efforts have been made to
develop an empirical relationship between satellite-derived
surface water extents (including flooded areas) with river
stage or discharge. Such a relationship has been established
for braided rivers; for non-braided rivers, the results have
depended on the river system; thus, inundation area can in-
crease or decrease with stage. With better SAR missions such
as TerraSAR-X–TanDEM-X formation, DEM data with good
vertical accuracy are now available for better hydraulic flood
modelling. TanDEM-X has 12.5 m spatial resolution and pro-
duces less than 2 m vertical accuracy (DLR, 2015). Although
made for polar ice change estimation and monitoring, the
high spatial coverage of Cryosat-2 is also being exploited
for near-shore mapping and inland water monitoring (Vill-
ladsen et al., 2014). Cryosat-2, which operates in SAR and
interferometric modes, has a drifting orbit and therefore (un-
like all the other satellites) has few repetitive data (since the
repeat cycle is 369 days). Its high spatial density coverage
makes it good for hydraulic modelling (and all its evaluations
have produced good results). With successful use of Cryosat-
2 data to obtain river water levels and topography, the use of
drifting orbits is being proposed as more suitable for river
water surface topography mapping, derivation of river pro-
files and building of pseudo time series (Bercher et al., 2014).
Other satellite products that improve the accuracy of
satellite data based research in hydrology include Cosmo-
SkyMed from the Italian Space Agency, Radarsat-2 from
the Canadian Space Agency, and Sentinel-1 from ESA
(Schumann et al., 2015). Others are Global Change Ob-
servation Mission-Water (GCOM-W) from the Japan Space
Agency (JAXA), Global Precipitation Measurement (GPM)
from JAXA/USA, and Soil Moisture Active Passive (SMAP)
from the USA.
To improve the quality of satellite SAR and topographic
data, new satellite missions with higher-precision instru-
ments are being planned. One such mission is the Sentinel
constellation that will consist of seven satellites, two of
which (Sentinel 3 and 6) are especially dedicated to hydro-
logical purposes. Sentinel 1 is already in orbit and undergo-
ing calibration; it has a C-band SAR instrument to continue
present C-band data provision. Sentinel 3 is planned to pro-
vide fast data for flood emergencies; therefore, it has three
instruments, one of which is a dual-frequency (Ku- and C-
band) advanced synthetic aperture radar altimeter (SRAL)
that will provide accurate topographic data of oceans, ice
sheets, sea ice, rivers and lakes (ESA, 2015). Sentinel 6,
which will compliment the Sentinel 3 data, will carry on
board a high-precision radar altimeter. The Radarsat constel-
lation, a new low Earth orbit (LEO) C-band SAR mission, is
under development by the Canadian Space Agency (CSA).
The constellation which will have several operating modes
will provide interferometric SAR data that can be used for
wetlands and coastal change mapping, flood disaster warn-
ing and response with resolutions 3, 5, 16, 30, 50 and 100 m
(CSA, 2015).
Other upcoming satellite missions like Surface Water
and Ocean Topography (SWOT) made especially to survey
global surface water have specifications that will enable bet-
ter use of satellite data in hydrology. SWOT, which uses a
wide-swath altimetry technology, will also observe the fine
details of the ocean’s surface topography and measure how
water bodies change over time with repeated high-resolution
elevation measurements. The mission, scheduled to be
launched in 2020, is an international collaboration between
the US National Aeronautics and Space Agency (NASA)
and Centre National Etudes Spatiales (CNES) of France,
supported by the Canadian Space Agency (CSA) and the
UK Space Agency (UKSA) (Pavelsky et al., 2015). Another
product of international cooperation that will support hydro-
logical research is the Jason3 altimetry mission from NOAA,
due to be launched in July 2015. The Jason3 mission is ded-
icated to the measurement of sea surface height, waves, and
wind speed, and will provide useful data to monitor sea level
rise, coastal area modelling of oil spills, forecasting of hur-
ricanes, etc. To enable precise detection of sea level change,
Jason3 combines GPS, radar altimetry, and a microwave ra-
diometer to produce data within 1 cm accuracy every 10 days
www.hydrol-earth-syst-sci.net/19/3755/2015/ Hydrol. Earth Syst. Sci., 19, 3755–3769, 2015

3766 Z. N. Musa et al.: A review of applications of satellite SAR, optical, altimetry and DEM data
(NOAA, 2015). Jason3 is jointly owned by US National
Oceanic and Atmospheric Administration (NOAA), CNES-
France, European Organisation for the Exploitation of Mete-
orological Satellites (EUMETSAT), and US NASA.
4 Conclusions
Satellite remote sensing provides a source of hydrological
data that is unhindered by geopolitical boundaries, has ac-
cess to remote/unreachable areas, and provides frequent and
reliable data (Jung et al., 2010). Use of satellite data to es-
timate hydrological parameters continues to increase due to
greater availability of satellite data, improvement in knowl-
edge of and utilization of satellite data, as well as expansion
of research topics. A very important catalyst for this growth
in satellite data utilization is the ability to use it in a GIS
environment. GIS enables comparison and deduction of re-
lationships that exist amongst the complex data sources used
for analysis. Thus relationships like the effects of land-use
change on surrounding water bodies or water management
are easily analysed and depicted. Consequently, satellite data
are commonly used for mapping of water bodies, testing of
inundation models, soil moisture measurements, precipita-
tion monitoring, estimation of evapo-transpiration, and map-
ping of flood extent.
Data quality, pre-/post-data processing, etc., introduce new
errors and increase the uncertainties in satellite data utiliza-
tion. However, several methods have been developed to quan-
tify the errors and produce acceptable results. Moreover, a
number of satellite missions to address issues of climate
change are being planned; some of these are dedicated to
water resource management and will carry high-precision
instruments. The products of these missions will have less
error; consequently, results obtained will be more accurate,
thereby filling the gap in data availability.
Author contributions. The authors worked together as a team in de-
veloping the review paper.
Acknowledgements. This review is part of a study being undertaken
by the first author, and is sponsored by the National Space Research
and Development Agency (NASRDA), Nigeria.
Edited by: H. Cloke
References
Barneveld, H., Silander, J., Sane, M., and Malnes, E.: Ap-
plication of satellite data for improved flood forecasting
and mapping, 4th International Symposium on Flood
Defence: Managing Flood Risk, Reliability and Vulner-
ability, 6–8 May 2008 Toronto, Canada, retrieved from:
http://www.hkv.nl/site/hkv/upload/publication/Application_
ofsatellite_data_forimprovedflood_forecastingHJB.pdf (last
access: 1 June 2015), 2008.
Belaud, G., Cassan, L., and Bader, J. C.: Calibration of a propaga-
tion model in large river using satellite, 6th International Sym-
posium on Environmental Hydraulics, Athens, Greece, 869–874,
2010.
Bercher, N., Calmant, S., Picot, N., Seyler, F., and Fleury, S.:
Evaluation of Cryosat-2 measurements for the monitoring of
large river water levels, retrieved from: Along-Track.com:
http://chronos.altihydrolab.fr/2012-09-23_Venice_ESA_20_
years_of_progress_in_altimetry/Bercher.2012b_(Venice_Paper)
_CryoSat-2_hydro.pdf (last access 25 June 2015), 2014.
Chen, H., Yang, D., Hong, Y., Gourley, J., and Zhang, Y.: Hydro-
logical data assimilation with the Ensemble Square-Root-Filter:
Use of streamflow observations to update model states for real-
time flash flood forecasting, Adv. Water Resour., 59, 209–220,
doi:10.1016/j.advwatres.2013.06.010, 2013.
Crétaux, J. F., Stéphane, C., Romanovski, V., Shabunin, A., Lyard,
F., Bergé Nguyen, M., Cazenave, A., Fabrice, H., and Perosanz,
F.: An absolute calibration site for radar altimeters in the con-
tinental domain: lake Issykkul in Central Asia, J. Geodesy, 83,
723–735, 2009.
Crétaux, J. F., Bergé-Nguyen, M., Leblanc, M., Del Rio, R. A., Del-
claux, F., Mognard, N., Lion, C., Pandey, R. K., Tweed, S., Cal-
mant, S., and Maisongrande, P.: Flood mapping inferred from
remote sensing data, Fifteenth International Water Technology
Conference, 28–30 May 2011, Alexandria, Egypt, 2011.
CSA – Canadian Space Agency:RADARSAT Constellation, re-
trieved from: RADARSAT constellation: http://www.asc-csa.gc.
ca/eng/satellites/radarsat/, last access: 23 June 2015.
Dellepiane, S., de Laurentiis, R., and Giordano, F.: Coastline Ex-
traction from SAR Images and a Method for the Evaluation of the
Coastline Precision, Pattern Recog. Lett., 25, 1461–1470, 2004.
Di Baldassarre, G., Schumann, G., and Bates, P. D.: A tech-
nique for the calibration of hydraulic models using uncertain
satellite observations of flood extent, J. Hydrol., 367, 276–282,
doi:10.1016/j.jhydrol.2009.01.020, 2009.
DLR: Earth Observation: TanDEM-X – the Earth in three dimen-
sions, retrieved from: http://www.dlr.de/dlr/en/desktopdefault.
aspx/tabid-10378/566_read-426/#/gallery/345, last access:
1 June 2015.
Duan, Z. and Bastiaanssen, W.: Estimating water volume variations
in lakes and reservoirs from four operational satellite altime-
try databases and satellite imagery data, Remote Sens. Environ.,
134, 403–416, doi:10.1016/j.rse.2013.03.010, 2013.
ESA: Sentinel 3, retrieved from Copernicus, observing the
Earth: http://www.esa.int/OurActivities/Observing_theEarth/
Copernicus/Sentinel-3, last access 15 June 2015.
Ezer, T. and Liu, H.: On the dynamics and morphology of exten-
sive tidal mudflats: Integrating remote sensing data with an inun-
dation model of Cook Inlet, Alaska, Ocean Dynam., 60, 1307–
1318, doi:10.1007/s10236-010-0319-x, 2010.
Hydrol. Earth Syst. Sci., 19, 3755–3769, 2015 www.hydrol-earth-syst-sci.net/19/3755/2015/

Z. N. Musa et al.: A review of applications of satellite SAR, optical, altimetry and DEM data 3767
Fraser, C. S. and Ravanbakhsh, M.: Performance of DEM genera-
tion technologies in coastal environments, 7th International Sym-
posium on Digital Earth, 23–25 August 2011, Perth, Australia,
40–49, 2011.
García-Pintado, J., Mason, D., Dance, S., Cloke, H., Neal, J.,
Freer, J., and Bates, P.: Satellite-supported flood forecasting in
river networks: A real case study, J. Hydrol., 523, 706–724,
doi:10.1016/j.jhydrol.2015.01.084, 2015.
Getirana, A. C., Bonnet, M.-P., Calmant, S., Roux, E., Rotunno
Filho, O. C., and Mansur, W. J.: Hydrological monitoring of
poorly gauged basins based on rainfall–runoff, J. Hydrol., 379,
205–219, doi:10.1016/j.jhydrol.2009.09.049, 2009.
Giustarini, L., Matgen, P., Hostache, R., Montanari, M., Plaza, D.,
Pauwels, V. R. N., De Lannoy, G. J. M., De Keyser, R., Pfister,
L., Hoffmann, L., and Savenije, H. H. G.: Assimilating SAR-
derived water level data into a hydraulic model: a case study,
Hydrol. Earth Syst. Sci., 15, 2349–2365, doi:10.5194/hess-15-
2349-2011, 2011.
Gorokhovich, Y. and Voustianiouk, A.: Accuracy assessment of
the processed SRTM-based elevation data by CGIAR using
field data from USA and Thailand and its relation to the
terrain characteristics, Remote Sens. Environ., 104, 409–415,
doi:10.1016/j.rse.2006.05.012, 2006.
Horritt, M. S.: A methodology for the validation of uncer-
tain flood inundation models, J. Hydrol., 326, 153–165,
doi:10.1016/j.jhydrol.2005.10.027, 2006.
Islam, R. Z., Begum, S. F., Yamaguchi, Y., and Ogawa, K.: Distri-
bution of suspended sediment in the coastal sea off the Ganges–
Brahmaputra River mouth: observation from TM data, Marine
Syst., 32, 307–321, doi:10.1016/S0924-7963(02)00045-3, 2002.
Jarihani, A., Callow, J., Johansen, K., and Gouweleeuw, B.: Eval-
uation of multiple satellite altimetry data for studying in-
land water bodies and river floods, J. Hydrol., 505, 78–90,
doi:10.1016/j.jhydrol.2013.09.010, 2013.
Jarihani, A., McVicar, T., Van Niel, T., Emelyanova, I., Callow, J.,
and Johansen, K.: Blending Landsat and MODIS Data to Gener-
ate Multispectral Indices: A Comparison of “Index-then-Blend”
and “Blend-then-Index” Approaches, Remote Sensing, 6, 9213–
9238, doi:10.3390/rs6109213, 2014.
Jarihani, A., Callow, J., McVicar, T., Van Niel, T., and Larsen,
J.: Satellite-derived Digital Elevation Model (DEM) selection,
preparation and correction for hydrodynamic modelling in large,
low-gradient and data-sparse catchments, J. Hydrol., 524, 489–
506, doi:10.1016/j.jhydrol.2015.02.049, 2015.
Jung, C. H., Hamski, J., Durand, M., Alsdorf, D., Hossain, F., Lee,
H., and Hasan, K.: Characterization of complex fluvial systems
using remote sensing of spatial and temporal water level vari-
ations in the Amazon, Congo, and Brahmaputra Rivers, Earth
Surf. Proc. Land., 35, 294–304, doi:10.1002/esp.1914, 2010.
Karlsson, J. M. and Arnberg, W.: Quality analysis of
SRTM and HYDRO1K: a case study of flood inunda-
tion in Mozambique, Int. J. Remote Sens., 32, 267–285,
doi:10.1080/01431160903464112, 2011.
Khan, S. I., Hong, Y., Vergara, H. J., Gourley, J. J., Brakenridge,
G. R., De Groeve, T., and Yong, B.: Microwave Satllite Data for
Hydrologic Modelling in Ungauged Basins, IEEE Geosci. Re-
mote Sens. Lett., 9, 663–667, doi:10.1109/LGRS.2011.2177807,
2012.
Kim, J., Lu, Z., Lee, H., Shum, C. K., Swarzenski, C. M., Doyle, T.
W., and Baek, S.-H.: Integrated analysis of PALSAR/Radarsat-1
InSAR and ENVISAT altimeter data for mapping of absolute wa-
ter level changes in Louisiana wetlands, Remote Sens. Environ.,
113, 2356–2365, 2009.
Kumar, A., Narayana, A., and Jayappa, K.: Shoreline changes and
morphology of spits along southern Karnataka, west coast of In-
dia: A remote sensing and statistics-based approach, Geomor-
phology, 120, 133–152, doi:10.1016/j.geomorph.2010.02.023,
2010.
León, J. G., Calmant, S., Seyler, F., Bonnet, M.-P., Cauhopé, M.,
Frappart, F., and Fraizy, P.: Rating curves and estimation of av-
erage water depth at the upper Negro, J. Hydrol., 328, 481–496,
doi:10.1016/J.JHYDROL.2005.12.006, 2006.
Li, S., Sun, D., Goldberg, M., and Stefanidis, A.: Deriva-
tion of 30-m-resolution water maps from TERRA/MODIS
and SRTM, Remote Sens. Environ., 134, 417–430,
doi:10.1016/j.rse.2013.03.015, 2013.
Liew, S. C., Gupta, A., Wong, P. P., and Kwoha, L. K.:
Recovery from a large tsunami mapped over time:
The Aceh coast, Sumatra, Geology, 114, 520–529,
doi:10.1016/j.geomorph.2009.08.010, 2010.
Lillesand, T., Kiefer, R. W., and Chapman, J. W.: Remote sens-
ing and image interpretation, 5th Edn., John Wiley and sons,
Hobone, NJ, USA, 2004.
Long, S., Fatoyinbo, T., and Policelli, F.: Flood extent mapping for
Namibia using change detection and thresholding with SAR, En-
viron. Res. Lett., 9, 035002, doi:10.1088/1748-9326/9/3/035002,
2014.
Mason, D. C., Horritt, M. S., Dall’Amico, J. T., and Scott, T. R.: Im-
proving River Flood Extent Delineation From Synthetic Aperture
Radar Using Airborne Laser Altimetry, IEEE T. Geosci. Remote,
45, 3932–3943, doi:10.1109/TGRS.2007.901032, 2007.
Mason, D. C., Scott, T. R., and Dance, S. L.: Remote sensing of
intertidal morphological change in Morcambe Bay, U,K., be-
tween 1991 and 2007, Estuar. Coast. Shelf Sci., 87, 487–496,
doi:10.1016/j.ecss.2010.01.015, 2010.
Matgen, P., Montanari, M., Hostache, R., Pfister, L., Hoffmann, L.,
Plaza, D., and Savenije, H.: Towards the sequential assimilation
of SAR-derived water stages into hydraulic models using the Par-
ticle Filter: proof of concept, Hydrol. Earth Syst. Sci., 14, 1773–
1785, doi:10.5194/hess-14-1773-2010, 2010.
Mcmillan, H., Hreinsson, E., Clark, M., Singh, S., Zammit, C., and
Uddstrom, M.: Operational hydrological data assimilation with
the recursive ensemble Kalman filter, Hydrol. Earth Syst. Sci.,
17, 21–38, doi:10.5194/hess-17-21-2013, 2013.
Meijerink, A. M., Bannert, D., Batelaan, O., Lubczynski, M. W.,
and Pointet, T.: Remote sensing applictions to groundwater, Se-
ries on Groundwater, UNESCO, Paris, France, 2007.
NOAA, S. I.: Jason3, retrieved from: http:
//www.nesdis.noaa.gov/jason-3/?CFID=
731ecb89-8379-48fc-ad50-9546e71739&CFTOKEN=0, last
access: 29 May 2015.
Noh, S., Tachikawa, Y., Shiiba, M., and Kim, S.: Applying sequen-
tial Monte Carlo methods into a distributedhydrologic model:
lagged particle filtering approach with regularization, Hydrol.
Earth Syst. Sci., 15, 3237–3251, doi:10.5194/hess-15-3237-
2011, 2011.
www.hydrol-earth-syst-sci.net/19/3755/2015/ Hydrol. Earth Syst. Sci., 19, 3755–3769, 2015
3768 Z. N. Musa et al.: A review of applications of satellite SAR, optical, altimetry and DEM data
Owe, M., Brubaker, K., Ritchie, J., and Albert, R.: Remote sensing
and Hydrology, 2000, IAHS, Wallingford, OX, UK, 2001.
Papa, F., Bala, S. K., Pandey, R. K., Durand, F., Gopalakrishna, V.
V., Rahman, A., and Rossow, W. B.: Ganga-Brahmaputra river
discharge from Jason-2 radar altimetry: An update to the long-
term satellite-derived estimates of continental freshwater forc-
ing flux into the Bay of Bengal, J. Geophys. Res., 117, C11021,
doi:10.1029/2012JC008158, 2012.
Pavelsky, T., Morrow, R., Peterson, C., Andral, A., Bron-
ner, E., and Srinivasan, M.: SWOT 101: A Quatum Im-
provement of Oceanography and Hydrology from the Next
Generation Altimeter Mission, retrieved from: Surface Wa-
ter and Ocean Topography: https://swot.jpl.nasa.gov/files/swot/
SWOT-101Jan2015.pdf, last access: 29 May 2015.
Penton, D. J. and Overton, I. C.: Spatial modelling of floodplain
inundation combining satellite imagery and elevation models,
MODSIM 2007 International Congress on Modelling and Simu-
lation, Modelling and Simulation Society of Australia and New
Zealand CSIRO, Clayton south, Vic, Australia, 2007.
Pereira-Cardenal, S. J., Riegels, N. D., Berry, P. A. M., Smith, R. G.,
Yakovlev, A., Siegfried, T. U., and Bauer-Gottwein, P.: Real-time
remote sensing driven river basin modeling using radar altimetry,
Hydrol. Earth Syst. Sci., 15, 241–254, doi:10.5194/hess-15-241-
2011, 2011.
Quinn, P. F., Hewett, C. J. M., Muste, M., and Popescu, I.: To-
wards new types of water-centric collaboration, Proceedings of
the Institution of Civil Engineers: Water Management, 163, 39–
51, doi:10.1680/wama.2010.163.1.39, 2010.
Ricko, M., Birkett, C., Carton, J., and Crétauxc, J.-F.: Intercompar-
ison and validation of continental water, J. Appl. Remote Sens.,
6, 061710, doi:10.1117/1.JRS.6.061710, 2012.
Santos da Silva, J., Roux, E., Filho, O., Bonne, M. P., Seyler, F.,
and Calmant, S.: 3D Selection of Envisat Data for Improved
Water Stage Times Series on the Rio Negro and Adjacent Wet-
lands (Amazon Basin), 2nd Hydrospace Workshop, 07_06, 12–
14 November 2007, ESA, Geneva, 2007.
Santos da Silver, J., Calmant, S., Seyler, F., Lee, H., and Shum, C.:
Mapping of the extreme stage variations using ENVISAT altime-
try in the Amazon basin rivers, Int. Water Technol. J., 2, 14–25,
2012.
Sarhadi, A., Soltani, S., and Modarres, R.: Probabilistic flood
inundation mapping of ungauged rivers: Linking GIS tech-
niques and frequency analysis, J. Hydrol., 458–459, 68–86,
doi:10.1016/j.jhydrol.2012.06.039, 2012.
Schumann, G., Matgen, P., Pappenberger, F., Black, A., Cutler, M.,
Hoffmann, L., and Pfister, L.: The Refix Model: Remote Sensing
Based Flood Modelling, ISPRS Commission VII Mid-term Sym-
posium “Remote Sensing: From Pixels to Processes”, Enschede,
the Netherlands, 2006.
Schumann, G., Matgen, P., Hoffmann, L., Hostache, R., Pappen-
berger, F., and Pfister, L.: Deriving distributed roughness values
from satellite radar data for flood inundation modelling, J. Hy-
drol., 344, 96–111, doi:10.1016/j.jhydrol.2007.06.024, 2007.
Schumann, G., Matgen, P., Cutler, M., Black, A., Hoffmann, L., and
Pfister, L.: Comparison of remotely sensed water stages from
LiDAR,topographic contours and SRTM, Photogram. Remote
Sens., 63, 283–296, doi:10.1016/j.isprsjprs.2007.09.004, 2008.
Schumann, G. J.-P., Neal, J., Voisin, N., Andreadis, K., Pappen-
berger, F., Phanthuwongpakdee, N., and Bates, P.: A first large-
scale flood inundation forecasting model, Water Resour. Res., 49,
6248–6257, doi:10.1002/wrcr.20521, 2013.
Schumann, G. J.-P., Bates, P., Neal, J., and Andreadis, K.: Mea-
suring and Mapping Flood processes, in: Hydro-Meteorological
Hazards, Risks, and Disasters edited by: Paron, P. and Di Baldas-
sare, G., Elsevier, Amsterdam, the Netherlands, 35–64, 2015.
Seyler, F., Calmant, S., Santos da Silva, J., León, G. J., Frap-
part, F., Bonnet, M.-P., Filizola, N., Roux, E., Cochonneau, G.,
Zoppas Costi, A.-C., De, O. E., Guyot, J.-L., and Seyler, P.:
New perspectives in monitoring water resources in large tropi-
cal transboundary basins based on the combined used of remote
sensing and radar altimetry, in: Improving Integrated Surface
and Groundwater Resources Management in a Vulnerable and
Changing World, IAHS Publication, Wallingford OX, UK, 282–
288, doi:10.13140/2.1.5101.0569, 2009.
Siddique-E-Akbor, A. H., Hossain, F., Lee, H., and Shum, C. K.:
Inter-comparison study of water level estimates derived from,
Remote Sens. Environ., 115, 1522–1531, 2011.
Skakun, S.: A neural network approach to flood mapping using
satellite imagery, Comput. Inform., 29, 1013–1024, 2010.
Smith, L. C.: Satellite Remote Sensing of River Innundation Area,
Stage and Discharge: A review, Hydrol. Process., 11, 1427–1439,
1997.
Stephens, E., Bates, P., Freer, J., and Mason, D.: The im-
pact of uncertainty in satellite data on the assessment of
flood inundation models, J. Hydrol., 414–415, 162–173,
doi:10.1016/j.jhydrol.2011.10.040, 2012.
Sun, W., Ishidaira, H., and Bastola, S.: Estimating discharge by cali-
brating hydrological model against water surface width measured
from satellites in large ungauged basins, Annu. J. Hydraul. Eng.,
53, 49–54, 2009.
Sun, W., Ishidaira, H., and Bastola, S.: Towards improving river
discharge estimation in ungauged basins: calibration of rainfall-
runoff models based on satellite observations of river flow
width at basin outlet. Hydrol. Earth Syst. Sci., 14, 2011–2022,
doi:10.5194/hess-14-2011-2010, 2010.
Syvitski, J. P., Overeem, I., Brakenridge, R. G., and Han-
non, M.: Floods, floodplains, delta plains – A satel-
lite imaging approach, Sediment. Geol., 267–268, 1–14,
doi:10.1016/j.sedgeo.2012.05.014, 2012.
Tarpanelli, A., Barbetta, S., Brocca, L., and Moramarco, T.: River
Discharge Estimation by Using Altimetry Data and Simpli-
fied Flood Routing Modeling, Remote Sensing, 5, 4145–4162,
doi:10.3390/rs5094145, 2013.
Vermeulen, C. J., Barneveld, H. J., Huizinga, H. J., and Havinga,
F. J.: Data-assimilation in flood forecasting using time series
and satellite data, International conference on innovation ad-
vances and implementation of flood forcasting technology, AC-
TIF/Floodman/FloodRelief, Tromso, 2005.
Villladsen, H., Andersen, O., and Stenseng, L.: Annual cycle in
lakes and rivers from cryosat-2 altimetry – the brahmaputra
river, IEEE International Geoscience and Remote Sensing Sym-
posium (IGARSS), 13–18 July 2014, Quebec, Canada, 894–897,
doi:10.1109/IGARSS.2014.6946569, 2014.
Westahoff, R., Huizinga, J., Kleuskens, M., Burren, R., and Casey,
S.: ESA Living Planet Symposium, 686, ESA Communications,
Bergen, Norway, 2010.
Woldemicheal, A., Degu, A., Siddique-E-Akbor, A., and Hossain,
F.: Role of Land–Water Classification and Manning’s Roughness
Hydrol. Earth Syst. Sci., 19, 3755–3769, 2015 www.hydrol-earth-syst-sci.net/19/3755/2015/
Z. N. Musa et al.: A review of applications of satellite SAR, optical, altimetry and DEM data 3769
Parameter in Space-Borne Estimation of Discharge for Braided
Rivers: A Case Study of the Brahmaputra River in Bangladesh,
IEEE J. Select. Top. Appl. Earth Obs. Rem. S., 1939–1404, 395–
403, doi:10.1109/JSTARS.2010.2050579, 2010.
Yan, K., Di Baldassarre, G., Solomatine, D., and Schumann, G.: A
review of low-cost space-borne data for flood modelling: topog-
raphy, flood extent and water level, Hydrol. Process., 29, 3368–
3387, doi:10.1002/hyp.10449, 2015.
Yang, C. and Ouchic, K.: Analysis of bar morphology us-
ing multi-temporal and multi-sensor satellite images: Exam-
ple from the Han Estuary, Korea, Mar. Geol., 311-314, 17–31,
doi:10.1016/j.margeo.2012.04.004, 2012.
Zhang, J., Xu, K., Yang, Y., Qi, L., Hayashi, S., and Watanabe, M.:
Measuring water storage fluctuations in Lake Dongting, China,
by Topex/Poseidon satellite altimetry, Environ. Monit. Assess.,
115, 23–37, doi:10.1007/s10661-006-5233-9, 2006.
www.hydrol-earth-syst-sci.net/19/3755/2015/ Hydrol. Earth Syst. Sci., 19, 3755–3769, 2015