a review of capital and operating expenditure and...2020/07/01 · table 31 impact of adjustment to...
TRANSCRIPT

A review of capital and operating expenditure and
demand forecasts
A Final Report prepared for the Independent Pricing and
Regulatory Tribunal
Thursday 14 December 2019
Hunter Water expenditure review
© Aither 2019


AITHER | Final Report i
Hunter Water expenditure review
Contents
Executive summary .............................................................................................................. ix
Overview .............................................................................................................................. ix
Strategic review ................................................................................................................... ix
Capital expenditure ............................................................................................................... x
Operating expenditure ....................................................................................................... xvi
Forecast demand ................................................................................................................... i
1. Introduction ........................................................................................................................ 1
1.1. Overview ..................................................................................................................... 1
1.2. Background ................................................................................................................. 1
1.3. Review objectives and scope ..................................................................................... 3
1.4. Report outline ............................................................................................................. 5
2. Review methodology ........................................................................................................ 6
2.1. Overview ..................................................................................................................... 6
2.2. Assessment framework .............................................................................................. 6
2.3. Information sources .................................................................................................... 7
2.4. Review of strategic management ............................................................................... 7
2.5. Assessment of operating expenditure ........................................................................ 7
2.6. Assessment of capital expenditure ............................................................................. 9
2.7. Review of output measures ...................................................................................... 10
3. Strategic review .............................................................................................................. 11
3.1. Overview ................................................................................................................... 11
3.2. Policy and operating context .................................................................................... 11
3.3. Hunter Water’s strategic planning and asset management...................................... 13
3.4. Our assessment of Hunter Water’s strategic planning and asset management ...... 28
3.5. Output measures ...................................................................................................... 29
4. Capital expenditure ........................................................................................................ 41
4.1. Overview ................................................................................................................... 41
4.2. Summary of past and proposed capital expenditure ................................................ 41
4.3. Capital projects overview .......................................................................................... 45
4.4. Past expenditure ....................................................................................................... 47
4.5. Capital project review ............................................................................................... 50
4.6. Assessment of the capital expenditure program ...................................................... 57
4.7. Discretionary programs............................................................................................. 62
4.8. Overall assessment of capital program efficiency .................................................... 70
4.9. Regulatory depreciation and asset lives ................................................................... 71

AITHER | Final Report ii
Hunter Water expenditure review
4.10. Deliverability of capital expenditure .......................................................................... 78
4.11. Recommended capital expenditure .......................................................................... 79
5. Operating expenditure .................................................................................................. 85
5.1. Overview ................................................................................................................... 85
5.2. Overview of Hunter Water’s forecasting approach ................................................... 85
5.3. Hunter Water as a low-cost operator ........................................................................ 87
5.4. Past operating expenditure ....................................................................................... 88
5.5. Aither’s approach to assessing forecast operational expenditure ............................ 91
5.6. Assessment of forecast operating expenditure ........................................................ 92
5.7. Recommended operating expenditure ................................................................... 126
6. Information and Communications Technology .................................................. 131
6.1. Overview ................................................................................................................. 131
6.2. ICT strategy ............................................................................................................ 133
6.3. Recurrent ICT program assessment ...................................................................... 134
6.4. Non-recurrent ICT program assessment ................................................................ 137
6.5. Recommendations for ICT program ....................................................................... 138
7. Recycled water .............................................................................................................. 139
7.1. Overview ................................................................................................................. 139
7.2. Existing recycled water schemes and ring-fencing ................................................ 139
8. Demand forecasting .................................................................................................... 147
8.1. Overview ................................................................................................................. 147
8.2. Overview of forecasting approach .......................................................................... 148
8.3. Assessment of forecasting approach ..................................................................... 153
8.4. Summary of actual and forecasted demand ........................................................... 160
8.5. Assessment of forecasted demand ........................................................................ 173
Appendix A: Capital projects detailed review ........................................................... 177
Capital Project 1 – Chichester Trunk Gravity Main (CTGM) Replacement ...................... 177
Capital Project 2 – Dungog Water Treatment Plant Upgrades ......................................... 182
Capital Project 3 – Water Network Capacity Upgrades .................................................... 187
Capital Project 4 – Minor Wastewater Asset Renewals Program..................................... 193
Capital Project 5 - Farley Wastewater Treatment Plant Upgrade Stage 3B ..................... 200
Capital Project 6 - Wyee Backlog Sewer Program ........................................................... 205
Capital Project 7 – Treatment Plant Chemical Containment and Safety Upgrades Program ............................................................................................................................ 209
Capital Project 8 - Major Wastewater Treatment Works Upgrade Program (Other than Farley WWTP stage 3B) ......................................................................................... 215
Capital Project 9 - Stormwater Major Rehabilitation / Renewal Program ......................... 223
Capital Project 10 – Water Loss Improvement Program .................................................. 227

AITHER | Final Report iii
Hunter Water expenditure review
Tables
Table 1 Recommended capital expenditure for upcoming regulatory period ($000s, $2019-20) .............................................................................................................................. xiv
Table 2 Recommended water operating expenditure ($000s, $2019-20) ............................ xviii
Table 3 Recommended wastewater operating expenditure ($000s, $2019-20) .................... xix
Table 4 Recommended stormwater operating expenditure ($000s, $2019-20) ..................... xx
Table 5 Recommended corporate operating expenditure ($000s, $2019-20) ....................... xxi
Table 6 Hunter Water’s forecasted water sales volumes (ML) ................................................. ii
Table 7 Hunter Water’s proposed output measures ............................................................... 33
Table 8 Aither's assessment of Hunter Water’s proposed output measures ......................... 37
Table 9 Additional output measures for next regulatory period .............................................. 40
Table 10 Hunter Water’s actual and estimated capital expenditure for the current regulatory period ($000s, nominal) ............................................................................................. 41
Table 11 Hunter Water’s forecast capital expenditure for the upcoming regulatory period ($000s, $2019-20) ..................................................................................................... 43
Table 12 Rationale for selection of specific projects for review ................................................ 46
Table 13 Capital projects assessed ($000s, $2019-20) ........................................................... 47
Table 14 List of adjustments from detailed project review ....................................................... 57
Table 15 Recommended capital expenditure for discretionary programs ($000s, $2019-20) . 69
Table 16 Sewer main renewal profile comparison.................................................................... 71
Table 17 Hunter Water’s proposed RAB opening balances ($m, $2019-20) ........................... 73
Table 18 Hunter Water’s proposed corporate RAB opening balances ($m, $2019-20) ........... 73
Table 19 New asset lives by RAB categories proposed by Hunter Water ............................... 74
Table 20 Remaining asset lives of existing assets by RAB categories proposed by Hunter Water ......................................................................................................................... 74
Table 21 Proportion of forward capital program by asset class ............................................... 76
Table 22 Recommended actual capital expenditure for current regulatory period ($000s, nominal) ..................................................................................................................... 80
Table 23 Recommended forecast capital expenditure for upcoming regulatory period ($000s, $2019-20) .................................................................................................................. 81
Table 24 Recommended forecast capital expenditure by asset class ($000s, $2019-20) .......................................................................................................................... 83
Table 25 Comparison of allowed and actual operating expenditure (‘000s, $2019-20) ........... 89
Table 26 Hunter Water actual and forecast labour expenditure $m ($2019-20) ...................... 95
Table 27 Hunter Water 2017-18 restructure by division ($nominal) ......................................... 97
Table 28 Hunter Water’s budgeted historical and forecast FTE numbers ............................... 98
Table 29 Estimated actual vacancy rates ................................................................................. 99
Table 30 Capitalisation of labour over the current and forecast periods (‘000s, $2019-20) .. 100
Table 31 Impact of adjustment to the base level of labour expenditure (‘000s, $2019-20) ... 101
Table 32 Hunter Water proposed, and Aither recommended changes to forecast labour expenditure ($000’s, $2019-20) ............................................................................... 102

AITHER | Final Report iv
Hunter Water expenditure review
Table 33 Hunter Water proposed, and Aither recommended changes to forecast maintenance expenditure ($000’s, $2019-20) ......................................................... 105
Table 34 Hunter Water specified transition costs of treatment contract (‘000s, $2019-20) ... 108
Table 35 Hunter Water specified laboratory services contract procurement costs ($’000, $2019-20) ................................................................................................................ 109
Table 36 Hunter Water proposed increase in cost of monitoring activities ($’000, $2019-20) 109
Table 37 Estimated additional costs from change in demand ($’000, $2019-20) .................. 110
Table 38 Transition costs that are dependent on selected tenderer (‘000s, $2019-20) ......... 111
Table 39 Hunter Water proposed, and Aither recommended changes to forecast operations expenditure ($000’s, $2019-20) ............................................................. 112
Table 40 Hunter Water’s proposed efficiencies from electronic billing initiative (‘000s, $2019-20) ............................................................................................................................ 114
Table 41 Hunter Water proposed, and Aither recommended changes to forecast corporate expenditure (excluding ICT) ($000’s, $2019-20) ..................................... 114
Table 42 Energy efficiency initiatives (‘000s, $2019-20) ........................................................ 116
Table 43 Revised cost savings from renewable energy project (‘000s, $2019-20) ................ 117
Table 44 Forecast electricity expenditure per kWh of consumption ($2019-20) .................... 117
Table 45 Hunter Water proposed, and Aither recommended changes to forecast electricity expenditure ($000’s, $2019-20) .............................................................. 118
Table 46 Recommended ongoing efficiency adjustment for operating expenditure ($000s, $2019/20) ................................................................................................................. 125
Table 47 Recommended water operating expenditure ($000s, $2019-20) ............................ 127
Table 48 Recommended wastewater operating expenditure ($000s, $2019-20) .................. 128
Table 49 Recommended stormwater operating expenditure ($000s, $2019-20) ................... 129
Table 50 Recommended corporate operating expenditure ($000s, $2019-20) ..................... 130
Table 51 Hunter Water proposed ICT expenditure for the upcoming regulatory period ($million, $2019/20) ................................................................................................. 133
Table 52 Status of ICT projects .............................................................................................. 137
Table 53 Hunter Water’s recycled water schemes ................................................................. 140
Table 54 iSDP end-use models .............................................................................................. 149
Table 55 Regression results – mean hindcast value and climate corrected starting point .... 151
Table 56 Jacobs review of iSDP and DTM – recommendations ............................................ 152
Table 57 Calibration period sensitivities ................................................................................. 156
Table 58 Calibration period sensitivities – all bulk water model ............................................. 156
Table 59 Hunter Water’s actual/projected water connections ................................................ 162
Table 60 Variance of Hunter Water’s actual/projected water connections relative to IPART 2016 Determination (rebased) ................................................................................. 163
Table 61 Hunter Water’s forecast water connections ............................................................. 163
Table 62 Hunter Water’s actual/projected wastewater connections....................................... 164
Table 63 Variance of Hunter Water’s actual/projected wastewater connections relative to IPART 2016 Determination (rebased) ..................................................................... 165
Table 64 Hunter Water’s forecast wastewater connections (count, Meter Equivalent) .......... 165

AITHER | Final Report v
Hunter Water expenditure review
Table 65 Hunter Water’s actual/projected and forecast stormwater connections .................. 166
Table 66 Hunter Water’s actual/projected and IPART 2016 Determination forecast water sales volumes (ML) ........................................................................................................... 168
Table 67 Hunter Water’s forecast water sales volumes (ML) ................................................. 169
Table 68 Hunter Water’s actual/projected and 2016 proposed wastewater discharge volumes (ML).......................................................................................................................... 170
Table 69 Hunter Water’s forecast wastewater discharge volumes (ML) ................................ 170
Table 70 Hunter Water’s actual/projected bulk water sales (ML) ........................................... 172
Table 71 Hunter Water’s forecast bulk water sales (ML) ....................................................... 172
Table 72 Dwelling approval, new dwelling connections, and realisation rate, 2012-13 to 201819 ..................................................................................................................... 173
Table 73 Summary of CTGM Replacement .................................................................. 177
Table 74 Hunter Water Capex - Actuals (2016-20) and proposed (2021-25) ............... 177
Table 75 Options analysis for CTGM Duckenfield to Tarro (business case review) ..... 178
Table 76 Cost estimate comparison .............................................................................. 179
Table 77 Aither’s' recommended Capex for the upcoming determination period .......... 181
Table 78 Summary of Dungog Water Treatment Plant Upgrade .................................. 182
Table 79 Hunter Water Capex - Actuals (2016-19) and proposed (2019-25) ............... 182
Table 80 Options analysis for filter to waste capability project ...................................... 183
Table 81 Options analysis for chemical containment upgrade ...................................... 184
Table 82 Options analysis for switchboard replacement ............................................... 184
Table 83 Cost estimate comparison .............................................................................. 184
Table 84 Aither’s recommended Capex for the upcoming determination period ........... 186
Table 85 Summary of Water Network Capacity Upgrades............................................ 187
Table 86 Hunter Water Capex - Actuals (2016-20) and proposed (2021-25) ............... 187
Table 87 Aither’s' recommended Capex for the upcoming determination period .......... 192
Table 88 Summary of Minor Wastewater Asset Renewals Program ............................ 193
Table 89 Hunter Water Capex - Actuals (2016-20) and proposed (2021-25) ............... 193
Table 90 Aither’s' recommended Capex for the upcoming determination period .......... 199
Table 91 Summary of Farley Wastewater Treatment Plant Upgrade Stage 3B ........... 200
Table 92 Hunter Water Capex - Actuals (2016-20) and proposed (2021-25) ............... 200
Table 93 Options analysis ............................................................................................. 203
Table 94 Aither’s' recommended Capex for the upcoming determination period .......... 204
Table 95 Summary of Wyee Backlog Sewer Program .................................................. 205
Table 96 Hunter Water Capex - Actuals (2016-20) and proposed (2021-25) ............... 205
Table 97 Project cost estimate ($2017-18) ................................................................... 206
Table 98 Aither’s recommended Capex for the upcoming determination period ........... 208
Table 99 Summary of Treatment Plant Chemical Containment and Safety Upgrades Program ................................................................................................................... 209
Table 100 Hunter Water Capex - Actuals (2016-20) and proposed (2021-25) ............... 209
Table 101 Options cost analysis ...................................................................................... 210

AITHER | Final Report vi
Hunter Water expenditure review
Table 102 Options risk analysis ....................................................................................... 211
Table 103 Cost estimate comparison .............................................................................. 212
Table 104 Aither’s' recommended Capex for the upcoming determination period .......... 213
Table 105 Summary of Other Wastewater Treatment Plant Upgrade Program.............. 215
Table 106 Hunter Water Capex - Actuals (2016-20) and proposed (2021-25) ............... 215
Table 107 Major WWTP projects with proposed expenditure exceeding $10 million ..... 216
Table 108 Aither’s' recommended Capex for the upcoming determination period .......... 222
Table 109 Summary of Stormwater Major Rehabilitation / Renewal Program ................ 223
Table 110 Hunter Water Capex - Actuals (2016-20) and proposed (2021-25) ............... 223
Table 111 Summary of risk review basis for stormwater program business case expenditure .............................................................................................................. 225
Table 112 Aither’s' recommended Capex for the upcoming determination period .......... 226
Table 113 Summary of Water Loss Improvement Program ............................................ 227
Table 114 Hunter Water Capex - Actuals (2016-20) and proposed (2021-25) ............... 227
Table 115 Options analysis ............................................................................................. 229
Table 116 Aither’s' recommended Capex for the upcoming determination period .......... 231
Figures
Figure 1 Summary of key elements of Hunter Water’s 2017+3 Strategy........................ 14
Figure 2 Indicative process and timeframe for preparation of Long-Term Plan.............. 15
Figure 3 Hunter Water’s investment planning process ................................................... 18
Figure 4 Business case transition and alignment with Gateway Approval Process ....... 18
Figure 5 Example of the linkage between Strategic Cases, programs and projects ...... 19
Figure 6 Overview of Gateway Approval Process .......................................................... 20
Figure 7 Overview of investment governance ................................................................. 21
Figure 8 Overview of Hunter Water’s Enterprise Risk Management (ERM) Framework 22
Figure 9 Summary of risk appetite statements ............................................................... 23
Figure 10 Prioritisation as a stage in the portfolio definition cycle .................................... 25
Figure 11 Summary of Hunter Water’s cost estimating framework .................................. 27
Figure 12 Example outcome logic template ..................................................................... 30
Figure 13 Outcomes, Outcome measures, and Output measures ................................... 31
Figure 14 Capital expenditure by service ......................................................................... 42
Figure 15 Capital expenditure by cost drivers for current regulatory period ..................... 43
Figure 16 Capital expenditure by cost drivers for forecast regulatory period ................... 44
Figure 17 Actual and forecast capital expenditure compared to previous IPART Determination ............................................................................................................ 45
Figure 18 Comparison of asset lives ................................................................................ 75
Figure 19 Hunter Water operating expenditure budgeting process .................................. 86
Figure 20 Revised comparison of operating expenditure per property ............................ 88

AITHER | Final Report vii
Hunter Water expenditure review
Figure 21 Hunter Water’s actual operating expenditure compared to IPART 2016 Determination (‘000s, $2019-20) ............................................................................... 90
Figure 22 Hunter Water’s average operational expenditure (2016-20) ............................ 91
Figure 23 Hunter Water’s operating cost type per customer ($2019-20) ......................... 92
Figure 24 Hunter Water’s average operational expenditure (2021-25) ............................ 93
Figure 25 Comparison of actual and forecast labour expenditure by products net of capitalised labour (‘000s, $2019-20) ......................................................................... 96
Figure 26 Comparison of actual and forecast maintenance expenditure (‘000s, $2019-20) 104
Figure 27 Comparison of actual and forecast operations expenditure (‘000s, $2019-20) 106
Figure 28 Impact of variations and long-cycle preventative maintenance on operations expenditure (‘000s, $2019-20) ................................................................................. 107
Figure 29 Comparison of actual and forecast corporate expenditure (‘000s, $2019-20) 113
Figure 30 Comparison of actual and forecast electricity expenditure (‘000s, $2019-20) 115
Figure 31 Hunter Water’s proposed efficiency initiatives ($millions, $2019-20) ............. 119
Figure 32 Hunter Water operating cost per property over the regulatory periods .......... 120
Figure 33 Revised comparison of operating expenditure per property .......................... 121
Figure 34 Comparison of operating expenditure per property ........................................ 122
Figure 35 Comparison of operating expenditure per property (including ongoing efficiency) ................................................................................................................. 123
Figure 34 Actual and forecast ICT expenditure .............................................................. 132
Figure 35 Recurrent ICT expenditure over current and upcoming regulatory period ..... 135
Figure 36 Hunter Water’s proposed increases to ICT operating costs ........................... 136
Figure 37 Hunter Water proposed ICT expenditure savings .......................................... 136
Figure 39 Ring-fencing arrangements for Morpeth WWTP ............................................ 142
Figure 40 Ring-fencing arrangements for Kurri WWTP .................................................. 143
Figure 41 Ring-fencing arrangements for Branxton WWTP ........................................... 144
Figure 42 Ring-fencing arrangements for Farley WWTP ............................................... 145
Figure 43 Conceptual diagram of iSDP model ............................................................... 148
Figure 44 Annual demand comparison between old (current) methodology and DTM .. 154
Figure 45 Mean hindcast value under Model 1 and Model 2 with all bulk water included ........................................................................................................................ 157
Figure 46 Observed and predicted demand across calibration period ........................... 158
Figure 47 Observed and predicted demand across 26-07-2018 to 31-01-2019 period . 158
Figure 48 Observed, predicted, and climate corrected demand, 2001 to 2018 ............. 159
Figure 49 Dwelling forecasts (single and multi) in iSDP model, 2011 to 2050 ............... 161
Figure 50 Hunter Water (iSDP), ABS, and NSW Planning, Industry, and Environment population projection growth rates ........................................................................... 162
Figure 51 Hunter Water’s actual and forecast water connections .................................. 164
Figure 52 Hunter Water’s actual and forecast wastewater connections ........................ 165

AITHER | Final Report viii
Hunter Water expenditure review
Figure 53 Hunter Water’s actual and forecast stormwater connections ......................... 167
Figure 54 Actual and forecast water sales volumes from 2016-17 to 2019-20 .............. 168
Figure 55 Actual and forecast water sales volumes ....................................................... 169
Figure 56 Actual and forecast per capita water consumption ........................................ 170
Figure 57 Actual and forecast chargeable wastewater volumes .................................... 171
Figure 58 Growth rates of dwelling types, actual and forecast ....................................... 174
Figure 59 Number of properties experiencing low water pressure ................................. 190
Figure 60 Past and proposed expenditure for minor renewal program components ..... 194
Figure 61 Sewer breaks and chokes over time .............................................................. 195
Figure 62 Sewer main collapses ..................................................................................... 195
Figure 63 Number of sewer segments assessed with a condition rating of 4 or 5 ......... 196
Figure 64 Wastewater capital expenditure proposed for the forecast period ................. 216
Figure 66 Equivalent population load projections for Morpeth WWTP ........................... 220
Figure 66 Forecast total nitrogen loads for Farley WWTP ............................................. 221

AITHER | Final Report ix
Hunter Water expenditure review
Executive summary
Overview
Aither was engaged by the New South Wales Independent Pricing and Regulatory Tribunal (IPART)
to undertake a detailed assessment of demand and expenditure forecasts for Hunter Water’s 2020
Pricing Determination. The objectives for this review were to undertake:
• a strategic review of the utility’s long-term investment plans and asset management systems and
practices for its water and sewerage business
• a detailed review of the utility’s past and proposed operating and capital expenditures
• a review of performance against past output measures and to propose new output measures for
the next determination period if appropriate
• a review of the reasonableness of the utility’s long-term growth projections
• a review of the reasonableness of the utility’s demand and customer connection forecasts over
the 2020 determination period.
The review of Hunter Water’s past and forecast capital and operating expenditure has been based on
information provided by Hunter Water and interviews conducted with its staff. Hunter Water’s
proposed average annual operating expenditure for the next period is $157.6 million, representing an
increase on the average actual expenditure from the current regulatory period of nearly $10 million.
For capital expenditure, Hunter Water is proposing an average spend of $174.3 million, representing
an increase on the average actual expenditure from the current regulatory period of just over
$50 million. As part of this review, Aither also assessed Hunter Water’s forecast demand over the
upcoming regulatory period.
Strategic review
The main findings of our review of Hunter Water’s strategic planning are as follows:
• Hunter Water’s governance, strategic and investment planning, risk and asset management
arrangements appear robust and appropriate.
• Although these arrangements are underpinned by sound foundations, Hunter Water has also
identified and responded to a number of improvement opportunities during the period, including
the development of a four-year strategy, implementation of a more substantive Enterprise Risk
Management Framework, and refinements to cost estimating processes.
• Hunter Water aspired to develop a long-term plan in parallel, which has not eventuated. Although
the 2017+3 Strategy provides a strategic direction and a substantive list of initiatives, these will be
given greater clarity by the completion of a long-term plan. Hunter Water maintains this will be
more appropriate once the outcomes of key inputs – including their price determination and key
strategies such as the Biosolids Strategy and Lower Hunter Water Plan – are known, as well as a
permanent Managing Director appointed.
• The implementation of the ERM is indicative of Hunter Water’s maturing approach to risk
management. The framework appears appropriate and robust. However, when observing the
application of the ERM to specific projects, Aither identified some instances where the risk
assessment was not completely transparent, relied upon subjective assessment and adopted a

AITHER | Final Report x
Hunter Water expenditure review
conservative risk position that contributed to driving investment. There is an opportunity for Hunter
Water to continue to adopt greater sophistication in its consideration of risk – including more
objective methodologies – to drive more efficient outcomes in future.
• Hunter Water has recently reviewed and improved its cost estimation processes. The need for
these improvements has been observed in the course of Aither’s review. Hunter Water is still
finalising the improvements to its processes, so the success of these changes in addressing
some deficiencies in cost estimation will be observable over time.
As part of this strategic review, Aither reviewed the output measures proposed by Hunter Water for
the upcoming regulatory period. It was noted that without defined outcomes it was difficult to
determine the appropriateness of the output measures in achieving successful outcomes for
customers. In the absence of these defined outcomes, Aither proposed to maintain the proposed
output measures and targets from Hunter Water, with two additional measures (related to
discretionary projects). The additional measures are similarly based on outputs and designed to
provide a ‘safeguard’ to customers that Hunter Water will undertake the level of investment that it is
proposing.
Capital expenditure
Summary findings
Aither has identified that Hunter Water’s proposed capital expenditure for the upcoming regulatory
period is generally efficient, with some recommended adjustments to the forecasts. Additionally, the
review has found a minor adjustment is also required to Hunter Water’s 2019-20 estimated capital
expenditure for it to be deemed efficient.
As part of this review Aither has considered various factors relating to the efficiency of Hunter Water’s
capital delivery, including asset management, strategic planning, governance and risk, as well as part
of the review of individual projects and programs. In general, Hunter Water’s systems and processes
have been assessed as robust and conducive to efficient investment decision making. Aither has
made recommendations where specific issues have been identified in relation to projects or
programs.
The only broader efficiency issue that has been identified relates to the process of project scoping
and decision-making where there is a material dependency on subjective risk assessment. Aither has
identified that in some cases, a risk averse approach to project scoping and decision-making has
been adopted that has resulted in a higher-cost option being preferred. This approach may
inappropriately shift risk away from Hunter Water and onto its customer base via higher pricing to
recover the costs associated with the higher-cost option.
In relation to capital project delivery, Aither found that Hunter Water is generally considered to have
good practices that align with standard industry approaches. It has undertaken internal reviews to
ensure that outcomes for ongoing programs align with the benchmark of comparable utilities in the
water industry.
Hunter Water adopts project delivery practices that are considered reasonable to achieve optimal
outcomes for cost, typically commensurate with risk. Examples of this include:
• using consultants for concept development and pre-tender cost estimates that are independent of
contractors appointed for project delivery
• the use of design and construct contracts for major treatment works

AITHER | Final Report xi
Hunter Water expenditure review
• packaging similar works across multiple facilities into larger programs, enabling economies of
scale on material purchases and project management, but leveraging lower-margin, smaller
subcontractors for installation
• separate design and construct packages to optimise risk allowances in construction tenders.
Review of past and estimated capital expenditure for the current regulatory period
From our review of the 2015-16 to 2019-20 period capital expenditure, Aither considered most of the
expenditure to be efficient. It was noted that Hunter Water’s asset performance generally met required
service standards during the current period, however Hunter Water noted that the period also required
them to respond more quickly to general deterioration in the condition of ageing assets across their
systems.
Aither’s recommended adjustments in relation to the estimated capital expenditure for 2019-20 are:
• a deferral of $5 million from 2019-20 to 2020-21 (non-discretionary expenditure) based on Aither’s
assessment regarding limitations on Hunter Water’s capacity to deliver the substantially increased
program during the year. This deferral is based on the progress of the Farley WWTP upgrade –
while there is $14 million forecast to be invested in 2019-20, the works have only recently been
tendered and will not be awarded before January. By the time works commence, the level of
expenditure proposed will be difficult to achieve in the remaining months of the financial year.
• a reduction of $2.1 million in 2019-20 (discretionary expenditure) to reflect the movement of the
Lower Cottage Creek Stormwater Naturalisation project into the Stormwater Naturalisation
Program which will commence in 2020-21. This shift reflects delays in the Lower Cottage Creek
project and the alignment between the objectives of this project and the broader program. This
was discussed by Hunter Water during the review and subsequently proposed within its response
to IPART’s Issues Paper.
There are no other recommended adjustments for the current regulatory period.
Review of future capital expenditure
In reviewing the capital expenditure proposed by Hunter Water, Aither considered both the non-
discretionary and discretionary programs separately. The following outlines the recommendations
from our review of each of these two types of programs separately.
Hunter Water’s proposed capital expenditure (non-discretionary)
The following provides a summary of Aither’s recommended adjustments following our detailed review
of the proposed non-discretionary capital expenditure. Those projects and programs that were
deemed efficient have not been discussed in this section however detailed assessments for each of
the projects can be found in Appendix A.
Aither’s recommended adjustments are:
• Water network capacity upgrades – a reduction of $6.8 million to the proposed expenditure
based on the absence of specific evidence that would support a higher cost for existing capacity
upgrades compared to Greenfield development costs which Hunter Water state should be higher
per dwelling. The reduction is based on bringing existing network capacity upgrades in line with
the cost estimates associated with Greenfield developments.

AITHER | Final Report xii
Hunter Water expenditure review
• Minor wastewater asset renewals program:
Wastewater structures – a reduction of $6 million to align forecast expenditure with
the current regulatory period
Mechanical and electrical network and treatment assets – a reduction of 10 per cent
for each sub-program to account for less risk-averse positions that could be taken for
the outcomes of the appropriate, but subjective, risk assessment process. This
equates to $3.2 million for treatment and $2.6 million for network mechanical and
electrical assets.
• Treatment plant chemical containment and safety upgrades program – a reduction of $9
million ($4.5 million each for the water and wastewater programs) based on the adoption of a risk
averse approach that results in a higher cost than other options that adequately address the
current directives from the EPA.
• Major wastewater treatment works upgrade program – a deferral of $24 million to the
following period on the basis that there is insufficiently robust information (i.e. unconfirmed growth
driving future risk of non-compliance with licence conditions) to proceed with two of the seven
projects within the forecast period.
Following the detailed review of the capital projects, Aither has considered the appropriateness of
applying our findings across other, comparable programs within Hunter Water’s capital portfolio. The
following outlines our assessment of these similar programs where we have proposed an adjustment:
• Water treatment minor works – a reduction of $1.7 million based on an assessment that the
preferred approach was, in some instances, unreasonably risk averse and therefore imposing
higher costs. This reduction is based on the earlier assessment of the equivalent minor
wastewater asset renewals as both programs used the same analytical approach to develop
forecast costs.
• Water network (critical mains) – a deferral of $3.8 million to the next regulatory period, with the
overall expenditure (excluding investigation funding) for the program to occur in the final three
years of the upcoming regulatory period.
• Water network (minor network asset renewals):
A reduction of $1.3 million for minor mechanical and electrical network assets based
on an assessment that the preferred approach was, in some instances, unreasonably
risk averse and therefore imposing higher costs. This reduction is based on the
earlier assessment of the equivalent minor wastewater asset renewals as both
programs used the same analytical approach to develop forecast costs.
A reduction of $6.7 million for renewal of minor water structures based on the
assessment made for comparable wastewater assets. It is recommended that
forecast expenditure align with the level adopted in the current regulatory period.
Hunter Water’s proposed capital expenditure (discretionary)
In addition to the key non-discretionary expenditure that Hunter Water has proposed for the upcoming
regulatory period (see assessment above), it has also proposed two discretionary programs:
• Stormwater Naturalisation Program – an allowance to undertake a variety of stormwater
naturalisation activities throughout the upcoming regulatory period
• Recycled Water for Public Irrigation – an allowance to undertake recycled water initiatives that
are designed to provide water for irrigation of public spaces.

AITHER | Final Report xiii
Hunter Water expenditure review
The justification for both of these programs is based on the results of a willingness-to-pay study
commissioned by Hunter Water in 2018, which IPART is assessing separately.
Aither’s assessment of the efficiency of both these programs is dependent on IPART’s assessment of
the appropriateness of the willingness-to-pay study that the programs are based on. If IPART deems
that the study has demonstrated a willingness to pay from Hunter Water’s customer base, then the
proposed allowances has been assessed as efficient. However, Aither considers it important to:
• capture the programs as output measures for Hunter Water to ensure sufficient reporting on what
is being achieved from the investment (e.g. kms of naturalisation and ML of recycled water), and
• consider an ex-post adjustment mechanism for the program whereby only those investments that
meet an investment hurdle (which is aligned with results of the willingness-to-pay study) are
subsequently added to the RAB.
In the absence of such a mechanism it is not possible to state that the investment is efficient as the
forecast allowance does not reflect specific projects with pre-determined outputs or outcomes to
measure against.
By including the program as an output measure and applying an ex-post adjustment it will ensure that
the expenditure that is subsequently incorporated into the RAB is consistent with the expected
outputs from the willingness-to-pay study and therefore considered efficient.
Overall efficiency of Hunter Water’s capital program
Following the detailed review of capital projects and programs, Aither considered the efficiency of
Hunter Water’s broader capital program. This assessment considered:
• project and program planning and scoping, and
• project delivery efficiencies.
From this assessment, Aither considered that Hunter Water adopts practices that are considered
reasonable to achieve optimal outcomes for cost, commensurate with risk in relation to project
delivery. However, Aither considers that Hunter Water’s process of project scoping and decision-
making results in a level of investment that is not efficient due to a material dependency on subjective
risk assessments. Beyond the related recommendations made for specific projects and programs
above, there are several other minor programs where similar issues are likely to arise. Given this,
Aither has recommended an adjustment to the forecast expenditure for the mandatory standards
program, comprising:
• $0.2 million per annum for the water program
• $0.6 million per annum for the wastewater program
The estimation of these reductions is based on the wastewater pump station compliance
improvement, tanker receival facility upgrades, generator connection point improvement, and the
firefighting improvement programs. No further efficiency adjustment has been proposed for Hunter
Water’s capital program.

AITHER | Final Report xiv
Hunter Water expenditure review
Recommended capital expenditure
The following table presents the recommendations for the total capital expenditure for Hunter Water.
Table 1 Recommended capital expenditure for upcoming regulatory period ($000s, $2019-
20)
2020-21 2021-22 2022-23 2023-24 2024-25 Total
Hunter Water forecast of
water capital expenditure 39,202 55,346 61,401 57,832 59,609 273,389
Adjustments
Project 3 - Water network
Capacity Upgrades (1,360) (1,360) (1,360) (1,360) (1,360) (6,800)
Project 7 – Treatment Plant
Chemical Containment and
Safety Upgrades Program
(900) (900) (900) (900) (900) (4,500)
Adjustment to water treatment
minor works (340) (340) (340) (340) (340) (1,700)
Adjustment to water network
(critical mains) - - (1,900) (1,900) - (3,800)
Adjustment to minor water
mechanical and electrical
network assets
(260) (260) (260) (260) (260) (1,300)
Adjustment to minor water
structures (1,340) (1,340) (1,340) (1,340) (1,340) (6,700)
Adjustment to Mandatory
Standards Program (200) (200) (200) (200) (200) (1,000)
Sub-total recommended
adjustments (4,400) (4,400) (6,300) (6,300) (4,400) (25,800)
Total recommended water
capital expenditure 34,802 50,946 55,101 51,532 55,209 247,589
Hunter Water forecast of
wastewater capital
expenditure
118,869 83,928 85,847 74,309 61,742 424,695
Adjustments
Project 4 - Minor Asset
Renewals Programs -
Wastewater
(2,030) (2,287) (2,338) (2,594) (2,543) (11,791)
Project 7 – Treatment Plant
Chemical Containment and
Safety Upgrades Program
(900) (900) (900) (900) (900) (4,500)
Project 8 - Other Wastewater
Treatment Plant Upgrade
Program
- - - (16,238) (7,688) (23,926)

AITHER | Final Report xv
Hunter Water expenditure review
Project 5 - Farley Wastewater
Treatment Plant Upgrade
Stage 3B
5,000 - - - - 5,000
Adjustment to Mandatory
Standards Program (600) (600) (600) (600) (600) (3,000)
Sub-total recommended
adjustments 1,470 (3,787) (3,838) (20,332) (11,730) (38,217)
Total recommended
wastewater capital
expenditure
120,339 80,141 82,010 53,977 50,011 386,478
Hunter Water forecast of
stormwater capital
expenditure
3,652 2,768 4,664 5,894 6,150 23,127
No Adjustments
Total recommended
stormwater capital
expenditure
3,652 2,768 4,664 5,894 6,150 23,127
Hunter Water forecast of
corporate capital
expenditure
38,679 43,175 23,199 25,630 19,514 150,196
Adjustments
Recycled water program (960) (960) (960) (960) (960) (4,800)
Total recommended
corporate capital
expenditure
37,719 42,215 22,239 24,670 18,554 145,396
Regulatory depreciation and asset lives
Hunter Water has proposed a more disaggregated method to estimate regulatory depreciation for the
upcoming regulatory period. This investigation of a disaggregated RAB is consistent with previous
IPART decisions regarding regulatory depreciation. Through this process, Hunter Water has allocated
each of the four product categories into five classes of assets (civil, mechanical/electrical, equipment,
intangible, non-depreciating) to create 20 individual RABs (i.e. a more disaggregated RAB).
This process required Hunter Water to allocate the existing RAB within each product across each of
the asset classes and then assign asset lives (both new and existing) for each of the asset classes.
Aither considers Hunter Water’s proposed new and remaining asset lives to be appropriate, while the
proposed methodologies for disaggregating the RAB values and asset lives appear reasonable. While
we note that there are concerns regarding the integrity of the FAR, Hunter Water has demonstrated
that the errors do not result in material impacts. Given this, we consider that the proposed approach
will result in a better alignment of depreciation and asset lives than the current aggregated approach.

AITHER | Final Report xvi
Hunter Water expenditure review
As outlined above, through our review we had some concerns regarding the accuracy of the FAR.
Aither considers there are two key aspects to the current and ongoing accuracy of the FAR:
• Initial accuracy for establishing the disaggregated values, and
• Ongoing accuracy for determining the ‘remaining asset lives’ for future regulatory periods.
Based on the information provided by Hunter Water, Aither considers that the concerns that we have
regarding the integrity of the FAR are not sufficient enough to oppose the proposed disaggregated
approach. The transition to a more disaggregated RAB that is proposed by Hunter Water, while not
perfect, will result in a more economically efficient recovery of asset values than the current
aggregated approach.
Aither believes the FAR should include regular updates to reduce and extend asset lives based on
current knowledge of the asset’s condition, performance and latest expected replacement date. While
we note that the analysis provided by Hunter Water demonstrates that the existing concerns do not
currently result in material impacts within the FAR, going forward we consider that improvements in
the maintenance of the FAR are required to ensure the ongoing integrity of the model in order for it to
be used in determining regulatory asset lives.
To ensure confidence in the integrity of the FAR and how it is maintained, Aither is of the view that a
process is agreed between Hunter Water and IPART that establishes how the FAR will be maintained
over time (e.g. through the use of Hunter Water’s internal auditor) to ensure that IPART has
confidence in the integrity of the FAR in subsequent reviews and therefore avoids the need to re-
consider the FAR when using it to determine appropriate asset lives.
Operating expenditure
Summary findings
For the most part, Hunter Water was able to justify its forecast operating expenditure for the upcoming
regulatory period and relied on robust processes to determine forecast expenditure. Information was
generally well prepared and provided to Aither in a timely manner for the review. However, there were
some instances where justification of increases in expenditure was insufficient that impacted on our
assessment of the efficiency of Hunter Water’s forecast expenditure.
Our review of Hunter Water’s proposed operating expenditure has found that the majority of its
forecast operating expenditure is considered efficient. However, we have identified some areas of
forecast operating expenditure requiring adjustment in order to be considered efficient.
Review of past operating expenditure
In summary, Hunter Water overspent the allowance set by IPART’s 2016 Determination by
approximately $26.2 million (equivalent to 4.6 per cent). While actual operating expenditure in 2016-
17 is lower than the allowed operating expenditure for that year, the later years of overspend are of a
greater magnitude to result in an overall overspend. Some of the key reasons for the overspend
include:
• mitigation activities in order to address risks that were identified across the business:
including unbudgeted long-cycle preventative maintenance (LCPM) activities; a deliberate
shift from reactive to preventative maintenance in their asset management approach.

AITHER | Final Report xvii
Hunter Water expenditure review
• corporate costs as a result of higher labour expenditure to support the revised business strategy
following the business restructure during 2017-18
• energy expenditure for wastewater due to:
higher unit costs of energy following the tendering of a new electricity contract which started
in January 2018.
changes to wastewater treatment processes resulting in more energy-intensive treatment.
• expenditure in relational to external service providers
• unforeseen and uncontrollable costs.
It was noted that the primary driver behind the considerable increase within the period was within the
corporate expenditure product rather than water or wastewater. In reviewing the past operating
expenditure, Aither had some concern that the increase in 2017-18 that created a new ‘base’ level of
expenditure was not completely efficient. The assessment of the increases in expenditure over the
current regulatory period was a key focus in determining whether the forecast operating expenditure
was deemed to be efficient.
Review of future operating expenditure
Based on our review of Hunter Water’s proposed operating expenditure, Aither concludes that the
majority of operating expenditure is considered efficient and was able to be justified with
comprehensive and robust documentation from Hunter Water. Our review identified some
adjustments that we consider necessary to reflect an efficient level of forecast operating expenditure:
• reductions in labour to reflect a lower base level of labour expenditure
• reductions in operations costs relating to the sharing of risk between Hunter Water and its
customers for transition costs for both the operations and laboratory contracts
• introduction of an ongoing efficiency factor of 0.4 per cent per annum on controllable operating
expenditure to reflect future efficiency gains.
The following tables provide our recommended operating expenditure for the water, wastewater,
stormwater and corporate products for the upcoming regulatory period. In terms of the operating
expenditure related to the proposed discretionary programs, Hunter Water has indicated that it has
not sought to recover the associated operating expenditure through this process. Instead it will absorb
these cost increases within the business.

AITHER | Final Report xviii
Hunter Water expenditure review
Table 2 Recommended water operating expenditure ($000s, $2019-20)
2020-21 2021-22 2022-23 2023-24 2024-25 Total
Hunter Water proposed
water operating
expenditure
48,422 47,196 46,642 45,946 46,295 234,501
Adjustments
Changes to operations (43) (105) (23) - - (171)
Changes to energy (Hunter
Water amendment) 567 273 223 214 216 1,494
Issues paper (Hunter Water
amendment) 152 156 158 159 161 786
Sub-total recommended
adjustments 676 324 358 373 376 2,108
Sub-total recommended
water operating
expenditure
49,098 47,520 47,000 46,320 46,671 236,609
Controllable expenditure 48,604 47,026 46,506 45,826 46,177 234,139
Efficiency adjustment (0.4%
cumulative per annum) (194) (374) (554) (726) (913) (2,760)
Total recommended water
operating expenditure 48,904 47,146 46,446 45,594 45,759 233,849
Percentage change 1.0% (0.1%) (0.4%) (0.8%) (1.2%) (0.3%)
AITHER | Final Report xix
Hunter Water expenditure review
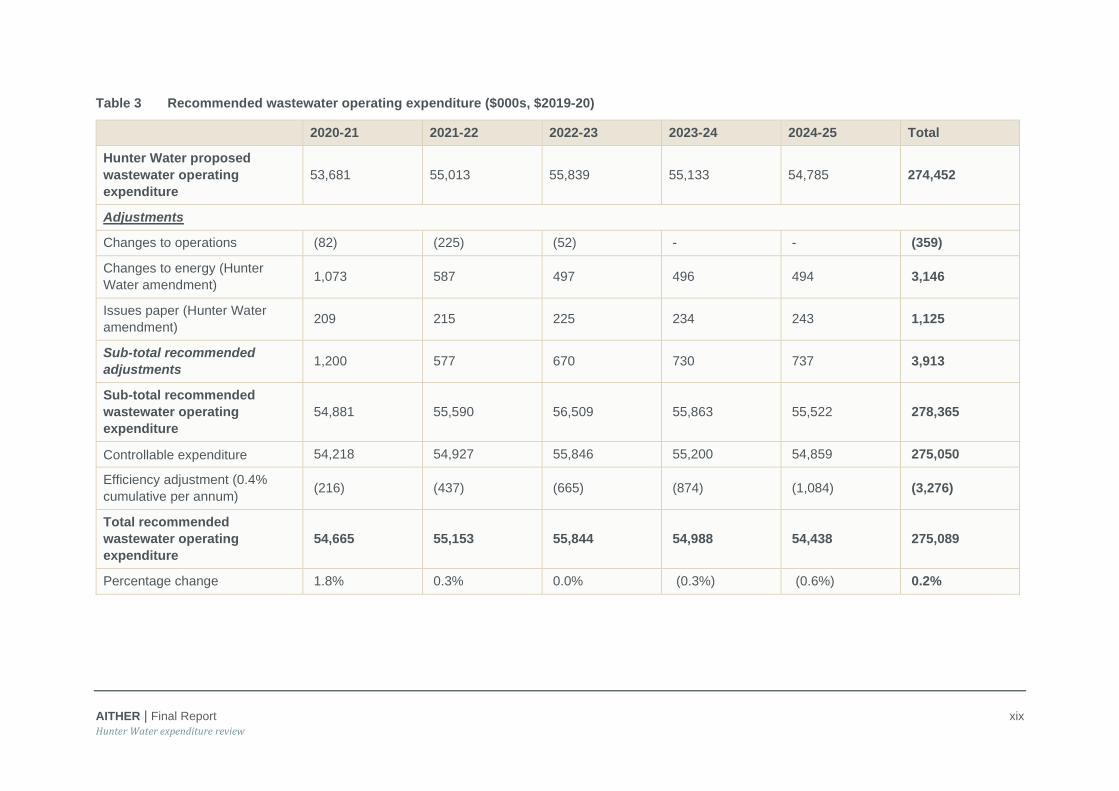
Table 3 Recommended wastewater operating expenditure ($000s, $2019-20)
2020-21 2021-22 2022-23 2023-24 2024-25 Total
Hunter Water proposed
wastewater operating
expenditure
53,681 55,013 55,839 55,133 54,785 274,452
Adjustments
Changes to operations (82) (225) (52) - - (359)
Changes to energy (Hunter
Water amendment) 1,073 587 497 496 494 3,146
Issues paper (Hunter Water
amendment) 209 215 225 234 243 1,125
Sub-total recommended
adjustments 1,200 577 670 730 737 3,913
Sub-total recommended
wastewater operating
expenditure
54,881 55,590 56,509 55,863 55,522 278,365
Controllable expenditure 54,218 54,927 55,846 55,200 54,859 275,050
Efficiency adjustment (0.4%
cumulative per annum) (216) (437) (665) (874) (1,084) (3,276)
Total recommended
wastewater operating
expenditure
54,665 55,153 55,844 54,988 54,438 275,089
Percentage change 1.8% 0.3% 0.0% (0.3%) (0.6%) 0.2%

AITHER | Final Report xx
Hunter Water expenditure review
Table 4 Recommended stormwater operating expenditure ($000s, $2019-20)
2020-21 2021-22 2022-23 2023-24 2024-25 Total
Hunter Water proposed stormwater
operating expenditure 1,159 1,197 1,190 1,172 1,180 5,898
No adjustments
Sub-total recommended stormwater
operating expenditure 1,159 1,197 1,190 1,172 1,180 5,898
Controllable expenditure 1,159 1,197 1,190 1,172 1,180 5,898
Efficiency adjustment (0.4% cumulative per
annum) (5) (10) (14) (19) (23) (70)
Total recommended stormwater operating
expenditure 1,154 1,188 1,175 1,153 1,157 5,828
Percentage change (0.4%) (0.8%) (1.2%) (1.6%) (2.0%) (1.2%)
AITHER | Final Report xxi
Hunter Water expenditure review
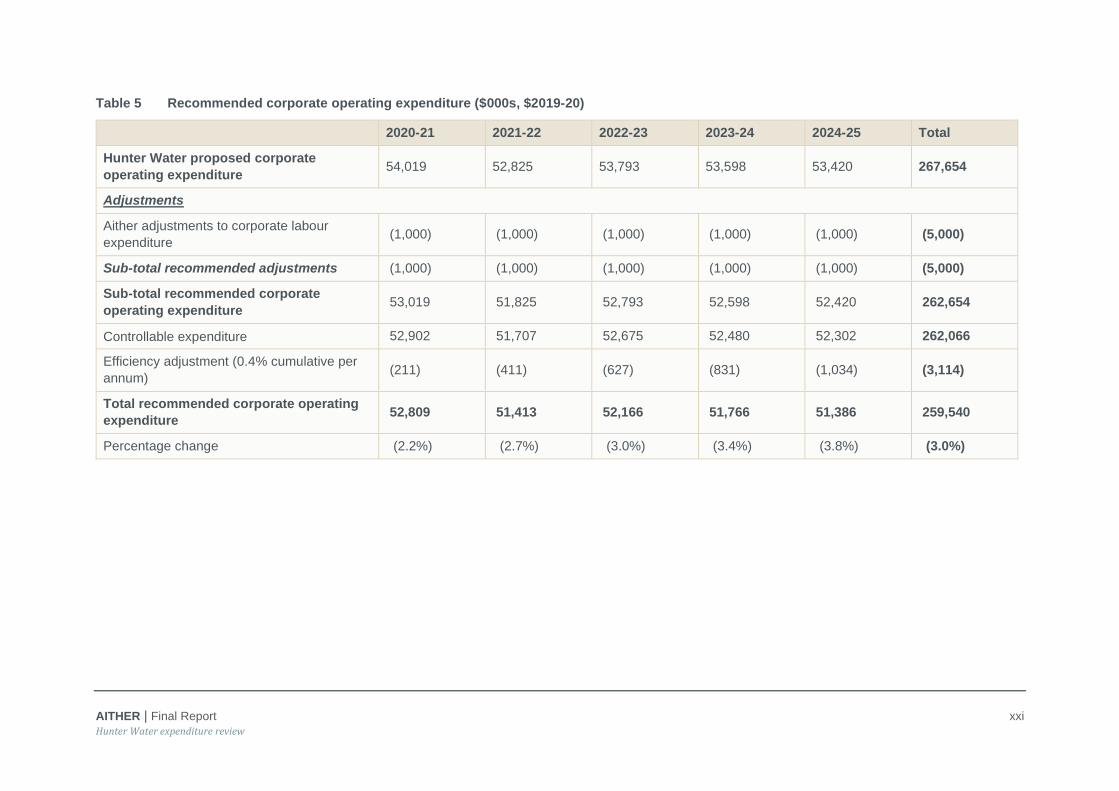
Table 5 Recommended corporate operating expenditure ($000s, $2019-20)
2020-21 2021-22 2022-23 2023-24 2024-25 Total
Hunter Water proposed corporate
operating expenditure 54,019 52,825 53,793 53,598 53,420 267,654
Adjustments
Aither adjustments to corporate labour
expenditure (1,000) (1,000) (1,000) (1,000) (1,000) (5,000)
Sub-total recommended adjustments (1,000) (1,000) (1,000) (1,000) (1,000) (5,000)
Sub-total recommended corporate
operating expenditure 53,019 51,825 52,793 52,598 52,420 262,654
Controllable expenditure 52,902 51,707 52,675 52,480 52,302 262,066
Efficiency adjustment (0.4% cumulative per
annum) (211) (411) (627) (831) (1,034) (3,114)
Total recommended corporate operating
expenditure 52,809 51,413 52,166 51,766 51,386 259,540
Percentage change (2.2%) (2.7%) (3.0%) (3.4%) (3.8%) (3.0%)

AITHER | Final Report i
Hunter Water expenditure review
Forecast demand
Summary findings
Aither considers Hunter Water’s proposed forecast sales volumes as appropriate for the upcoming
regulatory period. The methodology used to forecast demand has been updated since the initial
Pricing Submission. The latest approach uses a new climate correction methodology based on
assessing the impact of climatic condition on demand through regression analysis.
As agreed with IPART, our review of Hunter Water’s demand forecasting is less detailed than the
expenditure review. For example, we understand that Jacobs has completed an in-depth review of the
demand model and has provided Hunter Water with detailed recommendations. Our review assesses
the extent to which Hunter Water has addressed these recommendations but has not undertaken an
equivalent detailed review of the model.
Review of demand forecasting methodology
Aither has assessed two methodologies for estimating demand over the next price period:
• Integrated Supply-Demand Planning (iSDP) model with basic climate condition averaging (used to
generate demand forecasts in Hunter Water’s Technical Paper 7)
• Demand Tracking Model (DTM) that uses a climate-correcting regression approach alongside
iSDP model.
As of October,1 Hunter Water is proposing to base its demand forecasts on the DTM approach. Aither
agrees with the finding of the Jacobs review that the DTM approach improves the robustness of the
modelling results when compared to the older iSDP approach. However, there may still be potential
issues with the DTM approach that could benefit from further refinement. For example, a visual
inspection of scatter plots provided by Hunter Water comparing actual demand with modelling
demand suggests the climate correcting starting point for high consumption periods may be too low.
There are also a number of outstanding recommendations made by Jacobs that Hunter Water plans
to address in the future. These include undertaking a Hunter Region specific end-use study to
ascertain the propagation of water-efficient appliances (rather than relying on state-wide statistics).
While noting that no forecast is perfect, Aither considers the proposed DTM methodology as
representing a reasonable, objective and robust basis for estimating a climate-corrected demand
starting year and an improved methodological approach compared with those used in previous pricing
periods.
Review of demand forecasts
The following table presents Hunter Water’s forecast water sales volumes for residential and non-
residential customers over the upcoming regulatory period. These forecasts are based on the new
DTM climate-correction approach and differ from those presented in Technical Paper 7. Residential
demand forecasts gradually increase over the five-year period, however, are below consumption
levels seen in 2017/18 and 2018/19. This is because the forecasts are based on climate-corrected
demand. Non-residential demand is forecast to increase over the period also, while net sales to
1 Review of Prices for Hunter Water – Response to IPART Issues Paper. Hunter Water, 21 October 2019

AITHER | Final Report ii
Hunter Water expenditure review
Central Coast is forecast to be zero (i.e. any sales to Central Coast will be reciprocated on an
equivalent basis).
Table 6 Hunter Water’s forecasted water sales volumes (ML)
Financial year 2020-21 2021-22 2022-23 2023-24 2024-25
Residential 38,855 39,021 39,176 39,344 39,525
Non-residential (incl. Bulk
water sales) 21,520 21,790 21,956 22,201 22,460
Net Central Coast sales - - - - -
Total 60,375 60,811 61,132 61,545 61,985
Source: All data sourced from Hunter Water’s Submissions to IPART.
Aither is satisfied that the proposed water sales forecasts are a reasonable basis for the next pricing
period. These are based on a climate-corrected starting year that uses a robust methodological
approach and offers a material improvement over the old methodology. Further work is needed to
refine the inputs that underpin the new methodology. This is acknowledged by Hunter Water who
have planned a work stream to address any remaining recommendations that came out of Jacobs’
detailed demand model review.

AITHER | Final Report 1
Hunter Water expenditure review
1. Introduction
1.1. Overview
Aither, and its subcontractor Rex Dusting, were engaged by the New South Wales Independent
Pricing and Regulatory Tribunal (IPART) to undertake a review of past and proposed future water and
wastewater related capital and operating expenditure and forecast demand for Hunter Water. This
report documents the outcomes of the review and will support IPART in making its determination on
the maximum prices that Hunter Water can charge from 1 July 2020.
1.2. Background
1.2.1. Role of IPART
IPART is conferred by several pieces of state legislation to regulate the prices for government
monopoly services such as energy, public transport and water services in New South Wales (NSW).
The Independent Pricing and Regulatory Tribunal Act 1992 was amended in 1996 to establish the six
primary responsibilities for IPART. Under the Independent Pricing and Regulatory Tribunal Act 1992,
IPART is required to regulate, review and set the (maximum) prices that public water utilities may
charge for water. IPART is responsible for maintaining competitive neutrality for water utilities and
ensuring that costs which are recovered through water charges are efficient.
In order to meet its responsibilities, IPART has various review or assessment processes associated
with price determinations. One such process is independent expenditure reviews, which help
determine whether utilities have incurred or are proposing efficient costs. Expenditure reviews, which
assess capital and operating expenditure of regulated water businesses, are an input to allow IPART
to determine maximum prices.
2020 price review
IPART is conducting a review of the maximum prices that Hunter Water can charge for services
provided to its customers from 1 July 2020. The maximum prices determined by IPART for the new
determination period will cover a period of up to five years.2 The length of the determination will be
determined by IPART during the course of the review. The current price determination period for
Hunter Water commenced on 1 July 2016 and set prices until 30 June 2020 (the 2016 Determination).
1.2.2. About Hunter Water
Business overview
Hunter Water is a State-Owned Corporation (SOC) and provides drinking water and wastewater
services to approximately 250,000 residential, business and industrial customers across the Lower
Hunter region. Some recycled water and stormwater services are provided to a subset of customers.
2 The length of the regulatory period will be determined by IPART. We note that initially Hunter Water proposed a five-year regulatory period, but subsequently revised this request in its response to IPART’s Issues Paper. Aither has been requested by IPART to review the five years of information that was initially submitted by Hunter Water

AITHER | Final Report 2
Hunter Water expenditure review
Primary functions include water supply, wastewater and stormwater services to customers.
Additionally, Hunter Water provides miscellaneous, trade wastewater, recycled water and raw water
services. Hunter Water’s services, projects and activities cover 6,671 square kilometres in the areas
of Cessnock, Lake Macquarie, Maitland, Newcastle, Port Stephens, Dungog and small parts of
Singleton.
Hunter Water’s water supply infrastructure consists of:
• two dams and sand beds
• six water treatment plants
• 77 water reservoirs
• 99 water pumping stations and
• 220,000 water meters.
Hunter Water also provide an extensive wastewater (sewage) transport service, which includes
roughly 5,000 km of sewer mains and treats approximately 5,000 ML of wastewater annually,
operating 19 wastewater treatment plants. Recycled water is supplied to non-drinking purposes
including:
• Municipal use – including golf courses, a local trotting track, and the Kurri TAFE
• Industrial use – including Eraring Power Station and the Oceanic Coal Washery
• Agricultural use – including local farmers, woodlots and the effluent reuse schemes at Clarence
Town and Karuah Wastewater Treatment Works
The remainder is discharged to the environment following tertiary treatment in accordance with
licence conditions issued by the NSW Environmental Protection Authority (EPA).
Hunter Water’s miscellaneous services are generally one-off service charges such as connections
and disconnections, rectifying damaged services, plumbing inspections, site inspections and building
plan approvals. Charges for miscellaneous services are set on a cost recovery basis – based on
direct labour costs, the direct costs of materials and contractors, and indirect costs based on
overheads. Revenue from these charges makes up around 1 per cent of Hunter Water’s overall
revenue.
1.2.3. Previous expenditure review of and pricing determination
In January 2016, Jacobs completed an independent review of Hunter Water’s operating and capital
expenditure on behalf of IPART. Jacobs also reviewed Hunter Water’s proposed asset management
systems and practices. The review was an input into IPART’s 2016 price determination for Hunter
Water for the regulatory period from 1 July 2016. Jacobs review investigated past and proposed
capital expenditure, associated with regulatory periods immediately prior to 2016, and for up to 4
years from 1 July 2016.
Jacobs conclusions, findings or recommendations included:
• Hunter Water did not always demonstrate prudency, specifically where a project was not
supported by a specific IPART driver
• Appropriate options were generally considered, but in some cases the least-cost option was not
selected

AITHER | Final Report 3
Hunter Water expenditure review
• Retrospectively, some option costs were too high, when compared against Hunter Water’s
revised data and Jacobs benchmark cost estimates
• A lack of detailed business cases for some capital works programs created uncertainty regarding
whether the best option was always selected
• Jacobs did not recommend the removal of projects from the proposed capital program, but did
recommend some adjustments to the timing and costs
• Overall, Jacobs found that Hunter Water had overestimated their operating costs for the last
pricing period
• Recommendations by Jacobs included decreasing Hunter Water’s labour costs by $4.09 million;
decreasing costs for the head office associated with owning rather than leasing the building
($1.96 million); and annual productivity-based savings associated with continuing efficiencies
($1.85 million)
• In addition, Jacobs recommended that Hunter Water develop annual guidance for the (internal)
operating budgeting process that specifies the basis on which forecasts are to be established
• It was recommended that for all future ICT business cases, the consideration of additional
operating expenditure and possible efficiencies should be a mandatory part of the business case
sign-off.
1.2.4. Summary of IPART’s previous pricing determination
In relation to Hunter Water’s proposal and Jacobs review of expenditure, IPART’s determination
allowed for:3
• An operating expenditure allowance which was 1.8 per cent ($9.4 million) lower than Hunter
Water’s proposed operating expenditure over the same period considering the efficiencies and
reductions in labour and office lease costs identified by Jacobs.
• Capital expenditure that was 6.0 per cent ($23.2 million) lower than proposed by Hunter Water
over the same period, which largely reflected Jacobs’ recommendations. IPART allowed the
capital projects proposed by Hunter Water. IPART’s reductions were aimed at ensuring Hunter
Water ‘s program was prudent and delivered efficiently.
1.3. Review objectives and scope
1.3.1. Review objectives
The objectives set for this review by IPART were to undertake:
• a strategic review of the utility’s long-term investment plans and asset management systems and
practices for its water and sewerage business
• a detailed review of the utility’s past and proposed operating and capital expenditures
3 IPART, Hunter Water’s water and sewerage services Review of prices from 1 July 2014 to 30 June 2018 – Final Report, June 2014, p.4.

AITHER | Final Report 4
Hunter Water expenditure review
• a review of performance against past output measures and to propose new output measures for
the next determination period if appropriate
• a review of the reasonableness of the utility’s long-term growth projections
• a review of the reasonableness of the utility’s demand and customer connection forecasts over
the 2020 determination period, and
• targeted, written advice on expenditure issues raised in submissions to IPART’s Draft Reports for
Hunter Water (an optional task, subject to IPART confirmation following the Draft Report).
1.3.2. Scope of review
Consistent with the review objectives, the scope of work for the review covers five main areas:
strategic considerations, detailed review of operational expenditure, detailed review of capital
expenditure, review of performance against past output measures and proposal of new measures if
appropriate and review of demand forecasts.
Strategic considerations
The strategic component of the review includes consideration of Hunter Water’s investment planning,
and its asset management systems and practices. This includes reviewing medium and long-term
investments plans and strategies, and associated or supporting systems, including for asset
management.
Operational expenditure
The operational expenditure component includes reviewing the efficiency of past operating
expenditure (for the 2016 determination period) and proposed expenditure for the 2020 determination
period. This includes assessing any variance from that allowed under the 2016 determination, and
how expenditure relates to regulated services, and if it has delivered against required service
standards.
Assessment of proposed expenditure includes consideration of the level required to efficiently
undertake the regulated business, consideration of the potential for cost reductions and efficiency
gains, and the appropriateness of cost allocation methods or approaches.
Capital expenditure
The capital expenditure is informed in part by the strategic review, but also by a review of a sample of
Hunter Water’s past and proposed capital projects. The capital program as a whole is reviewed, and a
detailed investigation is made into planning and outcomes for the sample of capital projects. The
capital projects are assessed specifically in relation to efficiency. Cost allocation for capital projects,
and asset lives, are also considered.
Both past and proposed capital expenditure is considered, including whether past expenditure has
contributed to meeting standards and outcomes, and consideration of variance between actual
expenditure and that allowed under the current determination. Future expenditure is considered in
relation to what is viewed as efficient for Hunter Water to deliver its regulated business, and the
potential for efficiency savings is also considered in this context.
Output measures
Hunter Water’s performance against its output measures for the current determination period was
also considered. Recommendations were also made for output measures for the next period.

AITHER | Final Report 5
Hunter Water expenditure review
Demand forecasts
This demand review includes an assessment of the demand forecasting approach adopted by Hunter
Water, as well as a high-level summary of Jacobs’ peer review. Due to Jacobs’ recently completed
peer review, and as agreed with IPART, the review of Hunter Water’s demand forecasting is less
detailed than the expenditure review.
Reasonable demand forecasts are an important input for ensuring Hunter Water does not over- or
under-recover its required revenue. Given the inherent difficulty in forecasting an uncertain future it is
unlikely that Hunter Water can perfectly forecast the level of customer demand over the next five-
years. The objective is therefore to produce a forecast that minimises the level of over- or under-
recovery. The demand review focuses on; 1.) areas of significance (e.g. material to price changes);
2.) the justification for input assumptions; and 3.) the approach to managing inherent uncertainties.
1.4. Report outline
The report is broadly structured to align with the objectives and scope of work, in addition to further
detailed requirements set by IPART. Specifically:
• This Section 1 provides background on IPART and its role, that of Hunter Water, and the
objectives and scope of this review.
• Section 2 outlines the methodology and associated considerations for the review.
• Section 3 documents the results of the strategic assessment component of the review, including
planning and strategic management systems, processes and documentation. The section also
considers performance against output measures.
• Section 4 documents the analysis, findings and recommendations associated with past and
proposed capital expenditure, including in relation to a sample of capital projects (detailed project
information is contained at Appendix A).
• Section 5 documents the results of the operating expenditure review, including past and
proposed expenditure.
• Section 6 documents our assessment of both the operating and capital expenditure for
Information and Communications Technology.
• Section 7 documents our assessment of Hunter Water’s ring-fencing processes for recycled
water schemes.
• Section 8 provides our assessment of Hunter Water’s demand forecasting methodology.
• Appendix A contains detailed summaries of the reviews undertaken of capital expenditure
projects and programs.

AITHER | Final Report 6
Hunter Water expenditure review
2. Review methodology
2.1. Overview
The overall approach to delivering the review involved four phases, as follows:
• Initiation – gathering initial documentation, and selecting capital projects for review
• Information discovery – reviewing available information, developing and submitting further
information requests, confirming the evaluation criteria and approach, and undertaking meetings
or interviews with Hunter Water staff
• Analysis and review – completing analysis in support of the major components of the review,
follow up information requests, and consolidation of findings across review elements
• Reporting – documenting the results of the analysis and review (this report).
The methodology was designed to assess:
• the extent to which strategic and capital planning, and asset management systems are conducive
to ensuring efficient expenditure
• the efficiency of operational and capital expenditure
• the appropriateness of demand forecasts, and
• progress against agreed output measures.
The review was undertaken from July to November 2019, with visits to Newcastle to meet with Hunter
Water staff in August and October 2019.
2.2. Assessment framework
The framework for assessment of expenditure under this review is based on the efficiency test as
required by IPART. Application of this test in relation to each of the review elements is explained
further below, but the terms are defined here.
Efficiency test
IPART’s efficiency test considers both how the investment decision is made, and how the investment
is executed, having regard to, amongst other matters, the following:
• Customer needs, subject to the utility’s regulatory requirements
• Customer preferences for service levels, including customers’ willingness to pay
• Trade-offs between operating and capital expenditure, where relevant
• The utility’s capacity to deliver planned expenditure
• The utility’s expenditure planning and decision-making processes.

AITHER | Final Report 7
Hunter Water expenditure review
2.3. Information sources
The major information sources that have informed the review include:
• the Annual Information Return / Special Information Return, prepared by Hunter Water and
provided by IPART
• the Hunter Water pricing submission to IPART, including technical papers attached to the
submission
• various documentation supplied by Hunter Water, and
• the results of discussions with Hunter Water staff.
2.3.1. Hunter Water interviews
Through the review it should be noted that Hunter Water was well prepared for the interviews and
willing to provide as much assistance as possible throughout the review. This was able to assist
Aither in understanding the detail of Hunter Water’s submission and the assumptions that
underpinned the forecasts.
2.4. Review of strategic management
The review of strategic management was primarily undertaken on a qualitative basis, and focused on
Hunter Water or NSW Government policy, regulatory and planning matters that may be driving
decisions, investments, and processes within Hunter Water. Aither considered:
• planning matters, including in relation to long-term supply and demand and other long-term
strategic considerations that may influence large capital investments
• Hunter Water’s capital investment strategy, including over short and longer-term horizons, and
alignment, risks and efficiency of the strategy
• Hunter Water’s approach to asset management including whole of lifecycle planning, risk, asset
condition assessment and reporting, asset life, and similar matters, and
• systems or processes associated that may have a bearing on the efficiency of decisions, including
risk management, procurement, project management, and others.
2.5. Assessment of operating expenditure
2.5.1. Overview
To provide sufficient depth of analysis in support of any findings in relation to the efficiency of the
proposed operating expenditure, Aither sought to first understand, and then critique, the methodology
and underlying assumptions adopted by Hunter Water to establish their forecasts. As a result, Aither
focused on:
• understanding the factors driving Hunter Water’s future costs, and
• ascertaining the assumptions and methodologies Hunter Water adopted to translate those cost
drivers into an operational expenditure forecast.

AITHER | Final Report 8
Hunter Water expenditure review
Having regard to the above, our assessment of the efficiency of Hunter Water’s operating expenditure
involved the following tasks, amongst other things:
• Reviewing Hunter Water’s regulatory submission to identify key forecasting issues and
assumptions.
• Providing Hunter Water with a detailed questionnaire related to their operating expenditure
forecasts. Amongst other things, this initial questionnaire addressed:
- the methodology Hunter Water used to develop its operational expenditure forecasts – so that
Aither could better understand Hunter Water’s overarching forecasting methodology
- cost allocation methodology – so that Aither could better understand how costs are allocated
between services
- escalators and growth drivers – so that Aither could understand how Hunter Water has
escalated its forecasts over the period covered by the regulatory submission to account for
potential changes in the real cost of labour, materials and electricity costs, as well as changes
in the underlying drivers of those costs
- capitalisation policy – to ensure that Hunter Water has not included in its operational
expenditure forecasts, the labour costs that it expects to capitalise over the regulatory period
(i.e. to ensure there is no double counting)
- cost reductions and efficiencies – to better understand how Hunter Water’s operating
expenditure forecasts include, either directly or indirectly, allowances for on-going productivity
improvements.
• Conducting interviews with Hunter Water to discuss their operational expenditure forecasts.
2.5.2. Assessment of operating expenditure
Hunter Water developed ‘bottom-up’ forecasts for operating expenditure each year rather than using a
‘top-down’ approach of establishing a base year and identifying step changes to the base year. Given
this, rather than considering the overall level of operating expenditure, we have broken down the
operating expenditure into the following key cost categories:
• Labour expenditure
• Maintenance expenditure
• Operations expenditure
• Corporate expenditure (exc. ICT)
• Electricity expenditure
• Other on-going operational expenditure costs
• On-going productivity and efficiency improvements.
For each of these cost categories, the forecast expenditure was assessed against the historical levels
of expenditure for that particular cost category. This is a more granular approach to the ‘base year’
approach as it requires a more holistic consideration of the base level of expenditure over the current
regulatory period for each of the cost categories.
To assess the efficiency of the forecast operating expenditure, the review considered:
• Comparisons with actual expenditure for each of the cost categories

AITHER | Final Report 9
Hunter Water expenditure review
• Variations in units and/or prices within the bottom-up models
• Cost estimation processes (to determine how accurate previous budgets were with actual results
and how they influenced forecasts), and
• Procurement processes (which help ensure efficient levels of costs are incurred).
2.6. Assessment of capital expenditure
2.6.1. Overview
An assessment was made to determine the efficient capital expenditure (as compared to actual and
proposed capital expenditure) as is further detailed in Section 4 of this report. The assessment of
efficiency of Hunter Water’s capital expenditure was based on understanding, and then critiquing, the
methodology, underlying assumptions and models that were used to establish capital expenditure
forecasts. This was given effect through the following tasks:
• desktop review of information provided by Hunter Water including AIR/SIR, policies and
procedures, strategies, and documentation relating to individual projects or programs
• desktop review of information found in the public domain
• meeting with key Hunter Water staff to discuss key issues in relation to a number of individual
capital projects selected for detailed review and the broader capital program
• further desktop review of documentation provided by Hunter Water following these interviews
• assessment of the efficiency of the sample capital projects, including drawing on the professional
judgement of our team’s experienced water infrastructure engineer Rex Dusting in relation to the
efficiency of proposed capital expenditure
• assessment of the efficiency of the overall portfolio of actual and proposed capital expenditure,
considering whether the findings of the review of sample projects and programs indicate any
systemic inefficiencies.
With respect to making an assessment of past expenditure the approach was to gain a view as to
whether there is any evidence of systemic inefficiencies. This was carried out by reviewing how
decisions were made on individual projects, what actual spending was compared to budget, and
whether project outcomes were actually realised. The approach was that should any expenditure be
found to have been clearly inefficient, a recommendation would be made to not allow part or all of that
expenditure.
For future expenditure the approach was similar though it was more focused on individual projects
than at a portfolio level. However, Aither also considered if it is appropriate to apply a global reduction
in Hunter Water’s forecast capital expenditure as a result of systematic inefficiencies or deliverability
concerns.
2.6.2. Assessment of capital projects
An assessment was carried out of selected capital projects and programs against IPART’s efficiency
test. This was carried out by a combination of a desktop review of documents obtained as part of the
strategic review, desktop review of documentation specific to each project, and meetings with Hunter
Water staff.

AITHER | Final Report 10
Hunter Water expenditure review
As outlined above, the efficiency test considers both how the investment decision is made, and how
the investment is executed. To apply this test, our assessment has considered, for example, whether:
• a complete set of options has been considered or alternative options were identified that were not
considered
• the scope of work is appropriate to meet the need, and the standard of work is appropriate
• unit costs are based on market rates or otherwise shown to be efficient; costs are benchmarked;
or, efficiency savings are recommended, and
• synergies with other projects were considered.
2.7. Review of output measures
The review of outputs was undertaken by reviewing information in the Hunter Water pricing
submission. Further to this, an information request to Hunter Water asked:
• that evidence be provided to substantiate performance against specified service standards during
the 2016 determination period, and
• for an explanation of variances in actual performance over time.
Information provided by Hunter Water on service standards was subsequently assessed, including in
the context of the overall capital and operational expenditure review.

AITHER | Final Report 11
Hunter Water expenditure review
3. Strategic review
3.1. Overview
The extent to which Hunter Water makes efficient capital investment and operating decisions is partly
driven by its policy and operating context, including obligations placed upon it. It is also driven by its
approach to strategic management of its assets and the business more broadly, including its strategic
objectives, corporate management, and delivery systems.
This section considers the policy and operating context of Hunter Water, and a range of corporate and
management systems that are used to guide capital and operating spending and management
decisions. While not a sufficient condition, the existence and use of effective strategic, corporate and
management systems is a necessary condition to achieving efficient capital and operating
expenditure.
3.2. Policy and operating context
The Lower Hunter region is the seventh largest urban area in Australia and is home to over half a
million people. Hunter Water has provided a reliable supply of water to the Lower Hunter region for
over 120 years. Hunter Water’s major sources of water are Chichester Dam and Grahamstown Dam,
both man-made and historically reliable water storage systems.
IPART issues and regulates the provision of Hunter Water’s Operating License. Hunter Water's
current Operating Licence came into effect on 1 July 2017 and expires on 30 June 2022. Hunter
Water’s previous license was in force from 1 July 2012 to 30 June 2017. New Operating Licences are
only issued after a comprehensive public review of a water utilities previous licence by IPART. Hunter
Water's operations are also audited on an annual basis. Hunter Water’s performance against their
service standards and other conditions of their Operating Licence are assessed independently via
such an audit. IPART is also responsible for the annual operational audit and periodic reviews of the
Operating Licence.
In addition to IPART regulations, Hunter Water is also required to comply with the following
institutional or regulatory arrangements:
• Department of Industry (Water) – which administers ministerial approval for construction works
under the Water Management Act 2000; oversees the performance of local water utilities; and
publishes annual benchmarking of performance for NSW water utilities
• Dams Safety Committee – which ensures the safety of dams and maintains surveillance of
prescribed dams
• NSW Health – which is responsible for regulating the quality and safety of drinking water
• NSW Environment Protection Authority – which is responsible for licensing and monitoring of
discharges from sewerage systems under the Protection of the Environment Operations Act 1997
• Natural Resource Access Regulator – a newly formed regulator that is responsible for compliance
and enforcement of natural resources management legislation.

AITHER | Final Report 12
Hunter Water expenditure review
3.2.1. Lower Hunter Water Plan
The Lower Hunter Water Plan (the Plan) sets out how the Lower Hunter region will continue to ensure
its urban water security. It includes actions to supply, save and substitute water, as well as additional
measures to respond to the prospect of drought in the future. The first version of the Plan was
developed in 2014 by the New South Wales Government’s Department of Finance and Services, in
collaboration with Hunter Water and with input from stakeholders.
The Plan includes a number of actions on both the supply and demand sides of the urban water
supply balance. The New South Wales Government’s Department of Industry conducts an annual
review of the Plan to evaluate its implementation against these actions.
Actions on the supply side include:4
• Manage existing surface and groundwater sources to optimise supply from Chichester Dam,
Grahamstown Dam, Tomago Sandbeds and Tomaree Sandbeds
• Transfer water between Hunter Water and the Central Coast supply systems via an existing
pipeline (and transfer agreement)
• Increase the transfer capacity from the Central Coast to Hunter Water
• Improve modelling tools to optimise water transfer arrangements between the two regions
• Undertake 'readiness activities' for drought-response desalination if needed in a drought (such as
construction of the Belmont temporary desalination plant).
Actions on the demand side include:
• Reduce demand through leak detection and pressure management, and water efficiency
programs for households and businesses
• Undertake measures during drought as water storage levels fall, such as applying water
restrictions
• Implement water recycling, such as the Kooragang industrial and Gillieston Heights/Chisholm
schemes, to reduce the demand on the drinking water supply system
• Install rainwater tanks under the NSW Government's Building Sustainability Index (BASIX) rules
to reduce demand on the drinking water supply system.
The Plan is currently being updated. IPART and Aither were provided with an overview of the status
of the update process in a teleconference with representatives from the New South Wales
Department of Planning, Industry and Environment in October 2019.
The updated Plan is scheduled for completion in 2021, which is later than anticipated but reflects the
time and effort allocated to key elements of the update, including:
• peer review of both demand and supply-side models
• comprehensive options analysis, including both drought response (short-term) and longer-term
supply augmentation options.
Given the level of supply security identified at the time, the 2014 Plan had a focus on drought-
response options. The update to the Plan will supplement this with more substantive consideration of
4 Hunter Water, Lower Hunter Water Plan webpage, https://www.hunterwater.com.au/Water-and-Sewer/Water-in-the-Lower-Hunter/Lower-Hunter-Water-Plan.aspx.

AITHER | Final Report 13
Hunter Water expenditure review
the next major supply-side augmentations to maintain longer-term water supply security. This will
include consideration of the triggers for the implementation of both short-term and long-term
responses.
As a key stakeholder in the Plan, Hunter Water is contributing to various aspects of the process to
update the Plan by 2021. This includes works to identify and assess potential sites for future long-
term augmentations (such as dams and desalination), as well as development of a decision-making
framework to inform option assessment. The process includes extensive community, customer and
stakeholder consultation.
Current drought conditions have necessitated the implementation of some of the drought response
measures identified in the 2014 Plan. In the short-term, there is the possibility that worsening drought
conditions could see further measures implemented, including the drought response desalination
plant. Hunter Water is progressing the planning approvals for the plant so that it could be built quickly
and supplement the region’s water supply, should the worst-case eventuate.
For Hunter Water, the implications of continuing drought for the forecast regulatory period include:
• the risk that declining water storage levels prompt short-term responses that have unplanned
implications for revenue (such as water restrictions) or costs (such as temporary supply
augmentations)
• continuing to contribute to the development of the Plan, primarily in the form of ongoing strategic
and concept planning, as well as stakeholder engagement and consultation
• responding to the outcomes of the new Plan when completed in 2021, potentially including
sufficient planning and design work to inform subsequent pricing submissions.
3.3. Hunter Water’s strategic planning and asset management
As part of the scope for the review, we have reviewed Hunter Water’s strategic planning and asset
management frameworks. To undertake this assessment, we have considered:
• long-term strategy
• investment planning and governance
• asset management systems
• enterprise risk management framework
• investment prioritisation
• cost estimation, and
• procurement.
The following provides a summary of our assessment against each of these elements.
3.3.1. 2017+3 Strategy
Hunter Water’s 2017+3 Strategy (the Strategy) outlines its approach to developing a Long-Term Plan
(LTP), intended to come into effect with the outcome of the price determination process in 2020. The
Strategy (key elements of which are summarised in Figure 1):

AITHER | Final Report 14
Hunter Water expenditure review
• articulates Hunter Water’s vision, purpose and values
• identifies strategic drivers – the key challenges and opportunities that will drive Hunter Water’s
strategic and planning response
• establishes the aspirational goals of the LTP, and identifies the strategic priorities and shorter-
term strategic initiatives that will support its development.
Source: Aither, based on Hunter Water’s 2017+3 Strategy
Figure 1 Summary of key elements of Hunter Water’s 2017+3 Strategy
The indicative three-year timeframe of the Strategy set an ambitious program to: deliver a wide range
of strategic initiatives to inform the longer-term direction; test the emerging plan with customers and
stakeholders; prepare the pricing proposal; then review and refine the LTP based on the outcomes of
the final price determination. Hunter Water’s pricing proposal indicates that the Strategy represents a
considered shift towards investing more time and effort in long-term business planning. It also
acknowledged that the program for preparing the LTP would necessarily be dynamic and iterative to
accommodate the findings of investigations and community feedback.
A broad representation of the three-year program that was proposed is summarised in Figure 2.
However, although the Strategy remains the basis for the business’ overarching strategic direction –
and a three-year internal plan has been initiated to implement it – Hunter Water advised that it has not
yet prepared the LTP as articulated in the Strategy. The Pricing Submission (and associated
Technical Papers) remain the most recent and public confirmation of Hunter Water’s direction and
intended investment, with the expenditure informed in part by some of the shorter-term initiatives
outlined in the Strategy.

AITHER | Final Report 15
Hunter Water expenditure review
Source: Aither, based on information from Hunter Water
Figure 2 Indicative process and timeframe for preparation of Long-Term Plan
In addition to a focus on developing a deeper understanding of customer and community
expectations, another key feature of the Strategy is the large number of shorter-term strategic
initiatives aligned with each of the Strategy’s strategic priorities. The initiatives are indicated as
foundational to the longer-term direction, many of which are delivering changes to the business as
well as comprising investigations to inform the LTP. There are also a number of initiatives that were
explicitly identified to help inform the pricing proposal. This includes, for example:
• a Biosolids and Renewable Energy Strategy to define the strategy for reducing carbon emissions
and generating renewable energy
• a Sustainable Wastewater Strategy to define the long-term strategy for wastewater system
performance and recycled water management
• preparation (in partnership with DPI) of the Lower Hunter Water Plan, to define the long-term
strategy for water security and drought response
• a Service Level Strategy to define whether changes to current levels of service are justified based
on cost and customer and community engagement.
Given the breadth and extent of the Strategy, Hunter Water indicated that it intends to develop a long-
term plan when:
• the outcomes of the price determination process are known

AITHER | Final Report 16
Hunter Water expenditure review
• further key strategic investigations are completed by the water resilience team (including the
Lower Hunter Water Plan) and sustainable water team (including the biosolids and renewable
energy strategies)
• a permanent Managing Director is appointed.
Hunter Water also noted improvements to investment management processes that are currently being
implemented (including the development of strategic cases, discussed in Section 3.3.2 below), which
will help inform a consolidated portfolio view of the capital program as part of the LTP.
The delivery of a clear strategy reflects good practice and provides a sound basis for Hunter Water’s
strategic direction, planning and proposed investment. The outcomes of this process have led to the
identification of five priority areas that are identified in Hunter Water’s pricing proposal:
1. Using the Enterprise Risk Management Framework to target investment
2. Managing water as a precious resource
3. Understanding customers’ values, preferences and priorities
4. Striving for productivity and efficiency gains
5. Catch-up investment in IT to improve business productivity and interact with customers.
These priorities have further concentrated a focus in three core service areas:
• water resilience – particularly leakage reduction and efforts to reduce demand
• energy efficiency projects – including expenditure on renewable energy generation, energy
efficiency and alternative procurement models
• biosolids management – investigating long-term opportunities to centralise biosolids treatment,
reduce (or recover) energy, and mitigate the risk associated with tightening environmental
compliance and current disposal options.
Aither assessment
Hunter Water’s 2017+3 Strategy set an ambitious program of initiatives to inform its long-term plan
and pricing proposal. In this respect it reflects the implementation of a clear, proactive and rigorous
framework for strategic planning, which underpins and supports the business’ resulting focus areas.
The strategic drivers identified by Hunter Water are consistent with those observed across the
industry, and the strategic priorities reflect a sound response with a comprehensive, if not ambitious,
program of initiatives.
Despite its three to four-year duration, the ambition of and program for the Strategy may have put
pressure on Hunter Water to synthesise and consolidate the findings of its many investigations within
a relatively short timeframe. This includes the stated intent to iteratively develop and refine, often in
parallel, its pricing proposal and long-term plan – as well as interfacing with other inputs, such as the
revision of the Lower Hunter Water Plan.
However, it is evident that, despite the Strategy’s indication that a long-term plan would be prepared
at this point, this was overly ambitious. Nonetheless, the reasons indicated by Hunter Water for the
delay to the LTP are reasonable and valid – including the legitimate consideration that a new
Managing Director should expect to contribute to shaping the longer-term direction of the business.

AITHER | Final Report 17
Hunter Water expenditure review
Given the extent of the actions proposed in the Strategy itself, the failure to deliver on the ambition to
have a long-term plan in place does not undermine the clarity of Hunter Water’s strategic direction or
the basis for its proposed expenditure. It would have been inefficient to pursue the original timeline for
the long-term plan if the necessary inputs were not complete. However, some of those inputs –
especially the Biosolids Strategy, for example – remain consequential for proposed investment in the
forecast regulatory period, given that there are examples of substantive works to address
performance deficiencies that should align with longer-term management plans.
The process of preparing and implementing the Strategy demonstrates Hunter Water’s mature and
evolving approach to strategic and long-term planning. It provides a framework for establishing and
implementing a sound long-term plan, as well as refining subsequent strategic planning cycles with
the benefit of experience from the Strategy’s implementation.
3.3.2. Investment planning and governance
The Strategy provides the overarching direction for Hunter Water’s investment planning process,
which the business represents as illustrated in Figure 3. This representation provides an indication of
the comprehensive and detailed framework that Hunter Water has in place to identify, inform and
determine its investment priorities. At the centre of this framework is the business’ Enterprise Risk
Management (ERM) system. The introduction of the ERM reflects a material change in Hunter
Water’s operation since its last price determination, and is discussed further below.
In addition to the various interfaces with key systems and processes – such as, for example, asset
management, growth planning and procurement – Figure 3 is also broadly indicative of the way in
which Hunter Water progresses from strategy to investment decision-making. This is described as
including:
• Setting objectives and drivers
• Decision-making to achieve objectives
• Prioritisation
• Delivery and control of investment
• Performance assessment (benefits realisation) to ensure that proposed investments deliver the
planned benefits.

AITHER | Final Report 18
Hunter Water expenditure review
Source: Hunter Water
Figure 3 Hunter Water’s investment planning process
To better align its investment programs – recognising the inter-relationships and integrated benefits
across projects – Hunter Water is transitioning to the application of Strategic Cases, within which
programme business cases, then individual project business cases are nested (see Figure 4, which
also illustrates the alignment between business case progression and the gateway approval process).
Source: Hunter Water
Figure 4 Business case transition and alignment with Gateway Approval Process
The Strategic Cases – of which nine are currently identified – should demonstrate the case for change
by articulating the problem or opportunity, the current risks relative to the Board’s risk appetite, the
benefits desired of investment, and the strategic response proposed. Once this high-level need and
response is established through the Strategic Case, investment program business cases would
typically follow as a basis for seeking to allocate expenditure to a range of projects (to be delivered in
tranches over time) that aim to achieve common objectives.
An example of the relationship between a Strategic Case, programs and individual projects is
provided in Figure 5.

AITHER | Final Report 19
Hunter Water expenditure review
Source: Aither, based on information provided by Hunter Water
Figure 5 Example of the linkage between Strategic Cases, programs and projects
The Gateway Approval Process governs the progression and prioritisation of business cases. This
process provides formal points (gates) at which key information is reviewed and decisions are made,
which ensures that projects or programmes are continually reassessed throughout their lifecycle and
proposed investment remains efficient. As the basis for decision-making, business cases are a critical
part of the process. Hunter Water has adopted aspects of the Better Business Case investment model
to improve the efficiency and robustness of business case preparation.
An overview of the Gateway Approval Process is provided in Figure 6. Projects with approved
business cases join the capital portfolio, which is managed in accordance with a detailed capital
portfolio management framework. The framework (and associated guidelines) outline the various
processes, documents and guidance that supports investment and portfolio management. Central to
this are the governance arrangements that are in place to ensure that investments are strategically
aligned, appropriate and delivering the best value for customers.

AITHER | Final Report 20
Hunter Water expenditure review
Source: Aither, based on information from Hunter Water
Figure 6 Overview of Gateway Approval Process
Investment decisions progress through a number of steps, including key committees (summarised in
Figure 7), which collectively provide direction to and governance of the capital portfolio and its
projects. In particular, the:
• Management Investment Committee provides oversight of, and makes decisions on, all major
financial commitments and undertakings, with a purpose, objectives, duties and responsibilities
that are set out in the Investment Committee Charter
• Board Investment Committee has a number of objectives that it must achieve to fulfil its purpose
to assist the Board of Directors in meeting their responsibilities
• Procurement Committee independently reviews all major procurement activity to ensure
outcomes are aligned with the organisation’s strategic and operational objectives
• Investment and Innovation Management Committee has been established to provide strategic
oversight and make decisions on major infrastructure delivery issues
• Asset Provision Steering Committee critically assesses price path provisions (PPPs), ensures
financial compliance, and explores options to defer or modify business case scope to release
capital that could mitigate potential cost increases elsewhere in the program or portfolio.

AITHER | Final Report 21
Hunter Water expenditure review
Source: Hunter Water
Figure 7 Overview of investment governance
Aither assessment
Hunter Water’s framework for investment planning and governance is comprehensive and mature.
Key aspects – such as the Gateway Approval Process and the approach to business cases – are
modelled on best practice or appropriate standards, while the existence and purpose of multiple
committees supports robust interrogation of business cases throughout their lifecycle.
It is noted that Hunter Water is still transitioning to the implementation of Strategic Cases as a basis
for aligning programs (and projects) that support common objectives. Whilst sound, it will be important
to monitor the extent to which this leads more effectively to identifying optimal project selection. In
particular, it may be necessary to ensure that the process does not preclude revisiting the proposed
strategic interventions or responses, if priorities change or new information suggests an alternative
approach. Similarly, it is important to ensure that viable project options are not prematurely eliminated
as a result of comprising part of a program that is not selected. In general, however, the stages and
requirements of the framework should provide a basis for iterative decision-making that addresses
this risk.
3.3.3. Enterprise Risk Management Framework
Hunter Water undertook a comprehensive review of its Enterprise Risk Management (ERM)
Framework during the current regulatory period, which has driven a re-assessment of investment
priorities and underpinned substantial investment proposals in some areas. A conceptual overview of
the ERM Framework is illustrated in Figure 8, which broadly reflects the following considerations
when informing decisions:
• What is the current risk position?
• What is the target set by risk appetite statements?
• Is there a gap, and if so, what is required to close it?
• What is needed to monitor agreed actions and trends?
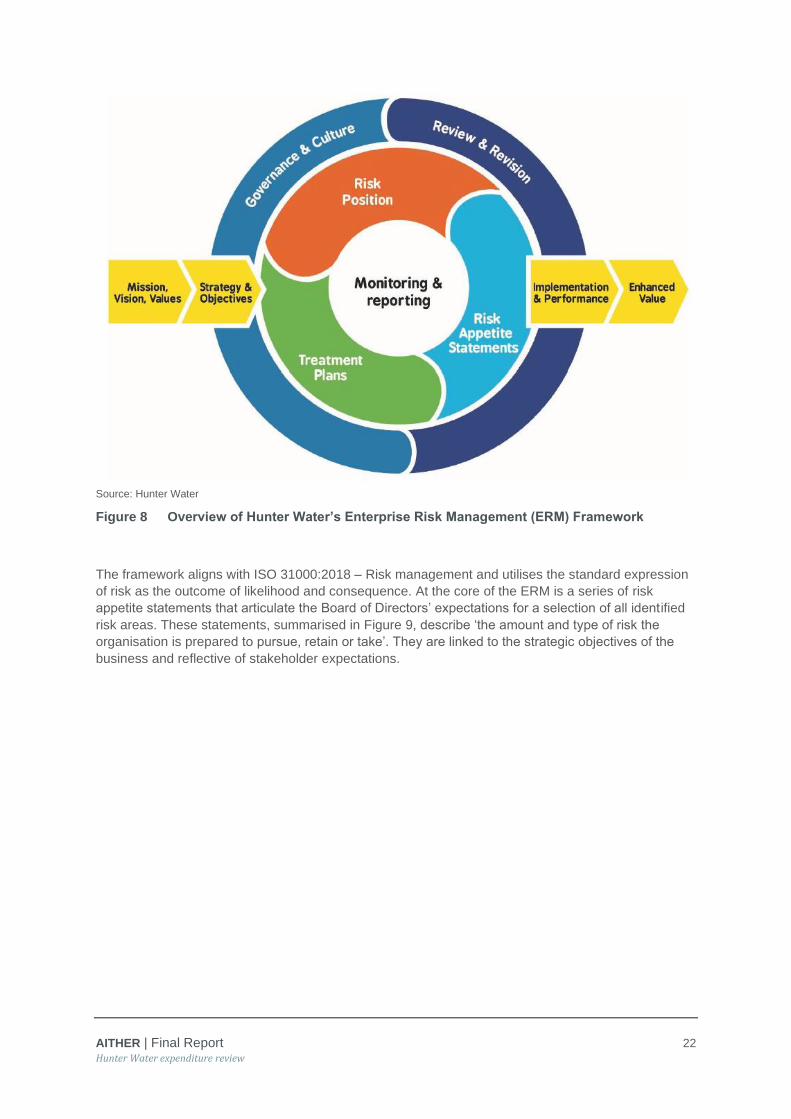
AITHER | Final Report 22
Hunter Water expenditure review
Source: Hunter Water
Figure 8 Overview of Hunter Water’s Enterprise Risk Management (ERM) Framework
The framework aligns with ISO 31000:2018 – Risk management and utilises the standard expression
of risk as the outcome of likelihood and consequence. At the core of the ERM is a series of risk
appetite statements that articulate the Board of Directors’ expectations for a selection of all identified
risk areas. These statements, summarised in Figure 9, describe ‘the amount and type of risk the
organisation is prepared to pursue, retain or take’. They are linked to the strategic objectives of the
business and reflective of stakeholder expectations.

AITHER | Final Report 23
Hunter Water expenditure review
Source: Hunter Water
Figure 9 Summary of risk appetite statements
The risk appetite statements are a key factor in driving investment decisions and are integrated into
all aspects and levels of decision-making, including strategic planning processes, Board deliberations
and business cases.
At a high level, the ERM Framework comprises the following elements and processes:
• a Corporate Risk Profile, which provides an overview of the number, type and potential effects of
each risk on the organisation (currently comprising 21 risk ‘events’)
• Risk Treatment Plans document the many risk drivers contributing to each risk ‘event’,
aggregating the outcomes into an overarching rating that reflects the overall position of the risk
• the Risk Treatment Plans also document the planned response to risk drivers that are outside of
appetite, identifying actions, costs, timeframes and anticipated risk-reduction
• actions to address gaps between identified risk and the relevant risk appetite include interim
actions, non-capital solutions and longer-term actions, with proposed risk treatment actions
developed into programs of work
• Risk Business Partners embedded within the business oversee compilation of risk information,
which is reviewed by the relevant Executive Risk Owner and Executive Management Team
• progress is monitored through quarterly risk status reporting to the Audit and Risk Committee and
updates to the Board.
Risk appetite levels were revisited in 2017 in response to an observed increase in the incidence of
some critical risks. Hunter Water has subsequently aimed to balance the investment required to close
the gap between current risk levels and risk appetite, with the potential impact on customer prices.
Aither assessment
Hunter Water’s ERM reflects a mature approach to risk management that is aligned with good
industry practice. The enhancements made to the framework – and in particular revisions to risk
appetite – have had some impact on proposed expenditure. This is indicative of the trade-off the
business must manage between accepting some risk, and prioritising investment in risk treatments
that will better align controlled risk with the business’ risk appetite.

AITHER | Final Report 24
Hunter Water expenditure review
Overall the ERM is prominent within the business and appears to have a positive role in major
decision-making for Hunter Water. To the extent that proposed investment is being driven by risk, the
need for that investment may be influenced by:
• whether the risk framework is robust, clear and transparently and consistently applied across the
business
• whether Hunter Water’s risk appetite aligns with the expectations of customers.
In relation to the former, Hunter Water’s ERM Framework is comprehensive and appears well
embedded within the business. The ERM Standard provides guidelines for risk assessment, including
thorough descriptors of consequence, likelihood and examples across different risk areas. To the
extent that the principles of the Standard are being consistently applied – in combination with the
oversight of the Executive and Audit and Risk Committee – the assessment and articulation of risk
and its treatment appears robust and appropriate.
The revision of risk appetite levels, however, has implications for a number of areas of Hunter Water’s
proposed capital expenditure. Adopting a more risk averse approach can have a significant impact on
the level of capital expenditure proposed to address a particular area of risk.
This issue is identified and discussed in Aither’s detailed review of several major programs within the
capital expenditure portfolio (see Section 4.5).
Observations in relation to the application of the ERM to the capital program
The focus on the ERM aligns Hunter Water with industry practice and is appropriate for use in the
development of capital expenditure planning, prioritisation and delivery. The application of the ERM
and consideration of risk is widely evident and observable.
However, it is also evident that the application of greater sophistication to Hunter Water’s ERM
framework is still evolving in practice. Some of the issues observed are summarised below:
• In many projects reviewed by Aither, there was limited transparency about the extent and nature
of the risk assessment undertaken (including how risk was evaluated and scored).
• There appears a heavy reliance upon subjective risk methodologies. Whilst this is appropriate and
necessary in many instances, for large expenditure the use of objective risk assessment (using
scenario modelling and analytical tools incorporating numerical probability) provides greater rigour
and is preferable. However, there are also examples of where such approaches are adopted and
should become more prevalent with greater familiarity and expertise.
• The absence of objective risk methodologies introduces the potential for bias (unconscious or
otherwise), particularly where subject to influence from recent experience. For example, Hunter
Water’s recent experience of environmental non-compliance in some areas could lead to the
tendency for excessively risk-averse assessments in subjective scoring, which introduces the
potential for inefficient expenditure.
• Many of the specific challenges Hunter Water is addressing are complex and multi-faceted. The
business case and other documentation observed by Aither rarely identified or discussed these
relationships and how more than one risk was being mitigated. Understanding the interfaces
between multiple risks is necessary to help inform corporate priorities, as well as to contribute to
decision-making about optimal project scopes and costs. While it is likely that this is considered in
the course of most project development and cost estimation, the documentation Aither observed
rarely identified multiple or related risks in a structured way. The establishment of strategic cases
may also provide an opportunity to better consider and document the interrelationships between
multiple risk factors.

AITHER | Final Report 25
Hunter Water expenditure review
• Risk analysis applied in the development of cost estimates and program expenditure is typically
simplistic and largely adopts subjective assessments when developing allowances. Most larger
utilities in Australia – similar to major infrastructure development in other sectors – now adopt
more formal and sophisticated scenario modelling techniques to better understand risk and
uncertainty to incorporate this appropriately in cost estimates and decision-making. Hunter Water
should move in this direction for its major programs.
In summary, the ERM provides a consistent framework that assists with the evaluation of all Hunter
Water’s projects. Its application is cited in almost all business cases and provides confidence that
there is a high degree of awareness about the framework and its application within the business.
Specific incidences of some of the general issues observed above have been identified and taken into
account, where relevant, in Aither’s review of the various programs and projects proposed for the
forecast regulatory period.
3.3.4. Investment prioritisation
In fulfilling its objectives, the Board Investment Committee must provide a strategic overview of the
longer-term capital portfolio, including prioritisation and balancing of projects and programs. This must
also be facilitated on an ongoing basis, which is achieved within the capital portfolio management
framework through the articulation of the portfolio definition cycle. Within this cycle, Hunter Water has
a detailed process for the prioritisation of programs and projects.
Source: Hunter Water
Figure 10 Prioritisation as a stage in the portfolio definition cycle
Hunter Water uses prioritisation criteria to objectively assess, score and rank each project. The
criteria are described as ‘lenses’, each of which every project must be progressively assessed
against. The prioritisation criteria, or lenses, assess whether projects:
• are forced (mandatory and present no real investment choice) or constrained (business impacts
would arise if investment is moved or deferred)
• contribute to compliance
• align with strategic objectives to deliver value
• present complexity risk.
The output of the assessment process is a prioritised portfolio, based on an objective comparison of
all projects. This is then a basis for stakeholder engagement, scenario modelling and balancing the

AITHER | Final Report 26
Hunter Water expenditure review
portfolio to provide the optimal mix of projects to achieve the organisation’s objectives within
constraints (resources, time and risk) over the planning horizon.
Aither assessment
While the capital portfolio management guidance provides a detailed basis for prioritising investment,
the outcomes in practice will depend on the extent to which this process is – and particularly
subjective judgements therein are – applied consistently.
3.3.5. Cost estimation
Hunter Water conducted a review of its cost estimation performance during the current period, in
response to incidences of large variation between tender responses and approved funding for a
number of projects. The need to improve estimating practices was a driver of the establishment of the
Program Portfolio Manager (PPM) Partnership Agreement, with whom Hunter Water undertook to
seek expert advice to develop and implement an improvement plan for cost estimating.
As part of its review of cost estimating processes, Hunter Water:
• established that its objectives for estimating accuracy through the project life cycle (which are
detailed in the Capital Project Estimating Guidelines and were approved by the Board Capital
Works Committee in 2014) remain appropriate
• benchmarked cost estimating objectives and guidelines with comparable organisations and found
them to be consistent with good industry practice, but that they would benefit from: formally linking
to an accepted international standard; and having clearer guidance on estimate expectations for
Gate 3 delivery funding submissions
• proposed the implementation of a cost estimating framework based on the international AACE
(Association for the Advancement of Cost Engineering) standard
• updated its Capital Project Estimating Guidelines and related cost estimating tool (currently in the
process of finalisation and approval).
Hunter Water expect the implementation of this framework (summarised in Figure 11) – which also
aligns with the existing Gateway approval process – to provide greater transparency on the design
inputs and level of contingency required to achieve the desired level of estimating accuracy.

AITHER | Final Report 27
Hunter Water expenditure review
Source: Hunter Water
Figure 11 Summary of Hunter Water’s cost estimating framework
Data provided by Hunter Water for 23 projects at July 20195 showed that:
• 12 (52 per cent) did not meet the objective for target variance (< +/-25%) between Gateway 2 and
final cost estimates
• 9 (39 percent) did not meet the objective for target variance (< +/-10%) between Gateway 4 and
final cost estimates
• the objectives were met for the total cost of the portfolio of projects, with a variance of 10 per cent
between Gateway 2 and final cost estimates, and 3 per cent between Gateway 4 and final cost
estimates,
Aither assessment
Hunter Water acknowledged deficiencies in its cost estimating processes during the current period.
The response appears proportionate and reasonable, with changes to processes that align Hunter
Water with industry practice and relevant international standards.
Aspects of Hunter Water’s practice improvements are still in the process of finalisation and
embedding across the business, so it is not yet possible to assess the extent to which they will
address the shortcomings addressed. However, revisions to Hunter Water’s guidelines and cost
estimating tool should be expected to deliver improvements.
Aither observed the extent to which cost estimates for a number of projects have varied significantly,
particularly between early Gateway approvals and the outcomes of tender processes. This provides
evidence for the action taken by Hunter Water in the period to improve cost estimating practices. The
effectiveness of the changes implemented will be demonstrated by future cost estimating outcomes.
5 Variance Report July 2019, Hunter Water
AITHER | Final Report 28
Hunter Water expenditure review
3.3.6. Procurement
Hunter Water has a comprehensive procurement framework comprising key documentation that
includes:
• Procurement policy
• Procurement Committee Charter
• Tendering procedure
• Tender assessment and contract award procedure
• Purchasing procedure
• Contract management framework.
The framework establishes the controls that all officers must comply with in meeting their procurement
duties. This aligns with delegated authorities to ensure accountability in decision-making, while
managing specific procurement risks. This includes centralisation of procurement activities above a
threshold of $150,000, for which a dedicated team manages procurement to ensure compliance with
internal controls and adherence to the direction provided by the Procurement Committee. The
Committee is also part of the governance and independent oversight of major procurement activity.
Hunter Water has a range of established panels and other contracting arrangements to support
efficient and competitive procurement of key capital and operational activities. Evaluation of tenders
requires the price of a good or service to be given a weighting of at least 50 per cent, to ensure value
for money.
Hunter Water also adopts a tiered approach to tendering, whereby any expenditure greater than
$200,000 is required to be procured through an open tender process or an established panel. The
procurement team provides assistance as required to support procurement and contract development
below the threshold, which includes obligations for at least:
• one quote for contracts up to $15,000
• two quotes for contracts between $15,001 and $50,000
• three quotes for contracts between $50,001 to $200,000.
Aither assessment
Hunter Water’s procurement processes are consistent with industry practice and appear robust and
appropriate. The extent to which those policies and procedures are consistently followed will then be
a key determinant in whether procurement is contributing to efficient outcomes. Hunter Water’s
documentation provides evidence that appropriate processes are being observed.
3.4. Our assessment of Hunter Water’s strategic planning and
asset management
Hunter Water’s governance, strategic and investment planning, risk and asset management
arrangements are aligned with industry practice and appear appropriate and reasonable. Although
these arrangements are underpinned by sound foundations, Hunter Water has also identified and
responded to a number of improvement opportunities during the period, including the development of
a four-year strategy, implementation of a more substantive Enterprise Risk Framework, and
refinements to cost estimating processes.
AITHER | Final Report 29
Hunter Water expenditure review
Hunter Water aspired to develop a long-term plan in parallel, which has not eventuated. Although the
2017+3 Strategy provides a strategic direction and a substantive list of initiatives, these will be given
greater clarity by the completion of a long-term plan. Hunter Water maintains this will be more
appropriate once the outcomes of key inputs – including their price determination and key strategies
such as the Biosolids Strategy and Lower Hunter Water Plan – are known, as well as a permanent
Managing Director appointed.
As noted in Section 3.3, the reasons cited by Hunter Water for the delay of the long-term plan appear
reasonable, particularly to provide the opportunity for a new permanent Managing Director to guide
future strategic direction. However, the preparation of a long-term plan in parallel with many
significant strategic initiatives was also ambitious and challenging. Given this, it is appropriate that the
long-term plan should not be tied to an arbitrary and overly ambitious deadline where important inputs
are not yet complete.
The implementation of the ERM is indicative of Hunter Water’s maturing approach to risk
management. The framework appears appropriate and robust. However, when observing the
application of the ERM to specific projects, Aither identified some instances where the risk
assessment was not completely transparent, relied upon subjective assessment and adopted a
conservative risk position that contributed to driving investment. There is an opportunity for Hunter
Water to continue to adopt greater sophistication in its consideration of risk – including more objective
methodologies – to drive more efficient outcomes in future.
Hunter Water has recently reviewed and improved its cost estimation processes. The need for these
improvements has been observed in the course of Aither’s review. Hunter Water is still finalising the
improvements to its processes, so the success of these changes in addressing some deficiencies in
cost estimation will be observable over time.
3.5. Output measures
As part of the scope of this review, Aither was required to assess the output measures proposed by
Hunter Water for the upcoming regulatory period (and its actual performance against output measures
established as part of the previous review). One of the difficulties in assessing Hunter Water’s
proposed output measures is that they are not linked to any overarching outcomes – i.e. what is the
output measure attempting to indicate achievement of?
The following provides an overview of why outcomes are important to understanding the
appropriateness of output measures and then our assessment of Hunter Water’s proposed output
measures.
3.5.1. Outcomes and outputs in strategic planning
Outcomes are important in strategic planning, as they are a clear articulation of what success looks
like for individuals, communities, the environment or other beneficiaries as a result of your
organisation or program’s activities. They help provide focus for directing effort and investment.
Outcomes also provide the basis for measuring and demonstrating progress resulting from the work
you do and help identify if you need to make any adjustments to the program to ensure success.
Measuring success is also important to help make a case for further funding. Overall, outcomes:
• seek to clearly articulate what success looks like
• are deliberately high-level, largely avoiding prescribing specific actions or processes

AITHER | Final Report 30
Hunter Water expenditure review
• are framed, with appropriate detail, for the intended audience (e.g. Minister, senior executive,
general public)
• are often inherently interrelated.
Outcomes approaches are increasingly recognised by national and state governments, as well as
government departments and agencies, as a best-practice approach to planning. At a national level,
Scotland implemented its first outcomes framework (the National Performance Framework) in 2007,
and has reviewed and updated it twice since, most recently in 2016. It contains 16 National
Outcomes, which describe what the government wants to achieve, and 55 National Indicators, which
are used to measure progress against the outcomes (Scottish Government, 2019). In Australia,
Victoria is leading at a state-level through its outcomes reform. This is being progressively adopted by
various departments and agencies, including the Essential Services Commission, which introduced
an outcomes-based water pricing framework, known as PREMO.
The difference between outcomes and outputs is a common point of confusion. While outcomes
represent the desired change or impact, outputs represent the tangible things that result from your
activities. They capture the widgets you produce, but they don’t capture change or impact. Outputs
are essential, but they can’t demonstrate performance against outcomes.
These terms can be structured in an outcome logic. Outcome logic is a common approach to strategic
planning. It expresses how change is expected to occur within a system. It captures the rationale
behind a program or initiative, probing and outlining the anticipated cause-and-effect relationships
between defined inputs, activities, outputs and outcomes. Outcome logic also provides a consistent
basis upon which to monitor success and drive continuous improvement in the way management
actions and programs are identified, delivered and refined over time. A template for an outcome logic
is provided in the figure below.
Source: Aither
Figure 12 Example outcome logic template
3.5.2. Outcomes and outputs in the context of utilities
Output measures are intended to track a utility’s performance against pre-defined outcomes.
Outcomes represent desired long-term changes in the services provided by utilities and should be
informed by consultation with the respective utility’s customers.

AITHER | Final Report 31
Hunter Water expenditure review
Figure 13 provides a conceptual map of the relationship between outcomes and outputs, and includes
examples commonly used by utilities. The process begins with defining a problem or opportunity
statement, this is translated into an overarching long-term change (vision), the overarching vision is
then categorised into specific outcomes, which are then delivered on. As mentioned above, output
measures are tangible and measurable indicators of performance against outcomes.
Source: Aither
Figure 13 Outcomes, Outcome measures, and Output measures
It is difficult to assess the appropriateness of output measures in the absence of defined outcomes.
Given this, we have assessed the proposed output measures based on Hunter Water’s actual
performance in relation to these measures. Aither has not sought to consider the appropriateness of
whether the inclusion of an output measure would lead to particular outcomes.
3.5.3. Hunter Water performance against target output measures
Hunter Water has provided information on its performance against the output measures that were
established for the current regulatory period. For all except two output measures, Hunter Water has
met, or exceeded, the targets that were set. The two output measures that are expected to be behind
from the current regulatory period are:
• Switchboard’s replaced – a target of 40 sites, but an expected result of 36 sites
• Replace 20mm customer meters – a target of 67,000 meters, but an expected result of 62,021
meters.
While these two output measures are behind the targets, they are not materially under-delivering and
expected to be equal to or less than 10 per cent below the target.
Two output measures significantly exceeded their initial target – trunk mains undergoing condition
assessment and critical trunk main replacement. The reasons for these significant increases were
operational incidents that required additional steel trunk main assessments and the bringing forward
of the replacement of a section of the Chichester Trunk Gravity Main (CTGM) within the period. Both
of these explanations appear reasonable.

AITHER | Final Report 32
Hunter Water expenditure review
3.5.4. Hunter Water proposed outputs
Hunter Water has proposed output measures for the upcoming regulatory period, as outlined in Table
7. Hunter Water’s rationale for these outputs include that the proposed output measures and their
metrics are an extension of the previous pricing periods output measures, with natural variations in
target outputs occurring where there are specific capital works programs in response to an ageing
water supply network. Specifically, Hunter Water states:6
Hunter Water’s output measures are consistent with the proposed capital investment program
detailed in this paper (Technical Paper 4), reflecting condition assessments. asset
replacements, and renewals planned for the next regulatory period to effectively meet
customer, environmental and safety requirements.
Aither’s assessment of the proposed output targets is provided subsequently in section 3.5.5.
6 Hunter Water Pricing Submission: Technical Paper 4, p. 52.

AITHER | Final Report 33
Hunter Water expenditure review
Table 7 Hunter Water’s proposed output measures
Output (or
activity)
measure
Units 2016-20 Actual 2020-25 Forecast
Variance Hunter Water’s commentary Total Annual Total Annual
Water services
Renewal/
reliability of
distribution
mains
km 22 5.5 36 7.2 31% The minor increase is aligned with increase in program funding
Trunk mains
undergoing
condition
assessment
km 54.1 13.5 130 26.0 92% The increase associated with the condition assessment of the CTGM
falling into the period (80km)
Critical trunk
main
replacement
km 15.4 3.9 28 5.6 45% The increase is predominately associated with major critical mains
program proposed to address community safety risks
Wastewater services
Renew non-
critical mains
km 44.1 11.0 65 13 18% The minor increase is associated with proposed program budget
increase. The program increase has been proposed to manage a
broader sub-set of non-critical sewers through lifecycle costing,
predominately high frequency overflows and more accurate deterioration
modelling.
Critical sewer
mains
undergoing
condition
assessment
km 83 20.8 95 19 -8% Forecast investment and outputs are consistent with 2016-20 price path

AITHER | Final Report 34
Hunter Water expenditure review
Output (or
activity)
measure
Units 2016-20 Actual 2020-25 Forecast
Variance Hunter Water’s commentary Total Annual Total Annual
Renewal/
refurbishment of
critical
sewerage mains
(cast iron
program)
km 3.1 0.8 5.8 1.2 50% The forecast is 5.8 km, which represents a 50% annual increase. This
increase is predominately in the cast iron lining program, which
addresses risks of unlined pipes.
Mechanical and electrical assets
Telemetry
upgrades (water
and wastewater)
Sites 356 89.0 27 5.4 -94% Hunter Water's current program of replacing small obsolete PLCs at
hundreds of network sites will be completed in PP16. During PP20, the
PLC renewal program will be focused on more complex sites such as
treatment plants and large pumping stations where there is an increased
risk due to obsolete PLCs, which will result in a reduced quantity and
cost.
Switchboards
replaced
Sites 36 9.0 31 6.2 -31% A number of switchboards were replaced in PP16 as part of major
projects, program switchboard renewals, and price path provision
switchboard renewals. The estimate in PP20 relates to replacing
switchboards as part of the mechanical electrical renewals program only
and does not forecast a large number of switchboards to be replaced in
separate projects/programs. Risks will be monitored during the period
and if an increased risk is identified, then consideration will be given to
expanding the switchboard renewal program.
Replacement or
refurbishment of
pumps
Pumps 571 142.8 550 110.0 -23% The forecast refers to combined replacements/refurbishments in both
water and wastewater networks. the historical performance involved a
higher level of refurbishments (which are at a lower cost per item), which
is forecast to change to a higher level of replacements, which will reduce
the total number of pumps impacted. The estimate relates to a forecast
failure rate of pumps requiring renewal. If the actual failure rate exceeds
this then a greater number of renewals would be required

AITHER | Final Report 35
Hunter Water expenditure review
Output (or
activity)
measure
Units 2016-20 Actual 2020-25 Forecast
Variance Hunter Water’s commentary Total Annual Total Annual
Stormwater drainage
Stormwater
drainage
channel
rehabilitations
km 1.37 0.3 3.4 0.7 99% The increase is associated with major renewal projects and culvert
refurbishments proposed for the price path period. Historical renewal
activities have focused on more smaller length localised refurbishments
and renewals.
Corporate
Replace
customer
meters 20mm
meters 62,021 15,505 63,378 12,676 -18% During PP16 an accelerated program of 20mm (residential) meter
replacements was still being completed to address an identified risk of
early failure in the backflow device contained within the meter. This risk
was limited to one type of meter, but it was the prominent brand and
model used on residential properties. The program required on average
30,000 meter replacements each year, and was completed by the end of
16/17. This increased amount of exchanges in the first year of the price
path have raised the average per year. The PP20 forecasted numbers
are consistent with replacement volumes prior to the accelerated
program being required.
Source: Hunter Water submission to IPART issues paper, p.5

AITHER | Final Report 36
Hunter Water expenditure review
3.5.5. Aither’s assessment of proposed outputs
Aither has sought to understand how Hunter Water has decided on the above output measures and
their respective targeted quantities over the forecast price period (Table 8).
As outlined earlier, Aither has not necessarily assessed the appropriateness of the output measures
other than to consider whether any perverse outcomes may eventuate. We consider that this type of
assessment would form the basis of a broader assessment of the appropriateness of the output
measures in line with a consideration of the specific outcomes that Hunter Water are seeking to
deliver to their customers.

AITHER | Final Report 37
Hunter Water expenditure review
Table 8 Aither's assessment of Hunter Water’s proposed output measures
Output (or activity)
measure
Units 2020-25
Forecast
Variance
to 2016-20
Actual
Aither’s assessment
Water services
Renewal/ reliability of
distribution mains
km 36 31% Hunter Water has increased their proposed renewal target to align with increased funding.
We consider this to be a reasonable adjustment to the target.
Trunk mains
undergoing condition
assessment
km 130 92% Hunter Water has nearly doubled its expected output when compared to the previous price
period. The majority of this increase in output is associated with the condition assessment of
the Chichester Trunk Gravity Main falling into the forecast price period. We consider the
target set for linear assets to be reasonable.
Critical trunk main
replacement
km 28 45% Hunter Water has increased its expected output when compared to the previous price
period. The proposed replacements are related to the large proposed program of condition
assessment and required to address community and safety risks. We note that while there is
a recommended adjustment to part of the program of work that will deliver on this output, we
do not expect this to impact on Hunter Water’s ability to meet the revised target. The part of
the program that has been recommended for reduction appears to be primarily focussed on
strengthening and other works and not replacements. Therefore, we consider the target set
for linear assets to be reasonable.
Wastewater services
Renew non-critical
mains
km 65 18% Hunter Water has increased their proposed renewal target to align with increased funding.
Specifically, the increase is connected to Hunter Water’s increased risk appetite include
more accurate deterioration modelling of non-critical sewers. We consider the increase in the
target to be reasonable.
Critical sewer mains
undergoing condition
assessment
km 95 -8% Hunter Water has proposed a minor decrease to their renewal target. We consider change in
the target to be reasonable.

AITHER | Final Report 38
Hunter Water expenditure review
Output (or activity)
measure
Units 2020-25
Forecast
Variance
to 2016-20
Actual
Aither’s assessment
Renewal/
refurbishment of
critical sewerage
mains (cast iron
program)
km 5.8 50% Hunter Water has increased its expected output when compared to the previous price
period. This increase is associated with their cast iron lining program to address the risk of
unlined pipes. We consider the increase in this target to be reasonable.
Mechanical and electrical assets
Telemetry upgrades
(water and
wastewater)
Sites 27 -94% Hunter Water has substantially decreased its expected output when compared to the
previous price period. The reasoning being telemetry upgrades moving from a large number
of small network sites, to a small number of treatment plants and large pumping stations. We
consider this to be an appropriate adjustment to the target.
Switchboards
replaced
Sites 31 -31% Hunter Water has decreased its expected output when compared to the previous price
period. A large number of switchboards were replaced in the previous price period with the
decrease more closely reflecting ‘business as usual’. Hunter Water have noted that this
estimate may increase. We consider that the revised target is reasonable.
Replacement or
refurbishment of
pumps
Pumps 550 -23% Hunter Water has decreased its expected output when compared to the previous price
period. The reasoning provided includes an increase in the forecast failure rate of pumps.
This means that a greater number of pumps will require replacement. Conversely, there is a
decrease in the number of pumps requiring refurbishment. We consider this change in target
to be reasonable.
Stormwater Drainage
Stormwater drainage
channel
rehabilitations
km 3.4 99% Hunter Water has nearly doubled its expected output when compared to the previous price
period. The majority of this increase in output is associated with a program of major culvert
refurbishments and renewal projects falling into the forecast price period. We consider this to
be an appropriate adjustment.

AITHER | Final Report 39
Hunter Water expenditure review
Output (or activity)
measure
Units 2020-25
Forecast
Variance
to 2016-20
Actual
Aither’s assessment
Corporate
Replace customer
meters 20mm
meters 63,378 -18% Hunter Water has decreased its expected output when compared to the previous price
period. The reasoning provided was that a large replacements program was required in the
previous price period. The decrease more closely reflects ‘business as usual’ prior to this
replacements program. We consider this to be a reasonable adjustment given the
performance within the current regulatory period.
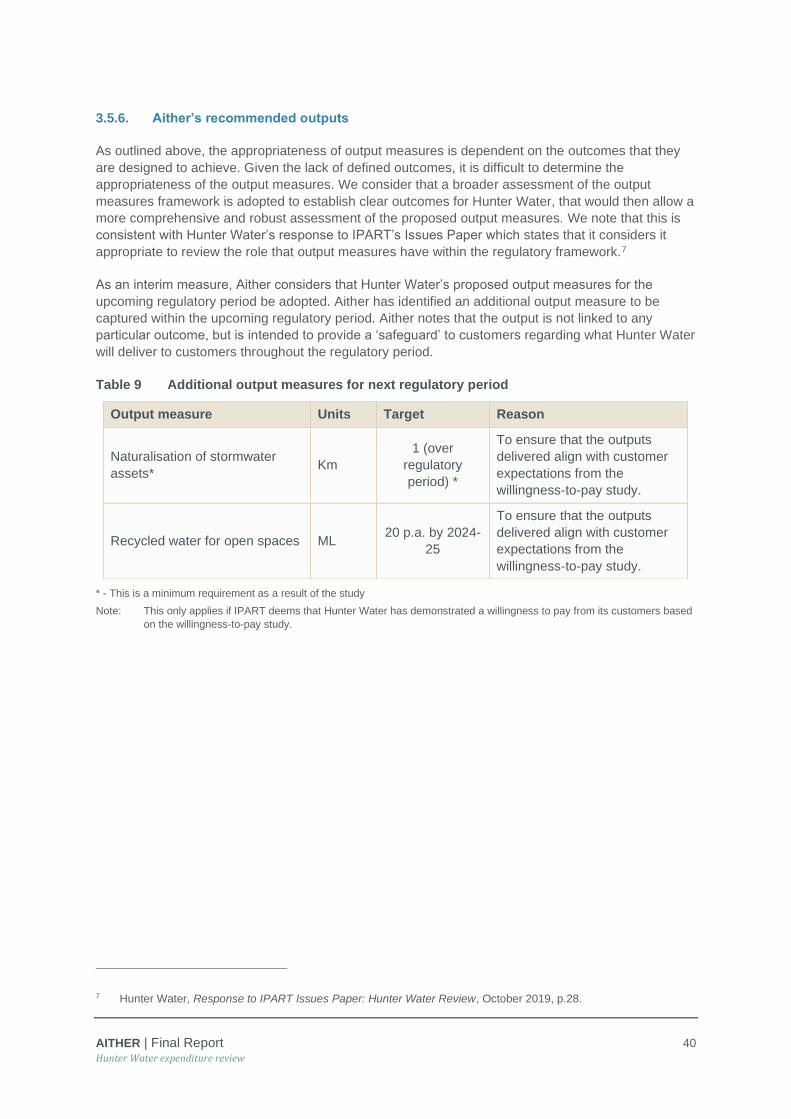
AITHER | Final Report 40
Hunter Water expenditure review
3.5.6. Aither’s recommended outputs
As outlined above, the appropriateness of output measures is dependent on the outcomes that they
are designed to achieve. Given the lack of defined outcomes, it is difficult to determine the
appropriateness of the output measures. We consider that a broader assessment of the output
measures framework is adopted to establish clear outcomes for Hunter Water, that would then allow a
more comprehensive and robust assessment of the proposed output measures. We note that this is
consistent with Hunter Water’s response to IPART’s Issues Paper which states that it considers it
appropriate to review the role that output measures have within the regulatory framework.7
As an interim measure, Aither considers that Hunter Water’s proposed output measures for the
upcoming regulatory period be adopted. Aither has identified an additional output measure to be
captured within the upcoming regulatory period. Aither notes that the output is not linked to any
particular outcome, but is intended to provide a ‘safeguard’ to customers regarding what Hunter Water
will deliver to customers throughout the regulatory period.
Table 9 Additional output measures for next regulatory period
* - This is a minimum requirement as a result of the study
Note: This only applies if IPART deems that Hunter Water has demonstrated a willingness to pay from its customers based
on the willingness-to-pay study.
7 Hunter Water, Response to IPART Issues Paper: Hunter Water Review, October 2019, p.28.
Output measure Units Target Reason
Naturalisation of stormwater
assets* Km
1 (over
regulatory
period) *
To ensure that the outputs
delivered align with customer
expectations from the
willingness-to-pay study.
Recycled water for open spaces ML 20 p.a. by 2024-
25
To ensure that the outputs
delivered align with customer
expectations from the
willingness-to-pay study.

AITHER | Final Report 41
Hunter Water expenditure review
4. Capital expenditure
4.1. Overview
This section summarises the review of the capital expenditure undertaken, discusses Hunter Water’s
performance against output measures, and makes an overall assessment of efficient capital
expenditure given review findings. It also discusses asset life assumptions and Hunter Water’s
proposed changes to regulatory depreciation. The outcome of our review of past and proposed capital
expenditure and any adjustments recommended are presented herein with detail of the review of
sample projects contained within Appendix A.
4.2. Summary of past and proposed capital expenditure
IPART approved capital expenditure of $383 million in its 2016 Price Determination, which compares
with Hunter Water’s actual and estimated capital expenditure during the current regulatory period of
$491 million. The significant variation between approved and actual expenditure arises primarily from
new expenditure initiatives in the final two years of the period (see Figure 14). This has in large part
been due to works aligned with two main drivers (asset and service reliability, and existing mandatory
standards), which are also the basis for the major share of proposed expenditure in the forecast
regulatory period (see Figure 15 and Figure 16).
Hunter Water’s actual and forecast capital expenditure for the current regulatory period – compared
with IPART’s 2016 Determination – is summarised in Table 10.
Table 10 Hunter Water’s actual and estimated capital expenditure for the current regulatory
period ($000s, nominal)
Products 2017 2018 2019 2020 Total
Water 32,697 49,932 61,361 46,032 190,022
Sewerage 43,872 33,535 36,031 111,204 224,642
Corporate 9,713 20,223 15,747 20,310 65,993
Stormwater 475 452 6,101 3,828 10,856
Total 86,758 104,141 119,240 181,374 491,513
IPART 2016
determination
(nominal)
106,587 91,971 96,759 87,626 382,943
Variance to
determination (18.6%) 13.2% 23.2% 107.0% 28.4%
Source: All data sourced from Hunter Water’s AIR (Capex by RAB). It should be noted that the data is based on the regulated
business only and excludes any corporate related capital expenditure that has been allocated to unregulated recycled
water.

AITHER | Final Report 42
Hunter Water expenditure review
Figure 14 summarises actual and forecast expenditure over the current and forecast regulatory
period, which illustrates the trajectory of increasing expenditure relative to the current regulatory
period, particularly for wastewater services. Hunter Water has indicated that its current Price
Submission is underpinned by a transition away from a period in which concerns about debt levels
were driving reduced expenditure and a reliance on available asset capacity and condition to
minimise investment. The ramification of this is a transition to increased expenditure in the forecast
period, which is suggested to be in order to restore deteriorating asset condition, address
performance deficiencies and cater for growth.
Increased concern from the EPA about the compliance of a range of assets with environmental
requirements has exemplified the risks arising from insufficient past expenditure to maintain asset
condition and performance. At the same time, Hunter Water has also substantially revisited its
approach to understanding – and maintaining assets within – its risk appetite, following a significant
water supply asset failure. This has led to the identification and prioritisation of increased investment
to try to better align existing risks with Hunter Water’s risk appetite.
Figure 14 Capital expenditure by service
Figure 15 illustrates that almost half of capital expenditure in the current period has been in response
to existing mandatory standards, with asset and service reliability nearly one quarter.

AITHER | Final Report 43
Hunter Water expenditure review
Source: Average of the four years of current regulatory period, with all data sourced from Hunter Water’s AIR (Capex SIR 4).
Figure 15 Capital expenditure by cost drivers for current regulatory period
Hunter Water’s proposed capital expenditure for the next regulatory period is summarised according
to each service requirement in Table 11 below. Figure 16 illustrates that the main drivers for this
expenditure remain asset service and reliability, existing mandatory standards, as well as growth.
Table 11 Hunter Water’s forecast capital expenditure for the upcoming regulatory period
($000s, $2019-20)
Products 2020-21 2021-22 2022-23 2023-24 2024-25 Total
Water 39,202 55,346 61,401 57,832 59,609 273,389
Sewerage 118,869 83,928 85,847 74,309 61,742 424,695
Corporate 38,679 43,175 23,199 25,630 19,514 150,196
Stormwater 3,652 2,768 4,664 5,894 6,150 23,127
Total 200,402 185,217 175,111 163,664 147,014 871,408
Source: All data sourced from Hunter Water’s AIR (Capex by RAB).

AITHER | Final Report 44
Hunter Water expenditure review
Source: Average of the four years of forecast regulatory period, with all data sourced from Hunter Water’s AIR (Capex SIR 4).
Figure 16 Capital expenditure by cost drivers for forecast regulatory period
A ten-year capital expenditure portfolio for Hunter Water, including the current financial year, is
presented in Figure 17. It reflects an increase over the near-term, before reducing, but only to levels
which are still significantly higher than the current period. Hunter Water informed Aither that the
increase in expenditure is generally driven by Hunter Water’s aspiration to better align asset service
reliability with the business’ risk appetite.

AITHER | Final Report 45
Hunter Water expenditure review
Source: Hunter Water AIR
Figure 17 Actual and forecast capital expenditure compared to previous IPART Determination
4.3. Capital projects overview
A detailed review of a representative sample of current and proposed capital projects was
undertaken, consistent with this element of the review, as described at Section 2.6.2.
The capital projects selected for detailed review were primarily selected based on their cost and risk,
but also included consideration of:
• whether the project or program contributed to significant variations from forecast expenditure at
the time of the 2016 Determination
• individual projects amongst those major projects listed by Hunter Water (in Section 5.7 of
Technical Paper 4 of their Pricing Submission) as having an impact on capital expenditure in the
forecast regulatory period
• projects that are representative of major program initiatives
• projects that are representative of, and bring insight and assist with recommendations on, the
efficiency of sub-programs.
The detailed review and findings for each project reviewed are included in Appendix A and the
rationale for selecting the projects identified is summarised in Table 12.

AITHER | Final Report 46
Hunter Water expenditure review
Table 12 Rationale for selection of specific projects for review
Project name PP2016
Variation
PP2020
Major
Expenditure
Program
Initiative
Relevance to Sub-
Program Evaluation
Project 1 – Chichester Trunk
Gravity Main (CTGM)
Replacement ✓ ✓
Capital Mains Safety
Program
Project 2 – Dungog Water
Treatment Plant Upgrades ✓
Representative of water
treatment program
Project 3 - Water network
Capacity Upgrades ✓ ✓ ✓
Relevant to other
programs that feature
growth
drivers/compliance
Project 4 - Minor Asset
Renewals Programs -
Wastewater
✓ ✓
Relevant to reticulation
renewals, minor M&E
and treatment renewals
Project 5 - Farley Wastewater
Treatment Plant Upgrade
Stage 3B ✓ ✓
Project 6 - Wyee Backlog
Sewer Program ✓
Project 7 – Treatment Plant
Chemical Containment and
Safety Upgrades Program
✓ ✓ Network Chemical
Upgrade program
Project 8 - Other Wastewater
Treatment Plant Upgrade
Program ✓ ✓
Project 9 - Stormwater Major
Rehabilitation / Renewal
Program
✓ ✓
Project 10 - Water loss
improvement project ✓ ✓
Source: Aither
Table 13 lists the capital projects that were assessed and their expenditure for each period. The
combined proposed capital expenditure is $516 million, representing 38 per cent of the $1,363 million
over the two regulatory periods.
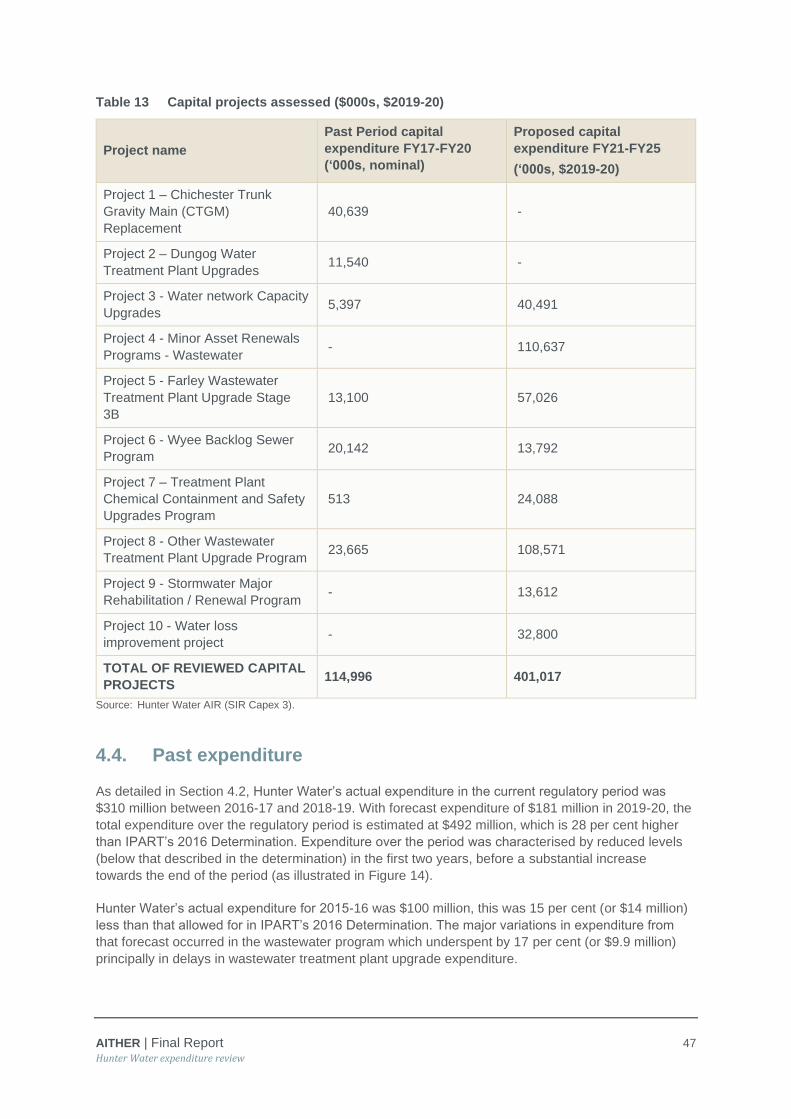
AITHER | Final Report 47
Hunter Water expenditure review
Table 13 Capital projects assessed ($000s, $2019-20)
Project name
Past Period capital
expenditure FY17-FY20
(‘000s, nominal)
Proposed capital
expenditure FY21-FY25
(‘000s, $2019-20)
Project 1 – Chichester Trunk
Gravity Main (CTGM)
Replacement
40,639 -
Project 2 – Dungog Water
Treatment Plant Upgrades 11,540 -
Project 3 - Water network Capacity
Upgrades 5,397 40,491
Project 4 - Minor Asset Renewals
Programs - Wastewater - 110,637
Project 5 - Farley Wastewater
Treatment Plant Upgrade Stage
3B
13,100 57,026
Project 6 - Wyee Backlog Sewer
Program 20,142 13,792
Project 7 – Treatment Plant
Chemical Containment and Safety
Upgrades Program
513 24,088
Project 8 - Other Wastewater
Treatment Plant Upgrade Program 23,665 108,571
Project 9 - Stormwater Major
Rehabilitation / Renewal Program - 13,612
Project 10 - Water loss
improvement project - 32,800
TOTAL OF REVIEWED CAPITAL
PROJECTS 114,996 401,017
Source: Hunter Water AIR (SIR Capex 3).
4.4. Past expenditure
As detailed in Section 4.2, Hunter Water’s actual expenditure in the current regulatory period was
$310 million between 2016-17 and 2018-19. With forecast expenditure of $181 million in 2019-20, the
total expenditure over the regulatory period is estimated at $492 million, which is 28 per cent higher
than IPART’s 2016 Determination. Expenditure over the period was characterised by reduced levels
(below that described in the determination) in the first two years, before a substantial increase
towards the end of the period (as illustrated in Figure 14).
Hunter Water’s actual expenditure for 2015-16 was $100 million, this was 15 per cent (or $14 million)
less than that allowed for in IPART’s 2016 Determination. The major variations in expenditure from
that forecast occurred in the wastewater program which underspent by 17 per cent (or $9.9 million)
principally in delays in wastewater treatment plant upgrade expenditure.

AITHER | Final Report 48
Hunter Water expenditure review
Past expenditure 2015-16 to 2018-19
In general, Hunter Water’s asset performance met required service standards during the current
period. Hunter Water has observed, though, that the period also required them to respond with
greater urgency to a general deterioration in the condition of ageing assets across their systems,
which in some instances was the cause of environmental and other performance concerns. More
broadly, relatively lower levels of expenditure in previous regulatory periods (and running down
condition and capacity of assets) are understood to have contributed to the need to invest more
substantively in asset serviceability.
Several areas of major expenditure change were the subject of more detailed project efficiency
reviews, including:
• Chichester Trunk Gravity Main (CTGM) upgrade
• Dungog WTP upgrade
• Farley WWTP upgrade
• Minor wastewater asset renewals
• Wyee backlog sewer program
• Water network capacity program.
Conclusions on the overall efficiency of capital expenditure in the current regulatory period have been
drawn from these reviews, as well as from the review of similar or continuing programs (such as the
stormwater upgrade program) proposed for the forecast period.
Hunter Water’s actual expenditure for 2015-16 of $100 million was 15 per cent less than that allowed
for in IPART’s 2016 Determination and resulted in a minor additional expenditure in the following year.
Aither considers that the planned projects were delivered and overall the expenditure was considered
efficient.
Of the projects above, only expenditure on the water network capacity program was less than
planned. This was due to actual Greenfield development proceeding at a lower rate than forecast,
along with the availability of spare network capacity (arising from further investigations identifying
changes in customer behaviour over time that differ from pre-2016 peak demand design standards).
The reduced expenditure reflects the need to respond to the actual timing of planned development
and was considered appropriate and efficient.
The significant increases in capital expenditure across the other projects were generally associated
with several key drivers:
• increased occurrence or significant incidences of asset failure, which triggered a greater focus by
Hunter Water on inspection and condition assessment of ageing infrastructure
• the greater focus on asset condition driving improved asset inspection processes, which then
identified equipment in critical condition and a need to bring forward expenditure to mitigate a risk
of imminent failure
• the scope of projects increasing to accommodate new or expanded requirements, whether
identified by further investigations or prompted by regulator concern about asset condition and
performance
• forecast costs increasing significantly from initial estimates once the project is tendered.

AITHER | Final Report 49
Hunter Water expenditure review
Although Hunter Water has also brought greater sophistication to its Enterprise Risk Management
framework during the current period, the changes to the business’ risk appetite – or application of the
ERM – have generally not directly impacted the decisions made in the current period (whereas they
are more influential for some program expenditure proposed in the forecast period). The projects
brought forward in the current period – and the associated increase in capital expenditure – are more
directly attributable to: compliance failures (initiating directives from the EPA); asset failure impacting
customer services standards or threatening public safety; or the outcomes of an increased focus on,
and improved processes in, asset condition assessment.
To some extent, the increased expenditure in the current period reflects the need to redress the
legacy of historical levels of investment in maintaining ageing infrastructure, combined with a greater
understanding of asset condition and risks. However, the review also highlights some recurrent
examples of Hunter Water under-estimating the scope and cost of projects and expenditure at the
early stages of concept development (at Gateway 1).
Nonetheless, following detailed review of the decision-making and procurement processes, the
changes in capital expenditure that have arisen on these major projects are generally considered
efficient and as having responded appropriately to clear drivers.
Beyond the review of these projects, the assessment of the broader program of capital expenditure in
the current period identified that asset performance generally met required service standards. Any
changes in expenditure from that forecast were less prevalent and material than that observed across
the major projects reviewed. Where expenditure increases have occurred, the drivers are consistent
with those observed as part of the detailed project-based review (the identification of ageing assets at
risk of failure, unforeseen scope changes arising from additional investigation or regulatory directives,
and cost estimates increasing following the outcomes of the tender process).
Conversely, reductions in expenditure have arisen where actual conditions (such as growth or water
demand) have varied from that forecast, or action has been delayed pending the need for strategic
review or further investigation. This is an appropriate and expected response to adaptively managing
emerging circumstances and consistent with the approach across the industry. Hunter Water’s
decision-making processes and resulting expenditure appear appropriate and efficient.
Forecast 2019-20 capital expenditure
Hunter Water’s planned expenditure in the final year of the current period is substantially higher than
preceding years, partly in response to some of the drivers identified (such as asset condition
deterioration or performance issues). Hunter Water initially indicated that expenditure during 2019-20
was (or would be) closely aligned with that forecast.
However, a subsequent review and advice provided by Hunter Water to Aither in October 2019
indicated a revised forecast expenditure for 2019-20 on major projects of $78 million, representing a
$9.9 million reduction on previous estimates. Hunter Water’s internal review identified both increases
and decreases in expenditure across nine projects, with the single largest change associated with a
scope change in the Dora Creek WWTP upgrade (reduction of $7 million).
The assessment of Hunter Water’s ability to achieve the revised forecast expenditure against major
projects in 2019-20 is considered in the broader context of program deliverability (see also Section
4.10). In general, Hunter Water has robust and appropriate arrangements in place that should ensure
there is no impediment to delivering its substantial capital program.
The recent adjustments to forecast expenditure on several major programs are not atypical or
unreasonable. Similarly, it is not unreasonable to expect some change from initial forecasts in

AITHER | Final Report 50
Hunter Water expenditure review
expenditure for the broader program over the course of the year. At the same period in 2018-19,
Hunter Water’s adjustment in forecast expenditure was a 2 per cent reduction.
The challenges for Hunter Water to meet planned expenditure during 2019-20 are exemplified by the
progress of the Farley WWTP upgrade. While there is $14 million forecast to be invested in the
remainder of 2019-20, the works have only recently been tendered and will not be awarded before
January. By the time the works commence, the level of expenditure proposed will be difficult to
achieve in the remaining months of the financial year.
This example, as well as the experience from the preceding year, suggest that a further, minor
reduction in proposed expenditure for 2019-20 is warranted.
Aither’s assessment
Asset-related performance has generally met required service standards during the current period,
however additional expenditure beyond that approved under the 2016 Determination has been
required to respond to specific incidences where performance has not been adequate, which appears
warranted and appropriate. Changes made to the business’ risk framework (and appetite) have not
materially impacted decisions made in the current regulatory period.
Our assessment identified that the capital program in 2015-16 was delivered with minor delays and
resulted in a reduction in expenditure from that allowed in 2015-16. Hunter Water’s actual expenditure
in 2015-16 can be considered efficient.
In addition to the revised 2019-20 estimate provided by Hunter Water (which reduced expenditure by
$9.9 million), Aither is recommending a further adjustment to the proposed capital expenditure of
$5 million. This is based on the expectation that – as occurred last year and exemplified by
challenges delivering expenditure on the Farley WWTP upgrade in the period – a reduction in
expenditure of at least 2 per cent can be expected. This level of adjustment is not atypical given the
scale of the program, with the expenditure to be deferred to the first year of the upcoming regulatory
period (2020-21).
4.5. Capital project review
This section provides an overview of the key findings from the detailed analysis of the selected capital
projects for the expenditure review.
The following is a short summary of each of the capital projects that were assessed as part of this
expenditure review. The detailed findings for each capital project can be found at Appendix A. The
subsequent section then considers the broader capital program, based in part on the findings of the
detailed project reviews.
4.5.1. Chichester Trunk Gravity Main replacement
Project description
The Chichester Trunk Gravity Main (CTGM) is an 85km pipeline that supplies water for approximately
38 per cent of Hunter Water’s average demand. Asset condition surveys, as well as recent failures,
have highlighted the need to address the significant risk to supply continuity and health and safety
associated with failure of the ageing pipeline.
AITHER | Final Report 51
Hunter Water expenditure review
Hunter Water has commenced replacement of an 8km section between Duckenfield and Tarro,
replacing the existing 900mm above-ground pipe constructed in 1923 with a 1200mm diameter below-
ground pipeline. The larger diameter increases capacity that will enable deferral of an upgrade at the
Grahamstown Water Treatment Plant. Capital cost estimates have increased to $43.5 million ($2018-
19) from the allocation made in the 2016 Determination of $29.7 million ($2016-17).
Assessment
Capital expenditure on this project was assessed as efficient. There is a clear and well-demonstrated
need to address a major business risk, with a suitable and comprehensive range of project options
identified and assessed through a robust process. The decision to increase the capacity of the
pipeline reflects an efficient approach to considering system-wide implications, with the preferred
option selected based on satisfactorily mitigating risk at the lowest lifecycle cost.
4.5.2. Dungog Water Treatment Plant upgrade
Project description
The Dungog Water Treatment Plant (WTP) supplies water to meet 40 per cent of Hunter Water’s
average demand. Water is sourced from a catchment with significant water quality issues, which
create challenges for the efficacy of water treatment. In 2014 Hunter Water identified the risk that
treatment could fail to comply with the requirements of the Australian Drinking Water Guidelines.
A project proposed to address this risk subsequently led to the identification of two further risks
(including a failure of chemical containment that led to prosecution and fines issued by the EPA),
which increased the scope of work at the site. Investigations undertaken since making an allowance
of $1.6 million ($2015-16) in the 2016 Determination have led to a revised cost allocation of
$13.8 million ($2018-19).
Assessment
Capital expenditure on this project was assessed as efficient. Notwithstanding the expansion in scope
over time to address deficiencies at the site, the works proposed address a clear project need to
mitigate significant risk (including consequences identified by both the NSW Department of Health
and the EPA). The process to identify, assess and select a preferred option appears robust, including
the integration of multiple, interrelated elements.
4.5.3. Water network capacity upgrades
Project description
Hunter Water constructs new transfer mains, pump stations and associated facilities to ensure
growing demand from new customers across the system can be met. Two ongoing programs
address, respectively, capacity upgrades in the existing network, and extension of the network to
Greenfield areas.
Expenditure for network expansion into new subdivisions is $14.6 million for the forecast regulatory
period, compared with $3.9 million in the current period. There is also a significant increase in
expenditure forecast for existing network capacity upgrades, with $25.9 million proposed in the
forecast period compared with $1.5 million in the current regulatory period. Growth in connections are
expected to continue at a similar or slightly reduced rate in this period.

AITHER | Final Report 52
Hunter Water expenditure review
Assessment
Expenditure in the current period was much lower than forecast, arising from two main factors:
• a higher proportion of growth in existing, rather than Greenfield, areas, and
• changing customer behaviour that no longer aligns with pre-2016 design standards for peak
flows, which allowed Hunter Water to make use of spare capacity to cater for growth.
Given that Hunter Water has also advised there is no additional provision in the forecast regulatory
period for expenditure not made in the current period, and that customer expectations for flow and
pressure are being met expenditure in the current period was assessed as efficient.
The program of expenditure to service Greenfield development for the forecast regulatory period was
assessed as efficient. Although information was provided belatedly by Hunter Water, the process to
establish – and the outcomes of – forecast growth appear reasonable, with cost estimates based on a
unit cost per property that is consistent with past practice and comparable with other locations.
By contrast, the unit rate adopted as the basis for forecast expenditure for general increases in
existing network capacity upgrades is markedly higher than that used for Greenfield development.
Hunter Water acknowledges that the cost per dwelling to service infill development (in established
areas with an existing network) should generally be lower. However, this is partially offset by the
need to upgrade parts of the existing network to deliver flows to greenfield development areas.
Other relevant issues to the efficiency of the existing network program are the understanding that a
significant part of the network has spare capacity because of changing customer behaviour and the
number of customers experiencing poor water pressures in spite of minimal expenditure on capacity
increases in the past period is currently reducing.
In the absence of specific evidence that would support a higher cost for existing capacity upgrades, it
is recommended that the allocation should be reduced to align the basis for cost estimates with that
adopted for Greenfield development. This equates to a 40 per cent reduction to the $16.9 million sub-
program for general increases in system capacity, resulting in a $6.8 million reduction.
4.5.4. Minor wastewater asset renewals program
Project description
This program involves provision for the condition assessment and renewal of minor assets within the
wastewater system, including: civil components of the wastewater network (planned renewal of non-
critical sewer mains, reactive mains renewals, and planned and reactive renewals of structures and
fittings); and mechanical and electrical treatment and network assets.
This is a program that supports ongoing delivery of wastewater services to meet service standards.
Hunter Water has proposed major increases in all minor asset renewal programs in the forecast
regulatory period to address asset condition and align associated risk with the business’ risk appetite.
Assessment
Aither’s assessment of the efficiency of this program is largely based on reviewing trends in
performance, incorporating the following system elements:
• Given that the proposed increase in expenditure on the wastewater network is proportionate
with the increase in failures observed in the previous period, the proposed expenditure is
considered efficient.

AITHER | Final Report 53
Hunter Water expenditure review
• Insufficient rigorous evidence was provided to substantiate the claim that increased expenditure is
required on wastewater structures to address public safety risks and manage inflow and
infiltration. A reduction of $6 million to align expenditure with the previous period’s actual
expenditure is recommended.
• Although Hunter Water is not well-placed to apply more sophisticated modelling approaches
(consistent with industry best practice) to renewal of mechanical and electrical network and
treatment assets, there is some concern that the outcomes of the appropriate but subjective risk
assessment process that is adopted are too risk averse. While a detailed review confirmed that
the provisions for most items are reasonable, there is also a proportion for which a more
reasonable risk position could be taken. As a result, a reduction of 10 per cent – representing,
respectively, $3.229 million for the treatment and $2.563 million for network mechanical and
electrical programs – is recommended.
4.5.5. Farley Wastewater Treatment Plant upgrade
Project description
The Farley WWTP discharges effluent to Fishery Creek, which the EPA has indicated is unable to
receive nutrient loads above Hunter Water’s existing licence conditions. An upgrade to the plant is
required to address significant growth in the catchment, as well as specific asset reliability and
performance concerns.
An allowance of $13 million was made in the current regulatory period to increase treatment capacity
to ensure mandatory standards continue to be met. Further investigation subsequently identified
additional challenges, including a lack of compliance with biosolids management requirements, as
well as potential groundwater contamination arising from the condition of some assets on the site. The
proposed capital expenditure has increased to $70 million, including $57 million in the forecast period.
Assessment
Capital expenditure on this project was assessed as efficient. Supported in the 2016 Determination,
this project has expanded in scope to address some significant issues and associated risks at the
site. Sustained concern from the EPA is indicative of the project need, while a suitable and broad
range of options has been identified and robustly assessed.
The assessment of capital expenditure for 2019-20 determined that it was unlikely that Hunter Water
would be able to fully invest the $14 million works planned for the Farley WWTP upgrade in the
current period, given that the tender process was only due to be completed in January 2020. The
assessment considered that $5 million should be deferred to the forecast period.
4.5.6. Wyee backlog sewer program
Project description
This project responds to a 2014 Government directive to provide wastewater services to 450 existing
and forecast properties in Wyee. The project involves the construction of a reticulation (sewer)
network (a combination of gravity and pressure sewers), as well as infrastructure to transfer
wastewater to the Dora Creek WWTP.
An allowance for expenditure of $9 million in the current period was made in the 2016 Determination,
of a total cost of $22.3 million ($2015-16). A revised 2018 business case responded to community
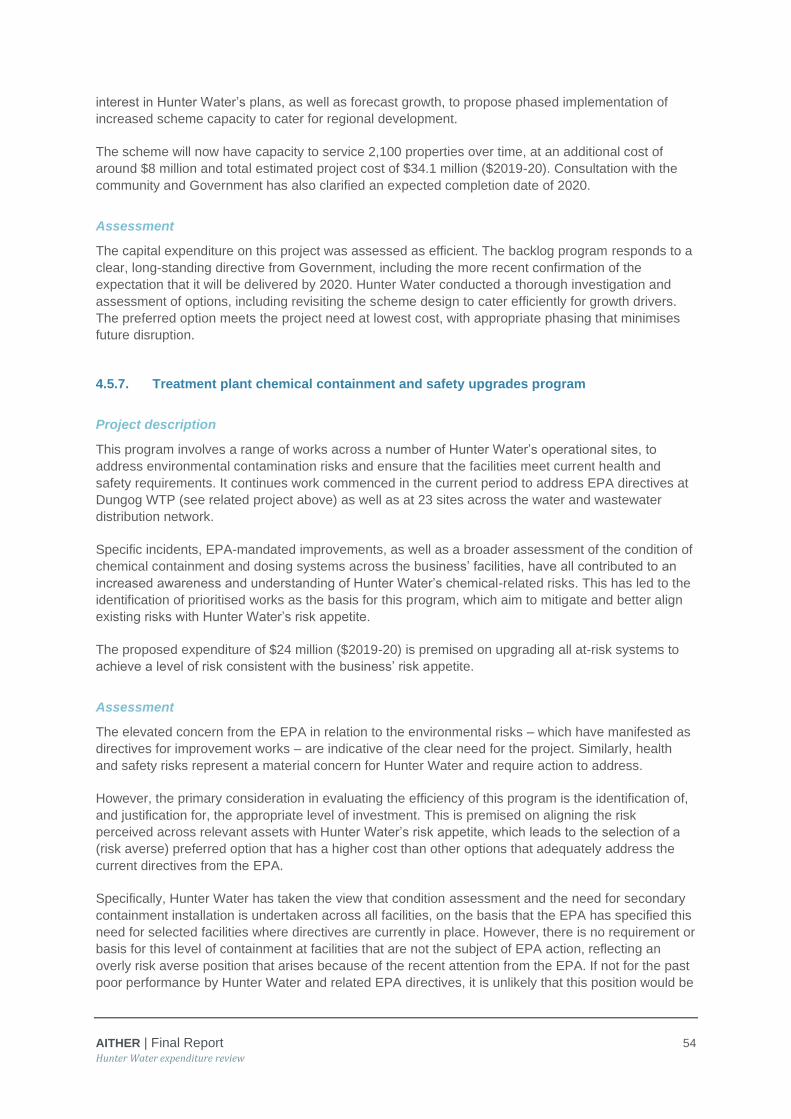
AITHER | Final Report 54
Hunter Water expenditure review
interest in Hunter Water’s plans, as well as forecast growth, to propose phased implementation of
increased scheme capacity to cater for regional development.
The scheme will now have capacity to service 2,100 properties over time, at an additional cost of
around $8 million and total estimated project cost of $34.1 million ($2019-20). Consultation with the
community and Government has also clarified an expected completion date of 2020.
Assessment
The capital expenditure on this project was assessed as efficient. The backlog program responds to a
clear, long-standing directive from Government, including the more recent confirmation of the
expectation that it will be delivered by 2020. Hunter Water conducted a thorough investigation and
assessment of options, including revisiting the scheme design to cater efficiently for growth drivers.
The preferred option meets the project need at lowest cost, with appropriate phasing that minimises
future disruption.
4.5.7. Treatment plant chemical containment and safety upgrades program
Project description
This program involves a range of works across a number of Hunter Water’s operational sites, to
address environmental contamination risks and ensure that the facilities meet current health and
safety requirements. It continues work commenced in the current period to address EPA directives at
Dungog WTP (see related project above) as well as at 23 sites across the water and wastewater
distribution network.
Specific incidents, EPA-mandated improvements, as well as a broader assessment of the condition of
chemical containment and dosing systems across the business’ facilities, have all contributed to an
increased awareness and understanding of Hunter Water’s chemical-related risks. This has led to the
identification of prioritised works as the basis for this program, which aim to mitigate and better align
existing risks with Hunter Water’s risk appetite.
The proposed expenditure of $24 million ($2019-20) is premised on upgrading all at-risk systems to
achieve a level of risk consistent with the business’ risk appetite.
Assessment
The elevated concern from the EPA in relation to the environmental risks – which have manifested as
directives for improvement works – are indicative of the clear need for the project. Similarly, health
and safety risks represent a material concern for Hunter Water and require action to address.
However, the primary consideration in evaluating the efficiency of this program is the identification of,
and justification for, the appropriate level of investment. This is premised on aligning the risk
perceived across relevant assets with Hunter Water’s risk appetite, which leads to the selection of a
(risk averse) preferred option that has a higher cost than other options that adequately address the
current directives from the EPA.
Specifically, Hunter Water has taken the view that condition assessment and the need for secondary
containment installation is undertaken across all facilities, on the basis that the EPA has specified this
need for selected facilities where directives are currently in place. However, there is no requirement or
basis for this level of containment at facilities that are not the subject of EPA action, reflecting an
overly risk averse position that arises because of the recent attention from the EPA. If not for the past
poor performance by Hunter Water and related EPA directives, it is unlikely that this position would be

AITHER | Final Report 55
Hunter Water expenditure review
taken, and a more risk tolerant approach would be acceptable (which is also consistent with wider
industry practice).
On this basis Aither recommends a reduction of $4.5 million in proposed expenditure for each of the
water and wastewater program of related works (total reduction of $9 million).
4.5.8. Major wastewater treatment works upgrade program
Project description
Hunter Water proposes major upgrades at a number of wastewater treatment plants (WWTP),
comprising asset improvements or capacity enhancements primarily to address growth and
environmental compliance issues.
Major upgrades (exceeding $10 million each) are proposed at seven WWTP sites, in addition to the
Farley WWTP upgrade (reviewed separately and summarised in Section 4.5.5). A total expenditure of
$107.9 million is proposed for the forecast period.
Assessment
The majority of the proposed expenditure (for five of seven projects) was considered efficient, on the
basis that it responds to clear drivers and is underpinned by thorough and appropriate planning,
design and procurement processes. Three key issues arise in relation to the efficiency of the program:
• Some projects propose works to address biosolids management issues, which could be
influenced by the outcomes of Hunter Water’s Biosolids Strategy (currently at Gateway 1 approval
for a preferred strategy to develop a central biosolids facility). It appears that this can be managed
by deferring relevant works until later in the period and reallocating relevant funds from specific
projects towards a new project for a centralised biosolids facility, if approved to proceed.
• Similarly, there is some uncertainty about the future discharge licence conditions that the EPA will
impose at some sites. No works should proceed until the objectives of the conditions are clear. In
the meantime, Hunter Water is progressing relevant planning on the presumption that conditions
will be similar to current arrangements.
• The case for proceeding with two of the seven projects within the forecast period – which is
premised on unconfirmed growth driving potential future risk of non-compliance with licence
compliance conditions – is not sufficiently robust. While the eventual need for the projects is
sound, it is considered that the timing is overly conservative, and the associated expenditure
could be deferred without impacting Hunter Water’s licence compliance. It is recommended that
proposed expenditure of $24 million for these two projects be deferred beyond the forecast
period.
4.5.9. Stormwater upgrade program
Project description
The majority of the 96km of stormwater assets that Hunter Water manages were constructed between
1920 and 1940. Hunter Water has been progressively assessing the condition of the system, which –
combined with an asset failure requiring remedial work in 2017 – has indicated the need for
rehabilitation and renewal of parts of the system.

AITHER | Final Report 56
Hunter Water expenditure review
Appropriate asset management techniques have been adopted to establish a risk rating for each
section of the stormwater network (based on likelihood and consequence of failure). Although the
precise nature of the works is the subject of further investigation, this process has established the
need for major rehabilitation at four locations at a total cost of $13.6 million ($2017-18).
Assessment
The capital expenditure on this project was assessed as efficient. Hunter Water has improved its
understanding of, and condition assessment processes for, its stormwater assets. This has confirmed
the need for remedial works that have been prioritised based on their risk rating. Enhanced monitoring
and minor remedial works are also proposed, with the aim of minimising major rehabilitation works in
the future.
4.5.10. Water loss improvement program
Project description
The objective of this program of works is to reduce water loss across the network and therefore
contribute to water security for Hunter Water. This would also provide additional time for future supply
augmentation decisions. The program is based on a forecast of $32 million over the upcoming
regulatory period to undertake initiatives to reduce water loss to minimise non-revenue water and
thereby increase the timing of any future supply augmentation.
As part of its Operating Licence, Hunter Water was required to submit to IPART a proposed
methodology for determining its economic level of water conservation (i.e. Economic Level of Water
Conservation Methodology). This methodology is required to outline the principles relating to water
conservation for the following elements:
• Water leakage (within and downstream of its water treatment plants)
• Water recycling, and
• Water efficiency (including demand management).
Following the approval of this methodology, Hunter Water was required to develop and submit (as
part of its pricing submission) a water conservation work program based on this methodology. This
program of work is the proposed work program to comply with this conservation methodology.
Assessment
The forecast capital expenditure for this program was considered efficient. The program of works
reflected investments that are not unique for a water utility in regard to water loss management and
are considered more of a ‘catch-up; in water conservation measures. The proposed investment met
the ELWC Methodology test to ensure investments were considered economically efficient.
Through discussions with Hunter Water, it was stated that all identified leaks were rectified by Hunter
Water as this was business-as-usual activities. These rectification costs are not captured as part of
the levelised cost estimate for the methodology. The calculation of the levelised cost was based on
only the upfront cost for identifying water savings with each initiative, where further rectification costs
are required to realise the water savings these costs have not been included. As an example, Hunter
Water has identified the upfront costs for active leak detection, however the costs of rectifying the
leaks have not been considered.
Aither considers it appropriate that these rectification costs be captured as part of the estimate of the
levelised costs within the ELWC Methodology. This is a more holistic approach to ensuring that the
AITHER | Final Report 57
Hunter Water expenditure review
capturing of water losses is economically efficient and beneficial to customers. The rectification costs
would vary depending on the size of the leak, however similar assumptions could be made to ensure
a levelised cost estimate.
The costs of rectification are generally relatively low and therefore we do not expect the change in the
levelised costs for the initiatives proposed by Hunter Water to result in the initiatives no longer being
viable under the methodology.
4.5.11. Summary of capital project reviews
After conducting the review of past, forecast and proposed capital expenditure for individual projects,
Aither makes the following recommendations for adjustments for the upcoming regulatory period (see
Table 14 below). The findings from these reviews has also informed a broader assessment of the
capital program (see section 4.6).
Table 14 List of adjustments from detailed project review
2020-21 2021-22 2022-23 2023-24 2024-25 Total
Adjustments
Project 3 - Water network
Capacity Upgrades (1,360) (1,360) (1,360) (1,360) (1,360) (6,800)
Project 4 - Minor Asset
Renewals Programs -
Wastewater
(2,030) (2,287) (2,338) (2,594) (2,543) (11,791)
Project 5 - Farley Wastewater
Treatment Plant Upgrade
Stage 3B
5,000 - - - - 5,000
Project 7 – Treatment Plant
Chemical Containment and
Safety Upgrades Program
(Water)
(900) (900) (900) (900) (900) (4,500)
Project 7 – Treatment Plant
Chemical Containment and
Safety Upgrades Program
(Wastewater)
(900) (900) (900) (900) (900) (4,500)
Project 8 - Other Wastewater
Treatment Plant Upgrade
Program
- - - (16,238) (7,688) (23,926)
4.6. Assessment of the capital expenditure program
This section summarises Aither’s assessment of the overall capital program, informed by the detailed
review of the projects described above (and detailed in Appendix A). The assessment is structured
around the various components of Hunter Water’s capital program.

AITHER | Final Report 58
Hunter Water expenditure review
The assessment of the program is based on:
• more detailed review of limited and selected projects (recognising the constraints on undertaking
a detailed review of the entire program within a reasonable timeframe)
• extrapolating the findings from the strategic review of the approach to the capital program, as well
as the detailed review of individual projects, as relevant to the broader program.
4.6.1. Water program: water sources
Proposed expenditure for the forecast period is $14.2 million. Other than some specific rehabilitation
projects, no conventional upgrade program of significance was identifiable. Hunter Water has not
identified the need for major supply-side investments in the near term, planning for which will be
informed in the next period once the Lower Hunter Water Plan is completed.
Proposed water source expenditure is considered efficient.
4.6.2. Water program: water treatment major works
Proposed expenditure on water treatment works in the forecast period is $69.1 million. A significant
proportion of this ($18.2 million) is associated with the $95.8 million upgrade to the Grahamstown
WTP. (This is in addition to a separate allowance of $26 million for construction of other related works
in the Grahamstown system). The timing of proposed expenditure on the Grahamstown WTP – the
majority of which is at the end of the period – is also influenced by the increased system capacity
generated by the upgrade and upsizing of a section of the Chichester Trunk Gravity Main.
Although the proposed expenditure on WTP upgrade works was not reviewed in detail, the data
presented by Hunter Water relating to existing plant capacity and growth in demand – combined with
evidence of water quality challenges in the catchment – provide a reasonable basis for the investment
need. Deteriorating water quality in the reservoir supplying the Grahamstown WTP supports the case
for upgrading the plant by 2027, irrespective of the inherent uncertainty that is attributed to the other
driver of growth (and customer behaviour) influencing increasing demand.
Proposed expenditure on water treatment upgrades is considered efficient.
4.6.3. Water program: water treatment minor works (including chemical containment
upgrades)
The detailed review of the treatment plant chemical containment program (see Section 0)
recommended a reduction in proposed expenditure, on the basis that Hunter Water’s preferred option
was unreasonably risk averse.
More broadly, Hunter Water proposes $17.425 million for minor mechanical and electrical upgrades of
its water treatment assets in the forecast period. The analytical approach that underpins this forecast
aligns closely with the approach adopted for minor wastewater asset renewals (see related detailed
review in Section 4.5.4). The review of that program found that Hunter Water’s preferred approach
was, in some instances, unreasonably risk averse and therefore proposed expenditure should be
reduced by 10 per cent. Based on that conclusion and the strong parallels with the water treatment
program, it is recommended that expenditure for this program be reduced by a similar proportion.

AITHER | Final Report 59
Hunter Water expenditure review
Although this essential program is underpinned by a clear need to maintain asset condition in
support of service standards, Aither’s view is that the extent of the expenditure proposed is
unreasonable. This is on the basis that it is underpinned by a subjective assessment of risk that, in
some instances, is unreasonably risk averse. As a result, some of the expenditure is considered
inefficient and it is recommended that (in addition to the reduction specified in Section 0 for the
wastewater component of the treatment plant chemical containment upgrade program), the water
treatment minor mechanical and electrical upgrade program be reduced by $1.742 million from
$17.425 million to $15.683 million.
4.6.4. Water program: water network
Hunter Water proposes total capital expenditure of $190 million on its water networks in the forecast
period across several programs:
• critical mains
• network capacity
• minor network asset renewals, and
• water loss reduction program.
Each of these is discussed below.
Water program: water network – critical mains
Hunter Water has documented a strategic approach to the management of critical mains and has
invested in a systematic program of condition assessment in the current program. This has helped
inform a series of major (greater than $2 million) expenditure proposals in the forecast period:
• completion of the Balickera Tunnel works ($6.85 million), the commencement of which was
supported in the 2016 Determination
• $5.8 million for remedial works on three sections of the CTGM, which is consistent with the
priorities in the detailed asset management plan for that asset, and
• $15.8 million for a critical mains safety program.
The critical safety mains program is a new initiative that arose following the failure of the CTGM. It
involves risk-based, prioritised replacement or rehabilitation of pipelines and related works to address
public safety and customer risks.
This program is based on a unique approach to validating the possible impacts of a failure event. The
analytical basis is considered valid and a good example of the application of an objective risk
assessment process (modelling of likelihood and consequences at a desktop level) to support
prioritisation. However, Hunter Water has also described this process as being at an early stage of
development, with the desktop results yet to be validated on the ground. In its submission, Hunter
Water has allowed for a scope reduction of 25 per cent as part of the site analysis stage.
Notwithstanding the appropriateness of the method being adopted, Aither’s assessment is that a
delay and reduction in the program is appropriate given:
• the uniqueness of the analytical approach and its early stage of development
• the scope uncertainty

AITHER | Final Report 60
Hunter Water expenditure review
• challenges estimating costs on similar projects (such as the CTGM upgrade), and
• the substantive project development load across other areas of the capital program.
While the majority of proposed expenditure on critical water mains is considered appropriate and
efficient, the extent of the allocation for the critical mains safety program was assessed as
inefficient. It is recommended that this program be reduced from $15.8 million to $12 million,
with expenditure – other than funds needed to complete investigations – occurring in the final three
years of the forecast period.
Water program: water network – network capacity
Proposed expenditure for water network capacity upgrades was reviewed in detail and a
recommendation made accordingly (see Section 4.5.3).
Water program: water network – minor network asset renewals
This component incorporates both mechanical and electrical, and civil assets, with the latter
comprised of network assets (pipes and fitting) and structures. There is strong alignment between this
program and the equivalent for wastewater (the subject of the detailed review summarised in Section
4.5.4).
The approach to forecasting renewal of minor mechanical and electrical water network assets is
comparable with that adopted for the wastewater network. Based on the findings for the parallel
wastewater program a similar reduction in expenditure is proposed, which is premised on the
assessment that a small proportion of the works proposed are unreasonably risk averse.
Similarly, the expenditure proposed for civil water structure assets is assessed as inefficient on the
basis of the assessment made for comparable wastewater assets. In the absence of specific evidence
of the need for increased expenditure, it is recommended that expenditure align with the level adopted
in the current period.
The component of this program for civil network assets includes proposed expenditure for the
forecast period of $28.2 million for planned renewal of pipes and fittings, and $7.5 million for reactive
maintenance. Hunter Water’s related performance (water network failures) has been stable over the
current regulatory period and is consistent with the benchmark demonstrated by comparable utilities
in Hunter Water’s cohort. The proposed expenditure is similar to the level of past expenditure and this
allocation therefore considered efficient.
Some elements of this program are assessed as inefficient. It is recommended that:
• expenditure for renewal of minor mechanical and electrical network assets be reduced by $1.28
million (10 per cent) from $12.8 million to $11.5 million
• expenditure for renewal of minor water structures be reduced by 50 per cent from $13.4 million
to $6.7 million.
Water program: water network – water loss reduction program
Proposed expenditure for the water loss reduction program was reviewed in detail and was deemed
to be efficient (see Section 4.5.10).

AITHER | Final Report 61
Hunter Water expenditure review
4.6.5. Wastewater program: wastewater network
Hunter Water proposes total capital expenditure of $169.7 million on its wastewater networks in the
forecast period across two main programs:
• network capacity and compliance improvement upgrades, and
• network minor renewals.
Each of these is discussed below.
Wastewater program: wastewater network – network capacity and compliance improvement
upgrades
This program includes several sub-components, as follows:
• Expenditure of $26.3 million is proposed for developer-delivered wastewater infrastructure to
extend the system to service new growth. This program has not been reviewed in detail but is
underpinned by growth in customer connections (and associated changes in demand) and is
comparable to the parallel program for water network capacity upgrades. The review of that
program (see Section 4.5.3) established that Hunter Water’s approach to forecasting growth is
reasonable and appropriate, as is the basis for cost estimates. Notwithstanding the uncertainty
associated with growth planning, this otherwise reflects a relatively consistent and ongoing part of
Hunter Water’s business for which associated processes should be well-established. It is
therefore considered that the proposed expenditure is efficient.
• A further $13.8 million (following expenditure in the current period) to complete the Wyee Backlog
Sewer Program. This project was reviewed in detail (see Section 4.5.6) and the expenditure
assessed as efficient.
• An allocation of $12.6 million for capacity increases across the system to manage wet weather
sewer overflows. During a discussion in September 2019 between the EPA, IPART and Aither,
the EPA confirmed the importance of this activity as well as their satisfaction with the
environmental modelling that supports the proposed investment. The techniques adopted by
Hunter Water for sewer planning and assessment, including calibrated modelling and inflow and
infiltration reduction programs, are consistent with industry practice. This program is therefore
considered efficient.
• Proposed expenditure of $11.1 million to improve the reliability of wastewater pump stations has
been briefly reviewed, with the approach adopted by Hunter Water assessed as consistent with
industry practice. Hunter Water has undertaken a detailed assessment of the storage capacity
within the wastewater system that – in the event of a power failure – provides effective
containment until operational teams can respond. The regulatory standards that Hunter Water
must meet are clear, and the measures proposed by Hunter Water in response are consistent
with appropriate and of industry standard. The program is also prioritised to address those
pumping facilities at higher risk. The proposed expenditure is therefore assessed as efficient.
The expenditure proposed for wastewater network capacity and compliance improvement upgrades
in the forecast period is considered efficient.
Wastewater program: wastewater network – network minor renewals program
Hunter Water proposes $28 million for a program of minor civil (pipeline and structures) wastewater
asset renewals, as well as $25.6 million for and renewal of minor mechanical and electrical assets in

AITHER | Final Report 62
Hunter Water expenditure review
the wastewater network. This expenditure was considered as part of the detailed review of the minor
wastewater asset renewal program (see Section 4.5.4).
4.6.6. Wastewater program: wastewater treatment
Hunter Water proposes total expenditure of $255 million for wastewater treatment across two broad
portfolios of major upgrades and minor renewals respectively. All recommendations for related
expenditure have been made in the detailed review of several projects:
• Farley WWTP upgrade (see Section 4.5.5)
• Major wastewater treatment works upgrade program (see Section 4.5.8)
• Minor wastewater asset renewal program (see Section 4.5.4)
• Treatment plant chemical containment upgrade program (see Section 4.5.7).
4.6.7. Stormwater program
The major works proposed as part of this program have been assessed as part of the review of the
stormwater major rehabilitation and renewal program (see Section •), which established that the
approach adopted was appropriate and the expenditure proposed efficient.
4.7. Discretionary programs
4.7.1. Introduction
In addition to the specific capital projects reviewed in the previous section, Aither has also reviewed
the proposed expenditure allocated to discretionary programs for the upcoming regulatory period.
IPART may allow for discretionary expenditure to meet service levels that exceed mandated
standards. In such cases, IPART requires clear evidence that customers are willing to pay the higher
prices required to meet the higher or different standard.
Hunter Water has identified two discretionary programs that it is seeking to fund from overall revenue:
• Stormwater Naturalisation Program (forecast regulatory period), and
• Recycled water for public open space (forecast regulatory period).
The two programs for the forecast regulatory period are driven by the results of a willingness-to-pay
study commissioned by Hunter Water in 2018.
Consideration of the willingness-to-pay study
Aither has been advised that IPART will independently and separately assess whether the willingness
to pay study meets its best practice principles and therefore meets the needs of its customers.
Based on our instructions from IPART, Aither has mainly considered the willingness-to-pay study
based on its implications for estimated costs for the programs. Aither has provided some commentary
on the economic justification for each of the projects for IPART to consider in its assessment. The
following provides an overview of our assessment of these discretionary projects and their proposed
expenditure.
AITHER | Final Report 63
Hunter Water expenditure review
4.7.2. Stormwater Naturalisation Program
The Stormwater Naturalisation Program is based on undertaking discretionary work on Hunter
Water’s stormwater drainage assets to provide increased amenity for its customer base. Hunter
Water’s initial Pricing Submission proposed a separate project related to Lower Cottage Creek
Stormwater Amenity to be undertaken in the current regulatory period, however it has now altered its
position to include this project within the broader Stormwater Naturalisation Program in the upcoming
regulatory period (see further discussion below).
The driver for the discretionary project is to improve the amenity of its stormwater assets based on the
results of the willingness-to-pay study undertaken by Hunter Water in 2018 that is referenced above.
The key finding in relation to this program from the willingness-to-pay study was:
‘Willingness to pay [for stormwater naturalisation] is on average $33.87 a year,
however the distribution of willingness to pay is fairly evenly spread across service
levels, with most respondents willing to pay up to $25 or more for 3 kilometres or
more of channel rehabilitation’8
The willingness-to-pay study sought to understand customers’ willingness to pay for stormwater
amenity through providing them with options regarding bill impacts and expected outputs (i.e. length
of stormwater assets to be naturalised). The following are the questions that were posed within the
study:9
• Do bankwork and/or landscaping on up to 3km (10-30 rugby fields) of open stormwater drains
during 2020-25. This is around 5 per cent of all Hunter Water’s concrete lined open stormwater
drains. Your water bill will increase by between $5 to $20 each year during 2020-25 if you choose
this option.10
• Do bankwork and/or landscaping on 3 to 6km (30-60 rugby fields) of open stormwater drains
during 2020-25 (around 5-15 per cent of Hunter Water’s open stormwater drains). Your water bill
will increase by between $20 to $50 each year during 2020-25
• Do bankwork and/or landscaping on 6 to 10km (60-100 rugby fields) of open stormwater drains
during 2020-25 (around 15-25 per cent of Hunter Water’s open stormwater drains). Your water bill
will increase by between $50 to $70 each year during 2020-25
As a result of the study, Hunter Water has proposed an ‘allowance’ of $11.3 million for the 5-year
pricing period. The allowance is spread uniformly, $2.255 million per annum for each year until 2024-
25. Hunter Water has also proposed an increase in operating costs of $50,000 per annum for litter
and weed management and replanting. The initial allowance was based on a bill increase of $12 per
annum across all Hunter Water customers, however as a result of a variety of contributing factors the
total bill impact will be substantially less (approximately $2 per annum). For this allowance, Hunter
Water is committing to a minimum of 1km of stormwater amenity improvements to be achieved (noting
that it could be between 1km and 3km). While the results of the study showed a higher willingness to
pay, Hunter Water has adopted a lower bill impact with a view to focusing on higher priority sites
within the period.
8 Marsden Jacob, Hunter Water customer willingness to pay survey, p.17 9 Marsden Jacob, Hunter Water customer willingness to pay survey. 10 We have taken the reference of 10-30 rugby fields to indicate that 1km would be a minimum for this option (this
was confirmed through discussions with Hunter Water).

AITHER | Final Report 64
Hunter Water expenditure review
Aither notes that the Preliminary Business Case for the program states that Hunter Water would
undertake a range of works over the regulatory period and that a minimum of 1km of stormwater
amenity improvement works must be achieved (it states that between 1km to 3km could be achieved).
Hunter Water commissioned a consultant, Alluvium, to investigate opportunities for naturalisation of
their stormwater drainage assets. This included consultation with the relevant council officers to
understand other planning proposals and to provide integrated solutions. Alluvium identified a
shortlist of 21 sites - 4 sites in Cessnock, 2 sites in Lake Macquarie and 15 sites in Newcastle.
Alluvium’s report contains specific concept designs for each shortlisted site; however, no costing
estimates appear to have been developed within Alluvium’s report.
Hunter Water has obtained cost estimates from Sydney Water based on a costing exercise that was
undertaken for the Department of Planning using previous works that had been undertaken by
Sydney Water. The cost estimates provided were for different types of naturalisation activities. It was
noted that the rates provided were quite high-level and the actual costs would be highly dependent on
particular constraints and designs. Hunter Water has used this high-level costing information to inform
the potential cost involved in undertaking works for the 21 sites that were shortlisted by Alluvium.
However, it should be noted that the quantum of funding is based on applying the findings of the
willingness to pay study to the entire customer base, at a lower level of bill impact (half).11
In terms of the decisions on which projects should be undertaken and when, Hunter Water informed
Aither that this would be based on further discussions with Councils (as a representation of the
community) and economic assessments based on market and non-market values of potential benefits
from the projects.
Hunter Water is proposing to recover the costs from its entire customer base rather than just the
stormwater customers. This is based on the results of the willingness-to-pay study. Given this, it has
classified the expenditure as ‘corporate’ in nature and to be recovered in line with other corporate
capital expenditure.
Hunter Water states that the procurement plan will be finalised following the approval of the business
case. The design and construction work would be procured externally through experienced
consultant/contractors through its standard tender processes.
Lower Cottage Creek Stormwater Amenity Work
As outlined in its response to IPART’s Issues Paper, Hunter Water is currently undertaking design
work for amenity improvements to Lower Cottage Creek. The works are based on converting a
concrete stormwater channel wall to a stepped, vegetated embankment in Lower Cottage Creek. The
section of creek is between the light rail line and Honeysuckle Drive, Newcastle West. This project
was initially expected to occur over 2018-19 and 2019-20 with a completion date in early 2020,
however the construction works for the project have been delayed until 2020-21. As a result of this,
Hunter Water is proposing to now capture this project as part of the broader Stormwater
Naturalisation Program.
The preferred option for this project involves constructing stepped sandstone block walls with salt
marsh planting on both banks of the creek (approximately 80 metres). Stepped vegetated
embankments represents a modern approach to design of stormwater channels. For existing
channels, such redesign would occur at the end of the asset’s useful life. In the case of Lower
Cottage Creek, it represents a bring-forward of expenditure to coincide with broader community
11 Hunter Water, Preliminary Programme Business Case: Stormwater Amenity Improvement, p.4.

AITHER | Final Report 65
Hunter Water expenditure review
works. The channel is about 90 years old with a remaining design life of about 65 years, so it is
appropriate that Hunter Water considered some external funding.
The estimated cost of the project is $2.3 million (including design costs). However, Hunter Water
successfully applied for funding of $450,000 (excl GST) from the Newcastle Port Community
Contribution Grant to contribute towards construction costs. This brings the project costs down to
approximately $1.8 million. The estimated cost was based on an estimate from an independent
consultant.
Operating cost impacts
Hunter Water estimates that the Stormwater Naturalisation Program will result in a $50,000 operating
cost impact for the business going forward. Hunter Water stated that these cost impacts were not
captured within the information provided to IPART and it will therefore absorb these additional costs
within the business.
Assessment of Stormwater Naturalisation Program
Our assessment of these discretionary programs is focused on the forecast expenditure rather than
whether Hunter Water have demonstrated a need for the projects, including through the willingness-
to-pay study (this will be undertaken by IPART) or any other regulatory considerations. For this
program, our assessment is therefore on whether the allowance that Hunter Water has put forward for
the regulatory period is efficient.
For programs such as this, Aither considers the most appropriate measure of their success should be
on the outcomes that are expected to be delivered to customers from the investment. The focus of the
analysis that underpins this program however, is based on outputs (i.e. km of naturalisation). Given
this, our assessment of the success of the program is aligned with the outputs to be delivered for
customers rather than the outcomes.
Other capital programs put forward by Hunter Water are informed by cost estimates for identified
projects to be undertaken during the regulatory period (or based on previous costs of similar projects).
However, the approach proposed for this program is to have an allowance over the regulatory period
that is linked to the results of the customer willingness-to-pay study.
The estimate provided for Lower Cottage Creek is significantly higher than the estimates provided by
Sydney Water. This is a relatively unique site in that it has a number of constraints that would not
impact on other sites and therefore Aither does not expect that this would form a reasonable estimate
for other stormwater amenity sites. However, it should be noted that spending such a proportion of the
overall allowance on only 80 metres of stormwater assets may raise questions on the ability of Hunter
Water to meet the output requirements from the program within the allowance.
While the Alluvium report had identified a number of short-listed sites, it is not clear whether there are
any processes in place to ensure undertaking work on those sites meets the output and bill
expectations of customers. Aither considers that explicit criteria are developed to guide both Hunter
Water and its stakeholders on how the allowance should be distributed within the program.
Hunter Water has provided its model for estimating the bill impacts from the program. This model
considered the potential bill impacts from both a building blocks and net present value perspectives.
The weighted average cost of capital (WACC) that has been used within the analysis was based on
previous estimates of 4.1 per cent. We note that the WACC estimate is likely to be lower for the
upcoming regulatory period and therefore the calculated impact on customer bills is likely to be
conservative (i.e. higher than the actual bill impact that will eventuate) in the short-term. It should be
noted however, that there is a risk that future increases in the WACC may result in the current level of

AITHER | Final Report 66
Hunter Water expenditure review
expenditure allowance having a greater impact on customer bills (through a higher return on
investment) than has been indicated through the willingness-to-pay study. This may necessitate the
use of various WACC estimates to understand the likely customer bill impacts given that the
investments will be recovered over multiple regulatory periods. This would provide greater certainty
that the investments in the current period will not have a greater bill impact on customers (than
indicated in the willingness-to-pay study) in future regulatory periods.
The outputs of the analysis do not align exactly with the notional bill impact from the program
business cases, however Aither notes that the calculated impact is less than the notional impact
previously documented (and therefore within the bounds of the results of the willingness-to-pay
study).
Hunter Water has captured the allowance for the program as corporate expenditure as a way of
allocating the costs across the customer base rather than simply stormwater customers. The
appropriateness of this will depend on IPART’s assessment of Hunter Water’s willingness-to-pay
study and whether it has demonstrated that the entire customer base is willing to fund this type of
program. It should be noted however that the asset lives associated with corporate assets is much
lower than stormwater assets. For the level of expenditure that is currently proposed this is unlikely to
cause any material issues, however if this level of expenditure were to continue into the future, Aither
considers that a different approach to capturing these projects within the RAB is adopted to ensure
that an appropriate asset life is assigned to the investment.
If IPART deems that Hunter Water has demonstrated a need for the investment through its
willingness-to-pay study we propose that the expenditure allowance be approved as efficient,
however we consider it important to:
• capture the program as an output measure for Hunter Water to ensure sufficient reporting on what
is being achieved from the investment (e.g. kms of naturalisation), and
• consider an ex-post adjustment mechanism for the program whereby only those investments that
meet an investment hurdle (which is aligned with results of the willingness-to-pay study) are
subsequently added to the RAB.12
This adjustment ensures that the risk of not delivering on the designed outputs will rest with Hunter
Water rather than the remaining customer base. In the absence of such a mechanism it is not
possible to state that the investment is efficient as the forecast allowance does not reflect specific
projects with pre-determined outputs or outcomes to measure against.
By including the program as an output measure and applying an ex-post adjustment it will ensure that
the expenditure that is subsequently incorporated into the RAB is consistent with the expected
outputs from the willingness-to-pay study and therefore considered efficient.
4.7.3. Recycled water for public open space
Hunter Water has proposed an expenditure ‘allowance’ of $11.48 million ($2.3 million per annum)
over the five-year period (2020-21 to 2024-25) for the provision of discretionary recycled water for
public open space irrigation.
12 Aither notes that while IPART will require a review of historical capital expenditure as part of the next regulatory period, some capital projects may not be picked up through this process. We have therefore recommended a specific consideration of this project given the nature of how the expenditure is derived.

AITHER | Final Report 67
Hunter Water expenditure review
The initial proposal was based on delivering 150 to 200ML per annum of additional recycled water
with a benefit cost ratio of 0.76. This includes a willingness-to-pay estimate of an extra $2.07 on each
household bill and a long-run marginal cost of potable water of $2.34.13, 14
The willingness-to-pay study sought to understand customers’ willingness to pay for increasing
wastewater recycling for irrigation with options regarding bill impacts and expected outputs. The
following are the questions that were posed within the study:15
• Continue to recycle equivalent to 240 Olympic pools of wastewater each year for irrigation during
2020-25. Continue to make investments in wastewater recycling when it saves drinking water and
the investments lower water bills, or if the investment is needed to meet minimum environmental
standards. Your annual Hunter Water bill will not change if you choose this option.
• Increase Hunter Water’s wastewater recycling so that between 8-20 Olympic-sized swimming
pools additional recycled water is used each year for public open space irrigation on average
when the scheme is operating during 2020-25. This will mean total recycled water for open space
irrigation is equivalent to about 248-260 Olympic pools each year. This will help keep about
3 kilometres of Newcastle waterways healthier. Your annual Hunter Water bill will increase by
about $0.50-$1 during 2020-25.
• Increase Hunter Water’s wastewater recycling so that equivalent to 60-80 Olympic-sized
swimming pools is used each year for public open space irrigation on average when the scheme
is operating during 2020-25. This will mean total recycled water for open space irrigation is
equivalent to 660-680 Olympic-sized pools each year. This will help keep about 5 kilometres of
Newcastle waterways healthier. Your annual Hunter Water bill will increase by about $1-$3 during
2020-25.
• Increase Hunter Water’s wastewater recycling so that equivalent to 120-160 Olympic-sized
swimming pools is used each year for public open space irrigation on average when the scheme
is operating during 2020-25. This will mean total recycled water for open space irrigation is
equivalent to about 720-760 Olympic-sized pools each year. This will help keep about
10 kilometres of Newcastle and Lake Macquarie waterways healthier. Your annual Hunter Water
bill will increase by about $3-$5 during 2020-25.
Hunter Water has undertaken several studies on recycled water opportunities in the lower Hunter
since 2007, such as the Recycled Water Strategy Study (2007), H250 Plan (2008), Hunter River
Catchment Effluent Management Master Plan (2010-12) and Recycled Water Opportunities Study
(2012) specifically undertaken for the LHWP. A long list of potential recycling sub-options was
compiled by Hunter Water based on these studies. Irrigation of existing parks / open spaces, and dual
reticulation schemes for new residential development account for more than half of the opportunities.
Despite a long list of potential recycling options, Hunter Water has not yet put forward its
selection/investment criteria and/or a list of proposed projects. Aither is therefore unable to test the
economic efficiency of the specific projects that will be undertaken, or whether the outputs are
achievable for the bill increases proposed.
Through the review process, Hunter Water indicated that it was not seeking to recover the costs
associated with avoided and deferred costs through IPART’s recycled water pricing framework.
Hunter Water advised that this represented approximately $5 million of the program. Given this, the
13 The derivation of this estimate of long-run marginal cost has not been tested. It is noted that IPART has indicated it will be issuing guidance on how to estimate long-run marginal cost.
14 Aither notes that this willingness-to-pay estimate is different to that outlined in the Marsden Jacob study. Aither has used the Hunter Water documentation as this is the most recent and what the decision-making is based on.
15 Marsden Jacob, Hunter Water customer willingness to pay survey.

AITHER | Final Report 68
Hunter Water expenditure review
focus of our analysis was based on the remaining $6 million and the alignment with the results of the
willingness-to-pay study. This resulted in a reduction in the bill impact to customers and the expected
outputs from Hunter Water. As a result, Hunter Water’s revised bill impact assessment is less than $1
and it has therefore revised its output target to at least 20ML per annum by 2024-25.
Hunter Water has advised Aither that they will be seeking contributions from the owners/managers of
the open space provided with recycled water, which could include user charges. However, as specific
projects have not yet been selected, this information is not yet available.
Operating cost impacts
Hunter Water estimates that the Recycled Water for Public Space Irrigation Program will result in a
$150,000 operating cost impact for the business going forward. As with the Stormwater Naturalisation
Program, Hunter Water stated that these cost impacts were not captured within the information
provided to IPART and it will therefore absorb these additional costs within the business.
Assessment of recycled water for open space program
Aither’s assessment of this program of expenditure aligns with its assessment of the Stormwater
Naturalisation Program outlined above. After adjusting for the removal of the potential deferred costs
($4.8 million), our approach to the assessment is the same as the Stormwater Naturalisation
Program.
As with the Stormwater Naturalisation Program, Hunter Water has provided its model for estimating
the bill impacts from the program. This model considered the potential bill impacts from both a
building blocks and net present value perspectives. Aither considers that it may be worthwhile a
consistent approach is developed for these models to ensure that the bill impacts remain appropriate
in the future when the program involves long-lived capital investments.
Consistent with the findings for the Stormwater Naturalisation Program, if IPART deems that Hunter
Water has demonstrated a need for the investment through its willingness-to-pay study we propose
that the expenditure allowance be approved as efficient, however we consider it important to:
• capture the program as an output measure for Hunter Water to ensure sufficient reporting on what
is being achieved from the investment (e.g. additional volume of recycled water for open space),
and
• consider an ex-post adjustment mechanism for the program whereby only those investments that
meet an investment hurdle (which is aligned with results of the willingness-to-pay study) are
subsequently added to the RAB.16
This adjustment ensures that the risk of not delivering on the designed outputs will rest with Hunter
Water rather than the remaining customer base. In the absence of such a mechanism it is not
possible to state that the investment is efficient as the forecast allowance does not reflect specific
projects with pre-determined outputs or outcomes to measure against.
By including the program as an output measure and applying an ex-post adjustment it will ensure that
the expenditure that is subsequently incorporated into the RAB is consistent with the expected
outputs from the willingness-to-pay study and therefore considered efficient.
16 Aither notes that while IPART will require a review of historical capital expenditure as part of the next regulatory period, some capital projects may not be picked up through this process. We have therefore recommended a specific consideration of this project given the nature of how the expenditure is derived.

AITHER | Final Report 69
Hunter Water expenditure review
4.7.4. Other jurisdictions
Aither notes that as part of its submission to the 2016 Price Review, Melbourne Water put forward
proposed expenditure ($29.9 million) to improve liveability. The focus of the expenditure was based
on, among other things, delivering green space for shade and cooling near waterways and returning
concrete drains to a more natural state.17
In reviewing this proposed expenditure, the Essential Services Commission (and its consultant
Deloitte) had concerns with the lack of detail from Melbourne Water regarding how it would deliver the
green space program within the regulatory period. Melbourne Water was seeking approval for an
expenditure allowance but had not yet defined the projects within this allowance. Given this, the
Essential Services Commission considered it was unable to make a proper assessment about the
extent of the expected benefits to customers or the efficiency and prudency of the expenditure. As a
result, the Essential Services Commission did not approve the expenditure associated with the green
space program.
4.7.5. Assessment of discretionary programs
Based on the above assessment, the following table outlines Aither’s assessment of Hunter Water’s
proposed discretionary programs. Aither has not made any assessment in relation to operating
expenditure associated with these programs as Hunter Water has indicated that it is not seeking to
recover these costs from customers and will be absorbing those costs over the period. Aither notes
that the discretionary projects are subject to IPART’s assessment of the willingness-to-pay study and
therefore we have not made specific recommendations, but rather provided our assessment of the
proposed expenditure.
Table 15 Assessment of capital expenditure for discretionary programs ($000s, $2019-20)
2019-
20
2020-
21
2021-
22
2022-
23
2023-
24
2024-
25
Total
Hunter Water forecast
discretionary capital
expenditure
2,083 4,551 4,551 4,551 4,551 4,551 24,838
Adjustments
Lower Cottage Creek (2,083) (2,083)
Recycled water program (960) (960) (960) (960) (960) (4,800)
Sub-total adjustments (2,083) (960) (960) (960) (960) (960) (6,883)
Total assessed
discretionary capital
expenditure
- 3,591 3,591 3,591 3,591 3,591 17,955
17 Essential Services Commission, Melbourne Water Price Review 2016 – Final Decision, p.37.

AITHER | Final Report 70
Hunter Water expenditure review
4.8. Overall assessment of capital program efficiency
Project and program planning and scoping
The key factors that typically influence the efficiency of an organisation’s capital expenditure relate to
the maturity and robustness of systems and processes for asset management, governance and risk.
These systems enable:
• access to timely and relevant information on current and future service requirements, based on
demand and connections forecasting, asset condition assessments, changing customer,
community and regulatory requirements, and current performance
• relevant analytical assessment of this information to develop appropriate responses, including
long-term capital and operating expenditure implications
• appropriate decision-making frameworks that consider financial, whole-of-life assessments, non-
financial aspects and corporate risk within a robust governance framework
• project planning processes that specify outcomes that are timely, effective and optimise risk and
financial impacts
• project delivery arrangements that deliver on time and at appropriate costs.
As part of this review Aither has considered various factors relating to the efficiency of Hunter Water’s
capital delivery, including asset management, strategic planning, governance and risk (see Section
3), as well as part of the review of individual projects and programs. In general, Hunter Water’s
systems and processes have been assessed as consistent with or leading industry practice. Where
specific issues have been identified in relation to projects or programs, appropriate recommendations
have been made.
The only broader efficiency issue that has been identified relates to the process of project scoping
and decision-making where there is a material dependency on subjective risk assessment. Beyond
the related recommendations made for specific projects and programs, there are several other minor
programs where similar issues are likely to arise. Based on, and consistent with, the findings from the
detailed review, a reduction in the proposed expenditure for the forecast period for the mandatory
standards program is also recommended, comprising:
• $0.2 million per annum for the water program
• $0.6 million per annum for the wastewater program
These reductions are driven by consideration of: wastewater pump station compliance improvement;
tanker receival facility upgrades; generator connection point improvement; and the firefighting
improvement program.
Project delivery efficiencies
An organisation’s project delivery efficiency is best supported by employing a selection of delivery
methods that are appropriate for the nature of the works. Hunter Water is generally considered to
have good practices that align with standard industry approaches.
Hunter Water has undertaken internal reviews to ensure that outcomes for ongoing programs align
with the benchmark of comparable utilities in the water industry. As an example, Hunter Water
provided data for sewer main renewals that demonstrate they achieve a lower unit cost than many
utilities within their cohort (see Table 16).
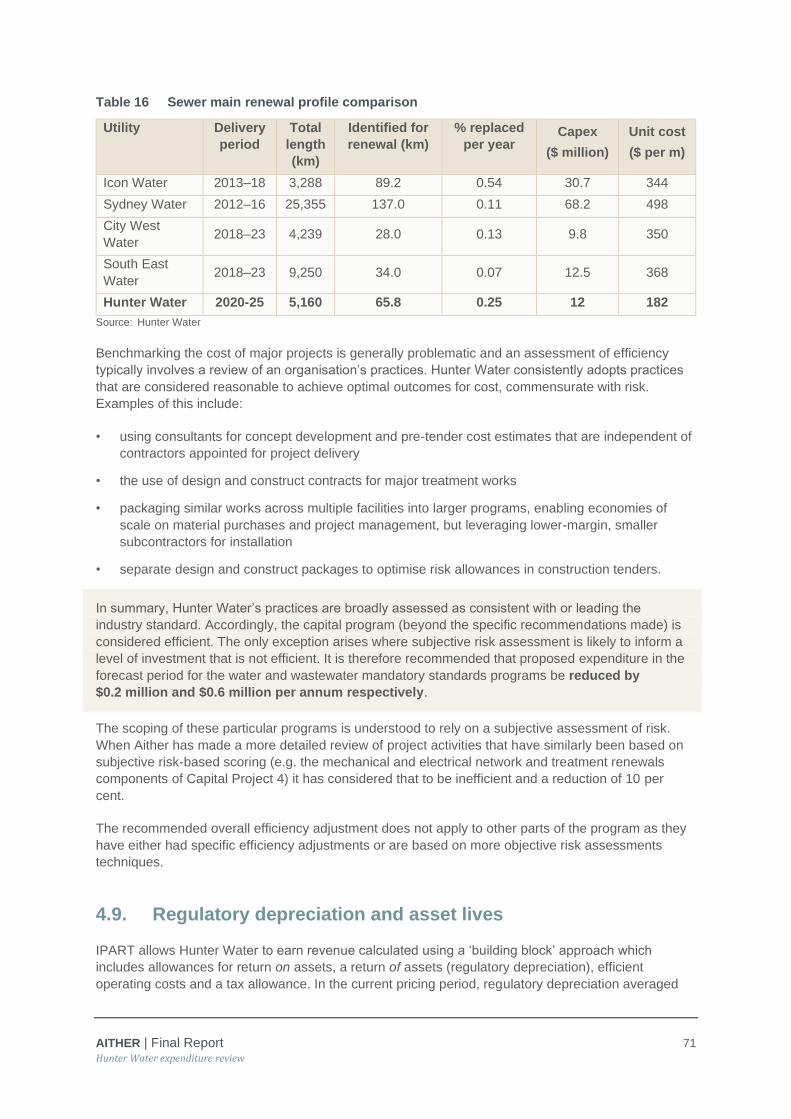
AITHER | Final Report 71
Hunter Water expenditure review
Table 16 Sewer main renewal profile comparison
Utility Delivery
period
Total
length
(km)
Identified for
renewal (km)
% replaced
per year Capex
($ million)
Unit cost
($ per m)
Icon Water 2013–18 3,288 89.2 0.54 30.7 344
Sydney Water 2012–16 25,355 137.0 0.11 68.2 498
City West
Water 2018–23 4,239 28.0 0.13 9.8 350
South East
Water 2018–23 9,250 34.0 0.07 12.5 368
Hunter Water 2020-25 5,160 65.8 0.25 12 182
Source: Hunter Water
Benchmarking the cost of major projects is generally problematic and an assessment of efficiency
typically involves a review of an organisation’s practices. Hunter Water consistently adopts practices
that are considered reasonable to achieve optimal outcomes for cost, commensurate with risk.
Examples of this include:
• using consultants for concept development and pre-tender cost estimates that are independent of
contractors appointed for project delivery
• the use of design and construct contracts for major treatment works
• packaging similar works across multiple facilities into larger programs, enabling economies of
scale on material purchases and project management, but leveraging lower-margin, smaller
subcontractors for installation
• separate design and construct packages to optimise risk allowances in construction tenders.
In summary, Hunter Water’s practices are broadly assessed as consistent with or leading the
industry standard. Accordingly, the capital program (beyond the specific recommendations made) is
considered efficient. The only exception arises where subjective risk assessment is likely to inform a
level of investment that is not efficient. It is therefore recommended that proposed expenditure in the
forecast period for the water and wastewater mandatory standards programs be reduced by
$0.2 million and $0.6 million per annum respectively.
The scoping of these particular programs is understood to rely on a subjective assessment of risk.
When Aither has made a more detailed review of project activities that have similarly been based on
subjective risk-based scoring (e.g. the mechanical and electrical network and treatment renewals
components of Capital Project 4) it has considered that to be inefficient and a reduction of 10 per
cent.
The recommended overall efficiency adjustment does not apply to other parts of the program as they
have either had specific efficiency adjustments or are based on more objective risk assessments
techniques.
4.9. Regulatory depreciation and asset lives
IPART allows Hunter Water to earn revenue calculated using a ‘building block’ approach which
includes allowances for return on assets, a return of assets (regulatory depreciation), efficient
operating costs and a tax allowance. In the current pricing period, regulatory depreciation averaged

AITHER | Final Report 72
Hunter Water expenditure review
approximately $36 million per annum ($2015-16) which was about 12 per cent of the total revenue
allowance.
In the past, Hunter Water’s regulatory depreciation allowance was based on an overall asset life of
100 years for new assets and 70 years for existing assets. During the previous expenditure review,
Jacobs was required to assess Hunter Water’s remaining useful asset lives. This resulted in IPART
approving a gradual transition of asset lives to 67 years for new assets, and for 62 years for existing
assets. IPART’s 2016 Final Report indicated that Hunter Water would undertake further work on asset
lives prior to the next price review.
As well as reviewing the asset lives, Hunter Water also reviewed the categories for its RAB. As a
result of the review Hunter Water proposed to further disaggregate the RAB from 4 product categories
into 20 separate RAB components with individual asset lives associated with each RAB component.
Hunter Water has provided a report on the methodology for the disaggregation – our assessment of
the methodology is based on this report and further information and discussions with Hunter Water
staff.
The impact of the proposed change, if approved, would be to increase regulatory depreciation by
about $25 million per annum ($2019-20).
It should be noted that by changing the asset lives associated with the RABs for existing assets, the
basis on which the opening RABs were first determined should be acknowledged. The opening RAB
values for Hunter Water were back-solved and set to reflect prices prevailing at that time (this is
known as the ‘line-in-the-sand’ approach). Therefore, had asset lives (for regulatory purposes) been
what Hunter Water is now proposing, a lower opening RAB is likely to have eventuated. The result of
higher asset lives (and therefore lower regulatory depreciation) was a higher RAB value during the
setting of initial RABs. We note that asset lives are updated over time, however this is a significantly
different set of asset lives from the setting of the initial RAB.
Aither’s review has not considered this issue, but rather focused on the proposed methodology going
forward. However, it is an issue that IPART will need to consider in the broader context of the review.
To consider these issues regarding the change in methodology, we have considered:
• the disaggregation of the RAB values
• Hunter Water’s proposed asset lives for each asset class, and
• Hunter Water’s fixed asset register.
4.9.1. Disaggregation of the RAB
Hunter Water allocated each of the four product RABs into five classes (civil; mechanical/electrical;
equipment; intangible; non-depreciating) to make 20 individual RABs. The allocation to the different
RABs was based on apportioning the RAB to each class based on the value of assets in each class,
as recorded in the Fixed assets Register. The gross replacement cost (GRC) was used for
determining the asset values for the corporate classes, with the depreciated replacement cost (DRC)
used for each other class. Hunter Water stated that the reasoning behind the different approaches
was that:
• The majority of assets in water, wastewater and stormwater have longer lives, more in line with
the asset lives adopted in previous determinations. Therefore, it was expected that the current
asset values in the RAB will more closely reflect the DRC rather than the GRC.

AITHER | Final Report 73
Hunter Water expenditure review
• The majority of assets within the corporate RAB have shorter asset lives. As the corporate RAB
had been depreciated on the same basis as the other RABs for previous determinations, Hunter
Water was of the view that applying the DRC method would overstate the value of non-
depreciating assets and equipment, and understate the value of intangibles. Given this, Hunter
Water apportioned the corporate RAB into asset classes based on the GRC.
Table 17 presents the results of this analysis from Hunter Water.
Table 17 Hunter Water’s proposed RAB opening balances ($m, $2019-20)
RAB Asset Class Water Wastewater Stormwater Corporate
Civil 1,095.0 741.3 49.0 14.1
Electrical/
Mechanical 100.7 133.8 0.0 3.0
Equipment 9.1 7.6 0.1 57.3
Intangibles 0.0 0.0 0.0 71.4
Non-Depreciating 36.3 552.9 0.9 4.7
Total Opening
RAB 1,241.1 1,435.7 50.0 150.5
Source: Hunter Water, Disaggregation of the RAB, p.3.
Table 18 outlines the difference in values that are allocated to each corporate asset class when using
the GRC approach rather than the DRC. There is not a material difference in the values of civil and
electrical/mechanical, and while there are significant differences in the equipment and intangibles
values (and to a lesser extent, non-depreciating assets), this difference largely cancels-out because
Hunter Water has adopted the same asset life of 5 years for both existing equipment and intangibles.
Table 18 Hunter Water’s proposed corporate RAB opening balances ($m, $2019-20)
RAB Asset Class Corporate (GRC) Corporate (DRC) Difference
Civil 14.1 17.4 (3.3)
Electrical/ Mechanical 3.0 5.4 (2.4)
Equipment 57.3 83.3 (26.0)
Intangibles 71.4 31.6 39.8
Non-Depreciating 4.7 12.8 (8.1)
Total Opening RAB 150.5 150.5 -
Source: Hunter Water, Disaggregation of the RAB, p.11.
4.9.2. Determining asset lives
The calculated asset life for each RAB category was based on a weighted average of the asset lives
recorded in the Fixed Assets Register. The weighting factor was the annual depreciation of each entry
divided by the annual depreciation total for all entries assigned to the particular RAB category. The
asset lives calculated by Hunter Water are outlined in Table 19 and Table 20 below.

AITHER | Final Report 74
Hunter Water expenditure review
Table 19 New asset lives by RAB categories proposed by Hunter Water
Asset class Water
assets
Wastewater
assets
Stormwater
assets
Corporate
assets
Civil 90 90 117 42
Electrical/Mechanical 25 25 25 25
Equipment 11 11 11 11
Intangibles 5 5 5 5
Non-Depreciating
Source: Hunter Water, Annual Information Return.
Table 20 Remaining asset lives of existing assets by RAB categories proposed by Hunter
Water
Asset class Water
assets
Wastewater
assets
Stormwater
assets
Corporate
assets
Civil 48 62 47 22
Electrical/Mechanical 16 16 16 16
Equipment 5 5 5 5
Intangibles 5 5 5 5
Non-Depreciating
Source: Hunter Water, Annual Information Return.
The asset lives assigned to entries in the Fixed Assets Register for statutory accounting purposes are
informed by engineering estimates of useful lives. Through the review, Hunter Water provided a
comparison of its proposed asset lives against the NSW Reference Rates Manual and Sydney Water.

AITHER | Final Report 75
Hunter Water expenditure review
Source: Hunter Water
Figure 18 Comparison of asset lives
At the FAR individual entry level, there does not appear to be a major difference between Sydney
Water and Hunter Water in terms of asset lives. However, the asset life for a RAB category is the
combination of the asset lives in the FAR corresponding to projects aggregated to form this RAB
category. Given the different lives and project values, the RAB life needs to be a weighted average of
the component projects.
Jacobs reviewed Hunter Water’s asset lives as part of the 2016 Determination. We note that this was
a temporary measure intended to provide Hunter Water with time to undertake their own assessment.
In reviewing this approach, Aither observes:
• Jacobs used project value as its weighting whereas weighting by depreciation (as proposed by
Hunter Water) appears more correct
• Jacobs review was based on valuations from the fixed assets register which Hunter Water has
subsequently identified as overstated (and has since corrected), and
• Jacobs, for new assets, used a capex forecast for 5 years to derive its weightings – this could
easily be different to the longer-term weightings given the lumpy nature of investments.
Given the concerns regarding the Jacobs assessment we consider it reasonable that Hunter Water’s
assessment would result in a different outcome.

AITHER | Final Report 76
Hunter Water expenditure review
As there is a significant increase in the regulatory depreciation allowance as a result of the change in
methodology, Aither has sought to focus on the key areas that are driving this impact. One of the key
areas is the length of asset lives for intangible assets.
Intangible assets in this context largely refer to (but not solely) software-related assets. This is a
growing asset class within Hunter Water and has a relatively low asset life of 5 years. In reviewing the
recommended asset lives for software assets from the Australian Tax Office, it appears that most
software assets are assigned a life between 4 and 7 years.18 Given this, the proposed 5 years for new
assets is not unreasonable.
Further to the consideration of how differences between businesses can be a function of the amount
of assets in each RAB category. Indeed, a weakness of the Jacob’s review, mentioned above, was
that they used a 5-year investment profile on which to base weightings. Hunter Water in their
response to IPART listed the following comparison of 5-year investment profiles:
Table 21 Proportion of forward capital program by asset class
Capital Program Sydney Water Hunter Water
Civil 60.6% 53.9%
Electrical/Mechanical 19.9% 26.0%
Equipment/Intangibles (Electronic) 14.9% 18.3%
Non-Depreciating 4.6% 1.8%
Source: Hunter Water, Submission to IPART Issues Paper.
This comparison suffers the same weakness attributed to the Jacob’s review. Aither believes the
longest history of investment profile should be used, and that is the Fixed Assets Register –
recognising that history is not necessarily representative of the future.
Aither acknowledges there are some concerns regarding the ongoing accuracy of the FAR(outlined in
section 4.9.3 below), however it considers that Hunter Water’s methodology for calculating asset lives
for each RAB category is appropriate.
In relation to the estimated lives for new assets, Aither notes that these are reasonably consistent with
the NSW Reference Manual and Sydney Water (as outlined above in Figure 18). For the intangibles
asset category, it is noted that adoption of 5 years is consistent with the ATO’s treatment of software
and is therefore considered appropriate. Given this, Aither recommends that the proposed new asset
lives are accepted as appropriate.
Transition RAB
To manage the customer impact from the change in methodology, Hunter Water is also proposing to
quarantine the RAB opening balances for corporate equipment and intangibles assets into a
‘transition’ RAB component. Hunter Water proposes that this sum of $128.7 million is proposed to be
depreciated over 50 years in order to lessen customer impacts. Hunter Water says this broadly
equates to its estimate of the historic under-recovery of regulatory depreciation, largely in the
corporate product area.
18 Australian Taxation Office, Taxation Ruling 2019/5: Effective life of depreciating assets https://www.ato.gov.au/law/view/document?DocID=TXR/TR20195/NAT/ATO/00001

AITHER | Final Report 77
Hunter Water expenditure review
Aither has not sought to assess the validity of this approach within IPART’s framework, nor the
appropriateness of the selection of corporate equipment and intangible assets as the basis for the
transition RAB.
4.9.3. Fixed Assets Register
Hunter Water operates and maintains a Fixed Assets Register that has the details of the utility’s
assets that it is required to maintain (there are over 66,000 entries within the register). Its proposed
approach to disaggregating the RAB and applying new asset lives relies on the accuracy of the data
held within its fixed assets register.
The values and lives of most assets within the Fixed Assets Register are reviewed on a 5-yearly cycle
by Public Works Advisory. Aither has viewed the latest sewer and water network reports
(representing the majority of assets by value in the fixed assets register and revalued by Public Works
Advisory) and is satisfied they provide an independent and structured analysis of current asset
replacement costs for:
• Sewer network (2013-14)
• Stormwater network (2014-15)
• Buildings (2015-16)
• Land (2015-16)
• Wastewater treatment works (2015-16)
• Water resources (2016-17)
• Water networks (2017-18)
As for asset lives, the Public Works Advisory reports adopt lives generally consistent with the range of
values Hunter Water uses in its fixed assets register. Public Works Advisory had no condition data for
water network assets, while for sewerage assets, Hunter Water’s current asset condition assessment
is focussed on a small number of high-priority critical assets, consequently no condition-based
reassessments of asset lives were undertaken.
The only adjustments made to asset lives were for assets having less than three years of remaining
useful life at the time of revaluation; these lives were upwardly revised to three years.
There is quite a number of assets in the fixed assets register which are not yet retired and have a life-
to-date which is greater than the estimated life. They were excluded by Hunter Water in its analysis
of weighted average lives, in the belief that their inclusion was distortionary. During the review
process, Hunter Water was requested to undertake analysis on the materiality of this issue of not
extending asset lives.
Hunter Water advised that there were 1,118 civil and electrical assets (662 civil and 456 electrical)
that had no remaining asset life within the FAR. The gross replacement cost of these assets was
$275 million (or four per cent of Hunter Water’s total RAB). To undertake the analysis, Hunter Water
extended the asset lives of those fully written down (civil and electrical) assets by five years. This
resulted in a minor change to the analysis through a reduction in the asset lives and therefore a minor
increase in the depreciation.
Hunter Water did not adjust the FAR to consider intangibles and equipment assets as they advised
that these assets were effectively retired from the FAR when fully written down however they were not

AITHER | Final Report 78
Hunter Water expenditure review
removed from the FAR due to the volume and practicality of doing this. Through our own analysis of
the FAR, we noted that while the number of assets that had no remaining asset lives was significant,
the gross replacement cost value of these assets was likely to be less than that identified by Hunter
Water for the civil and electrical assets.
4.9.4. Aither's assessment
Aither notes that the objective for depreciation within a regulatory setting is to align the recovery of the
asset (regulatory depreciation) with the use of the regulatory assets. The current aggregated
approach to the RAB and regulatory depreciation does not provide a close alignment between the
recovery and the use of the assets. Given this, Hunter Water has proposed an alternative approach to
maintaining the RAB and deriving its regulatory depreciation.
Aither considers that Hunter Water’s proposed methodologies for disaggregating the RAB values and
asset lives (both new and existing lives) appear reasonable. While we note that there are concerns
regarding the integrity of the FAR, Hunter Water has demonstrated that the errors do not result in
material impacts. Given this, we consider that the proposed approach will result in a better alignment
of depreciation and asset lives than the current aggregated approach.
As outlined above, through our review we had some concerns regarding the accuracy of the FAR.
Aither considers there are two key aspects to the current and ongoing accuracy of the FAR:
• Initial accuracy for establishing the disaggregated values, and
• Ongoing accuracy for determining the ‘remaining asset lives’ for future regulatory periods.
Based on the information provided by Hunter Water, Aither considers that the concerns that we have
regarding the integrity of the FAR are not sufficient enough to oppose the proposed disaggregated
approach. The transition to a more disaggregated RAB that is proposed by Hunter Water, while not
perfect, will result in a more economically efficient recovery of asset values than the current
aggregated approach.
Aither believes the FAR should include regular updates to reduce and extend asset lives based on
current knowledge of the asset’s condition, performance and latest expected replacement date. While
we note that the analysis provided by Hunter Water demonstrates that the existing concerns do not
currently result in material impacts within the FAR, going forward we consider that improvements in
the maintenance of the FAR are required to ensure the ongoing integrity of the model in order for it to
be used in determining regulatory asset lives.
To ensure confidence in the integrity of the FAR and how it is maintained, Aither is of the view that a
process is agreed between Hunter Water and IPART that establishes how the FAR will be maintained
over time (e.g. through the use of Hunter Water’s internal auditor) to ensure that IPART has
confidence in the integrity of the FAR in subsequent reviews and therefore avoids the need to re-
consider the FAR when using it to determine appropriate asset lives.
4.10. Deliverability of capital expenditure
Hunter Water is embarking on a challenging capital works program, which involves both a material
increase on past levels of expenditure across the period as a whole, as well as a substantial peak of
$200 million in 2020-21. The increase is being driven by a variety of different programs, from major
works to programs involving many complex individual sites.
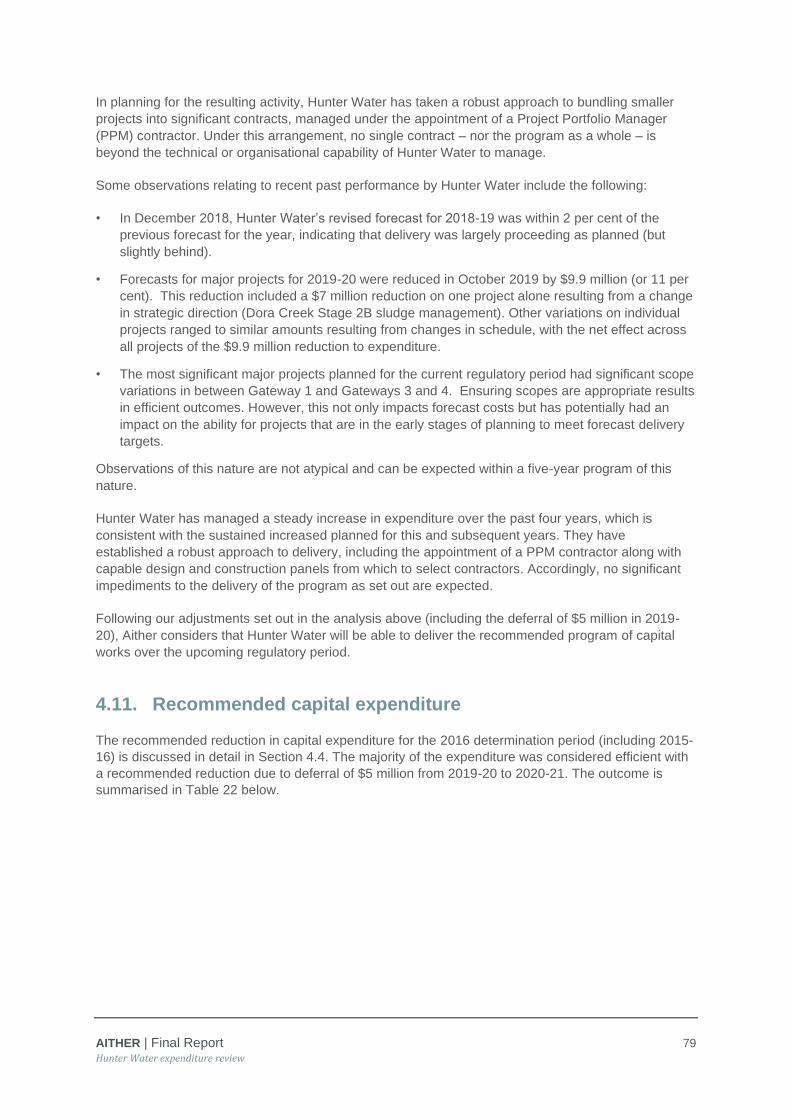
AITHER | Final Report 79
Hunter Water expenditure review
In planning for the resulting activity, Hunter Water has taken a robust approach to bundling smaller
projects into significant contracts, managed under the appointment of a Project Portfolio Manager
(PPM) contractor. Under this arrangement, no single contract – nor the program as a whole – is
beyond the technical or organisational capability of Hunter Water to manage.
Some observations relating to recent past performance by Hunter Water include the following:
• In December 2018, Hunter Water’s revised forecast for 2018-19 was within 2 per cent of the
previous forecast for the year, indicating that delivery was largely proceeding as planned (but
slightly behind).
• Forecasts for major projects for 2019-20 were reduced in October 2019 by $9.9 million (or 11 per
cent). This reduction included a $7 million reduction on one project alone resulting from a change
in strategic direction (Dora Creek Stage 2B sludge management). Other variations on individual
projects ranged to similar amounts resulting from changes in schedule, with the net effect across
all projects of the $9.9 million reduction to expenditure.
• The most significant major projects planned for the current regulatory period had significant scope
variations in between Gateway 1 and Gateways 3 and 4. Ensuring scopes are appropriate results
in efficient outcomes. However, this not only impacts forecast costs but has potentially had an
impact on the ability for projects that are in the early stages of planning to meet forecast delivery
targets.
Observations of this nature are not atypical and can be expected within a five-year program of this
nature.
Hunter Water has managed a steady increase in expenditure over the past four years, which is
consistent with the sustained increased planned for this and subsequent years. They have
established a robust approach to delivery, including the appointment of a PPM contractor along with
capable design and construction panels from which to select contractors. Accordingly, no significant
impediments to the delivery of the program as set out are expected.
Following our adjustments set out in the analysis above (including the deferral of $5 million in 2019-
20), Aither considers that Hunter Water will be able to deliver the recommended program of capital
works over the upcoming regulatory period.
4.11. Recommended capital expenditure
The recommended reduction in capital expenditure for the 2016 determination period (including 2015-
16) is discussed in detail in Section 4.4. The majority of the expenditure was considered efficient with
a recommended reduction due to deferral of $5 million from 2019-20 to 2020-21. The outcome is
summarised in Table 22 below.
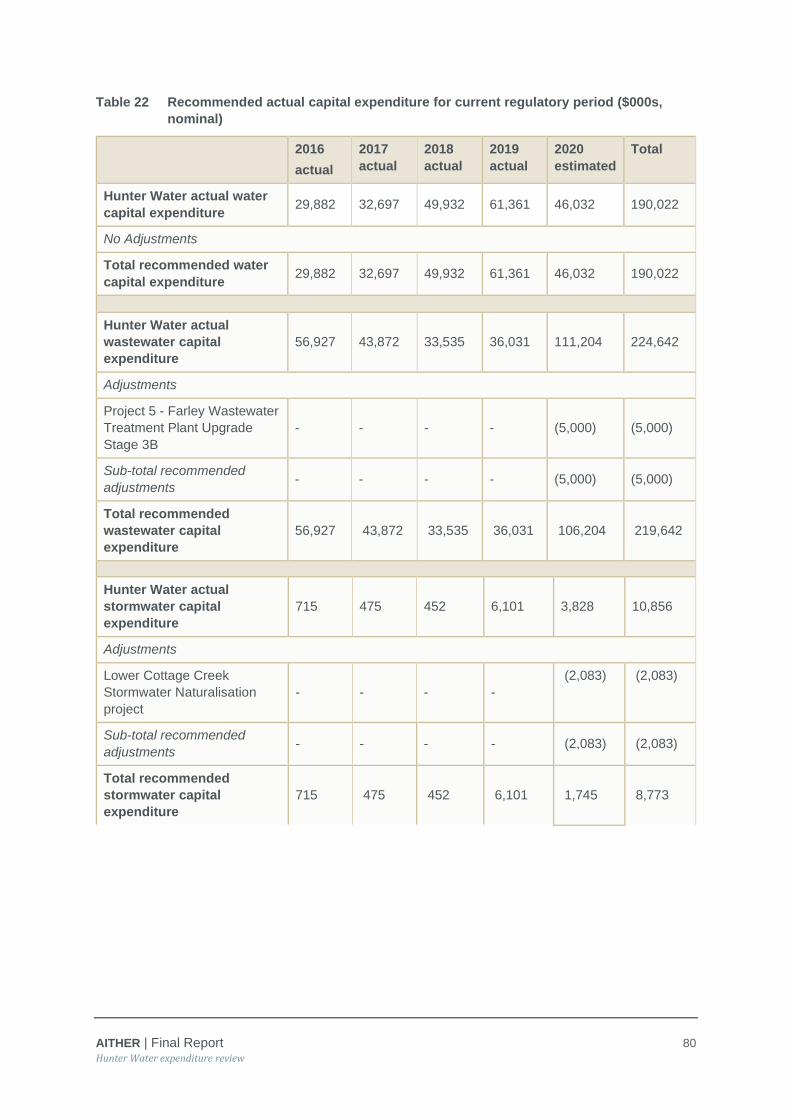
AITHER | Final Report 80
Hunter Water expenditure review
Table 22 Recommended actual capital expenditure for current regulatory period ($000s,
nominal)
2016
actual
2017
actual
2018
actual
2019
actual
2020
estimated
Total
Hunter Water actual water
capital expenditure 29,882 32,697 49,932 61,361 46,032 190,022
No Adjustments
Total recommended water
capital expenditure 29,882 32,697 49,932 61,361 46,032 190,022
Hunter Water actual
wastewater capital
expenditure
56,927 43,872 33,535 36,031 111,204 224,642
Adjustments
Project 5 - Farley Wastewater
Treatment Plant Upgrade
Stage 3B
- - - - (5,000) (5,000)
Sub-total recommended
adjustments - - - - (5,000) (5,000)
Total recommended
wastewater capital
expenditure
56,927 43,872 33,535 36,031 106,204 219,642
Hunter Water actual
stormwater capital
expenditure
715 475 452 6,101 3,828 10,856
Adjustments
Lower Cottage Creek
Stormwater Naturalisation
project
- - - -
(2,083) (2,083)
Sub-total recommended
adjustments - - - - (2,083) (2,083)
Total recommended
stormwater capital
expenditure
715 475 452 6,101 1,745 8,773

AITHER | Final Report 81
Hunter Water expenditure review
Hunter Water actual
corporate capital
expenditure
12,151 9,713 20,223 15,747 20,310 65,993
No Adjustments
Total recommended
corporate capital
expenditure
12,151 9,713 20,223 15,747 20,310 65,993
Source: All data sourced from Hunter Water’s AIR and consideration by Aither of recommended project adjustments.
Following the review of Hunter Water’s forecast capital expenditure for the next regulatory period,
some adjustments are recommended as summarised in the table below (this includes the adjustments
to proposed discretionary expenditure).
Table 23 Recommended forecast capital expenditure for upcoming regulatory period ($000s,
$2019-20)
2020-21 2021-22 2022-23 2023-24 2024-25 Total
Hunter Water forecast of
water capital expenditure 39,202 55,346 61,401 57,832 59,609 273,389
Adjustments
Project 3 - Water network
Capacity Upgrades (1,360) (1,360) (1,360) (1,360) (1,360) (6,800)
Project 7 – Treatment Plant
Chemical Containment and
Safety Upgrades Program
(900) (900) (900) (900) (900) (4,500)
Adjustment to water treatment
minor works (340) (340) (340) (340) (340) (1,700)
Adjustment to water network
(critical mains) - - (1,900) (1,900) - (3,800)
Adjustment to minor water
mechanical and electrical
network assets
(260) (260) (260) (260) (260) (1,300)
Adjustment to minor water
structures (1,340) (1,340) (1,340) (1,340) (1,340) (6,700)
Adjustment to Mandatory
Standards Program (200) (200) (200) (200) (200) (1,000)
Sub-total recommended
adjustments (4,400) (4,400) (6,300) (6,300) (4,400) (25,800)
Total recommended water
capital expenditure 34,802 50,946 55,101 51,532 55,209 247,589

AITHER | Final Report 82
Hunter Water expenditure review
Hunter Water forecast of
wastewater capital
expenditure
118,869 83,928 85,847 74,309 61,742 424,695
Adjustments
Project 4 - Minor Asset
Renewals Programs -
Wastewater
(2,030) (2,287) (2,338) (2,594) (2,543) (11,791)
Project 7 – Treatment Plant
Chemical Containment and
Safety Upgrades Program
(900) (900) (900) (900) (900) (4,500)
Project 8 - Other Wastewater
Treatment Plant Upgrade
Program
- - - (16,238) (7,688) (23,926)
Project 5 - Farley Wastewater
Treatment Plant Upgrade Stage
3B
5,000 - - - - 5,000
Adjustment to Mandatory
Standards Program (600) (600) (600) (600) (600) (3,000)
Sub-total recommended
adjustments 1,470 (3,787) (3,838) (20,332) (11,730) (38,217)
Total recommended
wastewater capital
expenditure
120,339 80,141 82,010 53,977 50,011 386,478
Hunter Water forecast of
stormwater capital
expenditure
3,652 2,768 4,664 5,894 6,150 23,127
No Adjustments
Total recommended
stormwater capital
expenditure
3,652 2,768 4,664 5,894 6,150 23,127
Hunter Water forecast of
corporate capital expenditure 38,679 43,175 23,199 25,630 19,514 150,196
Adjustments
Recycled water program (960) (960) (960) (960) (960) (4,800)
Total recommended corporate
capital expenditure 37,719 42,215 22,239 24,670 18,554 145,396
Source: All data sourced from Hunter Water’s Submission to IPART and consideration by Aither of recommended project
adjustments.
Note: ICT capital expenditure is included in the above forecasts. The assessment of ICT expenditure is contained in section 6.
Based on the above adjustments, Table 24 provides the recommended capital expenditure by asset
class. We have used the asset class information from the AIR and accounted for our adjustments
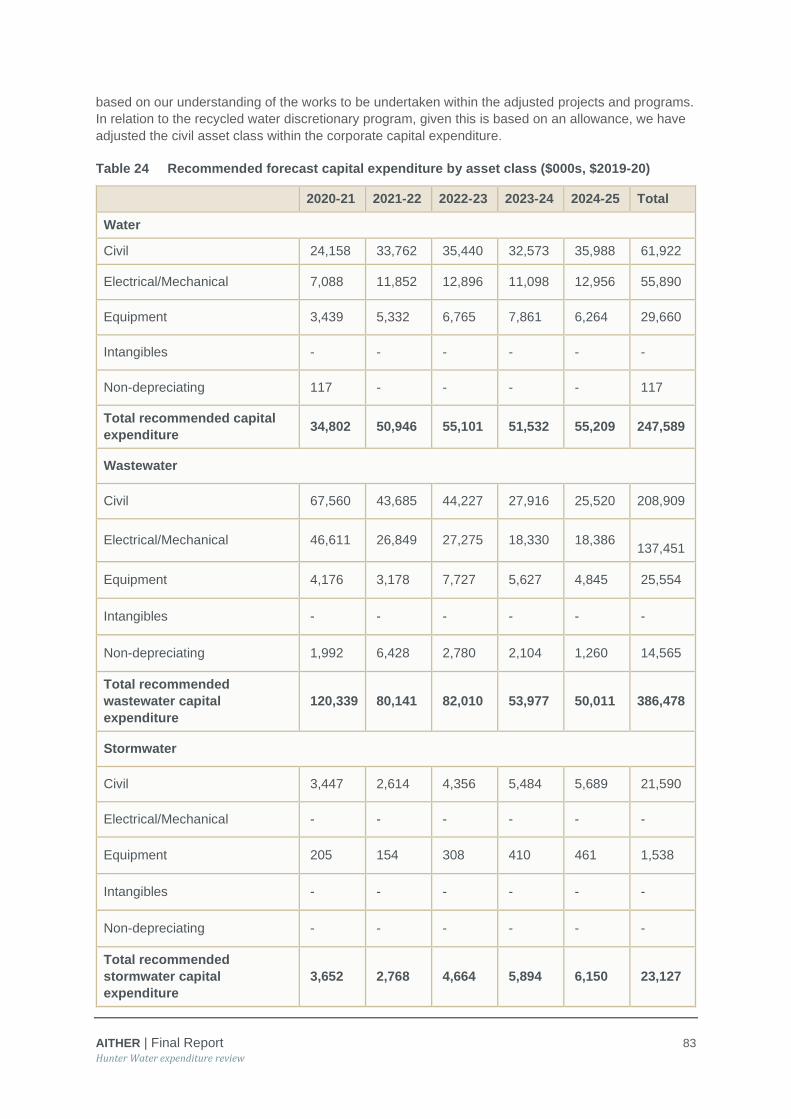
AITHER | Final Report 83
Hunter Water expenditure review
based on our understanding of the works to be undertaken within the adjusted projects and programs.
In relation to the recycled water discretionary program, given this is based on an allowance, we have
adjusted the civil asset class within the corporate capital expenditure.
Table 24 Recommended forecast capital expenditure by asset class ($000s, $2019-20)
2020-21 2021-22 2022-23 2023-24 2024-25 Total
Water
Civil 24,158 33,762 35,440 32,573 35,988 61,922
Electrical/Mechanical 7,088 11,852 12,896 11,098 12,956 55,890
Equipment 3,439 5,332 6,765 7,861 6,264 29,660
Intangibles - - - - - -
Non-depreciating 117 - - - - 117
Total recommended capital
expenditure 34,802 50,946 55,101 51,532 55,209 247,589
Wastewater
Civil 67,560 43,685 44,227 27,916 25,520 208,909
Electrical/Mechanical 46,611 26,849 27,275 18,330 18,386
137,451
Equipment 4,176 3,178 7,727 5,627 4,845 25,554
Intangibles - - - - - -
Non-depreciating 1,992 6,428 2,780 2,104 1,260 14,565
Total recommended
wastewater capital
expenditure
120,339 80,141 82,010 53,977 50,011 386,478
Stormwater
Civil 3,447 2,614 4,356 5,484 5,689 21,590
Electrical/Mechanical - - - - - -
Equipment 205 154 308 410 461 1,538
Intangibles - - - - - -
Non-depreciating - - - - - -
Total recommended
stormwater capital
expenditure
3,652 2,768 4,664 5,894 6,150 23,127

AITHER | Final Report 84
Hunter Water expenditure review
Corporate
Civil 5,737 7,716 4,574 4,574 2,883 25,484
Electrical/Mechanical 3,974 10,534 694 694 694 16,589
Equipment 7,469 7,016 6,501 7,746 4,541 33,273
Intangibles 20,421 16,827 10,344 11,533 10,313 69,438
Non-depreciating 118 123 126 123 123 613
Total recommended
corporate capital expenditure 37,719 42,215 22,239 24,670 18,554 145,396
Source: All data sourced from Hunter Water’s AIR (Capex by RAB) and consideration by Aither of recommended project
adjustments.
Note: ICT capital expenditure is included in the above forecasts. The assessment of ICT expenditure is contained in
section 6.

AITHER | Final Report 85
Hunter Water expenditure review
5. Operating expenditure
5.1. Overview
This section discusses Hunter Water’s past and forecast operating expenditure, and more specifically,
our opinion as to whether proposed expenditure should be considered to be efficient, given Hunter
Water’s objectives, obligations and operating environment.
5.2. Overview of Hunter Water’s forecasting approach
Hunter Water utilises a combination of a bottom-up and top-down approach to forecasting its annual
operating expenditure.19 In its submission, Hunter Water states that, among other things, its bottom-
up approach:20
• builds operating budgets by product, process (network or treatment), location and expense type
(cost category)
• begins with each individual business unit and budget owner identifying drivers of expenditure in
their area of responsibility including tactical, operational and strategic requirements
• involves consideration of unforeseen items in the current price period and the identification of
further efficiencies or setting stretch targets for the next price period
• ensures operating expenditure outcomes align with the delivery of the capital program.
Hunter Water states its internal governance process applies a top-down review of the bottom-up
forecasts via “an iterative review of budgets for prudency and efficiency throughout the budgeting
process”.21 This top-down review included assessment and challenge of the forecast by several
internal committees to test:
• drivers and assumptions underpinning expenditure
• significant variances in forecasts to the 2017-18 year
• investment against an assessment of benefits and organisational capacity
• impact of operating expenditure forecasts on customer affordability
• alignment with the forecast capital program and risk appetite statements
• expenditure prioritisation
• efficiencies.
Figure 19 provides an overview of the process that is adopted by Hunter Water, outlining where these
top-down tests are applied within the process.
19 A top-down approach is a high-level approach that uses overarching trends and forecasts to apply to expenditure totals to derive forecasts, whereas a bottom-up approach is a more granular approach that develops forecasts based on expected changes to each individual expenditure item.
20 Hunter Water Pricing Proposal, 1 July 2019, Technical paper 5, p. 50 21 Ibid, p. 51

AITHER | Final Report 86
Hunter Water expenditure review
Source: Figure 8.1 Hunter Water Pricing Proposal, 1 July 2019, Technical paper 5, p. 52
Figure 19 Hunter Water operating expenditure budgeting process
Hunter Water’s method of cost allocation consists of an activity-based costing approach to capture
direct operating expenditure by product and allocate shared costs based on the proportion of costs
assigned to each product.
In developing its forecast operating expenditure, Hunter Water notes that key assumptions include:22
• total water sales are forecast to remain relatively stable for 2020-21 to 2024-25 and are in-line
with long-term growth assumptions
22 Ibid, p. 53

AITHER | Final Report 87
Hunter Water expenditure review
• connections and billable property growth are forecast to continue at historical growth rates
• there are real price decreases forecast in future years and these market rates have been applied
to future energy consumption expectations
• energy efficiency program outcomes were included in the operating expenditure forecast
• while weather conditions can significantly impact Hunter Water’s operating costs, average
weather conditions are assumed (in line with a ‘P50’ budgeting approach)
• full-time equivalent employees will remain stable over the coming price period, at 480-490 FTEs
each year across 2020-25. This is an increase from the assumption of approximately 460-465
FTEs each year in the current price period (2016-20). As stated previously, the increase is driven
by the organisational restructure that occurred in 2017, which resulted in an increase to 485 FTE
employees.
• any wage increases above 2.5 per cent per year provided through the enterprise agreement
negotiations will be offset by productivity improvements, as required by the NSW Public Sector
Wages Policy.
5.3. Hunter Water as a low-cost operator
In its pricing submission, Hunter Water specifies that, based on the National Performance Report
(NPR) data, it has historically been a low-cost operator compared to the other major water utilities and
in the 2019 NPR it had the third-lowest operating expenditure per property of 15 major Australian
water utilities.23 However, Aither considers this high-level analysis can distort actual differences
between the utilities without consideration of key underlying characteristics.
Across the utilities covered by the NPR, Aither notes that some are vertically integrated whereas
others are required to purchase bulk water supply from bulk water suppliers (vertically disaggregated).
Those utilities operating in a vertically disaggregated structure will have some of the bulk water
supplier’s capital costs captured within their operating expenditure. That is, the entirety of the bulk
supplier’s charges to the disaggregated business will be captured as an operating expense, despite
the charge reflecting a combination of the supplier’s capital and operating costs.
To account for the differences between the types of structures outlined above, we have sought to
adjust the bulk water costs for those vertically disaggregated utilities to account for the capital
component of the revenue requirement for their respective bulk water supplier (see Figure 20). This
adjustment can be seen through the lighter coloured bar for those disaggregated utilities below.
Once this adjustment is made, the comparison should be made on the darker blue columns as this
more accurately represents the operating costs for providing services to those customers. Aither
notes that following these adjustments Hunter Water is still at the lower-end of the scale of service
providers, but more towards the middle.
It should be noted that these numbers have not been normalised for any factors such as geography,
distance, topography or age of assets and therefore could not be used for any meaningful
benchmarking comparisons.
23 Hunter Water Pricing Proposal, 1 July 2019, Technical paper 5, p. 4
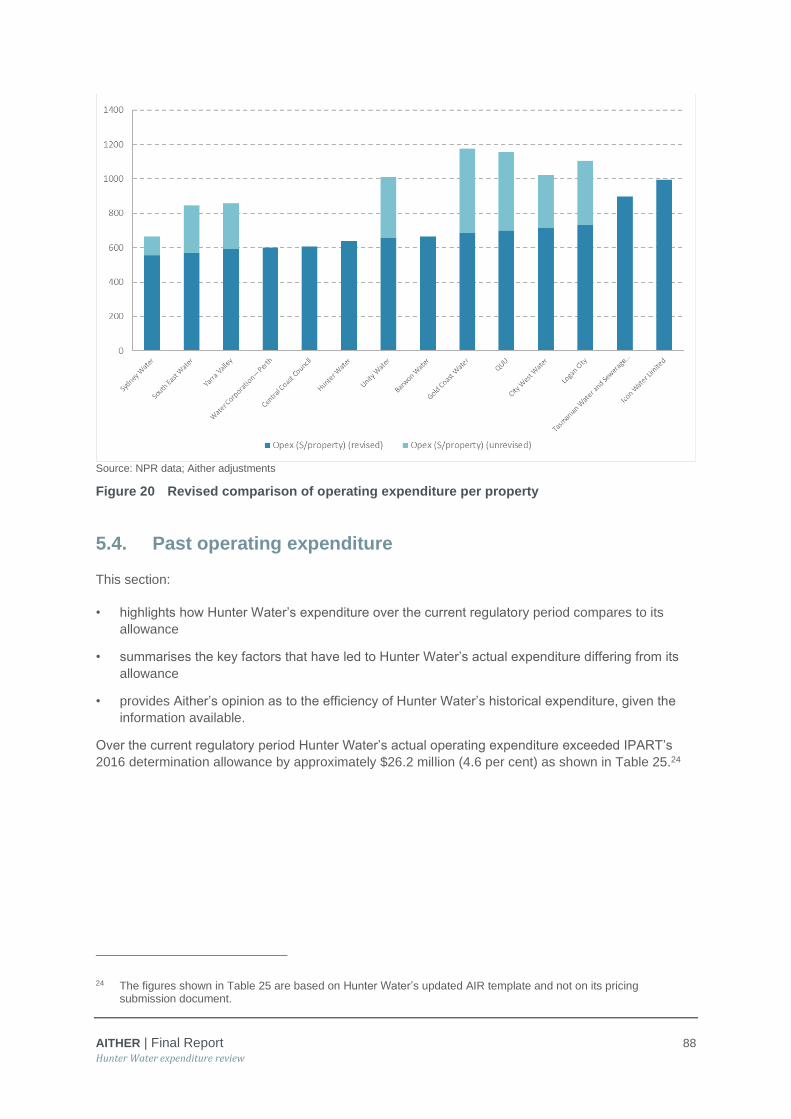
AITHER | Final Report 88
Hunter Water expenditure review
Source: NPR data; Aither adjustments
Figure 20 Revised comparison of operating expenditure per property
5.4. Past operating expenditure
This section:
• highlights how Hunter Water’s expenditure over the current regulatory period compares to its
allowance
• summarises the key factors that have led to Hunter Water’s actual expenditure differing from its
allowance
• provides Aither’s opinion as to the efficiency of Hunter Water’s historical expenditure, given the
information available.
Over the current regulatory period Hunter Water’s actual operating expenditure exceeded IPART’s
2016 determination allowance by approximately $26.2 million (4.6 per cent) as shown in Table 25.24
24 The figures shown in Table 25 are based on Hunter Water’s updated AIR template and not on its pricing submission document.

AITHER | Final Report 89
Hunter Water expenditure review
Table 25 Comparison of allowed and actual operating expenditure (‘000s, $2019-20)
2016-17 2017-18 2018-19 2019-20 TOTAL
2017-20
IPART operating
expenditure
allowance
140,345 142,635 144,377 144,851 572,209
Hunter Water
actual operating
expenditure
136,004 152,087 154,497 155,952 598,540
Difference (4,341) 9,452 10,120 11,101 26,331
Difference % (3.1%) 6.6% 7.0% 7.7% 4.6%
Source: All data sourced from Hunter Water’s AIR (Opex by item, SIR Opex 1) and escalated using SIR CPI tab. Hunter
Water’s actual operating expenditure is based on the Total Regulated Business information within the AIR (this includes
recycled water expenditure from “Section 16A” related schemes).
While actual spend in 2016-17 is lower than the allowed operating expenditure for that year, the later
years of overspend are of a significantly greater magnitude. In explaining the variation to IPART’s
approved operating expenditure, Hunter Water noted it was broadly driven by increase in:25
• mitigation activities in order to address risks that were identified across the business:
- including unbudgeted long-cycle preventative maintenance (LCPM) activities; a deliberate
shift from reactive to preventative maintenance in their asset management approach.
• corporate costs as a result of higher labour expenditure to support the revised business strategy
following the business restructure during 2017-18
• energy expenditure for wastewater due to:
- higher unit costs of energy following the tendering of a new electricity contract which started
in January 2018.
- changes to wastewater treatment processes resulting in more energy-intensive treatment.
• expenditure in relational to external service providers
• unforeseen and uncontrollable costs.
Figure 21 plots Hunter Water’s actual operating expenditure against IPART’s 2016 determination.
What’s apparent is the significant increase in 2017-18 followed by small annual increase for the
remainder of the period.
25 Hunter Water Pricing Proposal, 1 July 2019, Technical paper 5, p. 19

AITHER | Final Report 90
Hunter Water expenditure review
Figure 21 Hunter Water’s actual operating expenditure compared to IPART 2016
Determination (‘000s, $2019-20)
In identifying the service categories responsible for the overspend during the current period, Hunter
Water states:26
We expect operating expenditure on water and stormwater to be below IPART’s
allowance during each year of the price period. We forecast higher costs to deliver
wastewater services in each year of the price period. Corporate expenditure shows
the highest variance to IPART’s 2016 allowance – above the allowance in three of the
four years.
The average annual spilt of Hunter Water’s operating expenditure across its business functions during
the current period is shown by Figure 22. Labour expenditure was the most significant contributor to
Hunter Water’s operating expenses, with maintenance, operations and corporate expenditure
contributing to the bulk of the remaining expenditure.
26 Hunter Water Pricing Submission Technical Paper 5, p. 17.

AITHER | Final Report 91
Hunter Water expenditure review
Figure 22 Hunter Water’s average operational expenditure (2016-20)
5.5. Aither’s approach to assessing forecast operational
expenditure
To provide sufficient depth of analysis in support of any findings in relation to efficiency of operating
expenditure, Aither sought to first understand, and then critique, the methodology and underlying
assumptions adopted by Hunter Water to establish their forecasts. As a result, Aither focused on:
• understanding the factors driving Hunter Water’s future costs
• ascertaining the assumptions and methodologies Hunter Water adopted to translate those cost
drivers into an operational expenditure forecast.
Having regard to the above, our assessment of the efficiency of Hunter Water’s operating expenditure
involved, amongst other things:
• reviewing Hunter Water’s regulatory submission to identify key forecasting issues and
assumptions
• providing Hunter Water with a detailed questionnaire related to their operating expenditure
forecasts
• undertaking detailed interviews with Hunter Water staff to clarify issues in relation to underlying
assumptions for the operating expenditure.

AITHER | Final Report 92
Hunter Water expenditure review
5.6. Assessment of forecast operating expenditure
This section:
• provides a summary of Hunter Water’s forecast operating expenditure
• outlines the information that Aither has relied upon when making our assessment of the efficiency
of Hunter Water’s operational expenditure forecasts
• provides our opinion as to whether or not Hunter Water’s operational expenditure forecasts are
likely to be efficient, and our reasons for coming to that conclusion, and
• summarises the adjustments that Aither believe need to be made to Hunter Water’s proposed
operating expenditure forecasts to align them with levels that Aither believe are efficient.
Prior to commencing the review of the forecasts, Aither considered the general make-up and trends in
Hunter Water’s forecast operating expenditure. Figure 23 below shows the movement of operating
costs per customer over the current and upcoming regulatory periods. From this, it is evident that
there was a spike in operating costs per customer during 2017-18 and the continuation of a
comparatively higher forecast level of expenditure through the upcoming regulatory period. Our
assessment in the following subsections gives consideration to these proposed higher costs with
regard to an efficient level of operating expenditure for Hunter Water.
Figure 23 Hunter Water’s operating cost type per customer ($2019-20)
The makeup of Hunter Water’s forecast operating expenditure over the upcoming regulatory period is
shown by Figure 24. There has been minimal change in the split between Hunter Water’s cost
categories compared to the current regulatory period, with increases or decreases in any one
category limited to 1 per cent. Labour remains the largest contributor to costs, with maintenance,
operations and corporate costs contributing to the bulk of the remaining operating expenditure.
-
100.00
200.00
300.00
400.00
500.00
600.00
700.00
800.00
900.00
1,000.00
2017 actual 2018 actual 2019 actual 2020 estimated 2021 forecast 2022 forecast 2023 forecast 2024 forecast 2025 forecast
Water Opex per customer (actual, $2019-20) Wastewater Opex per customer (actual, $2019-20) Stormwater Opex per customer (actual, $2019-20)
Corporate Opex per customer (actual, $2019-20) Water Opex per customer (forecast, $2019-20) Wastewater Opex per customer (forecast, $2019-20)
Stormwater Opex per customer (forecast, $2019-20) Corporate Opex per customer (forecast, $2019-20)

AITHER | Final Report 93
Hunter Water expenditure review
Figure 24 Hunter Water’s average operational expenditure (2021-25)
To assess the efficiency of Hunter Water’s forecast operating expenditure, Aither has separated its
review into the following sub-sections:
• Labour expenditure
• Maintenance expenditure
• Operations expenditure
• Corporate expenditure (exc. ICT)
• Electricity expenditure
• Other on-going operational expenditure costs
• On-going productivity and efficiency improvements
5.6.1. Labour expenditure
Labour costs comprise a considerable proportion (approximately 33 per cent) of Hunter Water’s
forecast operating expenditure for the upcoming regulatory period.27 This can have a material impact
on the overall revenue requirement and customer prices and therefore it is important to ensure that
the expenditure allowance is efficient. Aither notes that Hunter Water has classified both internal and
external labour (i.e. contractors) within this cost category. Aither suggests that going forward, Hunter
Water separate out external labour in to the contractor cost item within the IPART information return
template.
27 Net of capitalised labour which are costs associated with development and delivery of capital projects.

AITHER | Final Report 94
Hunter Water expenditure review
In developing its labour expenditure forecasts, Hunter Water noted that:28
• labour expenditure throughout the upcoming regulatory period is similar to the 2019-20 base year
requirements29
• internal labour costs increase slightly across the upcoming regulatory period, as a result of a
transfer of expenditure from external contractor labour (which reduces over the same period)
• the labour budget is built up on an individual employee basis including assumptions in relation to
work dedicated to capital projects, and
• all internal labour includes on-costs for the total cost of employment including superannuation,
leave, payroll tax and other expenses.
In considering the forecast labour expenditure, there are some key issues that we have considered:
• how the annual forecast labour expenditure compares to IPART’s 2016 determination allowance
and how forecast compare to Hunter Water actual labour expenditure from the current period
• the escalation rate for forecast labour expenditure
• the organisation restructure that occurred in the current period and its influence on changes in
FTEs, and
• the vacancy rates that are applied to forecast labour costs.
Hunter Water’s historical and forecast labour expenditure
A comparison of Hunter Water’s actual labour expenditure with IPARTs 2016 Determination
allowance for the current period as well as Hunter Water’s proposed labour expenditure for the next
period is shown in Table 26. Hunter Water states that the $9.5 million of additional labour expenditure
above IPART’s determination reflects higher expenditure on contract labour, due to:30
• additional labour resources to support risk-driven operational activities and longer-term planning
work
• a high vacancy rate in internal labour positions - external contract labour was used to fill these
vacant internal positions, and
• additional resources required for project development within the expanded capital program,
including both physical infrastructure and ICT projects.
28 Hunter Water Pricing Proposal, 1 July 2019, Technical paper 5, p. 41 29 We note that the 2019-20 base year labour requirements specified by Hunter Water is $52m compared to IPART’s
2016 determination allowance for 2019-20 of $48.6m (in real $2019-20) as shown on page 19 of Hunter Water’s Technical Paper 5.
30 Hunter Water Pricing Proposal, 1 July 2019, Technical paper 5, p. 20

AITHER | Final Report 95
Hunter Water expenditure review
Table 26 Hunter Water actual and forecast labour expenditure $m ($2019-20)
2016-
17
2017-
18
2018-
19
2019-
20
2020-
21
2021-
22
2022-
23
2023-
24
2024-
25
Determination
allowance 50.8 48.7 48.9 48.6
Actual/
forecast 48.6 51.6 54.3 52.0 52.1 51.1 51.2 51.1 52.1
Difference -2.2 2.9 5.4 3.4
Source: Hunter Water Pricing Proposal, 1 July 2019, Technical Paper 5, p. 19 (this information was unavailable from the AIR
therefore we have used the information from the Technical Paper for this comparison).
Note: The labour expenditure is net of capitalised labour. Aither has presented the information from the Technical Paper
rather than the AIR as it did not have access to explicit Determination decisions on labour expenditure.
Through the review, Aither raised concerns regarding the historical increases in labour expenditure
and how this historical increase has now been accepted as the new ‘base’ level of labour expenditure.
In response to these queries, Hunter Water provided explanations for the increases in labour
expenditure across 2017-18 and 2018-19:
• In 2016-17 a recruitment freeze for 6-months while the organisational restructure was underway –
this led to an increase in vacant roles compared to what would normally be the case
• Once the organisational restructure had been finalised and announced, there was still a process
of recruitment that took time to undertake – focusing on prioritising key positions
• Through 2018-19, as positions from the restructure were filled, the total FTEs were closer to the
budgeted amount and therefore a lower vacancy rate
Figure 25 demonstrates the breakdown in the change in labour costs across water, wastewater,
stormwater and corporate. It can be seen from this that the majority of the increase in labour
expenditure within the current regulatory period was driven by corporate labour expenditure.

AITHER | Final Report 96
Hunter Water expenditure review
Figure 25 Comparison of actual and forecast labour expenditure by products net of
capitalised labour (‘000s, $2019-20)
Changes in FTEs over the regulatory period
Hunter Water states it underwent an organisational restructure in October 2017 resulting in an
increase from its average annual budgeted FTE of approximately 465 FTE to 485.5 FTE. 31 Hunter
Water specifies the key principles of the restructure were:32
• shifting resources to customer-facing services to increase the focus on meeting customer needs
• consolidating developer functions to improve engagement and enable good development
• grouping short-term planning functions to deliver support necessary to customer-facing teams
• grouping planning functions to consider longer-term infrastructure options and service levels, and
• reorganising non-customer facing functions to better support customer-facing teams.
In response to a request for information, Hunter Water provided Aither with a breakdown of the 2017-
18 FTE restructure by division, outlining the shifts from the original budget to the restructured budget.
As shown in Table 27, the restructure resulted in just over 10 additional FTE’s in total and an increase
in the labour budget of $1.7 million. Hunter Water indicated that it incorporated a higher vacancy
amount in 2017-18 to account for the delays in recruiting new positions (and existing positions
through the freeze on recruitment) and thereby off-set the budgeted cost increase in that year.
31 Hunter Water Pricing Proposal, 1 July 2019, Technical paper 5, p. 33 32 Ibid, p. 8
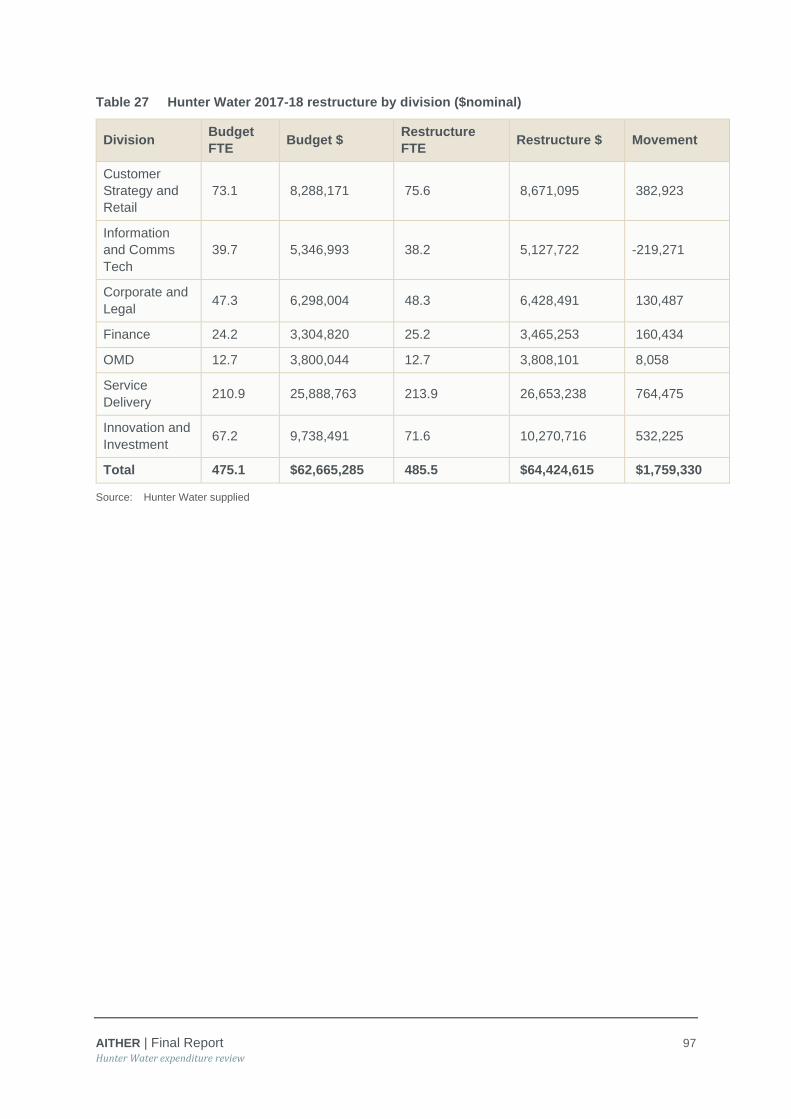
AITHER | Final Report 97
Hunter Water expenditure review
Table 27 Hunter Water 2017-18 restructure by division ($nominal)
Division Budget
FTE Budget $
Restructure
FTE Restructure $ Movement
Customer
Strategy and
Retail
73.1 8,288,171 75.6 8,671,095 382,923
Information
and Comms
Tech
39.7 5,346,993 38.2 5,127,722 -219,271
Corporate and
Legal 47.3 6,298,004 48.3 6,428,491 130,487
Finance 24.2 3,304,820 25.2 3,465,253 160,434
OMD 12.7 3,800,044 12.7 3,808,101 8,058
Service
Delivery 210.9 25,888,763 213.9 26,653,238 764,475
Innovation and
Investment 67.2 9,738,491 71.6 10,270,716 532,225
Total 475.1 $62,665,285 485.5 $64,424,615 $1,759,330
Source: Hunter Water supplied

AITHER | Final Report 98
Hunter Water expenditure review
Table 28 outlines Hunter Water’s budgeted internal and external labour FTE’s during the current period and forecast regulatory period.
Table 28 Hunter Water’s budgeted historical and forecast FTE numbers
2016-17
(actual)
2017-18
(actual)
2018-19
(actual)
2019-20
(estimate)
2020-21
(forecast)
2021-22
(forecast)
2022-23
(forecast)
2023-24
(forecast)
2024-25
(forecast)
Internal budget 465.3 485.5 475.2 484.6 482.5 490.9 488.4 485.4 484.7
Unbudgeted positions 1.4 1.3 8.3 NA NA NA NA NA NA
Vacant positions (45.7) (57.5) (50.3) (36.7) (36.5) (36.7) (36.5) (36.3) (36.2)
Vacancy rate (actual and
forecast) 9.54% 11.57% 8.84% 7.57% 7.56% 7.47% 7.47% 7.48% 7.46%
Total costed internal FTE after
vacancy 419.6 429.4 433.1 447.9 446.0 454.2 451.9 449.0 448.5
External contract labour 29.5 43.2 58.0 38.9 41.9 27.1 28.1 29.2 28.5
Total labour FTE 449.1 472.5 491.2 486.8 487.9 481.3 480.0 478.2 477.0
Source: Aither – based on documentation supplied by Hunter Water

AITHER | Final Report 99
Hunter Water expenditure review
Shift to insourcing
There has been a decision by Hunter Water to insource activities associated with its contact centre
that were previously outsourced. Hunter Water has indicated that the shift of 9.6 FTE from external to
internal will occur in 2021-22, with a forecast saving of $0.2m per year. 33 This has led to an increase
in internal labour expenditure and a reduction in contractor expenditure for the period.
Vacancy rate
A vacancy rate is used to account for positions that are unfilled throughout the year and the number of
staff that may be on leave during the year. Hunter Water has factored in an estimated vacancy rate of
approximately 7.5 per cent for each year of the upcoming regulatory period.
It was difficult to assess the actual vacancy rate for Hunter Water based on initial information
provided. Following an initial assessment based on internal FTEs, further information was provided
that separated the contractor (external) FTEs into backfill and operational staff that provided a more
comprehensive understanding of the actual vacancy rate for the business (see Table 29).
Table 29 Estimated actual vacancy rates
2016-17 2017-18 2018-19
Vacancy rate target (budget) 5.0% 8.0% 8.0%
Actual vacancy rate (pre-
labour hire) 9.5% 11.57% 8.84%
Vacancy rate (including
back-fill contractors) 5.67% 6.98% 3.94%
Source: Hunter Water information
Aither notes that there can be a perverse impact of over-estimating the vacancy rate through higher
contractor expenditure, this would depend on the vacant roles and how critical they are for ongoing
operations. In considering the forecasts, Aither notes that there is a decline in contractor expenditure
for the upcoming regulatory period while maintaining a target of 7.5 per cent vacancy rate for internal
FTEs.
Labour escalation rate and enterprise agreements
Hunter Water’s forecast labour escalation rate is based on its 2018 enterprise agreements which
contain provision for increases to salaries and wages underpinned by the agreements at 2.5 per cent
per year.34
These agreements are due to expire at the end of the 2020-21 financial year however Hunter Water
has maintained the 2.5 per cent (nominal) annual labour escalation rate for the remainder of the
forecast period. Hunter Water also notes that an outcome of the recent enterprise agreements
includes improved rostering of employees resulting in a saving of around $80k per year of overtime.35
33 Hunter Water Pricing Proposal, 1 July 2019, Technical paper 5, p. 49 34 Hunter Water Pricing Proposal, 1 July 2019, Technical paper 5, p. 21 35 Hunter Water Pricing Proposal, 1 July 2019, Technical paper 5, p. 21

AITHER | Final Report 100
Hunter Water expenditure review
Capitalisation of labour
Hunter Water has proposed a material increase to its capital program for the next regulatory period in
comparison to what it has undertaken during the current period. There is a proposed average capital
spend of $174 million per annum for the upcoming regulatory period compared to an average capital
spend of $123 million per annum in the current regulatory period. As shown in Table 30 the increased
capital spend has resulted in an increase to the value of capitalised labour for the forecast period.
Hunter Water specifies36:
Capitalisation of internal labour occurs where Hunter Water employees work on
activities associated with developing and delivering capital projects. The costs
associated with work on capital projects is transferred to capital work-in-progress and
then capitalised as an asset when the project is complete.
Table 30 Capitalisation of labour over the current and forecast periods (‘000s, $2019-20)
2016-
17
2017-
18
2018-
19
2019-
20
2020-
21
2021-
22
2022-
23
2023-
24
2024-
25
Resources to
capital 11,371 13,046 14,219 14,524 14,930 14,883 14,916 14,966 14,217
Source: Hunter Water AIR
Aither’s assessment
Aither has separated our assessment of the forecast labour expenditure into the following key topics:
• base level of labour expenditure
• vacancy rate
• labour escalation rate, and
• capitalisation of labour.
The following outlines our findings in relation to each of these topics.
Base level of labour expenditure
As outlined above, Hunter Water had a material increase in labour costs across 2017-18 and 2018-
19. The reasons provided by Hunter Water as to the efficiency and reasonableness of the increases
related to:
• similar alignment with FTE levels from 2011 and 2012
• an internal realignment resulted in reductions in FTEs that were deemed unsustainable and
therefore an organisational restructure was implemented
• a temporary recruitment freeze was implemented during 2017-18.
In relation to the alignment with historical FTE levels, Aither considers that there was no information to
justify the efficiency or reasonableness of the FTE levels in 2011 and 2012. Further to this, with
changes in organisational structures over time and differences in insourcing and outsourcing
36 Hunter Water Pricing Proposal, 1 July 2019, Technical paper 5, p. 13

AITHER | Final Report 101
Hunter Water expenditure review
arrangements, a simple analysis of the total number of FTEs between periods does not provide a
robust indication as to the efficiency of the FTE levels.
The organisational restructure did result in an increase in labour expenditure (although this was off-
set by efficiencies and vacancy assumptions in the first year), however this did not account for the
majority of the increase.
While there was a 6-month freeze in new hires during the restructure, this would temporarily supress
the cost of internal labour and potentially increase the cost of external (contractor) labour (if back-
filling was required). Once the freeze was lifted, it would be expected that the level of expenditure
would return to:
• the pre-existing levels (for internal labour)
• plus the additional labour costs associated with the organisational restructure ($1.7 million)
• less the external (contractor) labour required to cover the vacancies that arose during the freeze
period.
If labour expenditure (internal and external) was reduced during the freeze period, it would not have
accounted for the increases that occurred.
Given this analysis, Aither has concerns regarding the justification of the previous increases in labour
expenditure that now form the basis for the forecast of labour expenditure in the upcoming regulatory
period. Aither therefore proposes a downward adjustment to Hunter Water’s forecast labour
expenditure of $1 million per annum to reflect a lower level of base expenditure. This adjustment is a
subjective assessment of the lack of robust justification provided for the increased labour expenditure
rather than a build-up of definitive changes that occurred over that time.
Corporate labour expenditure was the key driver behind this previous increase in labour expenditure
for the business. Given this, Aither proposes that the adjustment be made to the corporate product,
which will then be allocated across the other products within the framework.
Table 31 Impact of adjustment to the base level of labour expenditure (‘000s, $2019-20)
2020-21 2021-22 2022-23 2023-24 2024-25 Total
Forecast net corporate
labour expenditure 26,883 26,124 26,183 26,164 26,425 131,780
Aither adjusted net
corporate labour
expenditure
25,883 25,124 25,183 25,164 25,425 126,780
Difference 1,000 1,000 1,000 1,000 1,000 5,000
Source: Aither analysis based on Hunter Water’s AIR (Opex by item) and Aither adjustment.
Vacancy rate
Aither considers that a 7.5 per cent vacancy rate target, combined with a reduction in contractor
expenditure is appropriate for the upcoming regulatory period.
Labour escalation rate
The assumed continuation of the existing escalation rate for the forecast period appears reasonable
given the requirements of the NSW Public Services Wages Policy which Hunter Water must abide by.
The information provided by Hunter Water to determine how this labour escalation rate has been

AITHER | Final Report 102
Hunter Water expenditure review
incorporated into the forecast is consistent with the 2.5 per cent (nominal) specified in its pricing
submission.
Capitalisation of labour
Aither considers that Hunter Water’s approach to capitalisation of labour is appropriate and the
forecast levels of capitalisation appear reasonable.
Aither adjustments to labour expenditure
Aither considers that the majority of Hunter Water’s labour expenditure is efficient, with two
adjustments to the forecast expenditure recommended. The following table outlines Aither’s
recommended adjustments and their impact on Hunter Water’s forecast expenditure.
Table 32 Hunter Water proposed, and Aither recommended changes to forecast labour
expenditure ($000’s, $2019-20)
2020-21 2021-22 2022-23 2023-24 2024-25
Hunter Water
forecast (net of
capitalised labour)
52,283 51,294 51,334 51,264 52,265
Adjustments
Reduction in
corporate
labour
expenditure
(1,000) (1,000) (1,000) (1,000) (1,000)
Recommended 51,283 50,294 50,334 50,264 51,265
Difference (1,000) (1,000) (1,000) (1,000) (1,000)
Percentage
change (1.9%) (1.9%) (1.9%) (2.0%) (1.9%)
Source: Forecast information from the AIR; adjustment from Aither
Note: Excludes capitalised labour
5.6.2. Maintenance expenditure
Hunter Water’s proposed maintenance expenditure represents approximately 13 per cent of Hunter
Water’s forecast operating expenditure for the upcoming regulatory period. In developing its
maintenance expenditure forecasts, Hunter Water noted that:37
• the maintenance cost category includes expenditure on preventative and reactive maintenance
for electrical and mechanical assets, civil assets and corporate assets
• external service providers to support the performance of its maintenance activities and to
supplement internal resources for some activities, are engaged using competitive procurement
processes and include engagements for:
- plant hire
37 Hunter Water Pricing Proposal, 1 July 2019, Technical paper 5, p. 13

AITHER | Final Report 103
Hunter Water expenditure review
- civil and electrical/mechanical maintenance
- road and path restorations
- traffic control, and
- spoil management.
• a large proportion of expenditure relates to ongoing maintenance work on water mains and sewer
mains
Hunter Water specified a bottom-up approach is utilised for maintenance expenditure forecast,
consistent with its broader expenditure forecasting methodology.
Hunter Water’s actual and forecast maintenance expenditure
During the current regulatory period, there has been a slight increase in maintenance expenditure
from Hunter Water. It states that this increase was driven by a focus on timely rectification of water
main breaks and leaks, resulting in higher expenditure than planned. Hunter Water’s submission
specifies:38
The benefits of reducing leaks and losses needs to be understood in the broader
context of changes to population growth, per capita consumption, industry demand
and deferral of the next major supply augmentation. Without these water conservation
initiatives, a decision on a future supply-side solution would potentially be needed
within five years.
Hunter Water also faced greater spoil management costs than anticipated in the current period as a
result of changes to waste regulations. This has led Hunter Water to engage a dedicated spoil
management officer in an attempt to minimise spoil waste disposal which Hunter Water claims will
deliver efficiencies going forward.39
Hunter Water’s forecast maintenance expenditure for the upcoming determination period has reduced
on average per year compared to its actual maintenance expenditure during the current regulatory
period. However, the annual forecast maintenance expenditure for the next period is higher on
average than IPART’s approved maintenance expenditure for the current regulatory period.
38 Ibid, p. 33 39 Ibid, p. 49

AITHER | Final Report 104
Hunter Water expenditure review
Figure 26 Comparison of actual and forecast maintenance expenditure (‘000s, $2019-20)
We note that Hunter Water has undertaken a number of efficiency measures to limit the increase to
forecast maintenance expenditure in the next period, including:
• a dedicated Spoil Officer will continue to maximise reuse and minimise spoil going to waste,
reducing overall expenditure in the next price determination period by $1.8 million.40
• continued investment in a workforce management project that will facilitate a step change in
productivity by improving the effectiveness of maintenance works planning, scheduling, dispatch,
mobility, delivery, and reporting systems.41
In developing the forecast of maintenance activities for the upcoming regulatory period, Hunter Water
has relied on the last three years of actual information to estimate forecast maintenance activity. It
was noted that Hunter Water has not factored in growth in the network over the upcoming regulatory
period and that it would absorb any impact from this growth. Hunter Water noted that for mechanical
and electrical assets, there was a higher level of planned maintenance than reactive, however this
was reversed when applied to civil assets.
There has been a step change incorporated in the forecasts based on the CTGM replacement. Hunter
Water stated that the CTGM had been a driver for a number of reactive maintenance activities and
therefore following the replacement, there would be a reduction in reactive maintenance activities.
Aither’s assessment
In reviewing the method underpinning Hunter Water’s forecast maintenance expenditure, we consider
the forecast expenditure to be efficient. The models used to develop the annual forecast maintenance
expenditure are robust and based on consistent forecasts.
Aither notes that the maintenance expenditure has increased in the current regulatory period while it
is forecasted to decline over the upcoming regulatory period in real terms. This is consistent with the
discussions with Hunter Water in relation to future expectations of the maintenance requirements.
40 Ibid, p. 49 41 Ibid, p. 29

AITHER | Final Report 105
Hunter Water expenditure review
Table 33 Hunter Water proposed, and Aither recommended changes to forecast
maintenance expenditure ($000’s, $2019-20)
2020-21 2021-22 2022-23 2023-24 2024-25
Hunter Water
forecast 21,544 21,123 20,538 20,791 20,442
Recommended 21,544 21,123 20,538 20,791 20,442
Difference - - - - -
Percentage change - - - - -
5.6.3. Operations expenditure
Hunter Water’s proposed operations expenditure represents approximately 19 per cent of Hunter
Water’s forecast operating expenditure for the upcoming regulatory period. The operations costs
include the expenditure required to operate infrastructure, including:42
• Water and wastewater treatment plants
• Water and wastewater pumping stations
• Energy costs
• Chemical costs, and
• Laboratory costs to monitor water and wastewater quality.
Hunter Water’s treatment operations and laboratory functions are contracted out to external service
providers via a competitive tender.
As outlined in Figure 27, the operations expenditure increased materially through the current
regulatory period. The most significant increase was in 2017-18 where there was a predominantly
one-off increase in operations expenditure. A significant component of this increase ($2.9 million)
2018 was driven by long-cycle preventative maintenance (LCPM) activities that were required at:
• Dewatering of Edgeworth sludge lagoon ($1.2m)
• Clean out of Cessnock digester ($0.7m)
• Maturation pond clean out at Cessnock ($0.6m)
• Dewatering and cleaning of multiple smaller sludge lagoons ($0.2m)
Hunter Water has forecast a relatively flat level of operations expenditure over the upcoming
regulatory period, with some increases in 2021-22 and 2022-23 which is partly driven by the potential
transition costs associated with the end of the treatment contract with Veolia.
42 Hunter Water Pricing Proposal, 1 July 2019, Technical paper 5, p. 13

AITHER | Final Report 106
Hunter Water expenditure review
Figure 27 Comparison of actual and forecast operations expenditure (‘000s, $2019-20)
Hunter Water’s actual operations expenditure over the current regulatory period was higher than
IPART’s 2016 Determination allowance, as well as Hunter Water’s proposed operations expenditure
for the upcoming regulatory period. In addressing the increase during the current period, Hunter
Water noted that higher costs were a result of:43
• Improved management of compliance risks relating to operational performance of treatment
plants
• Implementation of a maintenance optimisation program focused on increased long-cycle
preventative maintenance (LCPM) activities 44
• Periods of unacceptable trace contaminant levels, such as cadmium or ammonia
• Capital investments in treatment plants to meet compliance requirements resulted in higher
operating costs. Examples include:
More energy-intensive treatment as a result of new technology
Upgrades to improve effluent quality discharged to meet Environment Protection
Licence conditions.
Hunter Water notes that it expects treatment plant operating costs to remain steady relative to current
levels throughout the next regulatory due to the:
• renewed focus on LCPM, and
• the program of major capital works at several treatment plants.
43 Ibid, p.22 44 Hunter Water states that LCPM aims to improve asset reliability, optimise the asset life of treatment plant
infrastructure and reduce lifecycle asset costs. This is a change from their previous reactive approach to asset maintenance. Hunter Water states that they expect this higher up-front expenditure to defer future capital investment and ensure that they meet compliance requirements.

AITHER | Final Report 107
Hunter Water expenditure review
Treatment operations contract – Veolia
The key aspect of Hunter Water’s operations expenditure is the treatment contract it has with Veolia
Water Australia that commenced in 2014 for a period of 8 years. Through this contract, Veolia
operates Hunter Water’s 25 water and wastewater treatment plants.
Hunter Water maintains a detailed forecasting model that estimates the forecast operating cost per
site over the upcoming regulatory period. It is noted that the forecasts within the model are based on
average dry-weather flows – this is likely to understate the actual costs to be incurred through the
contract as the rates paid under the contract are based on actual flow (including wet weather).
A key thing to note in the forecasts is the impact that variations and LCPM have on the contract cost.
Variations represent a significant component of the increased ‘base’ level of costs for the upcoming
regulatory period. These variations are primarily driven by new assets that need to be operated by
Veolia that were not previously captured within the contract. Assumptions have been made within the
treatment models that lead to an increase in operating costs based on this new capital expenditure.
The estimated cost of these variations is based on historical evidence of the operating and
maintenance costs of similar assets within Hunter Water.
Increasing LCPM leads to higher costs in the short-term by taking a planned approach and avoiding
the cost impacts of unforeseen expensive reactive responses. The LCPM program was developed
jointly by Hunter Water and Veolia in 2017. Some of the early works included the cleanout of the
Cessnock digester; the cleanout of emergency sludge lagoons at Edgeworth, Toronto and Raymond
Terrace; and the Cessnock maturation pond.
Figure 28 highlights this impact by separating out these two components from the remainder of the
contract costs for operations. It can be seen that the bottom (blue) bar is getting smaller over the
upcoming regulatory period, while the top (green) bar is getting larger.
Source: Hunter Water, Aither analysis
Note These figures are based on the operations costs associated with the Operations Contract, not the operations
expenditure as a whole.
Figure 28 Impact of variations and long-cycle preventative maintenance on operations
expenditure (‘000s, $2019-20)

AITHER | Final Report 108
Hunter Water expenditure review
The contract with Veolia has a Service Standard Adjustment mechanism whereby the rates within the
contract are adjusted if Veolia are unable to meet minimum service standards. This mechanism has
been enacted in the past, however it has not been material.
Transition costs
The existing contract with Veolia comes to an end during the period, this requires the establishment of
a new contract (either with Veolia or with a new service provider). Hunter Water has stated that this
will result in transition costs associated with the procurement process for assessing bids from service
providers and any additional costs associated with transitioning to a new service provider.45 Hunter
Water’s proposed transition costs are shown in Table 34.46
Table 34 Hunter Water specified transition costs of treatment contract (‘000s, $2019-20)
Item 2020-21 2021-22 2022-23
Project Manager
Consultant tender prep & tender
involvement
Legal Drafting & Advice
Probity Auditor
Payment to Tenderers
Tender Team
New contractor transition in
Veolia Transition Out Fees
Spares Purchase from Veolia
Transitioned employee entitlements
Total
Source: Hunter Water provided this information in response to a request by Aither
Laboratory services
Another key component of the operations expenditure is the costs associated with laboratory
services. Hunter Water provided a detailed breakdown of the forecast expenditure for laboratory
services for the upcoming regulatory period. There are some increases in additional works that are
expected to be required, however the key increases over the upcoming regulatory period relate to:
• Transition costs for the new laboratory services contract
• Expected increase in the costs of laboratory services.
These two issues are discussed further below.
Transition costs
As with the operations contract, the laboratory contract is due to expire within the upcoming regulatory
period. Given this, Hunter Water has proposed transition costs (similar to the operations contract) for
45 Hunter Water Pricing Proposal, 1 July 2019, Technical paper 5, p. 45 46 Hunter Water provided a detailed breakdown of the transition costs to Aither in response to our requests.

AITHER | Final Report 109
Hunter Water expenditure review
the procurement process required to establish a new laboratory contract. A breakdown of these
transition costs is provided in Table 35 below.
Table 35 Hunter Water specified laboratory services contract procurement costs ($’000,
$2019-20)
2021-22
Market Testing
Contract Preparation and Legal Review
Concurrent Sampling
Total
Source: Hunter Water
Cost escalation
Given the expiration of the existing laboratory contract, Hunter Water was required to forecast any
changes in the existing contract rates for the next contract period. Table 36 outlines Hunter Water’s
proposed increases in the cost of scheduled and unscheduled monitoring (note that this is focused on
the incremental increase and does not capture the existing cost of these activities). Hunter Water
stated that the reason for these lower contract rates was that the initial contract was entered into with
Hunter Water Australia (which was subsequently purchased by ALS) with favourable rates. These unit
rates remained in place following the transition of the contract to ALS.
Table 36 Hunter Water proposed increase in cost of monitoring activities ($’000, $2019-20)
2020-21 2021-22 2022-23 2023-24 2024-25 Total
Expected increase in
cost of scheduled
monitoring
-
Expected increase in
cost of unscheduled
monitoring
-
Total -
Source: Hunter Water
Hunter Water’s pricing submission states that ‘market-testing suggests that estimated rates will
increase from the current contract rates’.47 Hunter Water provided information that compared its
current contract rates for scheduled monitoring activities with pricing information from two different
laboratories (both of which are expected to tender for the new contract). This analysis demonstrated
that the current contract rates are lower than the market rates and therefore it would be reasonable to
expect an increase in the rates under a new contract in the future.
In relation to unscheduled monitoring, Hunter Water noted that it currently has a 20 per cent mark-up
on these activities. Through discussions with prospective tenderers, Hunter Water was informed that
this mark-up is more likely to be around 36 per cent for the new contract.
47 Hunter Water Pricing Submission: Technical Paper 5, p. 44.

AITHER | Final Report 110
Hunter Water expenditure review
Response to IPART Issues Paper
As part of its response to IPART’s Issues Paper, Hunter Water advised that its demand forecasts
would be updated based on the major demand review within the Lower Hunter Water Plan. These
updated demand estimates result in a higher level of demand for both water and wastewater services.
Hunter Water indicated that its forecast operating expenditure was based on its previous demand
forecast and therefore needed to be revised to account for the higher forecast levels of demand. To
update the forecast levels of expenditure, Hunter Water has used its estimate of the short-run
marginal cost (SRMC) for both water and wastewater to develop an approximate proxy for the
additional cost.
Table 37 Estimated additional costs from change in demand ($’000, $2019-20)
2020-21 2021-22 2022-23 2023-24 2024-25 Total
Water operating costs
Additional water
demand (kL) 1,345,000 1,380,000 1,395,000 1,410,000 1,422,000 6,952,000
SRMC (c/kL) 11.3 11.3 11.3 11.3 11.3 11.3
Additional operating
costs 152 156 158 159 161 786
Wastewater operating costs
Additional discharge
volume (kL) 1,054,000 1,087,000 1,134,000 1,181,000 1,227,000 5,683,000
SRMC (c/kL) 19.8 19.8 19.8 19.8 19.8 19.8
Additional operating
costs 209 215 225 234 243 1,125
Aither’s assessment
In undertaking our assessment of the forecast operations expenditure, we have aligned our
recommendations with the issues discussed above.
Treatment contract
The information provided by Hunter Water was comprehensive and well detailed regarding the
activities to be undertaken by Veolia through the contract. There is downward pressure in real terms
on the rates that are in the contract and that is reflected in the forecast operating expenditure for the
upcoming regulatory period. Overall, we consider that the treatment contract and the forecast costs
associated with the contract to be efficient.
Transitional costs
Aither had concerns regarding some of the transitional costs associated with additional resourcing
requirements. Aither was initially of the view that these costs should be covered by internal
procurement staff and therefore additional costs were not required. Hunter Water provided further
information outlining how similar contract tendering processes had been resourced previously which
demonstrates that these costs would be additional to the internal procurement team. Given this, Aither
has decided to accept these additional resourcing costs associated with the project.
Hunter Water is proposing to recover all potential transition costs from customers regardless of the
decision on the future service provider, however it will not necessarily incur all of these transition
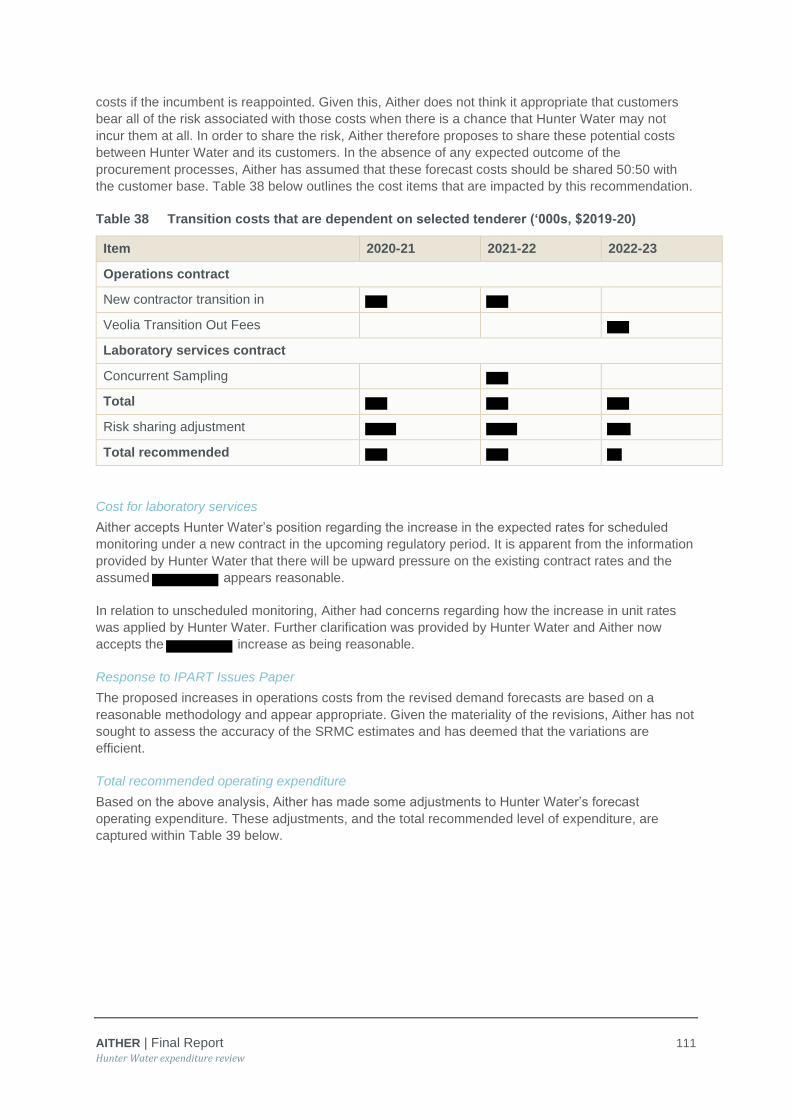
AITHER | Final Report 111
Hunter Water expenditure review
costs if the incumbent is reappointed. Given this, Aither does not think it appropriate that customers
bear all of the risk associated with those costs when there is a chance that Hunter Water may not
incur them at all. In order to share the risk, Aither therefore proposes to share these potential costs
between Hunter Water and its customers. In the absence of any expected outcome of the
procurement processes, Aither has assumed that these forecast costs should be shared 50:50 with
the customer base. Table 38 below outlines the cost items that are impacted by this recommendation.
Table 38 Transition costs that are dependent on selected tenderer (‘000s, $2019-20)
Item 2020-21 2021-22 2022-23
Operations contract
New contractor transition in
Veolia Transition Out Fees
Laboratory services contract
Concurrent Sampling
Total
Risk sharing adjustment
Total recommended
Cost for laboratory services
Aither accepts Hunter Water’s position regarding the increase in the expected rates for scheduled
monitoring under a new contract in the upcoming regulatory period. It is apparent from the information
provided by Hunter Water that there will be upward pressure on the existing contract rates and the
assumed appears reasonable.
In relation to unscheduled monitoring, Aither had concerns regarding how the increase in unit rates
was applied by Hunter Water. Further clarification was provided by Hunter Water and Aither now
accepts the increase as being reasonable.
Response to IPART Issues Paper
The proposed increases in operations costs from the revised demand forecasts are based on a
reasonable methodology and appear appropriate. Given the materiality of the revisions, Aither has not
sought to assess the accuracy of the SRMC estimates and has deemed that the variations are
efficient.
Total recommended operating expenditure
Based on the above analysis, Aither has made some adjustments to Hunter Water’s forecast
operating expenditure. These adjustments, and the total recommended level of expenditure, are
captured within Table 39 below.
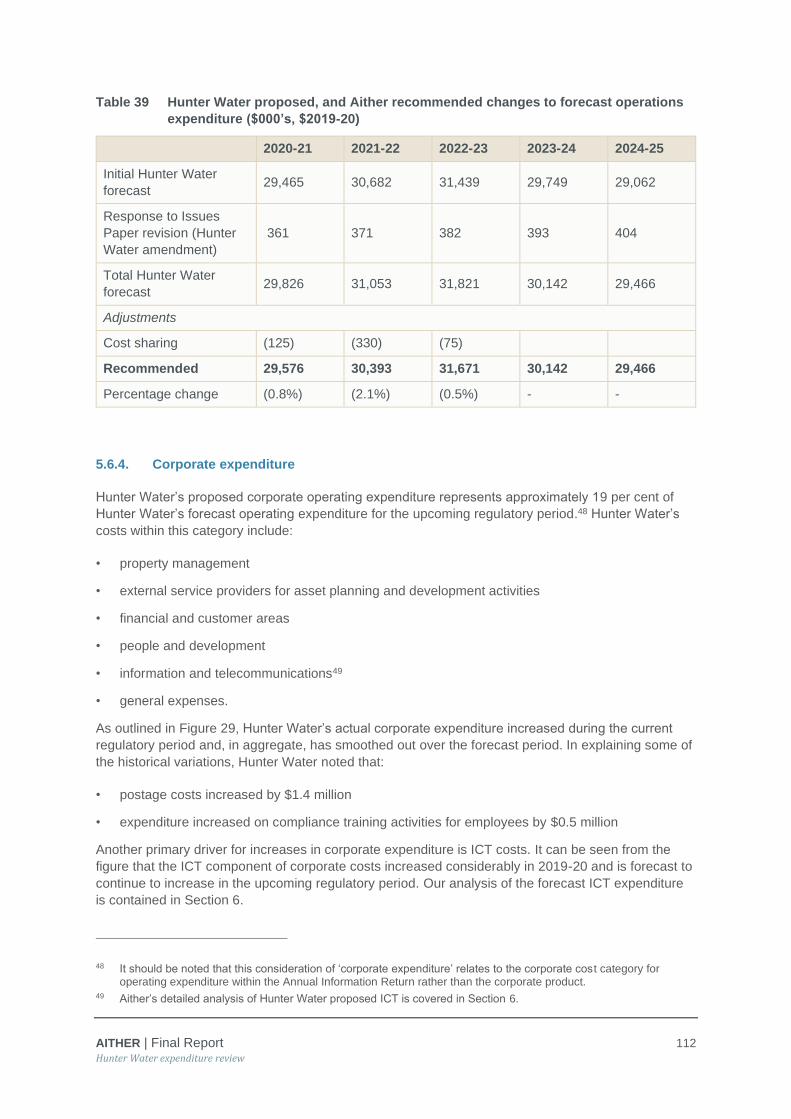
AITHER | Final Report 112
Hunter Water expenditure review
Table 39 Hunter Water proposed, and Aither recommended changes to forecast operations
expenditure ($000’s, $2019-20)
2020-21 2021-22 2022-23 2023-24 2024-25
Initial Hunter Water
forecast 29,465 30,682 31,439 29,749 29,062
Response to Issues
Paper revision (Hunter
Water amendment)
361 371 382 393 404
Total Hunter Water
forecast 29,826 31,053 31,821 30,142 29,466
Adjustments
Cost sharing (125) (330) (75)
Recommended 29,576 30,393 31,671 30,142 29,466
Percentage change (0.8%) (2.1%) (0.5%) - -
5.6.4. Corporate expenditure
Hunter Water’s proposed corporate operating expenditure represents approximately 19 per cent of
Hunter Water’s forecast operating expenditure for the upcoming regulatory period.48 Hunter Water’s
costs within this category include:
• property management
• external service providers for asset planning and development activities
• financial and customer areas
• people and development
• information and telecommunications49
• general expenses.
As outlined in Figure 29, Hunter Water’s actual corporate expenditure increased during the current
regulatory period and, in aggregate, has smoothed out over the forecast period. In explaining some of
the historical variations, Hunter Water noted that:
• postage costs increased by $1.4 million
• expenditure increased on compliance training activities for employees by $0.5 million
Another primary driver for increases in corporate expenditure is ICT costs. It can be seen from the
figure that the ICT component of corporate costs increased considerably in 2019-20 and is forecast to
continue to increase in the upcoming regulatory period. Our analysis of the forecast ICT expenditure
is contained in Section 6.
48 It should be noted that this consideration of ‘corporate expenditure’ relates to the corporate cost category for operating expenditure within the Annual Information Return rather than the corporate product.
49 Aither’s detailed analysis of Hunter Water proposed ICT is covered in Section 6.

AITHER | Final Report 113
Hunter Water expenditure review
Source: Hunter Water’s AIR (Opex by item); ICT information based on information presented by Hunter Water to Aither during
interviews
Figure 29 Comparison of actual and forecast corporate expenditure (‘000s, $2019-20)
In explaining the proposed changes in non-ICT corporate costs for the next regulatory period, Hunter
Water states:50
• property management costs increase next price period due to:
- higher insurance costs caused by higher asset values and historical claims
- higher repair, cleaning and maintenance costs
• higher forecast expenditure on external service providers from increased investment in the critical
asset program
• new initiatives to improve the customer experience via shifting to quarterly billing is forecast to
incur an additional $4.2 million
- this is forecast to be partially offset by the introduction of electronic billing - leading to a
$2.9 million reduction in printing and postage costs (see below)
• people and development costs are forecast to reduce following the completion of leadership and
management training during the current period.
As identified above, Hunter Water has factored in efficiencies relating to its electronic billing program.
Table 40 provides a breakdown of the expected efficiencies from the electronic billing initiative that
have been incorporated into the forecasts.
50 Ibid, p.46 – p.48
0
5,000
10,000
15,000
20,000
25,000
30,000
35,000
2017 actual 2018 actual 2019 actual 2020 estimated 2021 forecast 2022 forecast 2023 forecast 2024 forecast 2025 forecast
Corporate Opex exc. ICT (actual, $2019-20) ICT Opex (actual, $2019-20)
Corporate Opex exc. ICT (forecast, $2019-20) ICT Opex (forecast, $2019-20)
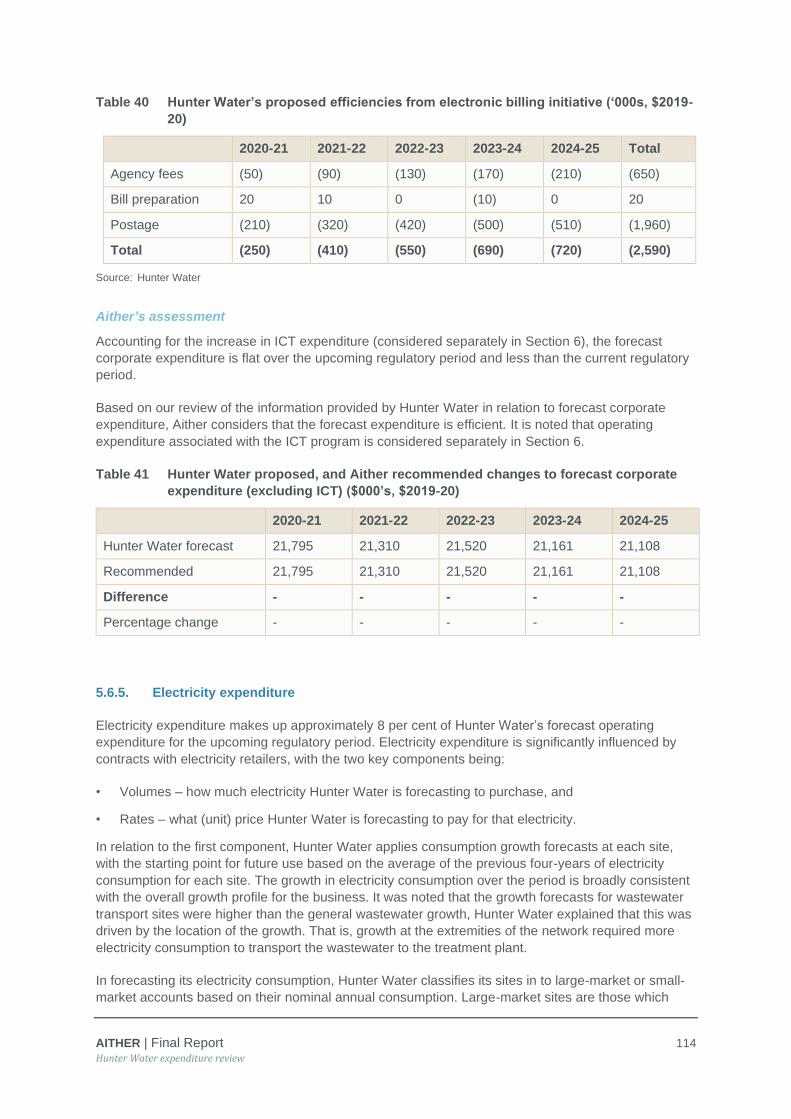
AITHER | Final Report 114
Hunter Water expenditure review
Table 40 Hunter Water’s proposed efficiencies from electronic billing initiative (‘000s, $2019-
20)
2020-21 2021-22 2022-23 2023-24 2024-25 Total
Agency fees (50) (90) (130) (170) (210) (650)
Bill preparation 20 10 0 (10) 0 20
Postage (210) (320) (420) (500) (510) (1,960)
Total (250) (410) (550) (690) (720) (2,590)
Source: Hunter Water
Aither’s assessment
Accounting for the increase in ICT expenditure (considered separately in Section 6), the forecast
corporate expenditure is flat over the upcoming regulatory period and less than the current regulatory
period.
Based on our review of the information provided by Hunter Water in relation to forecast corporate
expenditure, Aither considers that the forecast expenditure is efficient. It is noted that operating
expenditure associated with the ICT program is considered separately in Section 6.
Table 41 Hunter Water proposed, and Aither recommended changes to forecast corporate
expenditure (excluding ICT) ($000’s, $2019-20)
2020-21 2021-22 2022-23 2023-24 2024-25
Hunter Water forecast 21,795 21,310 21,520 21,161 21,108
Recommended 21,795 21,310 21,520 21,161 21,108
Difference - - - - -
Percentage change - - - - -
5.6.5. Electricity expenditure
Electricity expenditure makes up approximately 8 per cent of Hunter Water’s forecast operating
expenditure for the upcoming regulatory period. Electricity expenditure is significantly influenced by
contracts with electricity retailers, with the two key components being:
• Volumes – how much electricity Hunter Water is forecasting to purchase, and
• Rates – what (unit) price Hunter Water is forecasting to pay for that electricity.
In relation to the first component, Hunter Water applies consumption growth forecasts at each site,
with the starting point for future use based on the average of the previous four-years of electricity
consumption for each site. The growth in electricity consumption over the period is broadly consistent
with the overall growth profile for the business. It was noted that the growth forecasts for wastewater
transport sites were higher than the general wastewater growth, Hunter Water explained that this was
driven by the location of the growth. That is, growth at the extremities of the network required more
electricity consumption to transport the wastewater to the treatment plant.
In forecasting its electricity consumption, Hunter Water classifies its sites in to large-market or small-
market accounts based on their nominal annual consumption. Large-market sites are those which

AITHER | Final Report 115
Hunter Water expenditure review
consume greater than 160MWh of electricity per year, and small-market sites are those that consume
less than 160MWh per year. Hunter Water has 497 individual small-market sites, these are further
classified into different tariff structures.
In relation to the second component, Hunter Water has relied on electricity pricing forecasts from
Energy and Management Services (EMS), a consulting firm specialising in electricity price
forecasting. Forecasts were provided for both large and small-scale sites and for each tariff
component. Based on these pricing forecasts, the estimated c/kWh is reducing over the period in real
terms.
Figure 30 provides a comparison of the revised electricity expenditure forecasts from Hunter Water
with its actual electricity expenditure over the current regulatory period. It can be seen from this that
there was a considerable increase in electricity expenditure across 2017-18 and 2018-19. Hunter
Water stated that these increases were driven by high spot prices in the electricity market that were
then passed on by retailers through electricity contract prices. The expected reduction in electricity
expenditure for 2019-20 and the forecast period indicates that the high electricity prices were
temporary in nature and largely contained in the current regulatory period.
Note: The forecast electricity expenditure is based on revised information provided by Hunter Water through the review
(discussed further below).
Figure 30 Comparison of actual and forecast electricity expenditure (‘000s, $2019-20)
Energy efficiency initiatives
Hunter Water has identified two key energy efficiency initiatives for the upcoming regulatory period:
• Smart integrated pump scheduling: This initiative involves applying technology to enable
Hunter Water to optimise the operation of pump stations and valves to ensure electricity is being
consumed at the most efficient schedules.
• Renewable energy savings: This initiative involves investing in renewable energy technology
(solar panels) to save on electricity expenditure. It was noted that this is a substantial investment
and will reach a ‘cap’ within the period. Further work will be undertaken to investigate the
realisation of benefits to determine whether further investments are efficient.
0
2000
4000
6000
8000
10000
12000
14000
16000
18000
2017 actual 2018 actual 2019 actual 2020 estimated 2021 forecast 2022 forecast 2023 forecast 2024 forecast 2025 forecast
Total energy (actual, $2019-20) Total energy (forecast, $2019-20) Energy - Corporate ($2019-20)
Energy - Water ($2019-20) Energy - Wastewater ($2019-20) Energy - Stormwater ($2019-20)

AITHER | Final Report 116
Hunter Water expenditure review
Table 42 outlines the forecast cost reductions resulting from energy efficiency initiatives over the
upcoming regulatory period.
Table 42 Energy efficiency initiatives (‘000s, $2019-20)
Initiative 2020-21 2021-22 2022-23 2023-24 2024-25 TOTAL
Smart
integrated
pump
scheduling
(SIPS)
(456) (484) (485) (493) (498) (2,415)
Renewable
energy
savings*
(360) (1,100) (1,230) (1,230) (1,230) (5,150)
TOTAL (816) (1,584) (1,715) (1,723) (1,728) (7,565)
Source: Hunter Water
Note: * These numbers are based on revised information provided by Hunter Water – see discussion further below.
Procurement strategy for electricity
Hunter Water engages with a specialist electricity consultant to assist with the identifying a preferred
electricity retailer. It was noted that while previous contracts were generally of a three-year term,
Hunter Water indicated that this would not always be the case with decisions on the most appropriate
term of a contract to be made through the procurement process (it was noted that the most recent
contract with Origin was for one-year).
Hunter Water engaged Energetics to develop a recommended electricity procurement strategy for
2020 to 2024. The recommended strategy is designed to control electricity procurement costs and
manage future volume risks within an appropriate risk appetite for the business. It will also provide
Hunter Water with a flexible approach to manage its electricity market risks in the future.
The strategy reviewed various contracting options available to Hunter Water and provided
recommendations for a mix of these contracting options over the short, medium and longer-term. In
addition to the recommendation of contracting options, the strategy also highlighted a need for Hunter
Water to expand its internal capacity (both physical generation and market knowledge) to enable
more sophisticated electricity contracting arrangements in the future to further manage risk and
reduce energy costs.
As part of its procurement approach, it was noted that Hunter Water has approximately 1MW of
curtailable load that it has been able to use as part of negotiations in electricity contracts with
retailers. This has assisted in reducing electricity costs within the current regulatory period.
Revised electricity expenditure forecasts
Subsequent to the initial pricing submission, Hunter Water has advised IPART and Aither that there
were errors in the electricity expenditure forecasts in relation to:
• Small-market sites, and
• Renewable energy savings.
In relation to the small-market sites, Hunter Water engaged a consultant to provide market price
forecasts across various small-market tariff structures over the forecast regulatory period. As part of
the modelling process for electricity forecasts, an error was made in the transfer of small market tariff

AITHER | Final Report 117
Hunter Water expenditure review
data into Hunter Water’s electricity model. This error was detected after the pricing proposal had been
submitted to IPART and resulted in a lower electricity expenditure forecast ($3.64 million) for Hunter
Water over the forecast regulatory period.
In relation to renewable energy savings, Hunter Water is proposing to reduce its energy costs and
associated greenhouse gas emissions through the installation of on-site solar PV systems at its
treatment and pumping assets. The Pricing Submission included a capital allowance of $16 million for
the project with forecast operating expenditure savings of $1.23 million per annum.
Hunter Water has since identified a mistake in its calculations in that it had assumed the full benefit of
the $1.23 million in savings would start from 1 July 2020. This did not align with the original project
scope where it was assumed that the project would be commissioned throughout 2020-21 and 2021-
22. Based on the latest estimates of the likely roll-out, Hunter Water estimates that all of the solar
infrastructure will be in place by the end of June 2022, with the full value of the savings to commence
from 2022-23. Table 43 provides the revised cost saving information related to this initiative.
Table 43 Revised cost savings from renewable energy project (‘000s, $2019-20)
Initiative 2020-21 2021-22 2022-23 2023-24 2024-25 TOTAL
Price
Submission 1,230 1,230 1,230 1,230 1,230 6,150
Revised 360 1,100 1,230 1,230 1,230 5,150
TOTAL (870) (130) - - - (1,000)
Source: Hunter Water
Aither has included these variations with the original forecasts as part of our assessment of Hunter
Water’s forecast electricity expenditure.
Aither’s assessment
The method used by Hunter Water to develop electricity expenditure forecasts is robust and
transparent. The models were developed at a disaggregated and detailed level to enable
consideration of consumption and electricity costs for each site within the business. Hunter Water’s
forecast electricity consumption used within those models aligns with the overall growth in demand
forecasts for the business over the regulatory period.
To test the efficiency of the electricity price that has been adopted by Hunter Water, Aither has
converted the forecast electricity expenditure and consumption into a unit price for the upcoming
period (see Table 44 below). From this it can be seen that the forecast unit price (c/kWh) over the
regulatory period is falling.
Table 44 Forecast electricity expenditure per kWh of consumption ($2019-20)
Initiative 2020-21 2021-22 2022-23 2023-24 2024-25
Forecast electricity
expenditure (‘000s) 14,171 13,129 13,265 13,155 13,166
Forecast electricity
consumption (kWh) 87,816,953 88,926,575 90,025,068 91,159,950 92,307,916
Unit price (c/kWh) 16.14 14.76 14.73 14.43 14.26
Source: Hunter Water; Aither calculations

AITHER | Final Report 118
Hunter Water expenditure review
Aither considers that Hunter Water’s position in relation to the energy efficiency initiatives is a
reasonable and have been factored in to the electricity forecasting model. However, in future it is
expected that further efficiency initiatives should be able to be realised through the maturation of the
business and sophistication in electricity capabilities.
Based on our review, we consider that Hunter Water’s forecast electricity expenditure is efficient and
therefore no adjustments are required.
Table 45 Hunter Water proposed, and Aither recommended changes to forecast electricity
expenditure ($000’s, $2019-20)
2020-21 2021-22 2022-23 2023-24 2024-25
Hunter Water
forecast 14,171 13,129 13,265 13,155 13,166
Recommended 14,171 13,129 13,265 13,155 13,166
Difference - - - - -
Percentage change - - - - -
5.6.6. Other on-going operational expenditure
Hunter Water’s operational expenditure forecasts also comprise other, less material operational
expenditure items, such as:
• Licence fees
• Revenue offsets
• Regulatory expenditure
• Operating leases
Forecast licence fees are reasonably constant and reasonably consistent with historical licence fees.
There was some variation in previous years due to fees being incurred in different years, however the
effective annual expenditure has remained relatively constant.
The revenue offsets expenditure primarily relates to debt collection activities (including Hunter Water’s
Hardship Program). The forecast expenditure is reasonably consistent with the current regulatory
period.
Regulatory expenditure increased in 2017-18 and 2018-19 primarily as a result of the Dungog non-
standard water customer project and increased costs for the Lower Hunter Water Plan. Further costs
were also incurred in relation to the Burwood Beach Marine Environment Assessment Program and
the Hunter River estuary master plan.
The operating lease expenditure comprises head office and motor vehicle lease costs. Hunter Water
provided a detailed breakdown of the forecast costs for these cost items. Aither also notes that in
relation to the head office lease expenditure, Hunter Water has forecast this expenditure to be
$2.6 million (including outgoings of $0.26 million) per annum over the upcoming regulatory period. To
verify this cost, Hunter Water engaged an independent value to provide a valuation report for the
head office building. The rental value of the building was estimated to be $2.35 million per annum plus
outgoings. This independent estimate aligns with the forecast cost for the head office operating lease.

AITHER | Final Report 119
Hunter Water expenditure review
Aither’s assessment
Based on the above discussion, Aither considers the forecast for these other ongoing operating
expenditure categories to be efficient.
5.6.7. On-going productivity and efficiency improvements
We note that as part of Hunter Water’s submission it did not incorporate any ongoing efficiency
improvements for the regulatory period. During interviews with Hunter Water staff, it was indicated
that the forecast vacancy rate was used as a method for imposing efficiencies across the business. In
reviewing the vacancy rate (see section 5.6.1), it is not clear that any explicit consideration of
efficiencies had been factored in to the forecast vacancy rate.
Rather than an ongoing efficiency factor, Hunter Water identified some specific efficiency initiatives
and incorporated these within its forecast expenditure for the upcoming regulatory period (see Figure
31 below). Further to these initiatives, in reference to the organisational restructure, Hunter Water
noted that:51
Hunter Water completed a significant organisational restructure during the current
price period to better align organisational structure with our activities. In addition to
better outcomes for customers, we expect that the restructure will deliver efficiencies
through better collaboration and workforce productivity.
Source: Hunter Water, Response to IPART Issues Paper, p. 22.
Note: The forecast savings from renewable energy is based on revised information provided by Hunter Water through the
review.
Figure 31 Hunter Water’s proposed efficiency initiatives ($millions, $2019-20)
Hunter Water response to IPART Issues Paper
In response to IPART’s Issues Paper, Hunter Water made further comments in relation to the
potential imposition of an ongoing efficiency factor. Hunter Water acknowledged that although it had
identified some efficiency initiatives, applying a continuing efficiency target was typical practice in
economic regulation. This is due to the fact that it seeks to mimic the rate at which an ‘efficient
frontier’ firm becomes even more efficient. Hunter Water went on to state:52
51 Hunter Water Pricing Submission: Technical Paper 5, p.25. 52 Hunter Water, Response to IPART Issues Paper, p. 22.

AITHER | Final Report 120
Hunter Water expenditure review
We consider that any additional continuing efficiency factor that may be applied to
Hunter Water should only apply to components of our operating expenditure that are
controllable. In recognition of the considerable efficiency target already built-in to our
operating expenditure proposal, we believe that the value of any additional factor
should not exceed 0.25 per cent per annum.
Aither’s assessment
As identified by Hunter Water in its response to IPART’s Issues Paper, it is common practice in
economic regulation to impose continuing efficiency targets on regulated utilities as a way to ensure
the regulated utilities continue to search for efficiencies that may not have been apparent at the time
of the regulatory decision.
In assessing a possible ongoing efficiency target, Aither has:
• Considered the trend over time in operating expenditure for Hunter Water
• Considered the efficiency frontier and the need for any catch-up efficiencies, and
• Compared operating expenditure per customer with the Victorian water industry.
Aither has then recommended an ongoing efficiency improvement, based on this analysis in
conjunction with our detailed assessment of operating expenditures. Aither notes that there is
subjectivity in this assessment and that methods adopted across regulators and industries typically
vary considerably.
Trends in Hunter Water operating expenditure
To consider the efficiency of Hunter Water’s forecast operating expenditure, Aither has investigated
the change in operating cost per customer over the current and upcoming regulatory period. Based on
Hunter Water’s submission, the operating cost per customer is forecast to decline over the upcoming
regulatory period at a steady rate since the peak of 2017-18. While this is positive for customers that
the operating cost per customer is declining, it is still higher than it was in 2016-17 in real terms.
Figure 32 Hunter Water operating cost per property over the regulatory periods
80
85
90
95
100
105
110
115
120
2017 actual 2018 actual 2019 actual 2020 estimated 2021 forecast 2022 forecast 2023 forecast 2024 forecast 2025 forecast
Total Opex per customer (per cent of 2016-17)

AITHER | Final Report 121
Hunter Water expenditure review
As outlined in section 5.3, based on a high-level consideration of the NPR, Hunter Water falls within
the low to medium operating cost per customer for medium to large water utilities in Australia (this is
after adjusting for bulk water). It should be noted that this comparison is based on 2017-18 figures
which includes the increase in operating expenditure per customer identified above. This
demonstrates that following the increase in operating expenditure in 2017-18, Hunter Water still
compared well with other similar water utilities.53
Source: NPR data; Aither adjustments
Figure 33 Revised comparison of operating expenditure per property
Consideration of efficiency frontier and catch-up efficiencies
One of the ways in which economic regulators determine the level of ongoing efficiencies that are
imposed on regulated utilities is to understand the efficiency frontier and where the utility sits in
relation to that frontier. The efficiency frontier reflects the most efficient utilities in the sector, whereby
the closer the utility is to the frontier, the more efficient the utility is. The further away from the frontier
implies that the utility has greater scope for realising efficiencies.
The process for estimating an efficient frontier requires considerable data on cost inputs and outputs
across a wide variety of similar service providers. Aither considers that there is insufficient data to
determine if Hunter Water is a ‘frontier’ utility from an efficiency perspective. In addition to the
insufficient Hunter Water data, there are limited number of suitable comparators to make definitive
judgements on the efficiency of Hunter Water through such benchmarking analysis.
Aither notes that Hunter Water have been through multiple regulatory reviews with IPART and have
established reasonably robust internal processes as a result. Through this bottom-up review of
historical and forecast operating expenditure there was no obvious evidence of the need for any
53 It should be noted that the NPR data can at times have issues with integrity with comparing across business, so the analysis should be considered at a high-level and not be seen as definitive.

AITHER | Final Report 122
Hunter Water expenditure review
‘catch-up’ efficiencies in addition to the base adjustments that have been proposed in the previous
sections.
Comparison with other utilities
The high-level comparison has focused on the forecast ongoing efficiencies within the Victorian water
industry from its recent regulatory review. The Victorian water industry has been used as a
comparator as it provides a mix of metropolitan and regional utilities and has a higher number of
utilities (13) to provide a reasonable average. Aither has undertaken the comparison from the final
year of actual operating expenditure for Hunter Water (2018-19 as the base year). We note that
different utilities will have different starting points that will affect the assessment of any efficiency
analysis – i.e. some utilities may have already realised significant efficiencies while others may be
realising significant efficiencies through the upcoming period. This can affect the comparison of
expected efficiencies. Aither has therefore used the Victorian industry average as the comparator to
minimise these risks of different starting points for different utilities.
While the assessment of the Victorian water industry is based on controllable costs, these costs make
up over 90 per cent of its total operating costs. Further to this, of the non-controllable costs, the
environmental contribution levy (a separate charge that is passed directly on to customers) makes up
over 95 per cent. Therefore, we consider it to remain a reasonable point of comparison.
Figure 34 provides the comparison of Hunter Water with the Victorian water industry. The Hunter
Water information is based on Hunter Water’s proposed efficiencies and Aither’s recommended
adjustments (excluding any ongoing efficiency). This shows that average Victorian water industry
operating costs per customer are forecast to decline by more than the reductions per customer
proposed by Hunter Water.
Source: Essential Services Commission; Aither adjustments
Figure 34 Comparison of operating expenditure per property
Findings from assessment
Aither considers that an ongoing efficiency factor is warranted to ensure Hunter Water continues to
seek efficiencies throughout the upcoming regulatory period.
90.0%
95.0%
100.0%
105.0%
110.0%
2019 actual 2020 estimated 2021 forecast 2022 forecast 2023 forecast 2024 forecast 2025 forecast
HW Total Opex per customer (adjusted, per cent of 2018-19) Vic industry average

AITHER | Final Report 123
Hunter Water expenditure review
Noting that the operating cost per customer is forecast to decline over the upcoming regulatory
period, Aither recommends the application of an ongoing efficiency factor of 0.4 per cent per annum
to Hunter Water’s controllable costs. This recommendation is based on Aither’s consideration that:
• There is no obvious evidence of the need for any catch-up efficiencies to be applied in addition to
the previous adjustments
• Hunter Water is currently a low to medium operating cost water utility
• The ongoing efficiencies seek to bring the forecast operating expenditure per property more in
line with the forecast ongoing efficiencies from the Victorian water industry which covers a range
of water utilities.
Figure 35 highlights the impact that the ongoing efficiency factor has in more closely aligning the
operating cost per property changes over time between Hunter Water and the Victorian water
industry. While this is not a perfect alignment as the time periods do not match, we have developed a
high-level trend line for the Victorian industry to provide an indicative level of ongoing efficiency for the
later years. We did not seek to align the reductions in operating expenditure as this would not be
appropriate, but rather use this as a guide, along with the other analysis highlighted above to
determine an appropriate ongoing efficiency adjustment.
Source: Essential Services Commission; Aither adjustments
Figure 35 Comparison of operating expenditure per property (including ongoing efficiency)
Aither notes that the application of a 0.4 per cent efficiency adjustment is broadly consistent with the
2019 Productivity Bulletin that was recently published by the Productivity Commission. The
Productivity Bulletin highlights that labour productivity for the ‘Market sector’ is 0.4 per cent, while the
estimate of the multi-factor productivity (factoring in labour and capital) for 2017-18 is also broadly
consistent at 0.5 per cent.54
54 https://www.pc.gov.au/research/ongoing/productivity-bulletin/2019
90.0%
95.0%
100.0%
105.0%
110.0%
2019 actual 2020 estimated 2021 forecast 2022 forecast 2023 forecast 2024 forecast 2025 forecast
HW Total Opex per customer (adjusted, per cent of 2018-19)
Vic industry average
HW Total Opex per customer (efficiency adjusted, per cent of 2018-19)
Vic trendline

AITHER | Final Report 124
Hunter Water expenditure review
Hunter Water was of the view that any ongoing efficiency adjustment should only be applied to
controllable operating expenditure. However, Aither notes that the AIR does not separate costs
between controllable and non-controllable. Aither accepts that it can be inappropriate to apply an
efficiency factor to non-controllable costs and has therefore sought to remove the non-controllable
costs from the adjustment. Aither has not applied the ongoing efficiency adjustment to the forecast
licence fee expenditure as these are non-controllable costs for Hunter Water.55 This has a minor
impact on the overall efficiency adjustment.
Aither notes that the previous adjustments to the forecast labour expenditure were based on the
identifying the appropriate base-level of expenditure rather than forecast efficiencies. We therefore
consider it appropriate to apply to the ongoing efficiency across all controllable operating expenditure
(i.e. including labour expenditure).
These findings of an ongoing efficiency adjustment are only applied to controllable operating
expenditure and do not apply to capital expenditure. The consideration of ongoing efficiencies for
capital expenditure are considered in section 4.8. Table 46 below outlines the impact of that efficiency
factor on the forecast operating expenditure.
55 It should be noted that non-controllable costs in the Victorian industry are also quite low for most utilities and only represent licence fees, environmental contributions (imposed by State legislation) and where bulk services are purchased from a separate utility.

AITHER | Final Report 125
Hunter Water expenditure review
Table 46 Recommended ongoing efficiency adjustment for operating expenditure ($000s,
$2019/20)
2020-21 2021-22 2022-23 2023-24 2024-25
Water
Aither adjusted
operating
expenditure
49,098 47,520 47,000 46,320 46,671
Sub-total excluding
non-controllable 48,604 47,026 46,506 45,826 46,177
Efficiency adjustment
(0.4% cumulative per
annum)
(194) (374) (554) (726) (913)
Wastewater
Aither adjusted
operating
expenditure
54,881 55,590 56,509 55,863 55,522
Sub-total excluding
non-controllable 54,218 54,927 55,846 55,200 54,859
Efficiency adjustment
(0.4% cumulative per
annum)
(216) (437) (665) (874) (1,084)
Stormwater
Aither adjusted
operating
expenditure
1,159 1,197 1,190 1,172 1,180
Sub-total excluding
non-controllable 1,159 1,197 1,190 1,172 1,180
Efficiency adjustment
(0.4% cumulative per
annum)
(5) (10) (14) (19) (23)
Corporate
Aither adjusted
operating
expenditure
53,019 51,825 52,793 52,598 52,420
Sub-total excluding
non-controllable 52,902 51,707 52,675 52,480 52,302
Efficiency adjustment
(0.4% cumulative per
annum)
(211) (411) (627) (831) (1,034)

AITHER | Final Report 126
Hunter Water expenditure review
5.7. Recommended operating expenditure
Based on our review of Hunter Water’s proposed operating expenditure, Aither concludes that the majority of operating expenditure is considered efficient
and was able to be justified with comprehensive and robust documentation from Hunter Water. Our review identified some adjustments that we consider
necessary to reflect an efficient level of forecast operating expenditure:
• reductions in labour to reflect a lower base level of labour expenditure
• reductions in operations costs relating to the sharing of risk between Hunter Water and its customers for transition costs for both the operations and
laboratory contracts
• introduction of an ongoing efficiency factor of 0.4 per cent per annum to reflect future efficiency gains.
The following tables provide our recommended operating expenditure for the water, wastewater, stormwater and corporate products for the upcoming
regulatory period. In terms of the operating expenditure related to the proposed discretionary programs, Hunter Water has indicated that it has not sought to
recover the associated operating expenditure through this process. Instead it will absorb these cost increases within the business.

AITHER | Final Report 127
Hunter Water expenditure review
Table 47 Recommended water operating expenditure ($000s, $2019-20)
2020-21 2021-22 2022-23 2023-24 2024-25 Total
Hunter Water proposed
water operating
expenditure
48,422 47,196 46,642 45,946 46,295 234,501
Adjustments
Changes to operations (43) (105) (23) - - (171)
Changes to energy (Hunter
Water amendment) 567 273 223 214 216 1,494
Issues paper (Hunter Water
amendment) 152 156 158 159 161 786
Sub-total recommended
adjustments 676 324 358 373 376 2,108
Sub-total recommended
water operating
expenditure
49,098 47,520 47,000 46,320 46,671 236,609
Controllable expenditure 48,604 47,026 46,506 45,826 46,177 234,139
Efficiency adjustment (0.4%
cumulative per annum) (194) (374) (554) (726) (913) (2,760)
Total recommended water
operating expenditure 48,904 47,146 46,446 45,594 45,759 233,849
Percentage change 1.0% (0.1%) (0.4%) (0.8%) (1.2%) (0.3%)

AITHER | Final Report 128
Hunter Water expenditure review
Table 48 Recommended wastewater operating expenditure ($000s, $2019-20)
2020-21 2021-22 2022-23 2023-24 2024-25 Total
Hunter Water proposed
wastewater operating
expenditure
53,681 55,013 55,839 55,133 54,785 274,452
Adjustments
Changes to operations (82) (225) (52) - - (359)
Changes to energy (Hunter
Water amendment) 1,073 587 497 496 494 3,146
Issues paper (Hunter Water
amendment) 209 215 225 234 243 1,125
Sub-total recommended
adjustments 1,200 577 670 730 737 3,913
Sub-total recommended
wastewater operating
expenditure
54,881 55,590 56,509 55,863 55,522 278,365
Controllable expenditure 54,218 54,927 55,846 55,200 54,859 275,050
Efficiency adjustment (0.4%
cumulative per annum) (216) (437) (665) (874) (1,084) (3,276)
Total recommended
wastewater operating
expenditure
54,665 55,153 55,844 54,988 54,438 275,089
Percentage change 1.8% 0.3% 0.0% (0.3%) (0.6%) 0.2%

AITHER | Final Report 129
Hunter Water expenditure review
Table 49 Recommended stormwater operating expenditure ($000s, $2019-20)
2020-21 2021-22 2022-23 2023-24 2024-25 Total
Hunter Water proposed
stormwater operating
expenditure
1,159 1,197 1,190 1,172 1,180 5,898
No adjustments
Sub-total recommended
stormwater operating
expenditure
1,159 1,197 1,190 1,172 1,180 5,898
Controllable expenditure 1,159 1,197 1,190 1,172 1,180 5,898
Efficiency adjustment (0.4%
cumulative per annum) (5) (10) (14) (19) (23) (70)
Total recommended
stormwater operating
expenditure
1,154 1,188 1,175 1,153 1,157 5,828
Percentage change (0.4%) (0.8%) (1.2%) (1.6%) (2.0%) (1.2%)

AITHER | Final Report 130
Hunter Water expenditure review
Table 50 Recommended corporate operating expenditure ($000s, $2019-20)
2020-21 2021-22 2022-23 2023-24 2024-25 Total
Hunter Water proposed
corporate operating
expenditure
54,019 52,825 53,793 53,598 53,420 267,654
Adjustments
Aither adjustments to
corporate labour
expenditure
(1,000) (1,000) (1,000) (1,000) (1,000) (5,000)
Sub-total recommended
adjustments (1,000) (1,000) (1,000) (1,000) (1,000) (5,000)
Sub-total recommended
corporate operating
expenditure
53,019 51,825 52,793 52,598 52,420 262,654
Controllable expenditure 52,902 51,707 52,675 52,480 52,302 262,066
Efficiency adjustment (0.4%
cumulative per annum) (211) (411) (627) (831) (1,034) (3,114)
Total recommended
corporate operating
expenditure
52,809 51,413 52,166 51,766 51,386 259,540
Percentage change (2.2%) (2.7%) (3.0%) (3.4%) (3.8%) (3.0%)
Note: ICT operating expenditure is included in the above forecasts. The assessment of ICT expenditure is contained in section 6.
AITHER | Final Report 131
Hunter Water expenditure review
6. Information and Communications
Technology
6.1. Overview
Aither’s review of information and communications technology (ICT) is based on a total expenditure
approach and therefore we have assessed Hunter Water’s ICT expenditure holistically, rather than
assessing its operating or capital expenditure in isolation. We have adopted this approach due to the
shifting nature of ICT expenditure. This shift can result in expenditure that varies significantly from
historical trends, whereby increases in operating expenditure could be offset by decreases in capital
expenditure (and vice versa). Aither has used the Australian Energy Regulator guidance on ICT
expenditure assessments as a reference for assessing Hunter Water’s ICT forecasts.56
In its submission, Hunter Water stated its 2017+3 Strategic Plan identified a need to undertake ‘catch-
up’ investment in ICT, noting:57
Hunter Water recognised that we lagged behind our water peers and many other
utilities in the way we use technology to run our business and manage information.
Our maintenance and field workforce management system is 20 years old, our billing
system is 15 years old and our financial management system is 15 years old. We
cannot move forward without first establishing a solid ICT foundation, bringing us in
line with other network utilities. We are working to ensure our customers have access
to up to date ways of communicating with us, paying bills, registering complaints,
requesting services and providing feedback on our performance.
Hunter Water has increased its level of expenditure on ICT during the current period and is proposing
to further increase its ICT related operating and capital expenditure in the next period, as shown by
Figure 3658
56 Australian Energy Regulator, ICT Expenditure Assessment: Consultation Paper, May 2019. 57 Hunter Water Pricing Proposal, 1 July 2019, p.4 58 Hunter Water supplied this figure following a presentation to Aither
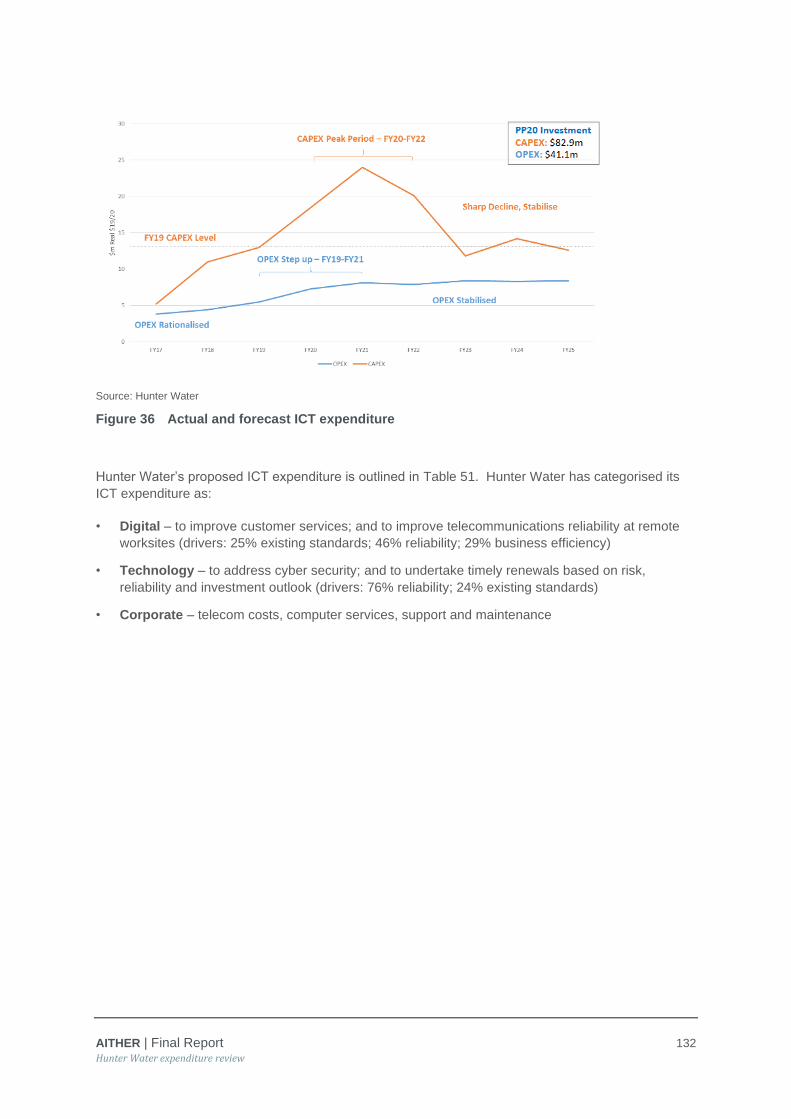
AITHER | Final Report 132
Hunter Water expenditure review
Source: Hunter Water
Figure 36 Actual and forecast ICT expenditure
Hunter Water’s proposed ICT expenditure is outlined in Table 51. Hunter Water has categorised its
ICT expenditure as:
• Digital – to improve customer services; and to improve telecommunications reliability at remote
worksites (drivers: 25% existing standards; 46% reliability; 29% business efficiency)
• Technology – to address cyber security; and to undertake timely renewals based on risk,
reliability and investment outlook (drivers: 76% reliability; 24% existing standards)
• Corporate – telecom costs, computer services, support and maintenance

AITHER | Final Report 133
Hunter Water expenditure review
Table 51 Hunter Water proposed ICT expenditure for the upcoming regulatory period
($million, $2019/20)
Category Programs Operating
Expenditure
Capital
Expenditure
(Recurrent)
Capital
Expenditure
(Non-
Recurrent)
Total
Expenditure
Digital • Field services
model
• Service and
experience
• Intelligent
networks
• Go Digital
$6.1 $0 $27.1 $33.1
Technology • Information
security
• Applications
• Networks and
communications
• Storage/Compute
• End user
computing
$3.0 $48.5 $7.3 $58.8
Corporate • Telecom
expenses
• Computer
services
• Support and
maintenance
$32.0 $0 $0 $32.0
Total $41.1 $48.5 $34.4 $123.9
Source: Aither – based on analysis of Hunter Water supplied information
Aither has reviewed Hunter Water’s proposed ICT expenditure under the following categories:
• Strategy – review of strategic context, drivers, deliverability and commitments to outcomes
• Recurrent – compare forecast expenditure to historic expenditure; and benchmarking
• Non-recurrent – review of business cases and Gateway process; assumptions, and NPV; ensure
options were considered; review identified benefits.
The following sections outline Aither’s review, followed by our concluding recommendation.
6.2. ICT strategy
Hunter Water has a draft Technology Strategy 2020 - 2025 which describes the drivers, direction and
technology influencing the approach to ICT at Hunter Water. The context of the strategy is that Hunter
Water describes itself as emerging from a period of under-investment that saw the focus placed on
extending asset lives beyond typical upper limits.

AITHER | Final Report 134
Hunter Water expenditure review
Hunter Water stated that historical under-investment had left it with increased operational costs,
increased frequency and duration of outages, dated business practices and offering services well
below what is considered by customer and stakeholders as fundamental from a water utility. Hunter
Water plans to deliver new technology largely within the existing enterprise architecture. It has
identified that with increased expenditure, it will deliver improved customer service, operational
performance, environmental outcomes, information security, risk and safety.
Aither’s assessment
Aither believes the strategy is sound but lacks specific numerical outcomes for the expenditure
planned. Without those outcomes it is not possible to judge the efficiency of the strategy. Aither
recommends that a system of progress reporting and an ex-post assessment with an adjustment be
implemented by Hunter Water during the next period.
An example of this type reporting and assessment is South East Water’s self-service and outage
alerts. By undertaking this assessment, South East Water has been able to monitor customer uptake
of new service offerings made available by investment in ICT and has so-far achieved:59
• 37 per cent of customers using its self-service webpages
• 79 per cent of customers (who had recorded their mobile telephone numbers) alerted to water
outages.
6.3. Recurrent ICT program assessment
As demonstrated in Figure 37, Hunter Water’s operating costs across the current regulatory period
were close to the IPART 2016 Determination. However, while the annual determination allowance
was relatively flat on an annual basis, Hunter Water’s actual expenditure was significantly higher at
the end of the period compared to the beginning. Hunter Water’s explanation for this is that their past
ICT investment strategy focused on extending asset lives. Several core systems remained largely
untouched, using technology from a decade or more ago, including the:
• billing system
• field job management system
• document management solution
• plan management system.
Hunter Water has also specified the underspend during the first two years of the current period was
from savings related to project deferrals, contract rationalisation and re-negotiation of short-term
vendor concessions.60 Hunter Water stated that the Integrum system that manages quality and risk
was built on technology first developed in 1989. While the program has been effective in deferring
capital costs, operating costs have increased as a result.61
59 South East Water Annual Report 2018-19, pp 29, 49, 16 60 Hunter Water Pricing Proposal, 1 July 2019, Technical paper 5, p. 27 61 Hunter Water provided detail of its systems in presentations to Aither and additional supplied documentation

AITHER | Final Report 135
Hunter Water expenditure review
Source: Hunter Water
Figure 37 Recurrent ICT expenditure over current and upcoming regulatory period
Hunter Water stated that the $2.9 million increase from 2017-18 compared to 2019-20 (as shown by
Figure 37) arose across five areas:62
• implementation of new technology and projects including improving information and cyber
security, moving to ISO27001 Information Security Standard, training of staff for new systems
($0.5 million)
• a premium to maintain serviceability ($0.3 million)
• software – increased annual support costs associated with billing system, total contact centre,
incident management system and meter reading system and new systems for environment,
customers and leakage such as
• increased telecommunications costs associated with voice, data, data centre and the contact
centre ($0.1 million)
• costs associated with photocopier leases and radio communications ($0.1 million).
Aither has reviewed a sample of invoices, and while not comprehensive, has formed a view that these
explanations are reasonable. The expenditure for 2019-20 is a forecast and reflects a substantial
expenditure increase on the previous year. Aither selected one significant component
and sighted paperwork showing that Hunter Water has based its forecast on an independent
quote from While not a comprehensive test, Aither believes the forecast operating cost increase
in 2019-20 is likely to occur. In addition, Hunter Water provided a list of cost savings and cost
increases to explain the $0.8m increase from 2019-20 to 2020-21.
62 Hunter Water Pricing Proposal, 1 July 2019, Technical paper 5, p. 37

AITHER | Final Report 136
Hunter Water expenditure review
Consistent with its ICT strategy, Hunter Water’s forecast ICT operation expenditure for the next period
is proposed to increase as shown by Figure 37. In explain these increases, Hunter Water states:63
• ICT support and maintenance costs increase as new technologies are implemented
• higher ongoing annual support and maintenance costs compared to the cost of maintaining the
legacy equivalent
• other new applications, like the customer self-service portal and our intelligent network program,
all have higher annual costs than the current systems
• ICT support and maintenance costs increase
In a presentation to Aither, Hunter Water quantified the proposed annual increases to forecast annual
operating costs as a result of its new ICT systems as show by Figure 38.
Figure 38 Hunter Water’s proposed increases to ICT operating costs
Hunter Water also provided the forecast ICT operating cost savings arising from investment in these
new systems as shown by Figure 39.
Figure 39 Hunter Water proposed ICT expenditure savings
Aither’s assessment
Aither notes that the annual cost increases of the new systems outweigh the annual savings specified
by Hunter Water for the removal of old systems. However, the drivers of Hunter Water’s new ICT
strategy necessitates improvements in its existing systems in order to achieve the desired outcomes
of the strategy. These improvements attract the higher costs of newer technologies.
Notwithstanding our previous concerns, discussed in Section 4.8, that benchmarking can be
problematic and inconclusive in efficiency terms we sighted evidence that Hunter Water is an
63 Hunter Water Pricing Proposal, 1 July 2019, Technical paper 5, p. 48
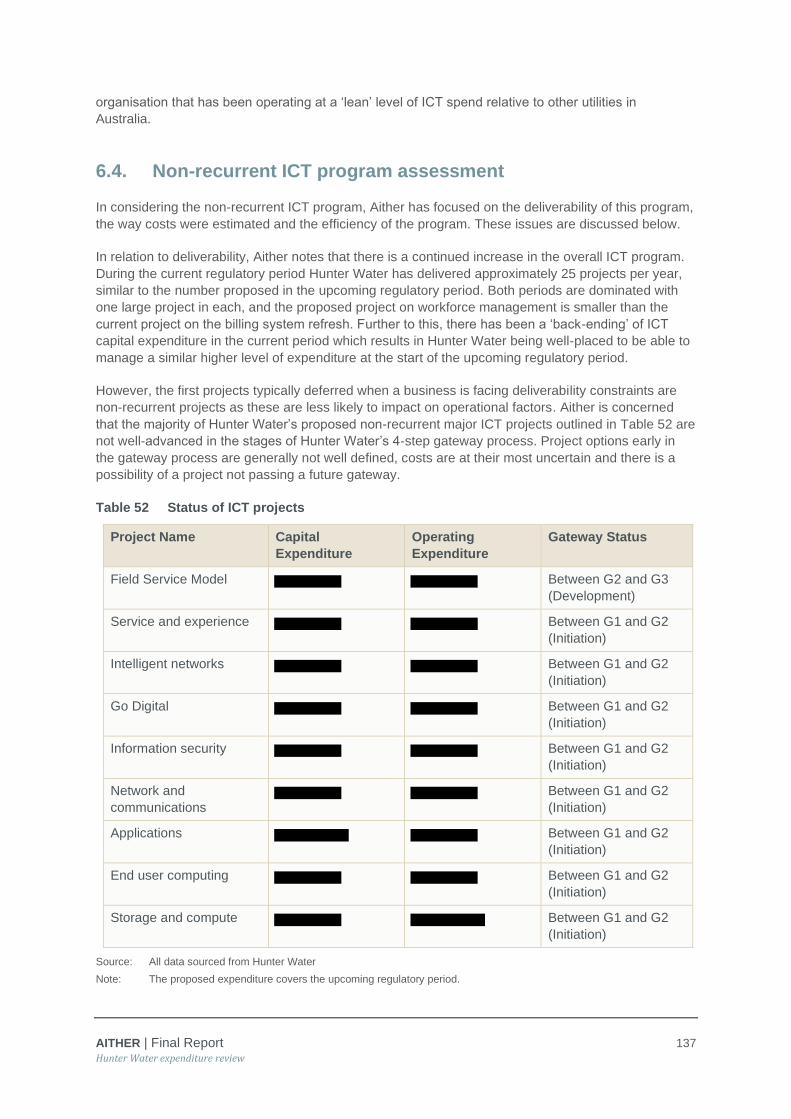
AITHER | Final Report 137
Hunter Water expenditure review
organisation that has been operating at a ‘lean’ level of ICT spend relative to other utilities in
Australia.
6.4. Non-recurrent ICT program assessment
In considering the non-recurrent ICT program, Aither has focused on the deliverability of this program,
the way costs were estimated and the efficiency of the program. These issues are discussed below.
In relation to deliverability, Aither notes that there is a continued increase in the overall ICT program.
During the current regulatory period Hunter Water has delivered approximately 25 projects per year,
similar to the number proposed in the upcoming regulatory period. Both periods are dominated with
one large project in each, and the proposed project on workforce management is smaller than the
current project on the billing system refresh. Further to this, there has been a ‘back-ending’ of ICT
capital expenditure in the current period which results in Hunter Water being well-placed to be able to
manage a similar higher level of expenditure at the start of the upcoming regulatory period.
However, the first projects typically deferred when a business is facing deliverability constraints are
non-recurrent projects as these are less likely to impact on operational factors. Aither is concerned
that the majority of Hunter Water’s proposed non-recurrent major ICT projects outlined in Table 52 are
not well-advanced in the stages of Hunter Water’s 4-step gateway process. Project options early in
the gateway process are generally not well defined, costs are at their most uncertain and there is a
possibility of a project not passing a future gateway.
Table 52 Status of ICT projects
Project Name Capital
Expenditure
Operating
Expenditure
Gateway Status
Field Service Model Between G2 and G3
(Development)
Service and experience Between G1 and G2
(Initiation)
Intelligent networks Between G1 and G2
(Initiation)
Go Digital Between G1 and G2
(Initiation)
Information security Between G1 and G2
(Initiation)
Network and
communications
Between G1 and G2
(Initiation)
Applications Between G1 and G2
(Initiation)
End user computing Between G1 and G2
(Initiation)
Storage and compute Between G1 and G2
(Initiation)
Source: All data sourced from Hunter Water
Note: The proposed expenditure covers the upcoming regulatory period.

AITHER | Final Report 138
Hunter Water expenditure review
In considering these issues, Aither has sighted cost estimating spreadsheets from Hunter Water. The
Intelligent Network program spreadsheet is based on unit costs and density of installations used in
Sydney Water’s program, which Sydney Water expect to further refine as the program progresses.
The document sighted by Aither from Sydney Water mentioned that its density of roll-out was
probably conservative, and might be reduced once it had conducted some analysis to develop
machine learning algorithms.
Aither’s assessment
Aither believes the program categories proposed by Hunter Water are sensible. While there is a
continued increase in expenditure in the first two years of the upcoming regulatory period, Hunter
Water has increased its internal capacity within the current regulatory period to the point where it
should be able to handle such an increase from a delivery perspective.
6.5. Recommendations for ICT program
Based on this review of the ICT program, Aither considers that the forecast expenditure from Hunter
Water is efficient. There is an increase in the level of capital expenditure in the period, however a
material proportion of this is related to technological investments that would otherwise be seen as
standard by other large water utilities.
The increase presents deliverability issues for Hunter Water, however with the increase in the ICT
program within the current regulatory period, it provides a reasonable guide to the ability of Hunter
Water to be able to deliver the program within the timeframe.

AITHER | Final Report 139
Hunter Water expenditure review
7. Recycled water
7.1. Overview
This section discusses Hunter Water’s recycled water schemes and the costs associated with
delivering on these schemes. To undertake this, we have focused on the ring-fencing approach that
has been adopted by Hunter Water for these schemes.
7.2. Existing recycled water schemes and ring-fencing
Hunter Water provides recycled water to customers from 11 of its wastewater treatment plants. The
recycled water provided to customers through these schemes is approximately 10 per cent of the
effluent throughput that is treated to a recycled water standard. Table 53 provides a list of the various
recycling schemes and how they are classified under IPART’s cost recovery framework.
‘Least-cost recycled water’ schemes do not require financial ring-fencing as they are seen as the least
cost option and therefore the costs are attributed to wastewater customers. Given each of these
schemes existed prior to the start of the current pricing period, Aither has not sought information from
Hunter Water to show that these are in fact least-cost recycled water schemes and/or a requirement
of their discharge licence.
In response to Aither’s request for further information on its least-cost schemes, Hunter Water
confirmed that is was not proposing any changes to its existing least-cost schemes from the current
period.
‘Higher-cost recycled water’ schemes are required to be ring-fenced from other regulated services for
Hunter Water. This is required to demonstrate that non-recycled water customers are not
unnecessarily funding recycled water schemes.
Aither’s review focuses on these ‘higher-cost recycled water’ schemes, ensuring that forecast
expenditure has been appropriately ring-fenced in line with IPART’s requirements (outlined in Section
7.2.1) and are not being recovered from other customer segments. As shown in Table 53 higher-cost
schemes can be categorised as either mandatory or voluntary and Hunter Water has two schemes
within each category:
• Mandatory recycled water schemes are those in which customers have no effective choice in
opting-out
- Gillieston Heights (supplied from Farley WWTP)
• Chisholm (supplied from Morpeth WWTP) Voluntary recycled water schemes are those in which
customers have choice of opting-in
- Kurri Kurri TAFE
- Vintage Golf Course (supplied from Branxton WWTP)
-

AITHER | Final Report 140
Hunter Water expenditure review
Table 53 Hunter Water’s recycled water schemes
Least-cost recycled water
schemes
Higher-cost recycled water schemes
Voluntary schemes Mandatory schemes
Branxton Golf Course Kurri Kurri TAFE Gillieston Heights
Clarence Town Irrigation
Scheme
Vintage Golf Course (supplied
from Branxton WWTP) Chisholm
Local farmers supplied from
Dungog WWTP, Morpeth
WWTP and Farley WWTP
Karuah Irrigation Scheme
Paxton woodlot
Cessnock Golf Course
Easts Golf Course
Waratah Golf Course
Kurri Kurri Golf Course
Waratah Golf Club
Water Utilities Australia
(supplied from Shortland
WWTP for use in the
Kooragang Industrial Water
Scheme)
Onsite recycling at WWTP for
use by Hunter Water
Indirect agricultural reuse
Source: Hunter Water Pricing Submission: Technical Paper 9, p. 18.
7.2.1. Ring-fencing arrangements
IPART has requirements on pricing arrangements for recycled water and related services64. For
least-cost recycled water schemes the costs and subsequent prices are treated like traditional
services. For recycled water schemes that are not least-cost schemes (therefore higher-cost
schemes), costs are shared on the following basis:
• those that are to be funded through customer and developer charges for water, wastewater
and/or stormwater services and added to the public water utility’s regulatory cost base. These
include avoided and deferred costs, external benefits, and any requirement under a Government
direction
• the remaining costs of the scheme are ring-fenced and recovered in order from:
- external funding sources, including any direct Government subsidies and third-party
contributions
64 Review of pricing arrangements for recycled water and related services – IPART July 2019

AITHER | Final Report 141
Hunter Water expenditure review
- recycled water customer charges, then
- recycled water developer charges
Hunter Water has stated it ring-fences expenditure associated with higher-cost recycled water
schemes from its other regulated services, consistent with IPART’s requirements.65 Hunter Water’s
submission provided an example flow diagram of how Hunter Water has adopted cost ring-fencing for
the Chisholm mandatory scheme within its processes (see Figure 40). In response to Aither’s
requests for further information Hunter Water also provided flow diagrams relating to the ring-fencing
of costs for its other higher-cost schemes:
• Kurri Kurri TAFE scheme (Figure 41)
• Vintage Golf Course (Figure 42)
• Gillieston Heights (Figure 43)
Hunter Water’s flow diagrams help in ensuring expenditure for higher-cost recycled water schemes at
wastewater treatment plants is appropriately classified (ring-fenced) as recycled water and not passed
on to wastewater customers. Hunter Water states:66
These diagrams identify processes and items of equipment that are specifically
involved in supplying recycling water. We separately identify the cost of these ring-
fenced operations - including, routine maintenance, dosing, electricity, equipment
installation, repairs and replacement.
65 Hunter Water Pricing Submission: Technical Paper 9, p.18 66 Ibid, p.18

AITHER | Final Report 142
Hunter Water expenditure review
Source: Hunter Water Pricing Submission: Technical Paper 9, p. 19.
Figure 40 Ring-fencing arrangements for Morpeth WWTP

AITHER | Final Report 143
Hunter Water expenditure review
Source: Hunter Water response to Aither
Figure 41 Ring-fencing arrangements for Kurri WWTP

AITHER | Final Report 144
Hunter Water expenditure review
Source: Hunter Water response to Aither
Figure 42 Ring-fencing arrangements for Branxton WWTP

AITHER | Final Report 145
Hunter Water expenditure review
Source: Hunter Water response to Aither
Figure 43 Ring-fencing arrangements for Farley WWTP
7.2.2. Recycled water expenditure
Hunter Water’s two mandatory schemes, Chisholm and Gillieston Heights, were commissioned during
the current period in 2018-19. Hunter Water states:67
We have applied IPART’s formula to derive a lower bound total scheme cost of $5.5
million for Gillieston Heights and $4.7 million for Thornton North ($2019-20).3 Our
calculation includes all capital expenditure from commencement of the schemes. No
further capital expenditure is forecast during the next price period.
In response to a request for information, Hunter Water confirmed that the direct operating costs and
an allocation of overhead amounts for these mandatory higher-cost schemes is captured in the
appropriate recycled water sections of the AIR.
Aither also requested Hunter Water to explain the reasons for the lower forecast expenditure for its
non-mandatory Vintage Golf Course scheme at Branxton WWTP. Hunter Water’s response noted that
there were direct cost allocations in the current regulatory period for maintenance and laboratory
services which are not forecast to occur in the upcoming regulatory period. Furthermore, changes to
67 Ibid, p.20

AITHER | Final Report 146
Hunter Water expenditure review
indirect cost allocation between the higher-cost recycled water schemes has shifted costs to Gillieston
Heights and Chisholm and away from Vintage.
7.2.3. Aither’s assessment of Hunter Water’s ring-fencing of recycled water costs
Based on Aither’s review of documentation provided and discussions with Hunter Water staff, the
ring-fencing arrangements for higher-cost recycled water schemes appear appropriate and consistent
with IPART’s requirements for these schemes. Hunter Water has not proposed any new capital
expenditure on higher-cost schemes for the upcoming regulatory period nor has it proposed any new
least-cost recycled water schemes.

AITHER | Final Report 147
Hunter Water expenditure review
8. Demand forecasting
8.1. Overview
Reasonable demand forecasts are important for ensuring Hunter Water does not over- or under-
recover its required revenue. Its required revenue is based on the expenditure forecasts presented in
the preceding sections. Revenue and some expenditure items are a function of customer numbers
and climate, and therefore demand forecasts. Revenue is recovered from customers who are charged
for a range of water services. There are three possibilities:
1. Hunter Water underestimates the level of customer demand. The per-unit price is above
the efficient revenue recovery level and therefore Hunter Water over-recovers its revenue.
2. Hunter Water perfectly estimates the level of customer demand. The per-unit price reflects
the efficient revenue recovery level. Hunter Water recovers no more or less than its required
revenue.
3. Hunter Water overestimates the level of customer demand. The per-unit price is below the
efficient revenue recovery level and therefore Hunter Water under-recovers its revenue.
Given the inherent difficulty in forecasting an uncertain future it is unlikely that Hunter Water can
perfectly forecast the level of customer demand over the next five years. The objective is therefore to
produce a forecast that is unbiased in that there is an equal probability of revenue over- or under-
recovery. Should the magnitude of under- or over-recovery become too large, IPART has a demand
adjustment mechanism that it may apply.
In this section, we assess Hunter Water’s approach to forecasting demand. As agreed with IPART,
our review of Hunter Water’s demand forecasting is less detailed than the expenditure review. For
example, we understand that Jacobs has completed an in-depth review of the end-use demand model
as well as a climate correction model that forms the foundation of the demand forecasts.68 Our
assessment has therefore not duplicated this recently completed work (however we have assessed
whether the recommendations made by Jacobs have been implemented). Our focused approach
considers the following:
• Significance: our review focuses on areas of significance – i.e. those material to price changes.
This means that, for example, the approach to forecasting water consumption or billable
connections will be analysed in greater detail than bulk water sales.
• Justification: our review considers the justification for the assumptions made. This involves
assessing the sources, precedent, and appropriateness of input assumptions.
• Bias: in the cases where inherent uncertainties exist, we have assessed Hunter Water’s
approach in the context of potential biases.
68 Peer Review of Hunter Water Demand Model, Phase 1: Demand Tracking Model Review; and Phase 2: Peer Review of iSDP. Jacobs. 15 July 2019

AITHER | Final Report 148
Hunter Water expenditure review
8.2. Overview of forecasting approach
This subsection provides an overview of the demand forecasting approach adopted by Hunter Water,
as well as a high-level summary of the Jacob’s peer review.
8.2.1. Integrated Supply-Demand Planning (iSDP) Model
The iSDP model is an end-use forecasting model that establishes a bottom-up estimate of residential
and non-residential use. The difference between the metered supply and estimated end-use supply
equates to garden use for residential and non-revenue water for non-residential (i.e. the remainder is
estimated via a bottom-down approach). A conceptual diagram of the model, sourced from Hunter
Water’s Pricing Proposal, is provided in Figure 44.
Source: Hunter Water Technical Paper 7 – Demand for Services
Figure 44 Conceptual diagram of iSDP model
End-use models
The bottom-up elements of the iSDP model are based on a range of end-use sub-models, which are
summarised in Table 54. As a thorough review of the iSDP model is outside the remit of this review
we have not validated the arithmetic accuracy of these sub-models. Ten sub-models are used to
estimate the residual end-use, while five sub-models estimate the non-residential use.
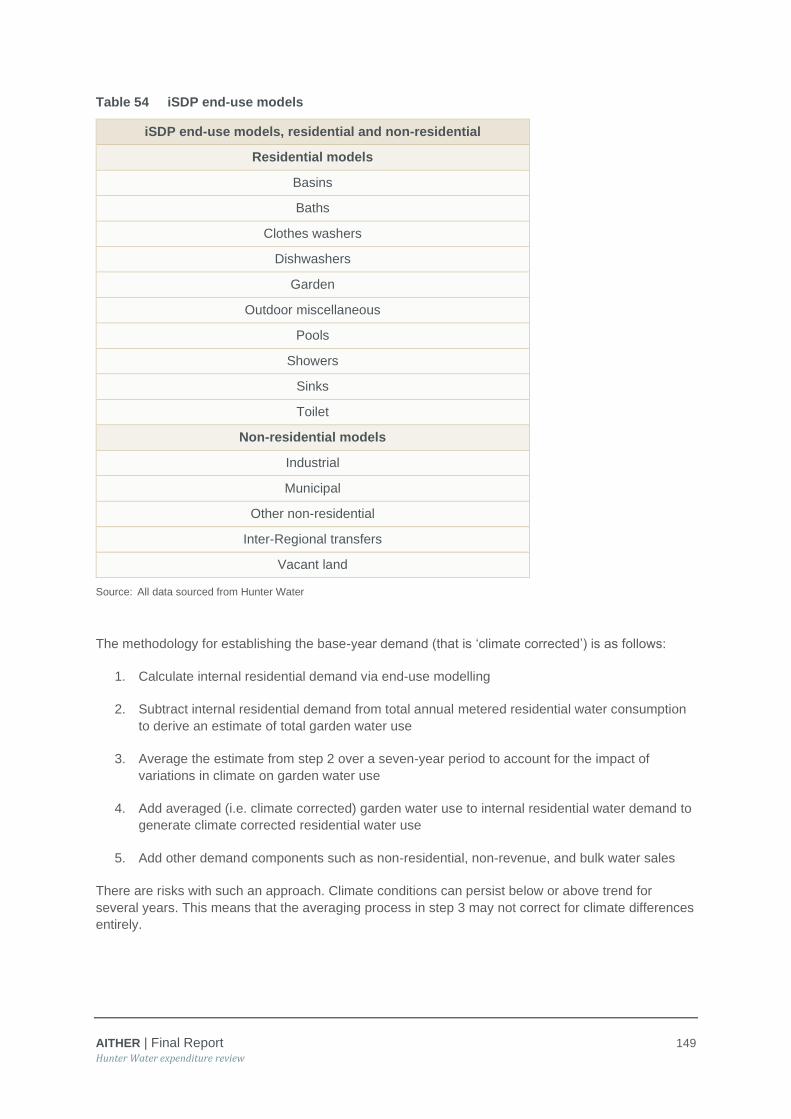
AITHER | Final Report 149
Hunter Water expenditure review
Table 54 iSDP end-use models
iSDP end-use models, residential and non-residential
Residential models
Basins
Baths
Clothes washers
Dishwashers
Garden
Outdoor miscellaneous
Pools
Showers
Sinks
Toilet
Non-residential models
Industrial
Municipal
Other non-residential
Inter-Regional transfers
Vacant land
Source: All data sourced from Hunter Water
The methodology for establishing the base-year demand (that is ‘climate corrected’) is as follows:
1. Calculate internal residential demand via end-use modelling
2. Subtract internal residential demand from total annual metered residential water consumption
to derive an estimate of total garden water use
3. Average the estimate from step 2 over a seven-year period to account for the impact of
variations in climate on garden water use
4. Add averaged (i.e. climate corrected) garden water use to internal residential water demand to
generate climate corrected residential water use
5. Add other demand components such as non-residential, non-revenue, and bulk water sales
There are risks with such an approach. Climate conditions can persist below or above trend for
several years. This means that the averaging process in step 3 may not correct for climate differences
entirely.

AITHER | Final Report 150
Hunter Water expenditure review
IPART has accepted the iSDP demand modelling approach as part of Hunter Water’s 2013
Determination69 and 2016 Determination70. As such, we consider its continued use as appropriate
while noting the risk above. It is still necessary to review the inputs to the iSDP even if the model
framework is accepted. This is particularly so for recycled water when it substitutes for potable water.
8.2.2. Demand Tracking Model (DTM)
The DTM is a model that estimates the relationship between local climatic variables and water
production. The model was created by the NSW Government and has been used by several local
governments since its introduction in 2006.71 The DTM uses a regression equation to model the
relationship between water production (dependent variable) and climatic conditions (independent
variables). The regression coefficients that are generated from the equation represent the
‘relationship’ between the specific climatic inputs and water production. The mean value of the climate
regression is applied to historical climate data set to estimate the average climate corrected demand.
Aither considers the DTM a more robust modelling approach when compared with the basic ‘climate-
correcting’ approach outlined in Section 8.2.1.
Inputs
The model uses daily data from 1970 to 2018 to estimate the regression equation. The model uses
the following climatic inputs:
• Maximum daily temperature
• Daily rainfall
• Daily evaporation
• Daily soil moisture index: this index is generated by a simple, single store conceptual model that
uses rainfall and evaporation inputs. It is used to represent the impact that antecedent soil
moisture can have on demand.
For the dependent variable the model uses the recorded volumes of water produced at water
treatment plants. This historical data is adjusted for changes in use of potable water by major
industrial users (e.g. changed production or recycled water substituting for potable water) as well as
changes in non-revenue water and is denominated on a per capita basis.
Hunter Water modified the regression equation to exclude a specific ‘rainfall’ variable, the impact of
rainfall instead being represented via the soil moisture index. Aither conceptually supports this
modification as the variables in the regression equation are meant to be independent. Using the same
line of reasoning, the ‘evaporation’ variable can also be excluded as it has minimal impact on model
explanatory power.
Results
A summary of the headline regression results is presented in Table 55. The mean hindcast value over
the entire 1970 to 2018 period is 326 L/person/day. When applying the model coefficients to the 2016-
2018 climate period, this average usage falls to 277 L/person/day. The R2 value measures the
69 IPART, Hunter Water Corporation’s water, sewerage, stormwater drainage and other services - Review of prices from 1 July 2013 to 30 June 2017 - Final Report, June 2013, p 88.
70 IPART, Review of prices for Hunter Water Corporation from 1 July 2016 to 30 June 2020 - Final Report, June 2016, p 90.
71 For example, Gosford City, Wong Shire, and Bellingen Shire Councils all cite the model online
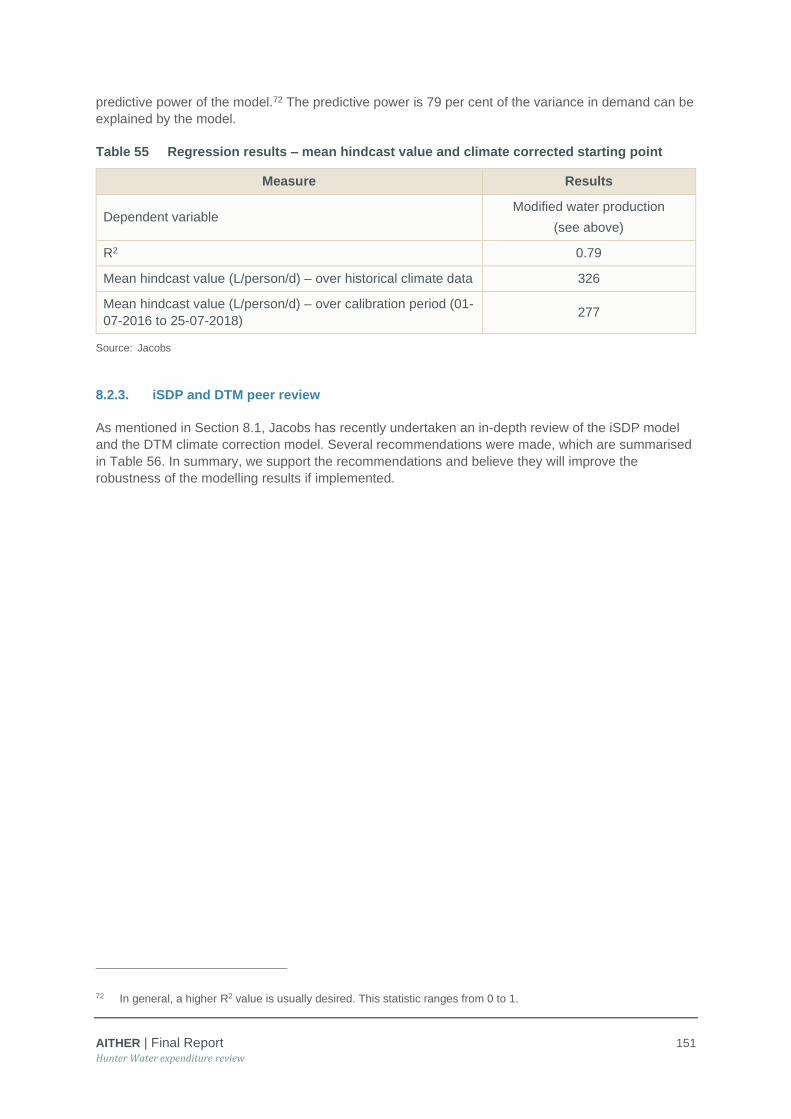
AITHER | Final Report 151
Hunter Water expenditure review
predictive power of the model.72 The predictive power is 79 per cent of the variance in demand can be
explained by the model.
Table 55 Regression results – mean hindcast value and climate corrected starting point
Measure Results
Dependent variable Modified water production
(see above)
R2 0.79
Mean hindcast value (L/person/d) – over historical climate data 326
Mean hindcast value (L/person/d) – over calibration period (01-
07-2016 to 25-07-2018) 277
Source: Jacobs
8.2.3. iSDP and DTM peer review
As mentioned in Section 8.1, Jacobs has recently undertaken an in-depth review of the iSDP model
and the DTM climate correction model. Several recommendations were made, which are summarised
in Table 56. In summary, we support the recommendations and believe they will improve the
robustness of the modelling results if implemented.
72 In general, a higher R2 value is usually desired. This statistic ranges from 0 to 1.

AITHER | Final Report 152
Hunter Water expenditure review
Recommendations
Table 56 Jacobs review of iSDP and DTM – recommendations
# Recommendation Priority Materiality Hunter Water response
Review of iSDP
1
Application of climate
correction to starting year
water demand
Urgent Not given Complete
2
Updated data for uptake
of water-efficient
appliances
Urgent Not given
The iSDP has been updated with updated stock sales and residential end use data.
An end use study is currently being scoped with its findings incorporated for the next major demand
review
3 Average commercial
water use update Urgent Not given
Complete
4 Average industrial water
use update Urgent Not given
Complete
5 Post-2025 population
forecast explanation Urgent Not given
Complete
6 Additional sensitivities Urgent Medium Will be undertaken as part of a broader sensitivity
analysis on option portfolios (2020)
Review of DTM
7
HWC to provide greater
guidance on decision
process to modify daily
water production
High Medium No material impact on the current forecast
8
HWC should document
current understanding of
link between climate data
and daily water demand
Medium Medium No material impact on the current forecast
9
HWC should remove,
where possible, industrial
water use from water
production data
Medium Medium To be included in next major review
10
HWC should strengthen
their understanding
between climate data and
daily water demand
Low Medium This study is currently being scoped by Hunter Water.
To be included in next major review.
11
HWC should consider
sensitivity analysis using
regional models to
account for regional
differences
Low Low To be included in next major review.
Source: Jacobs, Hunter Water
The detailed demand forecasts as presented in Technical Paper 7 do not reflect the
recommendations above (i.e. the recommendations had not been implemented when the forecasts
were prepared). As such, we cannot readily assess the impact of the recommendations with respect
to the effect they may have had on Hunter Water’s submitted forecast. In Hunter Water’s response to
IPART’s Issues Paper, it is stated that all high priority recommendations have been addressed and
reflected in the updated demand forecasts provided. These updated forecasts are presented in
several tables in Aither’s Demand Review (for example, Table 67). Tables that reflect the updated

AITHER | Final Report 153
Hunter Water expenditure review
demand forecasts are noted appropriately. All other tables are based on other data sources such as
the AIR or supplemental datasets which do not reflect the latest demand forecast position. Aither
understands that Hunter Water will submit revised demand forecasts to IPART after Aither’s review of
demand is completed. We recommend that IPART assess the materiality of the recommendations on
an item-by-item basis to identify the drivers of any changes to the demand forecast submitted by
Hunter Water.
8.3. Assessment of forecasting approach
The demand forecasts in Technical Paper 7 were generated using the iSDP. Hunter Water are
proposing a significant change to how they account for climate in their demand forecasting. Both
models are assessed below.
8.3.1. Core iSDP model assessment
Aither considers the iSDP model as an appropriate baseline model for forecasting the demand for
water if all the recommendations made by Jacobs are implemented. However, Aither considers the
DTM climate correction model to represent a more robust approach.
We agree with Jacobs that the use of input data from 2013 and earlier is less than optimal. For
example, the version of the iSDP end-use model provided to Aither includes water efficiency usage
data from 2013 at the latest.73 Sourcing updated appliance inputs is the best solution for improving the
robustness of this aspect of the model. However, Hunter Water’s modelling approach assumes
continued growth in the uptake of efficient appliances (by applying an s-curve that plateaus) which
may improve the accuracy of the model even with dated inputs. Hunter Water has indicated that
appliance inputs have been updated with the most up-to-date water efficiency stock data for NSW.
Aither also has broader concerns in relation to the risks of using both a bottom-up and top-down
approach in estimating residential demand. The residual top-down category (garden use) is the
difference between modelled internal household use and metered supply. This means that any non-
compensating errors in modelling internal household use will impact on estimated garden use.
Current approach compared to DTM approach
The current iSDP climate correction approach is compared to the proposed DTM approach in Figure
45.
73 Specifically, the clothes washers end-use model has ABS data related to the uptake of front-loading washing machines from 2013. The penetration of dishwashers is based on data from Growth from Knowledge (GfK) 2005 (latest).

AITHER | Final Report 154
Hunter Water expenditure review
Source: Hunter Water Application of Climate Correction Report
Figure 45 Annual demand comparison between old (current) methodology and DTM
The black trend line (current methodology) overestimated actual supply prior to 2012 and
underestimated supply from 2016 onwards. In 2018 the difference between the current methodology
and the DTM approach is approximately 1.3 GL. Hunter Water consider some possible explanations
for this difference to be:
• Water Wise rules not achieving the intended savings
• rainwater tanks not achieving the intended savings
• assumptions for internal residential use (based on NSW data) may not match Hunter Region
residents
The final bullet point would be alleviated by the planned Hunter Region end-use survey which is
expected to be complete for the next price review.
Implementation of Jacobs’ peer review recommendations
Some of the tables and figures in this demand review reflect the latest forecasts produced by Hunter
Water and are marked accordingly. These are based on the DTM approach. However, numbers from
Technical Paper 7 are also presented and care should be taken when interpreting our analysis across
the review.
Hunter Water have indicated that all of the high priority recommendations have been addressed and
reflected in the latest demand forecasts.74 These include integrating updated appliance data,
commercial water use, industrial water use, and population growth. We recommend that IPART
74 Review of Prices for hunter Water – Response to IPART Issues Paper, Hunter Water, 21 October 2019.

AITHER | Final Report 155
Hunter Water expenditure review
consider any adjustments to the population growth closely as our analysis indicated a divergence
between Hunter Water’s and the NSW Government forecasts (see 8.4.1).
Two of the six recommendations related to the iSDP model are expected to be addressed in 2020 or
later. These relate to undertaking additional sensitivities on the iSDP model as well as undertaking an
end-use study specifically for the Hunter Region. We agree with Jacobs that additional sensitivities
such as around assuming uptake in multi-dwelling residences, price elasticities, and others would add
value and improve Hunter Water’s understanding of the potential range of demand forecasts.
Similarly, a Hunter Water region end-use model will improve the utility’s understanding of the
propagation of efficient appliances and will lessen the reliance on state-specific sources that are
sometimes dated. We recommend that an end-use study is conducted on a periodic basis to reduce
the reliance on generic data or modelling assumptions.75
8.3.2. DTM assessment
The DTM, Hunter Water’s proposed climate correction model, is assessed below. The DTM uses 40+
years of daily climatic and bulk water data to establish a relationship between climatic variables and
water consumption. In general, Aither is satisfied with the overall theoretical approach of using
historical climate data to establish a ‘climate-neutral’ demand estimate as a basis for forecasting
demand. This has significant benefits relative to using climatic forecasts which may be available, due
to the following reasons:
• Forecast period: the five-year forecast period is significantly longer than the publicly available
Bureau of Meteorology (BoM) climatic forecast data (three-months).
• Geographic coverage: the geographic area covered by the BoM forecasts are broader than the
historic daily data sourced from the Williamtown Node near the Newcastle airport.
• Variables: The BoM forecasts do not include measures such as daily evaporation. This is an
important variable which influences the soil moisture index.
• Significance: Long term climatic forecasts may offer benefits in terms of capturing projected
climate change impacts. The significance of capturing climate change impacts may be muted
given the issues identified above, as well as the short price period in the context of climate
changes.
Model specification and data cleaning
Aither are broadly satisfied with the model specification and consider both the dependent variable and
independent variables to be appropriate for estimating the relationship between climatic variables and
water demand.
Aither also consider Model 2 (namely, the model in which Orica and non-revenue water is excluded
from the measure of water production) as appropriate. The exclusion of non-climate related factors
that significantly influence the dependent variable of the regression equation is a reasonable cleaning
procedure like the removal of outliers. That said, it is important to check how the non-revenue water
(NRW) and Orica forecasts are reincluded in the forecasts of demand. Hunter Water have stated that
both NRW and Orica are added in the annual demand forecast following estimation of climate
corrected demand. The Orica forecast is based on advice from Orica as to their water needs, while
the short-term NRW forecast is based on targets set internally by Hunter Water’s Operations and
75 The modelling approaches in the iSDP model (such as imposing an S-curve uptake in appliances) are beneficial given the relative lack of data, however, an end-use study will improve the basis for these approaches.

AITHER | Final Report 156
Hunter Water expenditure review
Maintenance team.76 As Orica and NRW demand does not correlate with climate, adding these
forecasts onto the climate corrected demand is reasonable.
Calibration period
The model is calibrated to the latest two years to appropriately capture the latest consumer
behaviours. Jacobs tested the sensitivity of water demand to changes in the calibration period, the
results of which are presented below.
Table 57 Calibration period sensitivities
Calibration period R-squared mean hindcast value
(L/person/d)
climate corrected
observed water
production
(L/person/d)
1-07-17 to 25-07-18 0.80 281 279
1-07-16 to 25-07-18 0.79 277 279
1-07-15 to 25-07-18 0.75 274 279
Source: Jacobs
Changes to the calibration period results in non-trivial changes to the mean hindcast value. However,
the implied climate corrected observed water production is essentially static across all sensitivities
chosen. This demonstrates the model produces stable climate corrected results when varying the
calibration period by one and two years.
Aither asked further clarification questions with respect to the robustness of the model to changes in
the calibration period. Specifically, we requested the outputs of the DTM under a longer-term
calibration period. In order to generate these results, it was necessary to include all bulk water
production (that is, including Orica and non-revenue water) which makes direct comparison with the
results above inappropriate.
Table 58 Calibration period sensitivities – all bulk water model
Calibration period R-squared mean hindcast value
(L/person/d)
1-07-16 to 25-07-18 (Model 1) 0.80 327
1-07-09 to 25-07-18 (Model 2) 0.70 337
Source: Hunter Water documentation and RFI response
A graphical display of the mean hindcast value time series under the approximately 2-year and 9-year
calibration period models are presented in Figure 46. Model 2, due to the longer calibration period
capturing periods of higher water consumption (driven by less efficient appliances, regulatory
changes, and price differences), predicts a higher demand over the climatic sequence.
76 Long term NRW forecasts assumes that leak savings will not occur post-2025 and that NRW will increase alongside growth. Aither agree with Jacobs that this approach is reasonable.

AITHER | Final Report 157
Hunter Water expenditure review
Source: Hunter Water RFI response
Figure 46 Mean hindcast value under Model 1 and Model 2 with all bulk water included
As the ultimate purpose of the DTM is to derive a climate adjusted starting demand, it is appropriate
to calibrate the model to the latest two years. This ensures that the model is calibrated to consumer
behaviour under recent factors such as the propagation of efficient appliances, regulatory changes
such as BASIX, and changes in the housing stock. A two-year calibration period also captures
enough climatic variation as required by the NSW Government.77
Model bias
Aither requested scatter plots of actual demand versus modelled demand for the following time
periods:
• Calibration period (1-07-2016 to 25-07-2018)
• End of calibration period to latest date available (Hunter Water provided 26-07-2018 to
31-01-2019)
Bias in the model can be identified by visually inspecting these scatterplots. The scatterplot of an
unbiased model would contain evenly distributed dot-points that follow the trendline without drift.
Figure 47 presents the scatterplot for the calibration period. Aither has highlighted visually where
potential bias may be present. It appears that the climate correction model tends to under-estimate
higher consumption days (i.e. days with greater than 375 litres per person per day). A similar pattern
is seen in Figure 48 which presents an equivalent scatterplot for the July 2018 to January 2019
77 Department of Energy, utilities, and sustainability, New South Wales Government, Water Demand Trend Tracking and Climate Correction 2002

AITHER | Final Report 158
Hunter Water expenditure review
period. Aither suggests that the climate corrected starting point for high consumption periods is likely
to be too low.
Source: Hunter Water RFI response, Aither highlight
Figure 47 Observed and predicted demand across calibration period
Source: Hunter Water RFI response, Aither highlight
Figure 48 Observed and predicted demand across 26-07-2018 to 31-01-2019 period

AITHER | Final Report 159
Hunter Water expenditure review
Predictive power
It is important to ensure the model used to forecast demand has enough predictive power. This will be
influenced by the calibration period chosen (discussed above). Aither issued Hunter Water with
clarification questions regarding the predictive power of the model. Figure 49 presents the observed,
predicted, and climate corrected demand for 2001 to 2018. As expected, and given the calibration
period, the predicted demand tracks observed demand consistently in the most recent years.
Source: Hunter Water RFI response
Figure 49 Observed, predicted, and climate corrected demand, 2001 to 2018
The divergence between predicted demand and observed historic supply from 2001 to 2008 can be
explained by the model being calibrated to current consumer behaviour. Current behaviour will be
influenced by the same factors mentioned with respect to the calibration period, namely changes in
price, regulations, and appliance efficiency.
Aither consider the predictive power of the model to be sufficient given its purpose is to derive a
climate adjusted starting demand. It is therefore appropriate to model this based on current consumer
behaviour.
Jacobs peer review recommendations
Hunter Water have indicated that out of the five recommendations provided by Jacobs:
• two are not relevant to the current demand forecast
• two are consistent with the recommendations under the iSDP paper
• one is being scoped by Hunter Water

AITHER | Final Report 160
Hunter Water expenditure review
Taking these in turn, the recommendations cited as having no material impact on the forecasts
include providing greater guidance on when to modify the dependent variable, and the documentation
of the link between the climate data and daily water demand. The first recommendation is of critical
importance for future reviews, particularly if further modification or cleaning of the daily water
production series is undertaken. However, we understand that in the context of the subsequent price
period this is not relevant. The inclusion of documentation in Hunter Water’s DTM report is also not of
relevance to this demand review.
The recommendations duplicated with the iSDP recommendations have been addressed in the
preceding subsection of this report.
Finally, understanding the relationship between climate data and daily water demand is important. We
agree with Jacobs that underpinning the soil moisture index calibration with an empirical study would
improve the independence of the soil moisture index. However, for the purposes of capturing current
consumer behaviour, calibrating this variable to the most recent years will achieve this goal. A study
into this relationship will provide Hunter Water with greater justification for the proposed approach.
Overall view of the DTM
Aither support the findings of the detailed modelling review team (Jacobs) and emphasise the need to
address all the recommendations made by this team in relation to the DTM. We note that Hunter
Water has addressed a range of these recommendations already and has produced update demand
forecasts in October. Further work is planned to address the outstanding recommendations. We
support the findings that the proposed climate correction model represents an improvement in
robustness compared with the old approach.
8.4. Summary of actual and forecasted demand
In this subsection we have provided a summary of the actual and forecast demand for Hunter Water
services. Firstly, we examine population and dwelling growth. This is followed by a summary of
forecasts associated with the range of water services (potable water, wastewater, bulk water)
provided by Hunter Water. A selection of tables and figures in this section reflect Hunter Water’s
updated demand forecasts as presented in their response to IPART’s Issues Paper. Tables and
graphs reflecting Hunter Water’s updated forecasts are noted where appropriate. In general, Aither
considered the impact of these adjustments to be immaterial.
8.4.1. Population and dwelling growth
Figure 50 presents dwelling forecasts within the iSDP model. In 2018 there were 236,000 dwellings,
80 per cent of which were single dwellings. By 2050, the dwelling count is forecast to increase to
330,000. The proportion of single dwellings is forecasted to fall to 76 per cent.
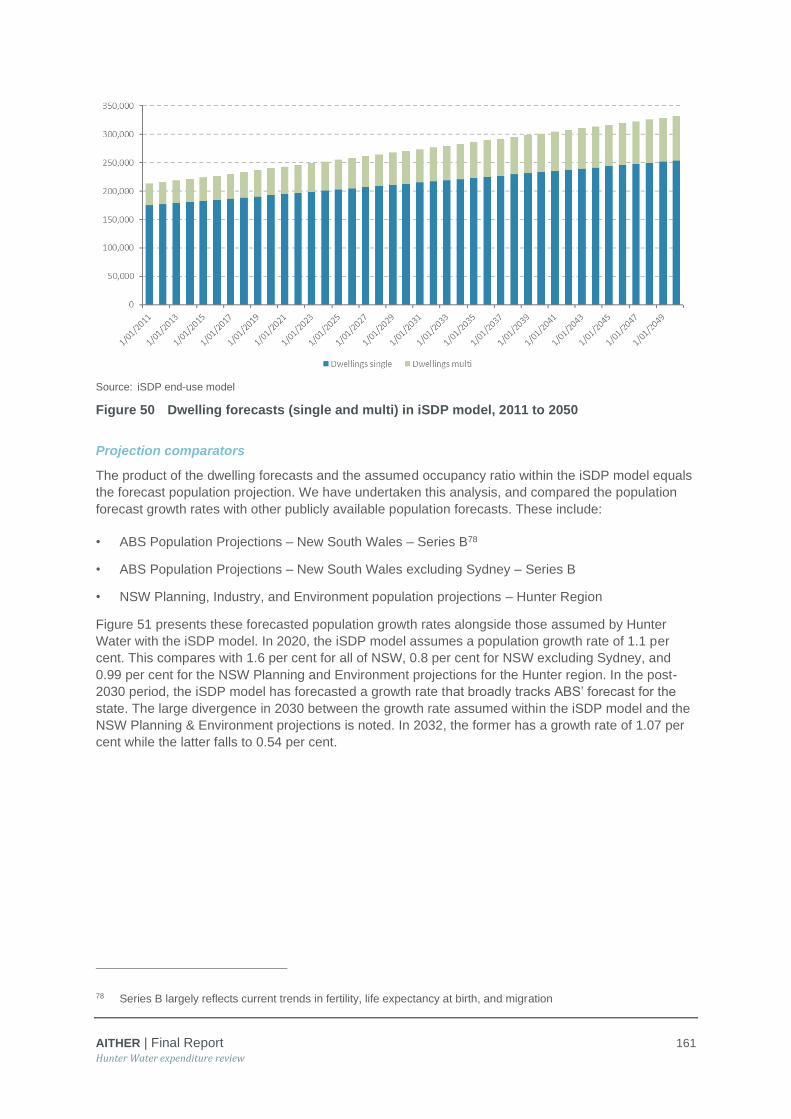
AITHER | Final Report 161
Hunter Water expenditure review
Source: iSDP end-use model
Figure 50 Dwelling forecasts (single and multi) in iSDP model, 2011 to 2050
Projection comparators
The product of the dwelling forecasts and the assumed occupancy ratio within the iSDP model equals
the forecast population projection. We have undertaken this analysis, and compared the population
forecast growth rates with other publicly available population forecasts. These include:
• ABS Population Projections – New South Wales – Series B78
• ABS Population Projections – New South Wales excluding Sydney – Series B
• NSW Planning, Industry, and Environment population projections – Hunter Region
Figure 51 presents these forecasted population growth rates alongside those assumed by Hunter
Water with the iSDP model. In 2020, the iSDP model assumes a population growth rate of 1.1 per
cent. This compares with 1.6 per cent for all of NSW, 0.8 per cent for NSW excluding Sydney, and
0.99 per cent for the NSW Planning and Environment projections for the Hunter region. In the post-
2030 period, the iSDP model has forecasted a growth rate that broadly tracks ABS’ forecast for the
state. The large divergence in 2030 between the growth rate assumed within the iSDP model and the
NSW Planning & Environment projections is noted. In 2032, the former has a growth rate of 1.07 per
cent while the latter falls to 0.54 per cent.
78 Series B largely reflects current trends in fertility, life expectancy at birth, and migration
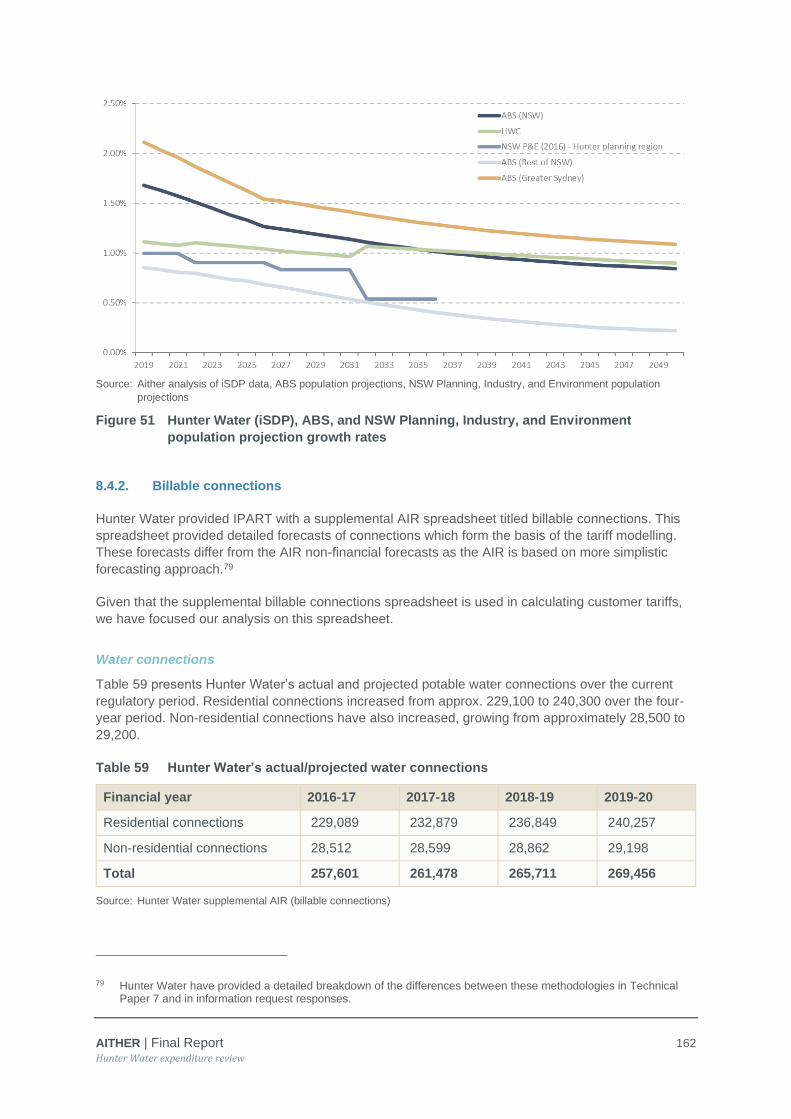
AITHER | Final Report 162
Hunter Water expenditure review
Source: Aither analysis of iSDP data, ABS population projections, NSW Planning, Industry, and Environment population
projections
Figure 51 Hunter Water (iSDP), ABS, and NSW Planning, Industry, and Environment
population projection growth rates
8.4.2. Billable connections
Hunter Water provided IPART with a supplemental AIR spreadsheet titled billable connections. This
spreadsheet provided detailed forecasts of connections which form the basis of the tariff modelling.
These forecasts differ from the AIR non-financial forecasts as the AIR is based on more simplistic
forecasting approach.79
Given that the supplemental billable connections spreadsheet is used in calculating customer tariffs,
we have focused our analysis on this spreadsheet.
Water connections
Table 59 presents Hunter Water’s actual and projected potable water connections over the current
regulatory period. Residential connections increased from approx. 229,100 to 240,300 over the four-
year period. Non-residential connections have also increased, growing from approximately 28,500 to
29,200.
Table 59 Hunter Water’s actual/projected water connections
Financial year 2016-17 2017-18 2018-19 2019-20
Residential connections 229,089 232,879 236,849 240,257
Non-residential connections 28,512 28,599 28,862 29,198
Total 257,601 261,478 265,711 269,456
Source: Hunter Water supplemental AIR (billable connections)
79 Hunter Water have provided a detailed breakdown of the differences between these methodologies in Technical Paper 7 and in information request responses.

AITHER | Final Report 163
Hunter Water expenditure review
Table 60 presents the variation between actual/projected water connections relative to forecast
connections over the current regulatory period. Housing connections were within a percentage point
deviation range from the forecast. In contrast, actual/projected multi-premises residential connections
exceeded forecast levels. In 2019-20 multi-premise water connections are projected to exceed the
forecast level by just under 10%. Actual/projected non-residential connections were less than
forecast. However, multi-premises exceeded forecast levels.
Table 60 Variance of Hunter Water’s actual/projected water connections relative to IPART
2016 Determination (rebased)
Financial year 2016-17 2017-18 2018-19 2019-20
Houses -0.8% -0.7% -0.6% -0.6%
Multi-premises 5.1% 6.8% 8.7% 9.8%
Residential connections 0.2% 0.6% 1.0% 1.3%
20mm -4.2% -5.5% -6.2% -6.4%
Multi-premises 0.1% 1.3% 3.0% 2.8%
25mm and above -5.2% -6.2% -6.7% -6.9%
Non-residential connections -4.8% -5.9% -6.3% -6.5%
Table 61 presents connection data for the next regulatory period. Residential connections are forecast
to grow by approximately 0.93% per annum.80 Non-residential connections are forecast to growth at
0.55% per annum.
Table 61 Hunter Water’s forecast water connections
Financial year 2020-21 2021-22 2022-23 2023-24
Residential connections 243,309 246,360 249,412 252,471
Non-residential connections 29,509 29,782 29,988 30,166
Total 272,818 276,143 279,401 282,637
Source: Hunter Water supplemental AIR (billable connections)
Both actual/projected as well as forecast potable water connections are presented graphically in
Figure 52. A steady increase in both residential and non-residential connections is seen historically
and is forecast to continue.
80 Based on compound annual growth rate

AITHER | Final Report 164
Hunter Water expenditure review
Source: All data sourced from Hunter Water Submission and supplemental data provision
Figure 52 Hunter Water’s actual and forecast water connections
Wastewater connections
Hunter Water’s historic and projected wastewater connection during the current regulatory period is
presented in Table 62. Residential connections grew by 1.1% (compound annual growth rate) across
the period when accounting for projected connections for the 2019-20 financial year. The multi-
premises subcomponent of residential connections grew by 3.4%. Non-residential connections grew
by 1.7% over the period.
Table 62 Hunter Water’s actual/projected wastewater connections
Financial year 2016-17 2017-18 2018-19 2019-20
Residential connections 219,434 222,871 226,542 229,929
Non-residential connections 15,397 15,606 15,919 16,185
Total 234,831 238,477 242,462 246,114
Source: Hunter Water supplemental AIR (billable connections)
Table 63 presents the variation between actual/projected wastewater connections and those forecast
in the current regulatory period. A greater number of residential wastewater connections were
actualised over the period than forecast. In particular, the number of multi-premises connections was
higher than forecast (projections for 2019-20 are 5.2 per cent greater than forecast). In contrast, non-
residential connections have been lower than forecast for this regulatory period. Non-residential
connections have exhibited a -4.3 per cent to -5.2 per cent variation against forecast values across
the period.
-
50,000
100,000
150,000
200,000
250,000
300,000
2016-17 2017-18 2018-19 2019-20 2020-21 2021-22 2022-23 2023-24
Residential connections Non-residential connections
Residential connections (forecast) Non-residential connections (forecast)

AITHER | Final Report 165
Hunter Water expenditure review
Table 63 Variance of Hunter Water’s actual/projected wastewater connections relative to
IPART 2016 Determination (rebased)
Financial year 2016-17 2017-18 2018-19 2019-20
Houses -0.3% 0.5% 0.8% 0.9%
Multi-premises 2.0% 3.0% 4.2% 5.2%
Residential connections 0.1% 0.9% 1.4% 1.8%
20mm -4.8% -6.9% -8.1% -8.3%
Multi-premises -1.0% 15.0% 31.0% 30.6%
25mm and above -4.3% -5.4% -5.9% -6.1%
Non-residential connections -4.3% -4.9% -4.9% -5.2%
Source: Hunter Water supplemental AIR (billable connections), IPART 2016 Determination, Aither analysis
Table 64 presents forecast wastewater connections over the subsequent regulatory period. Marginally
higher residential connection growth is forecast relative to the current regulatory period (1.1 per cent
vs. 1.3 per cent annually). Multi-premise residential connections are forecast to grow by 2.5 per cent
annually. Non-residential connections are forecast to grow by 1.1 per cent annually.
Table 64 Hunter Water’s forecast wastewater connections (count, Meter Equivalent)
Financial year 2020-21 2021-22 2022-23 2023-24 2024-25
Residential connections 232,964 236,042 239,213 242,401 245,520
Non-residential connections 16,432 16,655 16,834 16,993 17,152
Total 249,396 252,697 256,047 259,394 262,672
Source: Hunter Water supplemental AIR (billable connections)
Figure 53 graphically presents actual/projected and forecast wastewater connections.
Source: All data sourced from Hunter Water Submission and supplemental data provision
Figure 53 Hunter Water’s actual and forecast wastewater connections
-
50,000
100,000
150,000
200,000
250,000
300,000
2016-17 2017-18 2018-19 2019-20 2020-21 2021-22 2022-23 2023-24 2024-25
Residential connections Non-residential connections
Residential connections (forecast) Non-residential connections (forecast)

AITHER | Final Report 166
Hunter Water expenditure review
Stormwater drainage customers
Hunter Water’s actual and proposed stormwater connections over the current regulatory period are
presented in Table 65. These are contrasted against the forecast connections that formed part of
IPART’s 2016 Determination.
Table 65 Hunter Water’s actual/projected and forecast stormwater connections
Financial year 2016-17 2017-18 2018-19 2019-20
IPART 2016 Determination
Residential connections 63,642 63,889 64,136 64,383
Non-residential connections 2,992 2,992 2,992 2,992
Total 66,634 66,881 67,128 67,375
Actual/projected
Residential connections 63,912 64,569 65,090 67,541
Non-residential connections 2,950 2,916 2,980 3,042
Total 66,861 67,485 68,070 70,583
Variance
Residential connections 0.4% 1.1% 1.5% 4.9%
Non-residential connections -1.4% -2.5% -0.4% 1.7%
Total 0.3% 0.9% 1.4% 4.8%
Source: Hunter Water supplemental AIR (billable connections)
The increase in actual connections in 2019-20 is due to a data entry error originating in Hunter
Water’s billing system in 2006. This issue was outlined in detail in Hunter Water’s Technical Paper –
Demand for Services. This issue resulted in an additional 2,000 properties being included in this
customer base (comprised of approx. 1,850 residential and 150 non-residential properties). Hunter
Water is undertaking further analysis to ensure this error is addressed correctly, which is expected to
be completed by 30 November 2019.81
The actual/projected and forecast stormwater connections are presented graphically in Figure 54.
Outside of the once-off increase in connections in 2019-20, these are expected to remain relatively
static. Residential connections are forecast to grow from approx. 67,500 in 2019-20 to 69,000 in
2024-25. No growth is forecast for non-residential connections.
81 Review of Prices for Hunter Water - Response to IPART Issues Paper, Hunter Water. 21 October 2019.

AITHER | Final Report 167
Hunter Water expenditure review
Source: All data sourced from Hunter Water Submission and supplemental data provision
Figure 54 Hunter Water’s actual and forecast stormwater connections
8.4.3. Water consumption
This subsection examines potable water consumption in the current and subsequent regulatory
period.
Current regulatory period
Table 66 presents Hunter Water’s actual/projected water sales (ML) in comparison with IPARTs 2016
Determination forecasts. Actual sales were greater than forecast across all years. Hunter Water cite
this as being primarily due to climatic factors (i.e. low levels of rainfall). Actual sales over the entire
period are expected to be 7.5 per cent greater than forecast in 2016.
-
500
1,000
1,500
2,000
2,500
3,000
3,500
-
10,000
20,000
30,000
40,000
50,000
60,000
70,000
80,000
2016-17 2017-18 2018-19 2019-20 2020-21 2021-22 2022-23 2023-24 2024-25
No
n-r
esid
en
tia
l co
nn
etio
ns
Re
sid
en
tia
l co
nn
ectio
ns
Residential connections - LHS Residential connections (forecast) - LHS
Non-residential connections -RHS Non-residential connections (forecast) - RHS
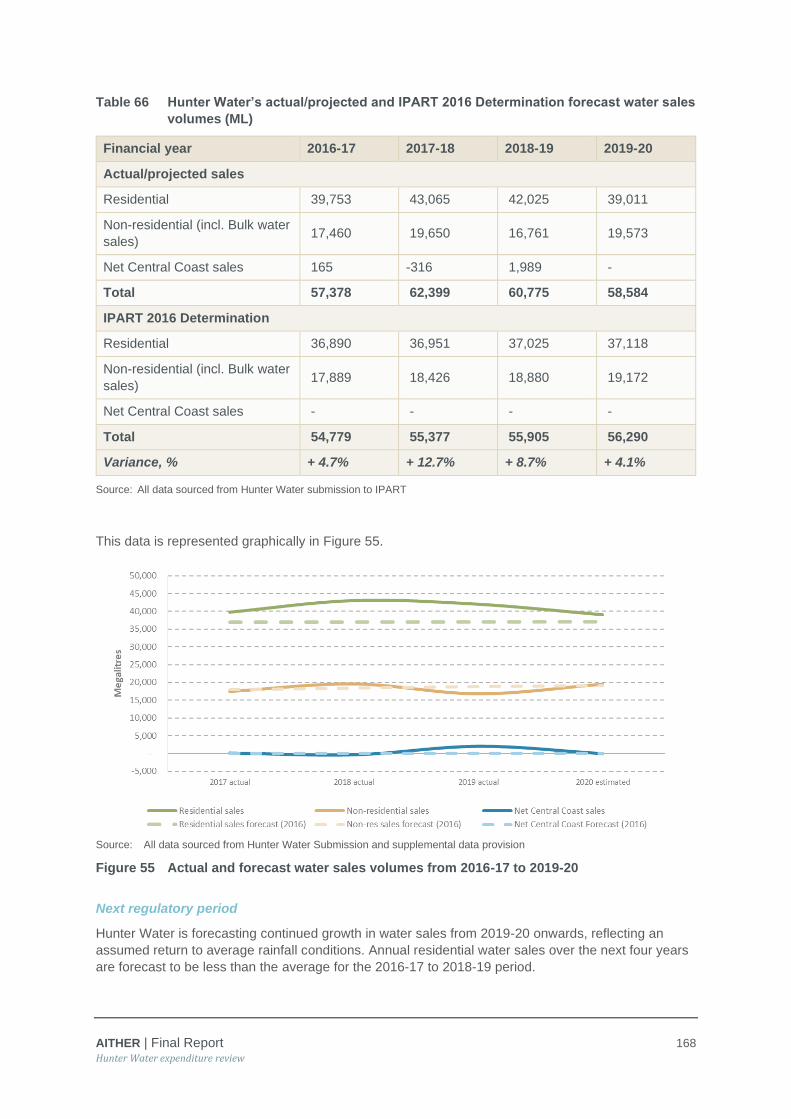
AITHER | Final Report 168
Hunter Water expenditure review
Table 66 Hunter Water’s actual/projected and IPART 2016 Determination forecast water sales
volumes (ML)
Financial year 2016-17 2017-18 2018-19 2019-20
Actual/projected sales
Residential 39,753 43,065 42,025 39,011
Non-residential (incl. Bulk water
sales) 17,460 19,650 16,761 19,573
Net Central Coast sales 165 -316 1,989 -
Total 57,378 62,399 60,775 58,584
IPART 2016 Determination
Residential 36,890 36,951 37,025 37,118
Non-residential (incl. Bulk water
sales) 17,889 18,426 18,880 19,172
Net Central Coast sales - - - -
Total 54,779 55,377 55,905 56,290
Variance, % + 4.7% + 12.7% + 8.7% + 4.1%
Source: All data sourced from Hunter Water submission to IPART
This data is represented graphically in Figure 55.
Source: All data sourced from Hunter Water Submission and supplemental data provision
Figure 55 Actual and forecast water sales volumes from 2016-17 to 2019-20
Next regulatory period
Hunter Water is forecasting continued growth in water sales from 2019-20 onwards, reflecting an
assumed return to average rainfall conditions. Annual residential water sales over the next four years
are forecast to be less than the average for the 2016-17 to 2018-19 period.

AITHER | Final Report 169
Hunter Water expenditure review
Table 67 Hunter Water’s forecast water sales volumes (ML)
Financial year 2020-21 2021-22 2022-23 2023-24 2024-25
Residential 38,855 39,021 39,176 39,344 39,525
Non-residential (incl. Bulk
water sales) 21,520 21,790 21,956 22,201 22,460
Net Central Coast sales - - - - -
Total 60,375 60,811 61,132 61,545 61,985
Source: All data sourced from Hunter Water’s Submissions to IPART.
Note: This data reflects Hunter Water’s updated demand forecasts as presented in Hunter Water’s response to IPART
Issues Paper.
The actual/projected and forecast water consumption is presented graphically in Figure 56.
Source: All data sourced from Hunter Water Submission and supplemental data provision
Note: This data reflects Hunter Water’s updated demand forecasts as presented in Hunter Water’s response to IPART
Issues Paper.
Figure 56 Actual and forecast water sales volumes
Per connection water consumption
We have calculated the per customer water consumption for residential and non-residential sales over
the 2016-17 to 2024-25 period. Residential per customer use has exhibited a downward trend since
2017-18, which is forecast to continue annually across the next regulatory period. Non-residential per
connection consumption is denominated based on meter equivalent connections. Actual non-
residential per customer consumption has fluctuated across the current regulatory period. This is
forecast to vary from 0.73 – 0.79 ML over the next period.

AITHER | Final Report 170
Hunter Water expenditure review
Source: Hunter Water Submission and supplemental data provision, Aither calculations
Note: This data reflects Hunter Water’s updated demand forecasts as presented in Hunter Water’s response to IPART
Issues Paper. Non-residential connection count is on a Meter Equivalent (20mm) basis
Figure 57 Actual and forecast per capita water consumption
8.4.4. Wastewater
Table 68 presents actual/projected wastewater discharge volumes over the current regulatory period.
This fluctuated significantly. However, when comparing across the entire period, actual/projected
exceeded the forecast level by only 2.7 per cent.
Table 68 Hunter Water’s actual/projected and 2016 proposed wastewater discharge volumes
(ML)
Financial year 2016-17 2017-18 2018-19 2019-20
IPART 2016 Determination 5,645 5,620 5,595 5,572
Actual/projected 6,157 6,526 5,296 5,052
Variance, per cent + 9.1% + 16.1% - 5.3% - 9.3%
Source: All data sourced from Hunter Water submission to IPART
Note: This data reflects Hunter Water’s updated demand forecasts as presented in Hunter Water’s response to IPART
Issues Paper.
Wastewater discharge volumes are primarily a function of water sales. Hunter Water has applied the
historic proportion of wastewater discharge volumes to non-residential water sales across the forecast
price period. This results in a slowly growing total discharge amount over the period. Table 69
presents Hunter Water’s forecast volume of chargeable discharge volumes over the next price period.
This represents updated forecast volumes as presented by Hunter Water in the response to IPART’s
Issues Paper. Aither do not consider these changes to have a material impact on our findings.
Table 69 Hunter Water’s forecast wastewater discharge volumes (ML)
Financial year 2020-21 2021-22 2022-23 2023-24 2024-25
Chargeable discharge
volume 6,159 6,232 6,305 6,377 6,449
Source: All data sourced from Hunter Water submissions to IPART

AITHER | Final Report 171
Hunter Water expenditure review
Note: This data reflects Hunter Water’s updated demand forecasts as presented in Hunter Water’s response to IPART
Issues Paper.
Figure 58 presents the historic and forecast wastewater discharge volume. The drop in 2017 is due to
a reduction in non-residential water demand which is correlated with wastewater discharge volumes.
Source: All data sourced from Hunter Water Submission and supplemental data provision
Note: This data reflects Hunter Water’s updated demand forecasts as presented in Hunter Water’s response to IPART
Issues Paper.
Figure 58 Actual and forecast chargeable wastewater volumes

AITHER | Final Report 172
Hunter Water expenditure review
8.4.5. Bulk water
There are two components that make up bulk water sales. These are:
• Wholesale supply of water to private operators
• Interregional water transfers
Private developers in Hunter Water’s jurisdiction are increasingly using private water network
operators. These activities mean that Hunter Water becomes the wholesale supplier of water to these
private operators. This is expected to have minimal impacts on the aggregate demand for water,
however it results in a reclassification of some water sales to bulk water sales rather than retail sales.
Hunter Water indicates that the wholesale water supply forecasts are based on forecasts of private
operators in the region.
The interregional transfer forecasts are based on a combined source model. As this model assumes
average climatic conditions, there is no net bulk transfers over the next pricing period. This means
that any transfers that are made will be reciprocated from the Central Coast and effectively offset.
Hunter Water provided bulk water sales for the current and next regulatory period within the AIR and
SIR. Private, residential, and industrial bulk water sales grew rapidly from 2016-17 to present,
reflecting the growth in private operators in the region. This is forecast to grow at a slower rate over
the next regulatory period. Bulk water sales to Central Coast fluctuated across the period. Net sales of
zero are forecast going forward.
Table 70 Hunter Water’s actual/projected bulk water sales (ML)
Financial year 2016-17 2017-18 2018-19 2019-20
Private, residential and
industrial 19 604 2,022 1,794
Central Coast 165 -316 1,989 -
Total 184 288 4,011 1,794
Source: Hunter Water SIR/AIR
Table 71 Hunter Water’s forecast bulk water sales (ML)
Financial year 2020-21 2021-22 2022-23 2023-24 2024-25
Private, residential and
industrial 1,871 1,948 2,097 2,247 2,396
Central Coast - - - - -
Total 1,871 1,948 2,097 2,247 2,396
Source: Hunter Water SIR/AIR

AITHER | Final Report 173
Hunter Water expenditure review
8.5. Assessment of forecasted demand
8.5.1. Reasonableness of population projections
In the context of this price review, the population projections are reasonable. However, the jump in the
population growth post 2025 is noted (which was also flagged by Jacobs). Hunter Water have
indicated that work is underway in explaining or addressing this apparent contradiction with State
government forecasts. Aither’s review has not assessed their final response in relation to this issue.
We recommend that IPART consider Hunter Water’s response in detail to ensure long-term growth
rates are not overestimated.
Impact of demand projections on expenditure
Demand forecasts impact Hunter Water’s revenue and some operating expenditure items. In
particular, demand forecasts inform operating expenditure associated with the treatment operations
contract (which is examined in detail in section 5.6.3). The operations contract has a variable cost
component that is dependent the number of megalitres treated at Hunter Water’s water treatment
plants. The forecast megalitres of treated water is based on a ten-year historical average with growth
rates applied for water treatment plant in Hunter Water’s asset portfolio. This methodology is
considered by Aither in section 5.6.3. In general, we are satisfied with this approach for reasons of
materiality.
The demand projections will inform future supply augmentations (by inputting to the supply/demand
balance) and therefore capital expenditure. No new capital expenditure for a new water supply source
is required in the next price period.
8.5.2. Reasonableness of billable connection forecasts
Dwelling connections
Aither had concerns that the forecast growth rate in dwellings may underestimate actual connections
given high growth rates in recent years. We issued Hunter Water with a query related to their
assumed slow-down in dwelling connections in the next price period.
Hunter Water have indicated that dwelling approvals are used as a lead indicator for connected
properties in the short term. Table 72 presents the number of dwelling approvals in Hunter Water’s
area of operations alongside the number of new dwelling connections in that year. Comparing
connections with the number approvals the year prior gives an estimate of the realisation rate. The
2016-17 period saw a realisation rate of 95 per cent which was the highest across the seven-year
period. The realisation rate and the number of dwelling approvals fell in the two subsequent years.
Table 72 Dwelling approval, new dwelling connections, and realisation rate, 2012-13 to 2018-
19
Year 2012-13 2013-14 2014-15 2015-16 2016-17 2017-18 2018-19
Dwelling approvals
2,859 3,814 3,718 4,048 4,560 5,382 4,744
New dwelling connections
2,655 2,337 2,719 2,983 3,843 4,104 3,814

AITHER | Final Report 174
Hunter Water expenditure review
Realization rate
82% 71% 80% 95% 90% 71%
Source: Hunter Water query response
Hunter Water also provided these indicators for selected months which implied a continued slow-
down in activity. Technical Paper 7 also states that the development industry indicated they expect a
slow-down in activity due to tighter lending standards, the recent historic decline in approvals, an
increase in time on market for property sales, and increased discounting of property prices by
vendors. We queried Hunter Water as to whether the development industry provided insights as to the
influence of recent changes to monetary policy by the Reserve Bank of Australia (RBA) since the
completion of Technical Paper 7. We are concerned that the recent recovery of house prices in some
areas may spill-over into Hunter Water’s area of operations, as well as the continued reduction in
RBA cash rates providing ongoing buoyancy for the housing market.82
Notwithstanding the final point above, Aither are satisfied that reasonable justification has been
provided for a reduction in the growth rate of connections. The Department of Planning latest data is
from May 2019 and so we cannot assess quantitatively the impact that these monetary policy
changes has had. We recommend that IPART monitor actual connections and dwelling approvals in
the Hunter Region.
Dwelling mix
Aither have not been able to independently cross-check the accuracy of the forecast mix of dwelling
types as no projections are provided by the NSW Government. We have examined the trend in
Hunter Water connections and note the continued growth in the proportion of apartments/flats. Figure
59 presents actual and forecast growth rates by dwelling type. Apartments are forecast to continue to
outgrow houses over the next price period. Aither consider it reasonable to assume that this trend will
continue.
Source: Hunter Water AIR and SIR
Figure 59 Growth rates of dwelling types, actual and forecast
82 Two cash rate reductions of 0.25 per cent have been implemented since the publication of Hunter Water’s Pricing Proposal (RBA website here)
AITHER | Final Report 175
Hunter Water expenditure review
As a final sense-check on the high expected growth in multi-dwelling units we have compared the
proportion of apartments to total customer connections for Sydney Water.83 In 2016, 33% of Sydney
Water’s potable water connections were from shared meter dwellings (i.e. apartments). In contrast, in
2018 about 20% of Hunter Water’s connections were apartments. The fact that the only other
metropolitan utility in NSW had significantly more apartments in relative terms indicates that there is
some growth potential for this dwelling type in Hunter Water’s area of operation.
8.5.3. Reasonableness of water consumption forecasts
Current price period
Hunter Water has indicated that the primary reason for the underestimate of water consumption
across the current price period is the climate (see Section 8.4 for further details). We have tested this
claim by examining the three years 2016-17 to 2018-19 for which there is actual data (see Table 45)
as well the difference between predicted and climate corrected demand produced by the DTM (see
Figure 49). Subtracting the climate corrected demand from the predicted demand should isolate the
impact of climate on demand across these three years. A visual inspection of the graph indicates that
the DTM estimates a cumulative climate impact of approximately 10 GL. In comparison, the
cumulative difference between the IPART 2016 forecast and actual demand is 14 GL. Using this high-
level assessment, climate factors could be explaining about 75% of the difference in demand.84 Aither
consider this an acceptable but not optimal result.85
Per customer consumption
The assumed per customer reduction in water consumption is considered reasonable given:
• The past performance of Hunter Water’s residential customer usage
• The relative usage of Hunter Water’s customer vis-à-vis comparator utilities
• Relative insignificance of real customer price changes
The per customer consumption of Hunter Water’s residential customers has reduced from 0.174
ML/pa in 2016-17 to 0.162 ML/pa in 2019-20. This represents a 2.2 per cent reduction per annum.
However, it should be note that this measure fluctuated between these two years, exhibiting upward
and downward swings. Over the forecast period (2020-21 to 2024-25), the annual reduction in water
consumption per customer is 1.0 per cent per annum.
Hunter Water’s relative performance in terms of average residential water supplied suggests that
continued reductions in this measure are possible. According to the Department of Primary Industries
data86, Hunter Water performs relatively strongly when compared against all local water utilities in
NSW (ranked 25th out of eighty-three LWUs). However, the results are less favourable relative to
other coastal LWUs which will likely better capture factors such as climate equivalently. In this cohort,
Hunter Water are ranked 18th out of 28 LWUs. This implies there may be potential capacity to further
reduce per capita consumption.
83 Review of prices for Sydney Water Corporation, 1 July 2016 to 30 June 2020 84 There are some potential reasons for the difference. One difference is that Figure 49 captures total water supply
which includes leaks. It is noted that Hunter Water experienced levels of real losses/leaks in 2016-18 (row 357 of AIR ‘Non-financial’ tab) compared to long-run averages.
85 The similarly in this high-level result and the DTM regression models R-squared (79 per cent) is noted. R-squared measures how much variance in the dependent variable a model can explain.
86 NSW Water Supply and Sewerage Performance Monitoring Report for 2015/16
AITHER | Final Report 176
Hunter Water expenditure review
Given the reasons above, Aither are satisfied that the assumed reduction in per customer
consumption is reasonable for the next price period. IPART should continue to monitor actual
performance in this area. There may also be potential benefits of retaining the demand volatility
adjustment mechanism as a means of customer-risk mitigation.
8.5.4. Reasonableness of bulk water sales forecast
We are broadly satisfied that the assumed bulk water sales forecast presented by Hunter Water
represents a reasonable estimate for the next pricing period.
Two forecast methodologies are used. Firstly, a forecast of private operators in the region is used to
forecast wholesale water supply. This is assumed to grow by approximately 6.3 per cent annually.
Secondly, an interregional model is used to estimate water provision to Central Coast. This model has
estimated zero net transfers over the period as the model assumes average climatic conditions.
Assuming average climatic conditions is appropriate given the five-year forecasting pricing period.
Given the relatively low significance of this measure, which is underlined by the minimal impact that
bulk water sales has on aggregate water demand, the two forecasting approaches are considered
acceptable.

AITHER | Final Report 177
Hunter Water expenditure review
Appendix A: Capital projects detailed review
Capital Project 1 – Chichester Trunk Gravity Main (CTGM)
Replacement
Table 73 Summary of CTGM Replacement
Service Water
Capital project summary
driver/s Existing Mandatory Standards 100%
Project stage Duckenfield to Tarro Section
Table 74 Hunter Water Capex - Actuals (2016-20) and proposed (2021-25)
Source Capex Budget ($000’s)
2016 2017 2018 2019 2020 2021 2022 2023 2024 2025
SIR/AIR
(W146) 0 164 8,591 25,813 6,071 0 0 0 0 0
2016
determination 0 930 1,390 8,060 16,540 0 0 0 0 0
A.1.1. Project description
This project consists of the replacement of an 8km section of the Chichester Trunk Gravity Main, from
Duckenfield to Tarro. The existing main is a 900mm diameter above ground pipe, constructed in
1923, which has had a series of recent failures.
The proposed replacement pipeline will be a 1200mm diameter below-ground pipeline, constructed at
a current forecast cost (June 2019) of $45.2 million. Construction of the new pipeline has
commenced and is planned to be completed over the 2020 financial year. The September 2019 AIR
has provided an allowance of $40.64 million for the works.
A.1.2. Documentation provided
A range of documents was provided and reviewed for this project, comprising business cases, option
development and assessment, economic appraisal and capital expenditure summary information. In
addition, this project was discussed with Hunter Water at a site visit in August 2019.
A.1.3. Project need
The Chichester Trunk Gravity Main (CTGM) is an 85km pipeline conveying water from Chichester
Dam to water supply systems in the Lower Hunter, as well as townships and small supply systems
adjacent to the pipeline route. The CTGM currently supplies approximately 38% of the average
demand within the Hunter Water system. The CTGM consists of a series of sections, including
tunnels, below-ground and above-ground pipeline.

AITHER | Final Report 178
Hunter Water expenditure review
The section of the CTGM proposed for replacement by Hunter Water is 8km in length and was
constructed in 1923, principally as an above-ground pipeline. An asset management report on the
CTGM undertaken in 2015 highlighted the risk of failure arising from the pipeline condition. The
potential impact from such a failure would be a possible prolonged loss of supply to a large portion of
Hunter Water’s water supply customers, as well as potentially exposing Hunter Water staff to safety
risks when undertaking planned or reactive repairs. The likelihood and consequence of the resulting
risk is sufficient to trigger an extreme rating under Hunter Water’s Enterprise Risk Management
(ERM) framework.
A review of Hunter Water’s 2016 Pricing Submission supported expenditure of $26.9 million
($2015/16) for a project with a similar scope to that now proposed to be completed in FY2020.
Subsequent failures in 2017 have emphasised the poor condition of the pipeline, with the resulting
loss of supply to a significant cohort of customers confirming the extent of the potential supply risks
should such a failure occur at a period of peak demand. The EPA has also expressed concern over
the risk of environmental impact arising from uncontrolled discharges to the environment from a pipe
failure in this section.
A.1.4. Options investigated
A business case completed in September 2016 analysed four options, including a sub-option to
increase the size of a replacement pipe from 900mm to 1200mm diameter, the extra capacity from
which would enable a major upgrade to water treatment capacity to be delayed. The analysis
determined the replaced and upsized pipeline as the preferred option, on the basis that it had the
lowest lifecycle (present value) cost and was the only option to address high risks in both the short
and longer-term.
The business case supported proceeding to detail design and procurement, at a total capital cost
estimate of $29.7 million ($2016-17). Following receipt of tenders, all options were reviewed as part of
a Gateway 4 business case in July 2018. A summary of the options analysed as part of the business
case review is shown in Table 75 below.
Table 75 Options analysis for CTGM Duckenfield to Tarro (business case review)
Option
Cost ($ million, $2017/18)
Project
Capex
Project
Opex
Present
value
Option 1 – do nothing (existing operational and maintenance
practices) $6.363 $43.576 $24.733
Option 2 – optimised operational and maintenance practices $46.437 $6.938 $44.507
Option 3 – asset rehabilitation and modified operational and
maintenance strategy $62.788 $11.366 $44.940
Option 4 – asset replacement and modified operational and
maintenance strategy $43.536 $1.929 $44.484
Source: Capital Project Summary (CTGM – Duckenfield to Tarro), Hunter Water 2019
Although it has the lowest lifecycle cost, Option 1 was assessed as having an unacceptable business
risk, associated with:
• significant loss of water supply during peak demand
• WHS risks arising from continued operation and maintenance

AITHER | Final Report 179
Hunter Water expenditure review
• ongoing environmental risks associated with lead joints
• the potential for catastrophic failure arising from a major flood displacing large sections of the
above-ground pipeline.
Of the remaining options, Option 4 was selected as preferred given that it has a comparable
(marginally lower present value) cost and is the only option to significantly address each element of
business risk.
A.1.5. Cost estimate
The business case total capital cost estimate for the project is $43.536 million. Hunter Water has
made an allowance of $40.64 million in the September 2019 AIR. The elements of the capital cost
estimate are summarised in Table 76.
Table 76 Cost estimate comparison
Component Value ($ million)
Design & Development Costs 1.648
Supply & Construct Costs 38.412
Project Management Costs 1.831
Land Matters 0.145
Sub-total 42.036
Risk Allowance 1.500
Total 43.536
Source: CTGM Duckenfield to Tarro Preliminary Business Case – Economic Appraisal Options 1-4, Hunter Water 2019
A.1.6. Procurement
Hunter Water has separated the detailed design and construction tenders for the procurement of the
pipeline replacement. Following completion of detailed design, the tender for construction was
awarded following receipt and assessment of three conforming tenders.
The approach to procurement is appropriate for works of this nature. The project is being delivered in
a timely manner, with completion dates aligning with those set out at the time of the last Price
Determination.
A.1.7. Assessment of efficiency
This project was supported ahead of the current regulatory period and an appropriate allowance
made at that time. A review of the documentation provided by Hunter Water relating to the condition
of the CTGM – and the current service and safety risks – confirms that the issues remain relevant and
there remains a strong case for remedial action.
In the course of progressing its investigations (and following initial business case approval), Hunter
Water has identified and reviewed four reasonable options to address the risk associated with this
section of the CTGM. The breadth of the options considered a reasonable range of feasible
maintenance and renewals approaches, each of which expose the organisation to different levels of

AITHER | Final Report 180
Hunter Water expenditure review
risk. The option evaluation also included consideration of system-wide issues associated with each
option.
Construction tender prices were significantly higher than previous estimates, with capital cost
estimates rising from $29.7 million ($2016-17) to $43.536 million ($2018/19). The drivers of the cost
increase relate to the contractors detailed considerations of ground conditions, access, material costs
and related issues.
Upon receipt of tenders for construction, Hunter Water undertook a business case review to revisit the
assessment of the preferred option. Notwithstanding the increase in estimated capital costs over time,
this confirmed that the preferred option of replacing the CTGM section had a comparable (marginally
lower) lifecycle present value cost to the alternative of continuing to operate and maintain the existing
asset. It also established that it was the only option to substantially mitigate the range of significant
risks identified as triggers for the project.
As part of the business case review, Hunter Water also revisited whether the proposal to increase the
diameter as part of the preferred option remained efficient. Replacing the 8km section with a pipeline
diameter of 1200mm (rather than the existing 900mm) provides greater capacity, which will defer a
future upgrade to the Grahamstown Water Treatment Plant. Assessing the preferred option in the
context of system-wide operational considerations confirmed the economic merit of upsizing the
pipeline section.
More broadly, the project as proposed is considered efficient on the basis that:
• the significant consequences arising from possible failure of the Duckenfield to Tarro section of
the CTGM – combined with the increasing likelihood, given the age of the asset – justify
remedial action to mitigate the risks identified
• the breadth of options identified by Hunter Water are valid, comprehensive and appropriate
• the processes adopted to develop and investigate the project concepts, analyse and assess
options, and inform decision-making, are appropriate
• the approach to procurement, delivery and timing are consistent with good practice.
The actual expenditure in the current regulatory period and forecast expenditure for the forecast
regulatory period, as set out in the September AIR, is therefore considered efficient.

AITHER | Final Report 181
Hunter Water expenditure review
A.1.8. Recommended expenditure
It is recommended that the funds proposed by Hunter Water for this project be supported by IPART.
Table 77 Aither’s' recommended Capex for the upcoming determination period
Source
Capex Budget (000’s, 2019-20)
2016 2017 2018 2019 2020 2021 2022 2023 2024 2025
Hunter Water’s
submission 0 164 8,591 25,813 6,071 0 0 0 0 0
Aither’s
adjustment of
submission
- - - - - - - - - -
Aither
recommendation 0 164 8,591 25,813 6,071 0 0 0 0 0

AITHER | Final Report 182
Hunter Water expenditure review
Capital Project 2 – Dungog Water Treatment Plant Upgrades
Table 78 Summary of Dungog Water Treatment Plant Upgrade
Service Water
Capital project summary
driver/s Asset & Service Reliability 30%, Existing Mandatory Standards 70%
Project stage In construction
Table 79 Hunter Water Capex - Actuals (2016-19) and proposed (2019-25)
Source Capex Budget ($000’s)
2016 2017 2018 2019 2020 2021 2022 2023 2024 2025
SIR/AIR
(W172) 0 11 798 7,139 3,593 0 0 0 0 0
A.2.1. Project description
The Dungog Water Treatment Plant (WTP) upgrade is comprised of three separate projects being
delivered under a combined program of works. The three components are briefly described as
follows:
• Filter to waste capability: this involves the installation of a system to extract filtered waste from
each of the plant’s filters, to better control filtered water quality in the event of a failure. This will
achieve a reduction in pathogen health risks to levels consistent with the Australian Drinking
Water Guidelines, at a forecast capital cost $2.4 million ($2016/17).
• Chemical containment: upgrade and replacement of various components of the chemical
storage and dosing system to address EPA mandated requirements, improve the reliability of the
dosing system and reduce water quality failure events, at a forecast capital cost of $6.1 million
($2016/17).
• Switchboard replacement: to replace ageing electrical equipment that does not comply with
current regulations, at a forecast capital cost of $3.0 million ($2017/18).
A.2.2. Documentation
Documents provided and reviewed relating to this project included project business cases,
investigation and option assessment reports, cost estimates and related expenditure proposals and
reviews. In addition, this project was discussed at a site visit at Hunter Water’s office in August 2019.
A.2.3. Project need
Water treated at and supplied from the Dungog WTP meets 40 per cent of total demand across
Hunter Water’s network. It treats water sourced from a catchment with significant water quality
challenges, which are caused by land use in the area, steep topography, and the fact that the “run of
river” storage must at times harvest water following heavy rainfall that results in high turbidity. These
catchment attributes mean that the water quality entering the Dungog WTP can be variable and
sometimes more difficult to treat.

AITHER | Final Report 183
Hunter Water expenditure review
Hunter Water identified the risk of failing to meet water quality requirements when working in
consultation with NSW Health in 2014. This led to the addition of the Filter to Waste Capability project
to the 2016 Pricing Submission, with an allowance of $1.64 million ($2015/16) made for these works
in the 2016 Determination. Following further investigation, testing and options review, the estimated
cost of works to adequately meet the requirements of the Australian Drinking Water Guidelines has
subsequently increased to $2.4 million.
In the course of asset management and improvement planning for Dungog WTP, unacceptable
health, safety and environmental risks arising from the chemical facilities were also identified. This
risk has manifested as a failure of the chemical containment systems, resulting in discharges to the
environment and subsequent prosecution by, and fines issued from, the EPA. Concept development
for remediation works to address EPA’s ongoing concerns also established the opportunity to improve
system performance, which would enhance water quality treatment.
Investigations during concept development of the projects to address both the filter to waste capability
and chemical containment also assessed the need to provide associated switchgear and wiring.
These reviews, in combination with asset condition surveys, determined that the existing switchboard
did not meet current standards. The age of the wiring and switches was identified as leading to an
increasing lack of reliability and, in some cases, excessive maintenance. The state of the switchboard
was assessed as contributing to an elevated risk for Hunter Water that required remedial action.
A.2.4. Options investigated
Studies to investigate and assess options for each of the three separate project components were
undertaken. Summaries of the options identified and considered in each case are provided in Table
80, Table 81 and Table 83 respectively. It is noted that a ‘do nothing’ (or business as usual) option –
with no associated expenditure – was also included for each project.
Table 80 Options analysis for filter to waste capability project
Option
Cost ($ million, $2016/17)
Capex Opex
(20-year total) Present value
Option 1 – Combined filter to waste $1.8 $0.05 $1.5
Option 2 – Individual filter to waste $2.4 $0.1 $2.1
Option 3 – Add solids separation process $39 $34 $43
Note: Present values are based on an analysis period of 25 years and a discount rate of 7 per cent.
The preferred option for this project was identified as Option 2, which was the lowest cost option to
address both water quality and environmental non-compliance issues. Although Option 1 has a lower
cost (and was the basis for the works proposed in the 2016 Pricing Submission), further investigation
established that this approach would not have fully addressed the treatment deficiencies. Of the
remaining options that would effectively address the problem, Option 2 does so at a much lower cost
than Option 3 and was therefore preferred.

AITHER | Final Report 184
Hunter Water expenditure review
Table 81 Options analysis for chemical containment upgrade
Option
Cost ($ million, $2016/17)
Capex Opex
(20-year total) Present value
Option 1 – Replace but retain existing
configuration $4.40 -$0.40 $3.64
Option 2 – Upgrade chemical systems $6.00 -$0.29 $5.16
Option 3 – Upgrade chemical systems with
additional water quality improvements $6.13 -$0.59 $5.18
Note: Present values are based on an analysis period of 25 years and a discount rate of 7 per cent.
Option 1 was not preferred because it was deemed to have residual safety and environmental risk
issues, with no water quality performance improvements. Of the remaining options, Option 3 was
preferred on the basis that it not only provided comprehensive compliance with environmental and
OH&S requirements, but also opportunistically improved water quality treatment performance. The
additional benefits arising from the water quality improvements of Option 3 were considered to deliver
greater value given that the present value of total costs was only marginally higher than Option 2.
Table 82 Options analysis for switchboard replacement
Option Original business case estimate
($ million, $2017/18)
Option 1 – replace switchboard in new switchroom $2.94
Option 2 – refurbish existing switchroom N/A
Option 3 – decommission site N/A
Of the options identified for the upgrade of the switchboard, only replacement (Option 1) was
considered a feasible means of meeting all current Australian Standards. Given the critical importance
of the Dungog WTP to Hunter Water’s ability to maintain water supply, decommissioning the plant
(Option 3) is not feasible, while the option to refurbish the existing switchroom (Option 2) is not
practically possible whilst keeping the plant in operation. Similarly, a ‘do nothing’ option would
undermine the ability to deliver the other upgrades at the WTP while meeting relevant Australian
Standards. This would further increase Hunter Water’s risk in relation to the plant, adding contractor
legal exposure to the underlying performance risks.
A.2.5. Cost estimate
An allowance of $12.348 million was made in the AIR at the time of preparation of Hunter Water’s
Pricing Submission. A revised capital works budget of $13.785 million was approved in February
2019, as summarised in Table 83.
Table 83 Cost estimate comparison
Component Value ($ million)
Design 0.461
Preliminary Works 0.655
Contract Amount 10.017

AITHER | Final Report 185
Hunter Water expenditure review
Component Value ($ million)
Project Management 1.267
Sub-total
Contingency 1.375
Total 13.785
Source: Table 4 Capital funding Request Dungog WTP upgrade, 25 February 2019
An allowance in the September AIR of $11.540 million has been made in the 2016-2020
determination period.
A.2.6. Procurement
Following a major review of delivery options (including detailed supply requirements and a market
assessment) a decision was made to complete all three projects at the same time under the
management of a single contractor.
Works are being undertaken as a major design construct contract, which is consistent with industry
practice.
A.2.7. Assessment of efficiency
The Dungog WTP is of critical importance in ensuring Hunter Water can reliably supply water to meet
demand across its network. The separate projects proposed under an upgrade to the Dungog WTP
respond directly to water quality, environmental, and health and safety concerns:
• the filter to waste capability addresses the Department of Health’s clear concerns about water
quality performance, as well as EPA concerns about intermittent waste discharges, which were
sufficient drivers to previously include the works as part of the 2016 Pricing Submission
• chemical containment upgrade works are required to address a direction from the EPA (including
in response to prosecution and fines)
• the electrical switchboard replacement is required to enable the installation of switchgear
associated with the other components of the upgrade, both to address concerns about existing
asset condition and to mitigate further risk.
Given the ongoing concern about water quality performance, as well as the focus of the EPA on
adequate chemical containment, the upgrade works proposed are justifiable. The corrective action to
replace the existing switchboard at the same time is necessary to facilitate the filter to waste and
chemical containment works.
Similarly, the preferred option for each component of the Dungog WTP upgrade works is considered
appropriate:
• the option to deliver individual filter to waste works is identified as the lowest cost alternative to
addressing both water quality and environmental non-compliance issues
• the approach to the chemical systems upgrade achieves comprehensive compliance with
environmental and health and safety requirements, but also additional benefits of improved water
quality performance that are not delivered by the alternative, at only marginally higher cost
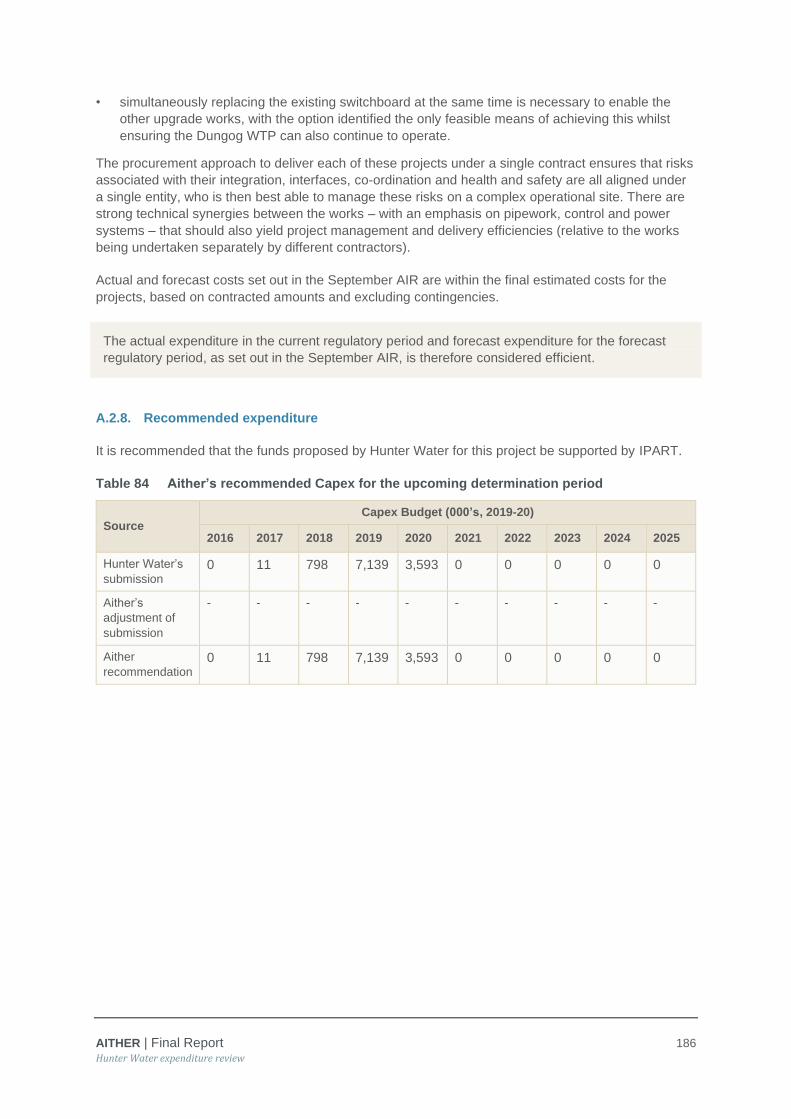
AITHER | Final Report 186
Hunter Water expenditure review
• simultaneously replacing the existing switchboard at the same time is necessary to enable the
other upgrade works, with the option identified the only feasible means of achieving this whilst
ensuring the Dungog WTP can also continue to operate.
The procurement approach to deliver each of these projects under a single contract ensures that risks
associated with their integration, interfaces, co-ordination and health and safety are all aligned under
a single entity, who is then best able to manage these risks on a complex operational site. There are
strong technical synergies between the works – with an emphasis on pipework, control and power
systems – that should also yield project management and delivery efficiencies (relative to the works
being undertaken separately by different contractors).
Actual and forecast costs set out in the September AIR are within the final estimated costs for the
projects, based on contracted amounts and excluding contingencies.
The actual expenditure in the current regulatory period and forecast expenditure for the forecast
regulatory period, as set out in the September AIR, is therefore considered efficient.
A.2.8. Recommended expenditure
It is recommended that the funds proposed by Hunter Water for this project be supported by IPART.
Table 84 Aither’s recommended Capex for the upcoming determination period
Source Capex Budget (000’s, 2019-20)
2016 2017 2018 2019 2020 2021 2022 2023 2024 2025
Hunter Water’s
submission 0 11 798 7,139 3,593 0 0 0 0 0
Aither’s
adjustment of
submission
- - - - - - - - - -
Aither
recommendation 0 11 798 7,139 3,593 0 0 0 0 0
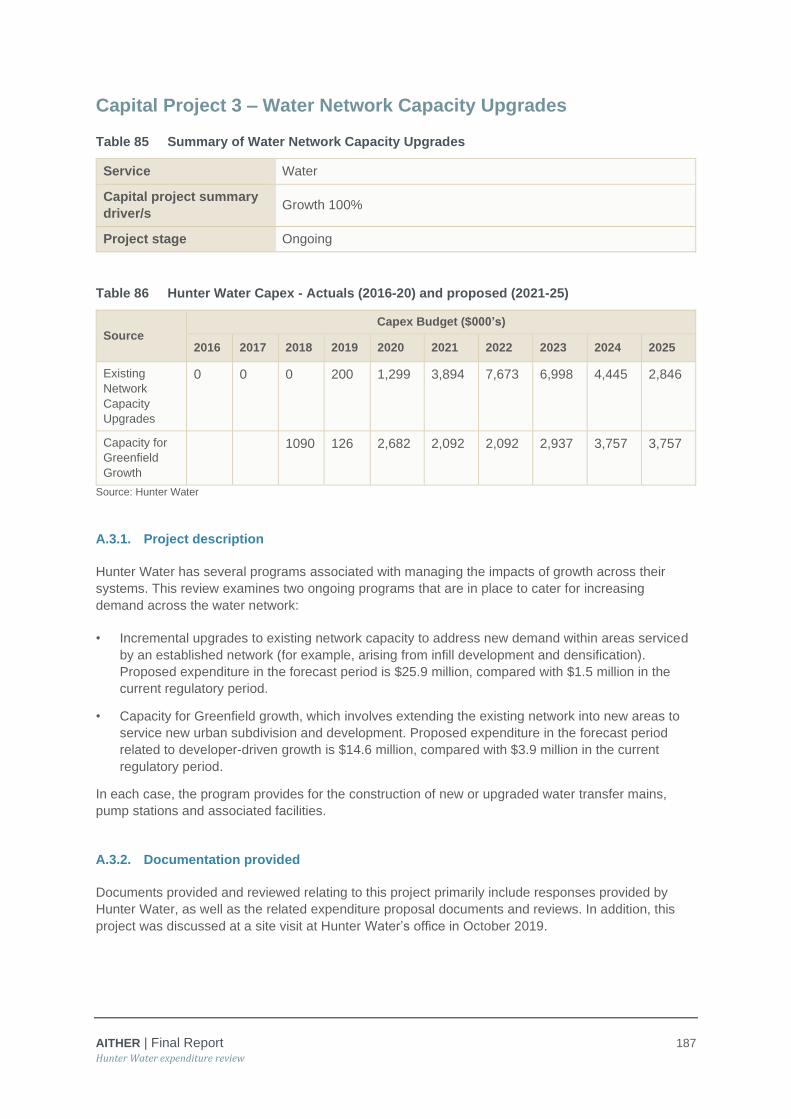
AITHER | Final Report 187
Hunter Water expenditure review
Capital Project 3 – Water Network Capacity Upgrades
Table 85 Summary of Water Network Capacity Upgrades
Service Water
Capital project summary
driver/s Growth 100%
Project stage Ongoing
Table 86 Hunter Water Capex - Actuals (2016-20) and proposed (2021-25)
Source
Capex Budget ($000’s)
2016 2017 2018 2019 2020 2021 2022 2023 2024 2025
Existing
Network
Capacity
Upgrades
0 0 0 200 1,299 3,894 7,673 6,998 4,445 2,846
Capacity for
Greenfield
Growth
1090 126 2,682 2,092 2,092 2,937 3,757 3,757
Source: Hunter Water
A.3.1. Project description
Hunter Water has several programs associated with managing the impacts of growth across their
systems. This review examines two ongoing programs that are in place to cater for increasing
demand across the water network:
• Incremental upgrades to existing network capacity to address new demand within areas serviced
by an established network (for example, arising from infill development and densification).
Proposed expenditure in the forecast period is $25.9 million, compared with $1.5 million in the
current regulatory period.
• Capacity for Greenfield growth, which involves extending the existing network into new areas to
service new urban subdivision and development. Proposed expenditure in the forecast period
related to developer-driven growth is $14.6 million, compared with $3.9 million in the current
regulatory period.
In each case, the program provides for the construction of new or upgraded water transfer mains,
pump stations and associated facilities.
A.3.2. Documentation provided
Documents provided and reviewed relating to this project primarily include responses provided by
Hunter Water, as well as the related expenditure proposal documents and reviews. In addition, this
project was discussed at a site visit at Hunter Water’s office in October 2019.
AITHER | Final Report 188
Hunter Water expenditure review
A.3.3. Project need
During the current regulatory period an average of 3,280 additional dwellings per year have been
connected to Hunter Water’s water supply network. This trend is forecast to continue, albeit at a
slightly reduced rate. Customer connections in the region are forecast to grow by approximately 1%
per year over the forecast regulatory period.
Slightly more than half (55 per cent) of new connections in the current period were associated with
Greenfield development (new sub-divisions beyond and adjacent to existing service areas).
Reticulation in Greenfield developments is mostly funded, built and gifted to Hunter Water by the
developers. To ensure that this reticulation is connected to existing water networks, Hunter Water
funds and constructs transfer mains and pump stations to service – and align with the timing of – new
development.
The remainder of growth (45 per cent in the current period) is associated with development occurring
in established service areas with existing infrastructure. The system is progressively upgraded to
cater for new customers in these areas, as well as to ensure capacity to manage additional demand
as the network expands to service new development. This comprises upgrade or duplication of
existing mains, pump stations and associated facilities, both to service new customers but also to
maintain the pressure and flow requirements for all customers required under Hunter Water’s
operating licence.
Other programs that contribute to maintaining or increasing network capacity include:
• opportunistically increasing capacity when replacing pipes, pumps and associated assets due to
their condition, performance or planned renewal
• provision of step-change capacity in the network, such as major transfer mains or pump stations.
While works such as these contribute to additional capacity and appropriate costs are allocated under
the growth driver, the expenditure also aligns with longer-term growth needs and planning beyond a
five-year period. These components are not part of the funds covered by this project. The focus of
this project – Project 8 Water Network Capacity Upgrade is on the on-going programme that is
triggered by the need to meet the incremental development growth in the forecast period.
A.3.4. Options investigated
Option identification and evaluation occurs as part of the planning stages for specific works. Master
plans are prepared based on long-term forecasts of population growth and urban development, but
the timing, scale and sequence of works must be modified over time to respond to the actual rate and
location of development that occurs, in order to ensure that connection requirements are met and
service standards maintained.
Hunter Water’s approach is consistent with industry practice for servicing new development.
A.3.5. Cost estimate
Hunter Water has made an allowance in the forecast period of $25.9 million for existing network
capacity upgrades and $14.6 million for capacity for Greenfield growth. These estimates include all
design, tendering and construction costs for the works required and are based on recent past cost
outcomes.

AITHER | Final Report 189
Hunter Water expenditure review
A.3.6. Procurement
Procurement involves tendering detail design and construction on the open market for each separable
project.
Since 2017, works within a given Greenfield development have been managed by the first developer
to commence works within that subdivision. Where works are driven by the need to connect
reticulation to Hunter Water’s network, this developer builds assets to Hunter Water’s specifications
and is reimbursed for the cost. Hunter Water manages tendering processes at arm’s length from the
developer, which ensures that the risk of timely delivery rests with the developer. This approach is
widely adopted in the industry and is considered appropriate and the industry standard for works of
this nature.
A.3.7. Assessment of efficiency
A best-practice approach to managing water network capacity upgrades is incremental by nature and
aims to deliver additional capacity with optimal timing. This means ensuring sufficient capacity to
ensure that customer service commitments are not compromised, while avoiding premature
investment that is unnecessary or could be deferred. Aligning capacity upgrade expenditure with
growth should reflect these objectives and is the appropriate means of achieving this balance,
Hunter Water’s approach to procuring works within Greenfield development under developer
management means that the consequences of either premature or delayed investment rest with the
developer. This is consistent with the approach in the industry and aligns with best practice. Similarly,
other aspects of procurement for these programs are consistent with industry standard and
considered efficient.
Based on discussions with Hunter Water, Aither’s understanding is that the approach to planning and
scoping capacity upgrade projects aligns with industry practice. Hunter Water have developed
calibrated hydraulic models that are used to develop master plans as a basis for the expansion and
upgrade of the network. As urban development progresses, or enquiries for major new connections
emerge, Hunter Water is then able to modify the models and plans, forecast any low-pressure service
issues, and scope individual projects to address requirements in line with development construction.
One measure of the effectiveness of Hunter Water’s planning is the number of properties
experiencing low water pressure over time. Figure 60 shows that this has been decreasing, which –
although influenced by other factors such as climate and demand reduction programs – provides
some evidence that Hunter Water’s approach is reasonable.

AITHER | Final Report 190
Hunter Water expenditure review
Source: Hunter Water
Notes: (1) Graph shows the modelled number of properties experiencing less than 20 metres of pressure for a sustained 30-
minute period in a year under normal operating conditions; (2) Hunter Water’s Operating Licence requirement is for no
more than 4800 properties to experience Low Water Pressure
Figure 60 Number of properties experiencing low water pressure
Expenditure on both capacity upgrade programs was surprisingly low in the current period. Actual
expenditure on existing network capacity upgrades was less than 10 per cent of that forecast for the
period, while Greenfield investment was also less than expected. Hunter Water has provided
evidence that there were two significant factors contributing to this reduction:
• a higher proportion of growth than planned eventuating in existing service areas
• customer behaviour that is significantly different to the pre-2016 design standards for peak flows
(which determine assessments of the need for capacity upgrades), such that additional demand
from growth is being accommodated within the spare capacity arising from these outdated
standards.
Hunter Water have stated that there is no “catch-up” provision in the forecast period and customer
needs for pressure and flow are being met. It is therefore considered that expenditure in the
current period has been efficient.
Growth of approximately 3,500 properties per annum is estimated for the forecast regulatory period.
Based on the current trend of 45 per cent of development occurring within existing service areas, this
rate of growth implies an additional 7,900 properties in these areas and a further 9,600 properties in
Greenfield development in the five-year period. The efficiency of each sub-program is considered
below.
Capacity for Greenfield growth
Hunter Water took some time to brief Aither regarding some of the details of new development
forecasting that drives capacity for Greenfield growth (or the Developer Delivered Works Program).
The assumed growth in these areas is based upon “pared down” developer estimates. This is
assumed to mean that Hunter Water has compared historical developer forecasts with actual
development rates and applied these to the current developer estimates to provide a basis for their

AITHER | Final Report 191
Hunter Water expenditure review
forecasts. Confidence in the short-term (up to five years) forecasts is driven by the fact that much of
the developments are already in progress. These estimates are also reconciled with urban planning
growth forecasts including adopting revisions based on the proportion of development occurring in
Greenfield and infill areas.
The unit cost per property for providing water services in Greenfield areas averages $1,500 per
property. The actual unit cost per property will vary with the particulars of location and pressure levels
relative to water source and size and distribution of downstream demand, However as this is
generally comparable with costs in other locations and without having the opportunity to investigate
the veracity of the assumptions underpinning the location and size of forecast growth, the planning
processes appear appropriate and unit servicing costs reasonable. Overall the works and
expenditure forecast for the period seem reasonable.
Existing Network Capacity Program
Hunter Water’s proposed expenditure for the existing network capacity program for the forecast
regulatory period is similar to that forecast in the 2016 Determination. However, actual expenditure
during the current period was substantially less than forecast, primarily because of the spare capacity
that existed in the network.
The spare capacity (and associated reduction in expenditure) is attributed by Hunter Water to a
reduction in peak day demand in the system, which they state has been about 1 per cent per year on
average since 2001. This enabled the existing system to manage demand, irrespective of an
increase in the number of customers, with significantly reduced expenditure in the first four years of
the period.
While customer connections continue to grow at around 1 per cent per year, demand management
efforts mean that total demand is generally remaining static. While the relationship between peak
demand days and average demand is not linear, actual peak demand can be expected to increase at
less than the growth rate. The need to upgrade the system also depends on the location and
concentration of growth. Nevertheless, if peak demand has continued to decrease over time
(indicatively 17 per cent since 2001), a resumption of expenditure at levels previously based on
outdated design standards appears inconsistent with the outcome in the current period, when the
system managed growth of four to five per cent over the period.
There are three specific projects that comprise an estimated cost of $9 million of the $25.9 million
existing network capacity program. The remaining $16.9 million is an allocation for general increases
in system capacity across the network. If this allocation is to serve the 7,900 dwellings expected
across the existing service area, this equates to $2,200 per property. Greenfield projects, on the
other hand, are forecast to service an additional 9,600 properties at $1,500 per property. Hunter
Water noted, however, that growth in dwellings in existing service areas should be able to be
accommodated at a lower marginal (per property) cost than in Greenfield development. However, this
is partially offset by the need to upgrade parts of the existing network to deliver flows to greenfield
development areas.
Without a detailed knowledge of the planned upgrades in the existing area, there is insufficient
evidence to support the level of expenditure proposed. Given spare capacity in the existing system
should still exist and there is no basis for a significantly higher unit cost (relative to Greenfield
development), the allocation should be able to be reduced without impacting the prevalence of low-
pressure issues. In addition, recent experience of changing customer behaviour suggests a potential
opportunity for further savings in the existing network capacity program.
Although most aspects of this program are appropriate and considered efficient, the allocation for
general capacity increase within the existing network appears high and is deemed inefficient.

AITHER | Final Report 192
Hunter Water expenditure review
Based on a unit cost per property that is more appropriate than that adopted, it is recommended
that the allocation for this component of the program be reduced by 40 per cent, or $6.8 million
(and the total program reduced by that amount to $33.7 million).
A.3.8. Recommended expenditure
It is recommended that the funds proposed by Hunter Water for this project be adjusted by
$6.8 million.
Table 87 Aither’s' recommended Capex for the upcoming determination period
Source Capex Budget ($000’s, 2019-20)
2018 2019 2020 2021 2022 2023 2024 2025
Hunter Water’s
submission 1090 326 3,981 5,986 9,765 9,935 8,202 6,603
Aither’s
adjustment of
submission
- - - (1,360) (1,360) (1,360) (1,360) (1,360)
Aither
recommendation 1090 326 3,981 4,626 8,405 8,575 6,842 5,243

AITHER | Final Report 193
Hunter Water expenditure review
Capital Project 4 – Minor Wastewater Asset Renewals Program
Table 88 Summary of Minor Wastewater Asset Renewals Program
Service Wastewater
Capital project summary
driver/s Mandatory Standards / Reliability
Project stage Ongoing
Table 89 Hunter Water Capex - Actuals (2016-20) and proposed (2021-25)
Source
Capex Budget ($000’s)
2016 2017 2018 2019 2020 2021 2022 2023 2024 2025
SIR/AIR 12,452 11,924 1,593 1,877 2,735 17,195 19,256 21,870 25,287 27,029
Note: Projects include S128, S217, S224, S222, S223
A.4.1. Project description
This program comprises renewal expenditure on minor assets in the wastewater capital program. This
includes provision for condition assessment and renewals of the following components of the system:
• civil assets, including planned renewals of non-critical sewer mains, reactive renewals of mains,
and planned and reactive renewals of wastewater structures and fittings
• mechanical and electrical treatment assets
• mechanical and electrical network assets.
A.4.2. Documentation provided
Documents provided and reviewed relating to this project included file notes, program data, and
related expenditure proposals and reviews. In addition, this project was discussed at a site visit at
Hunter Water’s office in August 2019.
A.4.3. Project need
Asset renewals are essential ongoing programs that support of delivery of wastewater services within
the existing network. Hunter Water has proposed major increases across all its minor asset renewal
programs, as shown in Figure 61.

AITHER | Final Report 194
Hunter Water expenditure review
Source: Hunter Water
Figure 61 Past and proposed expenditure for minor renewal program components
Renewal decisions are made during the planning period, based on the frequency of failure events for
non-critical assets, or the timely renewal of critical assets based on condition assessments. This
involves developing forecasts of future performance based on assessment of current condition and
performance.
Civil network program
The principle components of this program are:
1. the wastewater network asset program, consisting of both critical and non-critical mains
renewal and associated activities with total forecast expenditure of $29.007 million (a 145 per
cent increase on actual expenditure in the current period)
2. planned and reactive renewals of fittings forecast at $11.034 million (available data does not
differentiate between the water and sewer program, but there is a small 5 per cent increase
from the current period)
3. wastewater structures, with proposed expenditure of approximately $12.556 million (available
data does not differentiate between the water and sewer program for past programs but there is
an increase of more than 200 per cent from actual expenditure for the total expenditure in the
current period).
Forecasts for each element of the first of these programs can be related to the performance and
condition of the network. Figure 62 shows improving performance (a decreasing rate over time) for
sewer breakages and chokes. However, this is likely to be more of a reflection of the effectiveness of
maintenance programs. A more critical reflection of asset condition is the trend in collapses and
condition assessment (with sewer segments classified as condition 4 or 5 at risk of failure and
requiring immediate renewal). Figure 63 shows the upward trend in actual and forecast sewer main
failures, while Figure 64 illustrates the increasing number of sewer segments being assessed as
condition 4 and 5 in recent years which will drive renewal requirements in the PP2020 period.

AITHER | Final Report 195
Hunter Water expenditure review
Collectively, this data illustrates the general trend in declining performance or condition that Hunter
Water is proposing to address with an increased level of expenditure.
Source: Urban Water National Performance Report, Bureau of Meteorology
Figure 62 Sewer breaks and chokes over time
Source: Hunter Water
Figure 63 Sewer main collapses
0
10
20
30
40
50
60
70
80
2008 2010 2012 2014 2016 2018 2020
Se
we
rma
in C
olla
pse
s (
no
.)

AITHER | Final Report 196
Hunter Water expenditure review
Source: Hunter Water
Figure 64 Number of sewer segments assessed with a condition rating of 4 or 5
Mechanical and electrical treatment and network assets
Approaches to forecasting performance and planned expenditure are similar for each group of assets
in this program and involve consideration of past equipment loads and actual renewal expenditure,
forecasts of future service loads and anticipated performance of recently introduced equipment.
Actual expenditures are based on the need to replace ageing equipment. The decision to replace is
made at the time of inspection during regular maintenance or condition assessment or at the time of
breakdown. The replacement decision is undertaken by reviewing likely maintenance / reinstatement
costs and the assessed future life of the plant.
Systems employed for decision-making by Hunter Water are generally industry standard approaches
for the size of equipment in their asset portfolio. They rely on a mixture of performance measurement
(e.g. hot spot sensors for switchboard and vibration analysis for larger rotating equipment) and more
subjective assessment of remaining life.
To produce a forecast of future needs Hunter Water generally employs a process involving review of
long-term equipment records, analyses past run time records and failure information and uses these
to forecast expected time of renewal. Where historical information is not available forecasts are
based upon current performance trends (e.g. degradation of UV lamps) and published equipment
information. Final forecasts are then developed using an assessment of relative risk.
• the mechanical and electrical network program includes proposed expenditure of $25.625 million
for the forecast period,
• the mechanical and electrical treatment program includes proposed expenditure of $32.288
million for the forecast period.

AITHER | Final Report 197
Hunter Water expenditure review
A.4.4. Options investigated
Hunter Water provided business cases with a number of generic options for each program which vary
from a low risk option to one based on historical renewals forecasts. For example, the mechanical
and electrical treatment renewals program has the following four options costed:
• Option 1 - Do Nothing
• Option 2 - Historical renewals forecast
• Option 3 - Prioritised renewals based on condition assessment
• Option 4 - Full condition assessment
Option three was chosen as the preferred option eliminating all high-risk issues. Option 3 was also a
step back from an extreme risk averse Option 4 approach. The assessment process appears based
on subjective consideration of risk levels associated with different equipment / assets.
A.4.5. Cost estimate
Cost estimates are based on forecast renewals requirements and schedules of rates from current
renewals contracts.
A.4.6. Procurement
Hunter Water has long-term contracts for the civil works in this program, based on a schedule of
rates. The competitive procurement process, combined with the long-term contract period that
enables improving effectiveness on comparable, repeat works, is an efficient approach and consistent
with industry practice. The same approach is also taken for the network aspect of the mechanical and
electrical program.
The treatment aspect of the mechanical and electrical program is undertaken under Hunter Water’s
treatment operations contract. The treatment contractor plays a role in nominating equipment for
renewal, but Hunter Water relies on the advice of its own experienced operators as well as other
independent reviews to verify renewal decisions.
A.4.7. Assessment of efficiency
Civil network program
The figures presented above provide evidence of performance trends that support the proposed
increase in expenditure on mains renewals (relative to the current period). The forecast expenditure is
therefore considered efficient.
Ongoing poor performance in relation to sewer collapses also supports consideration the increased
provision for wastewater mains renewal in the forecast period. While expenditure in the current
period was highest in the earlier years, it has yet to have had an effect in reducing collapses. Given
the 45 per cent increase in expenditure proposed for the forecast period is proportionate to the
observed increase in failure in the current period, the proposed increase in this item appears efficient.
Wastewater structures are usually a minor program, but investment is necessary to ensure public
safety, local integrity of the system and manage inflow and infiltration. The significant increase

AITHER | Final Report 198
Hunter Water expenditure review
proposed for the current period has been discussed in general terms in a combined water and
wastewater business case.
Figure 61 shows that actual expenditure on structures was higher than the allowance made in the
current period and is proposed to increase substantially again in the forecast period. Discussions with
Hunter Water identified some wider concerns relating to inflow and infiltration, but that these were
considered manageable. Likewise, ensuring public safety remains a concern, but without reference to
specific examples or data.
Actual expenditure was a significant increase on the allowance provided for in the 2016
Determination. Hunter Water has provided a mass of detailed reports on condition assessment of
access holes and pumping station civil structures. However, there is no rigorous review that links this
information with an overview of risks to the public or the environment for what has become a
significant program of works.
So, despite the concerns Hunter Water has in relation to inflow and infiltration, and public safety,
insufficient evidence was provided to support a further, substantial increase on expenditure in the
forecast period. It is recommended that the proposed expenditure for the component of the program
be reduced from a total of $12.7 million to $6.7 million, which still represents an almost 100 per cent
increase on expenditure in the current period.
Proposed expenditure for the wastewater structures component of the civil minor wastewater asset
renewal program is considered inefficient. It is recommended that the proposed expenditure for the
forecast period be reduced by $6 million.
Mechanical and electrical treatment and network assets
The approach to forecasting performance of assets of this nature is common and well-established
across the industry. More sophisticated methodologies apply modelling based on data relating to
asset age, historical performance and the use of benchmarked approaches. Hunter Water does not
have the depth of systems (relative to a larger utility) to support this type of analysis, and its approach
considered reasonable for its circumstances.
However, Hunter Water’s approach does rely on risk assessment, which – while appropriate –
involves a subjective assessment. Given that a strong tendency towards more risk averse outcomes
has been observed, this raises the prospect that the proposed expenditure is in part underpinned by
an overly risk averse approach.
Hunter Water did not present data that clearly distinguished the wastewater-related expenditure at the
equipment level on these programs from the water program. Based on combined water and
wastewater programs there appears to be an increase of 27 per cent in the network program and
55 per cent in the treatment program for the forecast period.
A scan of the forecasts for the equipment line items (e.g. pumps, blowers etc.) for the preferred
options, compared with historical expenditure, was undertaken. There are some arguments that
major increases are necessary in some items to cover relatively recently introduced technologies
such as UV equipment, PLCs and diffusers, for example, as a result of the time since their installation.
In all, these arguments would justify an increase of approximately 45 per cent for treatment and
20 per cent in network expenditure. However, no clear failure data, trends in performance or statistical
analysis of forecast lives of equipment were presented that would assist the assessment of these or
other proposed increases.

AITHER | Final Report 199
Hunter Water expenditure review
The adoption of a more reasoned methodology for forecasting than that adopted in the past provides
some confidence in the proposed budget. Consideration has been given to the arguments for
increases in expenditure but also the role of subjective risk assessment has in these programs.
Therefore, based on the assessment of the increased scope for renewals, a reduction of
approximately 10 per cent (to be applied across the “traditional” and recently introduced technologies)
is recommended in both programs to drive further focus by Hunter Water on efficiency reduction on
their expanded program. Given the overall increase in size of the total program this recommended
reduction should be manageable without significant risk.
Although the majority of expenditure for the mechanical and electrical component of the minor
wastewater asset renewals program is considered efficient, it is recommended that proposed
expenditure for the forecast period be reduced by $5.913 million (approximately 10 per cent),
comprising:
• a reduction to $29 million from $32.288 million for the treatment component (a reduction of
$3.229 million)
• a reduction to $23 million from $25.625 million for the network component (a reduction of
$2.563 million)
A.4.9. Recommended expenditure
It is recommended that the funds proposed by Hunter Water for this project be supported by IPART
following the adjustments proposed above.
Table 90 Aither’s' recommended Capex for the upcoming determination period
Source
Capex Budget ($000’s, 2019-20)
2016 2017 2018 2019 2020 2021 2022 2023 2024 2025
Hunter Water’s
submission
12,452 11,924 1,593 1,877 2,735 17,195 19,256 21,870 25,287 27,029
Aither’s
adjustment of
submission
0 0 0 0 0 (2,030) (2,287) (2,338) (2,594) (2,543)
Aither
recommendation 12,452 11,924 1,593 1,877 2,735 15,165 16,970 19,532 22,693 24,487
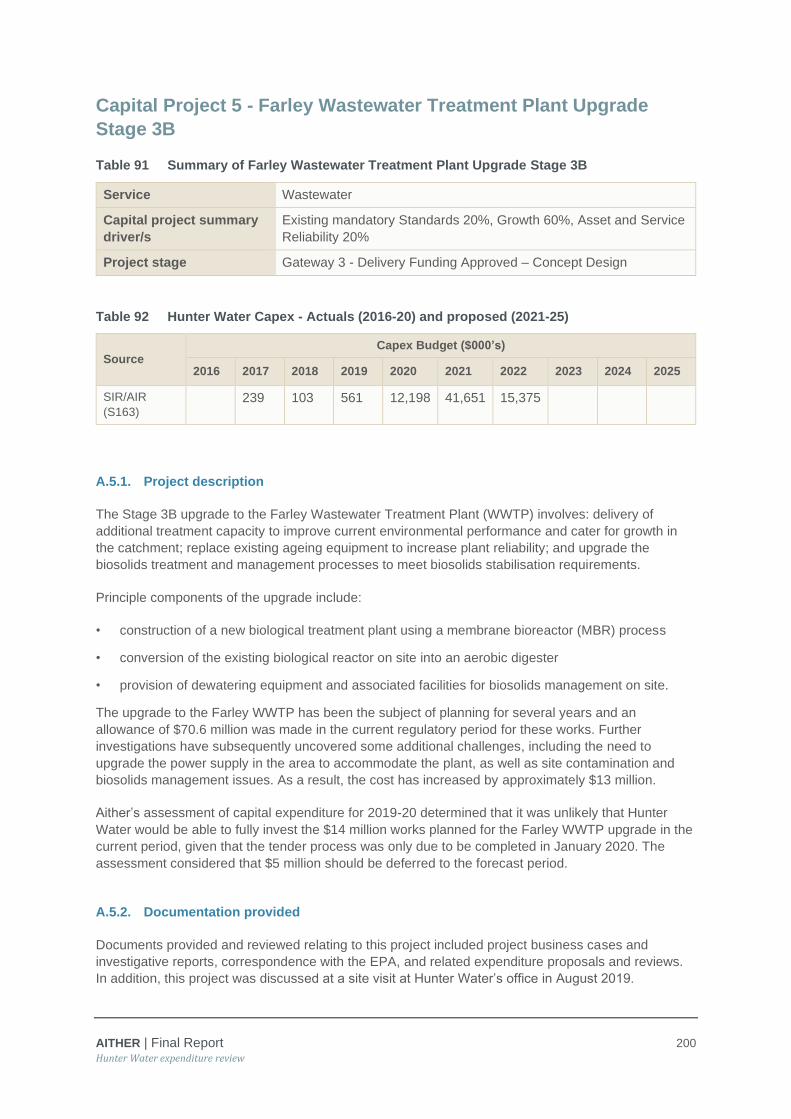
AITHER | Final Report 200
Hunter Water expenditure review
Capital Project 5 - Farley Wastewater Treatment Plant Upgrade
Stage 3B
Table 91 Summary of Farley Wastewater Treatment Plant Upgrade Stage 3B
Service Wastewater
Capital project summary
driver/s
Existing mandatory Standards 20%, Growth 60%, Asset and Service
Reliability 20%
Project stage Gateway 3 - Delivery Funding Approved – Concept Design
Table 92 Hunter Water Capex - Actuals (2016-20) and proposed (2021-25)
Source Capex Budget ($000’s)
2016 2017 2018 2019 2020 2021 2022 2023 2024 2025
SIR/AIR
(S163)
239 103 561 12,198 41,651 15,375
A.5.1. Project description
The Stage 3B upgrade to the Farley Wastewater Treatment Plant (WWTP) involves: delivery of
additional treatment capacity to improve current environmental performance and cater for growth in
the catchment; replace existing ageing equipment to increase plant reliability; and upgrade the
biosolids treatment and management processes to meet biosolids stabilisation requirements.
Principle components of the upgrade include:
• construction of a new biological treatment plant using a membrane bioreactor (MBR) process
• conversion of the existing biological reactor on site into an aerobic digester
• provision of dewatering equipment and associated facilities for biosolids management on site.
The upgrade to the Farley WWTP has been the subject of planning for several years and an
allowance of $70.6 million was made in the current regulatory period for these works. Further
investigations have subsequently uncovered some additional challenges, including the need to
upgrade the power supply in the area to accommodate the plant, as well as site contamination and
biosolids management issues. As a result, the cost has increased by approximately $13 million.
Aither’s assessment of capital expenditure for 2019-20 determined that it was unlikely that Hunter
Water would be able to fully invest the $14 million works planned for the Farley WWTP upgrade in the
current period, given that the tender process was only due to be completed in January 2020. The
assessment considered that $5 million should be deferred to the forecast period.
A.5.2. Documentation provided
Documents provided and reviewed relating to this project included project business cases and
investigative reports, correspondence with the EPA, and related expenditure proposals and reviews.
In addition, this project was discussed at a site visit at Hunter Water’s office in August 2019.

AITHER | Final Report 201
Hunter Water expenditure review
A.5.3. Project need
The Farley WWTP is a key asset servicing a major growth area but is subject to a range of
challenges. The plant services approximately 16,000 properties across a catchment that includes the
area between Rutherford and Lochinvar, which is one of the most rapidly growing urban development
areas in the lower Hunter. Hunter Water forecasts that the growth in flows to the plant will result in
Farley WWTP failing to meet its EPA licence conditions by 2022.
The plant currently does not meet Class B requirements for biosolids treatment. More broadly, the
current approach to managing biosolids is not compliant with regulations, nor a sustainable
environmental or social solution. There are concerns about both the impact of current management
practices on the environment, as well as the prevalence of odours.
Environmental concerns also extend to significant groundwater contamination that is arising from
some of the assets on the Farley WWTP site. While the principle driver for this project is growth in the
catchment, the project need cannot be considered in isolation of the environmental constraints arising
from the sensitive environment in which the plant is located, as well as some major issues with
existing assets on the site.
Growth
High levels of ongoing development within the catchment are forecast to materially increase flows to
the Farley WWTP. Much of the growth anticipated over the next five years is associated with
subdivision development that is already occurring, providing a high degree of certainty that the
increased flows will eventuate as forecast. The new connections in the catchment are anticipated to
increase total flows by approximately 15% by the time the proposed project is complete.
Existing performance and reliability
The performance of the Farley WWTP has been of interest to the EPA, which is symptomatic of the
broader concerns about compliance with environmental and regulatory requirements. An
environmental assessment of Fishery Creek (to which Farley WWTP discharges treated effluent) does
not support any increase in nutrient loads to the creek beyond current limits. This effectively means
that Hunter Water must, over time, manage increasing loads to the plant without exceeding the levels
of nutrient discharge that are currently permitted.
Even with the proposed upgrade, increasing flows to the plant will eventually mean that the nutrient
loads from the treated effluent will exceed the capacity of the receiving waters. This is forecast to
occur by 2026, when another upgrade will be required (which is the subject of a separate project that
has also been reviewed87).
Hunter Water’s historical performance has also triggered concerns for the EPA about effluent
discharges to sensitive environments, which Aither has confirmed in discussion with the EPA. Effluent
quality requirements are yet to be finalised by the EPA, although the EPA has indicated that these will
be a matter of reliability of plant performance. Given the nature of the process upgrade proposed, this
is unlikely to be a major issue.
Existing asset condition is also contributing to environmental concerns, specifically that several major
structures are leaking into, and contaminating, the groundwater in the area. There is also evidence of
the presence of toxic PFAS materials, which have been linked to the site.
87 See project review of ‘Other Wastewater Treatment Plant Upgrades’, which incorporates the project entitled ‘Farley WWTP effluent pumping & pipeline to Hunter River’.

AITHER | Final Report 202
Hunter Water expenditure review
The management of biosolids at the plant does not currently meet the requirements specified by
relevant guidelines. The EPA has expressed uncertainty about Hunter Water’s business-wide
biosolids strategy more broadly, but regardless this is not expected to be in place until 2026 and
therefore will not address the immediate issues at the Farley WWTP. It is also possible that aspects of
the proposed solution at the site are inconsistent with the broader biosolids strategy.
Assessment of project need
Notwithstanding the potential opportunity to delay the project if demand reduction efforts are
successful and material, and the lack of clarity about a business-wide biosolids management
strategy, there remain some compelling reasons for the project to proceed on its proposed
timeframe:
• any variations from forecast demand that help delay the capacity upgrade is highly uncertain,
particularly in comparison to the increase in flows that will arise from development that is already
occurring
• the emerging issue of groundwater contamination requires a prompt response
• the issues with biosolids management are immediate and cannot wait for a business-wide
strategy
• the EPA has a high degree of interest in, and concern relating to, this plant.
Given these drivers, it is considered appropriate that the project proceed at this time.
A.5.4. Options investigated
Several discharge options were reviewed ahead of the 2016 Pricing Submission. The preferred option
to continue to discharge treated effluent to the local waterway was the basis of the submission and
supported in the 2016 Price Determination. The options considered were:
• Option 0 – do nothing
• Option 1 – treat and discharge effluent to Fishery Creek, and also to the Hunter River in the future
• Option 2 – agricultural reuse scheme
• Option 3 – transfer excess effluent to the Hunter River
The preferred option (Option 1) was selected on the basis that it had a lower cost, similar risk and
similar qualitative assessment to Option 3, while Options 0 and 2, respectively, failed to address the
problem and had a much higher cost.
Notwithstanding the subsequent emergence of issues associated with groundwater contamination,
power supply and biosolids management, the underlying circumstances relating to the original
discharge options had not changed. Nonetheless, Hunter Water undertook a further review of onsite
treatment options, including with consideration of the objectives articulated by the EPA as well as the
need to align with a future business-wide biosolids strategy.
This led to the identification of two shortlisted technical sub-options (summarised in Table 93) relating
to the onsite treatment processes required as part of Option 2.

AITHER | Final Report 203
Hunter Water expenditure review
Table 93 Options analysis
Option
Cost ($ million, $2019/20)
Capex Total Cost Present
Value^
Option 2A – upgrade based on MBR 84.2 121.8 87.3
Option 3A – conventional treatment 89.7 125.0 91.9
^Present value based on an analysis period of 25 years and discount rate of 7%
Source: Farley WWTW Stage 3B Revised business Case Farley WWTW Stage 3B Upgrade – July 2019
Option 2A was selected as preferred. The report documenting the options evaluation88 and supporting
the identification of the preferred solution demonstrates a robust assessment, which is thorough and
consistent with the level of review that is appropriate at concept design stage.
A.5.5. Cost estimate
The business case based on this project has a total cost of $84.5 million with a capital cost of
$75.2 million within the current period as opposed to the Hunter Water allowance in their submission
of $70.5 million and $57 million respectively.
A.5.6. Procurement
The proposed works will be procured through a combined detail design and construction (D&C)
contract. This is a standard approach for large treatment facility works and recognised for the delivery
of low-cost construction outcomes.
Alternative contracting approaches often include an ongoing operations and maintenance component,
which aims to ensure that consideration is also given to the longer-term robustness of the design and
construction outcomes. However, given the arrangements of Hunter Water’s existing and ongoing
treatment operations contract, there are barriers to establishing such a contract in this instance.
The contract will be sourced through the D&C contractor panel, the members of which have expertise
and capability relevant to works of this size and nature.
A.5.7. Assessment of efficiency
This project was supported as efficient in the 2016 Price Determination. The scope has increased
significantly but based on the issues that have arisen since that time (relating to power supply,
biosolids management and groundwater contamination), a review of the project is warranted. As
described above, it is clear that – considering the range of issues – there is a need for the plant
upgrade to proceed.
The range of options identified are consistent with industry practice and the options have been
comprehensively explored. The process to identify, investigate and assess the options appears
robust. The preferred solution is the option with the lowest lifecycle cost that is feasibly able to
address environmental and regulatory concerns, and is therefore the most efficient.
88 Farley WWTW Stage 3B Upgrade Options and Constructability Review – Options Review – April 2019

AITHER | Final Report 204
Hunter Water expenditure review
The procurement approach adopted is appropriate and consistent with industry practice for works of
this nature. The tenders sought under a design and construct methodology should support
identification of the lowest capital cost and achieve efficient delivery.
In reviewing Hunter Water’s forecast expenditure for the last year of the current period (2019-20),
Aither considered it unlikely that the full extent of the investment proposed for the Farley WWTP
upgrade would be feasible in the time available. It was recommended that $5 million of the 2019-20
expenditure proposed for this project by deferred into the forecast period.
The funds allowed for this project by Hunter Water in the 2016-2020 and 2020-2025 periods are
considered efficient. It is recommended that $5 million proposed in 2019-20 be deferred to the
forecast period.
A.5.8. Recommended expenditure
It is recommended that the funds proposed by Hunter Water for this project be supported by IPART.
Table 94 Aither’s' recommended Capex for the upcoming determination period
Source Capex Budget ($000’s, 2019-20)
2016 2017 2018 2019 2020 2021 2022 2023 2024 2025
Hunter Water’s
submission
239 103 561 12,198 41,651 15,375 0 0 0
Aither’s
adjustment of
submission
- - - - (5,000) 5,000 - - - -
Aither
recommendation 0 239 103 561 7,198 46,651 15,375 0 0 0

AITHER | Final Report 205
Hunter Water expenditure review
Capital Project 6 - Wyee Backlog Sewer Program
Table 95 Summary of Wyee Backlog Sewer Program
Service Wastewater
Capital project summary
driver/s Government Programs 75%, Growth 25%.
Project stage Under Construction
Table 96 Hunter Water Capex - Actuals (2016-20) and proposed (2021-25)
Source
Capex Budget ($000’s)
2016 2017 2018 2019 2020 2021 2022 2023 2024 2025
SIR/AIR
(S153)
379 393 2,283 17,087 2,050 107 107 107
A.6.1. Project description
The Wyee Backlog Sewer Program involves provision of wastewater services to 450 properties in the
existing Wyee community by December 2020, comprising a new reticulation (sewer) network and
pumped wastewater transfer to Dora Creek WWTP. The transfer system has been sized to allow for
a phased expansion that will cater for growth in the township to 2,100 properties.
A.6.2. Documentation provided
Documents provided and reviewed relating to this project included project business cases, a price
submission capital summary, cost estimates and related expenditure proposals and reviews. In
addition, this project was discussed at a site visit at Hunter Water’s office in August 2019.
A.6.3. Project need
The provision of wastewater services to existing Wyee customers was based on a November 2014
Government directive. The 2016 Determination subsequently included an allowance of $9 million for
expenditure in the current regulatory period, based on an overall cost of $22.3 million ($2015/16) for
this service (including wastewater collection and transfer for treatment at Dora Creek WWTP).
The Government’s requirement for customer connection by 2020 had been clear to Hunter Water at
the time of the 2016 Determination. Nevertheless, at that time Hunter Water made the decision to
base their planned expenditure on a later delivery date.
In 2017 Hunter Water sought to clarify the completion date requirements with the Government, who
confirmed the need to provide a wastewater service for Wyee customers by 2020.
A revised business case was subsequently approved in January 2018, based on ensuring the
directive to connect customers by 2020 was achieved, as well as incorporating a phased increase in
the capacity of the transfer component to cater for regional growth (up to 2,100 properties) at an
estimated additional cost of $8 million.

AITHER | Final Report 206
Hunter Water expenditure review
The current total estimated cost of the project is $34.1 million.
A.6.4. Options investigated
In the course of the project development, a wide range of options was identified and considered. The
large number of options arose as a result of the alternatives that exist for each component of the
system, comprising:
• the reticulation (wastewater collection) system, for which gravity, low pressure or hybrid
(combined gravity and pressure) systems were considered
• the transfer system, which considered three alternative treatment locations
• three different approaches to delivering the preferred treatment option (comprising pumping and
transfer main arrangements).
Nine options were considered as part of a 2016 business case, which led to the identification of the
preferred option to pump wastewater from Wyee to Dora Creek WWTP. A hybrid of gravity and
pressure sewers was selected as the preferred approach to reticulation within Wyee. This option was
selected on the basis that it provided flexibility, utilises Hunter Water’s existing WWTP assets, and
provides opportunities to service existing and future development in other areas. It was also assessed
as having the lowest lifecycle (present value) cost.
A revised business case in 2018 updated the project objective to not only provide backlog sewer
service to 450 properties in the current township but to size the connecting infrastructure between the
township and the servicing treatment plant to cater for future growth in the Wyee region. This growth
of 2100 properties is forecast to occur over the next 20 years but would not be part of the backlog
program. Within this revised business case Hunter Water investigated three options, each of which
was a detailed variation on the preferred option established in the 2016 business case, with additional
consideration about infrastructure staging to manage growth in flows over time.
The transfer infrastructure option with the lowest lifecycle cost was selected as preferred.
A.6.5. Cost estimate
An allowance of $20.3 million has been made in the current regulatory period and $13.6 million for the
forecast period. The change in scope for the project (between the original and revised business case)
to cater for future growth led to an $8 million ($2017/18) increase in the total budget.
Table 97 Project cost estimate ($2017-18)
Component Value ($ million)
Concept & detail design 1.844
Construction 28.968
Project Management 1.501
Land Matters 0.511

AITHER | Final Report 207
Hunter Water expenditure review
Component Value ($ million)
Sub-total 29.980
Contingency 2.843
Total Budget Estimate 32.824
Source: Hunter Water Wyee Sewerage Scheme Business Case 17 January 2018
A.6.6. Procurement
Delivery of the infrastructure has been split into two separate contracts for, respectively, the
reticulation (wastewater collection) sewer system in Wyee, and the transfer network to Dora Creek
WWTP. This arrangement has been adopted to better manage uncertainty associated with
connections and odour impacts.
Each contract is being delivered under a separate design and construct contract. These
arrangements are appropriate for the nature of the works involved.
A.6.7. Assessment of efficiency
The Wyee Backlog Sewerage Program responds to a clear, long-standing directive from the NSW
Government. There is therefore a clear basis for the project need and the requirement to deliver it by
2020 to meet community expectations and the Government directive.
Hunter Water has given detailed consideration to the range of potential delivery options, including
possible approaches to the respective reticulation, transfer and treatment components. The options
identified span the range of approaches that are standard within the industry. Selection of the
preferred option was based on adopting the solution with the lowest lifecycle (present value) cost.
The process to identify the preferred solution is considered thorough and appropriate, with the option
identified a product of establishing firstly the lowest cost option to address the project need (resolving
to transfer wastewater to Dora Creek WWTP), then the least cost way in which to deliver the required
infrastructure. The adopted solution is consistent with industry practice and considered efficient.
The total budget for the program increased by $8 million as a result of increasing the scope of the
infrastructure to cater for wider development and growth. This is considered an efficient increase,
given that it addresses growth business drivers and will facilitate phased expansion in support of
further development in the region. There is also evidence that the change in scope was prompted by
customer and community understanding that the scheme addresses current environmental concerns
and consequently renewed developer interest in the area
The procurement process has also been well-considered, minimises risk, aligns with industry practice,
and is considered efficient.
Delivery date requirements have been confirmed by Government public announcements and
modification of the program to comply with these requirements is necessary.
The proposed expenditure for this project in the forecast period is considered efficient.
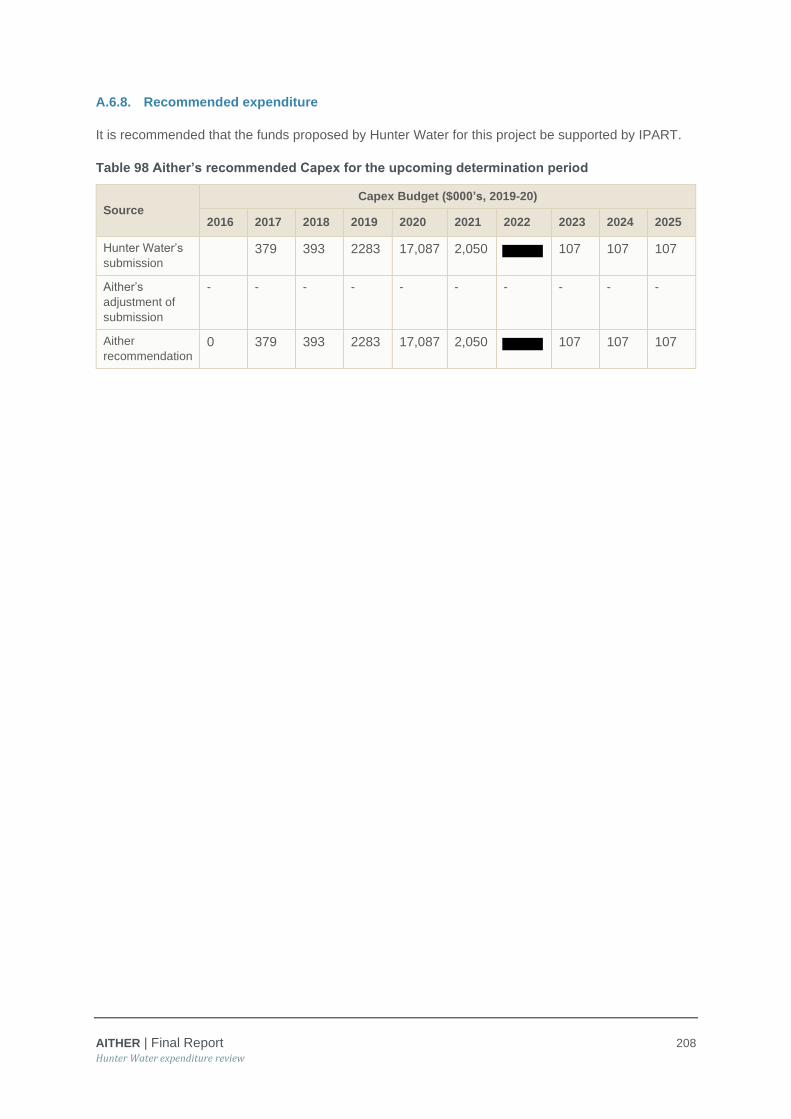
AITHER | Final Report 208
Hunter Water expenditure review
A.6.8. Recommended expenditure
It is recommended that the funds proposed by Hunter Water for this project be supported by IPART.
Table 98 Aither’s recommended Capex for the upcoming determination period
Source
Capex Budget ($000’s, 2019-20)
2016 2017 2018 2019 2020 2021 2022 2023 2024 2025
Hunter Water’s
submission
379 393 2283 17,087 2,050 107 107 107
Aither’s
adjustment of
submission
- - - - - - - - - -
Aither
recommendation 0 379 393 2283 17,087 2,050 107 107 107

AITHER | Final Report 209
Hunter Water expenditure review
Capital Project 7 – Treatment Plant Chemical Containment and
Safety Upgrades Program
Table 99 Summary of Treatment Plant Chemical Containment and Safety Upgrades Program
Service Water & Wastewater
Capital project summary
driver/s Maintaining Standards 90%, Asset & Service Reliability 10%
Project stage Under Construction
Table 100 Hunter Water Capex - Actuals (2016-20) and proposed (2021-25)
Source Capex Budget ($000’s)
2016 2017 2018 2019 2020 2021 2022 2023 2024 2025
SIR/AIR
Wastewater
(S215)
0 0 0 0 256 1,281 3,075 3,075 3,075 1,538
SIR/AIR
Water (W198) 0 0 0 0 256 1,281 3,075 3,075 3,075 1,538
A.7.1. Project description
This project involves the upgrade of 20 chemical dosing facilities at 13 wastewater treatment plants
(WWTPs) and 22 facilities at 6 water treatment plants (WTPs), to address environmental
contamination risks and ensure the facilities meet current health and safety requirements. The project
comprises a range of different works across the sites, from rebuilding facilities and replacing tanks, to
replacing ageing equipment, pipework instruments and control systems, and rectification of
containment works.
This follows on from work commenced in the current regulatory period, to address EPA-directed
upgrades at Dungog WTP and at 23 sites in the network system.
A.7.2. Documentation provided
Documents provided and reviewed relating to this project included project business cases,
investigation and option assessment reports, cost estimates and related expenditure proposals and
reviews. In addition, this project was discussed at a site visit at Hunter Water’s office in August 2019.
A.7.3. Project need
Hunter Water owns and operates 43 chemical dosing systems on a total of 19 WWTP and WTP sites
where chemicals are used. The chemicals are either classed as hazardous or, in the event of a
significant spill or loss of containment, would at least trigger a report to the EPA as a pollution event.
Since 2013, environmental impacts from several such pollution have arisen from chemical system
leaks, involving water and wastewater systems and both their treatment and network activities. This
has led to significant concern from the EPA associated with the standard of Hunter Water’s chemical

AITHER | Final Report 210
Hunter Water expenditure review
dosing systems, including prosecution. In September 2016, a directive from the EPA mandated
improvements to a significant number of Hunter Water’s related systems.
In the current regulatory period, Hunter Water has commenced chemical system improvements works
at Dungog WTP (subject of Project 2 detailed review), and $8 million expenditure on improvement of
chemical dosing systems within the water and wastewater network.
More broadly, as part of the wider treatment plant program during the past four years Hunter Water
has undertaken various assessments of its chemical systems across treatment and network sites,
increasing awareness and understanding of the chemical-related risks. A series of comprehensive
reports by expert consultants have detailed the risk of loss of containment, and increased safety and
operational risks from a number of chemical systems throughout Hunter Water’s treatment plants.
Additionally, multiple chemical systems are approaching the end of their useful life, and all but the
newest of these systems demonstrate various levels of non-compliance with mandatory health and
safety and environmental regulations.
The review has produced a prioritised list of activities, which is the basis for Hunter Water proposing
this program in order to address this prioritised list in accordance with their risk appetite. The options
below outline the decision-making process to determine the final scope of this project and the
proposed expenditure.
A.7.4. Options investigated
Hunter Water developed four different approaches to addressing the priorities identified, preparing a
scope and cost estimate for each option and analysing the extent to which they addressed the
containment and safety risks. The options are summarised in Table 101 and the associated risk
assessment provided in Table 102 and Table 103.
Each option includes a component of ongoing equipment renewal. The greater the amount that is
invested as a result of this project, the less the renewal investment required in the future. As shown in
Table 101, the present value of the cost of each option is therefore the sum of the up-front capital
investment and the associated lifecycle renewal cost.
Table 101 Options cost analysis
Option
Cost ($ million, $2018/19)
Project
Capex
Lifecycle
renewal cost
Present
value^
Option 1 – Do Nothing
Option 2 – Upgrade chemical dosing systems at
Kurri Kurri & Raymond Terrace WWTPs
Option 3 – Reduce environmental risk to medium
and safety risk to low
Option 4 – Upgrade chemical systems to achieve
risk appetite
Option 5 – Upgrade all chemical systems to
Australian Standards
Source: Hunter Water Business Case, 2019
^Present value is based on an analysis period of 25 years and discount rate of 7%
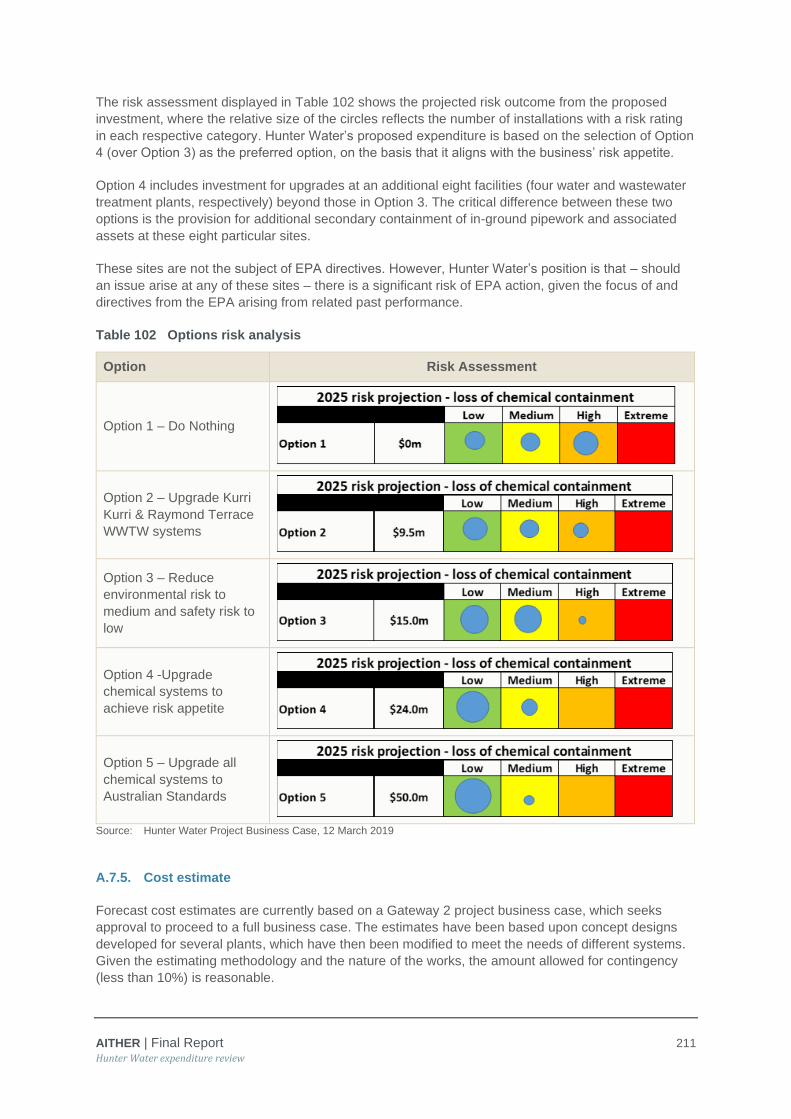
AITHER | Final Report 211
Hunter Water expenditure review
The risk assessment displayed in Table 102 shows the projected risk outcome from the proposed
investment, where the relative size of the circles reflects the number of installations with a risk rating
in each respective category. Hunter Water’s proposed expenditure is based on the selection of Option
4 (over Option 3) as the preferred option, on the basis that it aligns with the business’ risk appetite.
Option 4 includes investment for upgrades at an additional eight facilities (four water and wastewater
treatment plants, respectively) beyond those in Option 3. The critical difference between these two
options is the provision for additional secondary containment of in-ground pipework and associated
assets at these eight particular sites.
These sites are not the subject of EPA directives. However, Hunter Water’s position is that – should
an issue arise at any of these sites – there is a significant risk of EPA action, given the focus of and
directives from the EPA arising from related past performance.
Table 102 Options risk analysis
Option Risk Assessment
Option 1 – Do Nothing
Option 2 – Upgrade Kurri
Kurri & Raymond Terrace
WWTW systems
Option 3 – Reduce
environmental risk to
medium and safety risk to
low
Option 4 -Upgrade
chemical systems to
achieve risk appetite
Option 5 – Upgrade all
chemical systems to
Australian Standards
Source: Hunter Water Project Business Case, 12 March 2019
A.7.5. Cost estimate
Forecast cost estimates are currently based on a Gateway 2 project business case, which seeks
approval to proceed to a full business case. The estimates have been based upon concept designs
developed for several plants, which have then been modified to meet the needs of different systems.
Given the estimating methodology and the nature of the works, the amount allowed for contingency
(less than 10%) is reasonable.
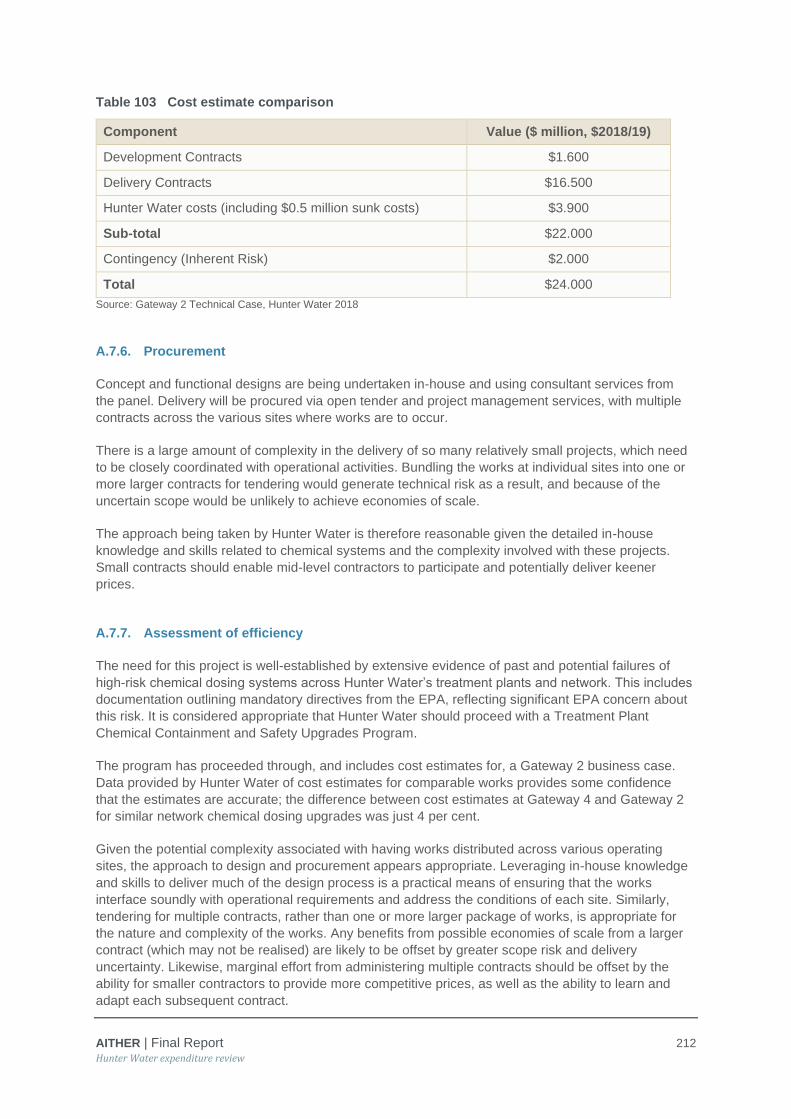
AITHER | Final Report 212
Hunter Water expenditure review
Table 103 Cost estimate comparison
Component Value ($ million, $2018/19)
Development Contracts $1.600
Delivery Contracts $16.500
Hunter Water costs (including $0.5 million sunk costs) $3.900
Sub-total $22.000
Contingency (Inherent Risk) $2.000
Total $24.000
Source: Gateway 2 Technical Case, Hunter Water 2018
A.7.6. Procurement
Concept and functional designs are being undertaken in-house and using consultant services from
the panel. Delivery will be procured via open tender and project management services, with multiple
contracts across the various sites where works are to occur.
There is a large amount of complexity in the delivery of so many relatively small projects, which need
to be closely coordinated with operational activities. Bundling the works at individual sites into one or
more larger contracts for tendering would generate technical risk as a result, and because of the
uncertain scope would be unlikely to achieve economies of scale.
The approach being taken by Hunter Water is therefore reasonable given the detailed in-house
knowledge and skills related to chemical systems and the complexity involved with these projects.
Small contracts should enable mid-level contractors to participate and potentially deliver keener
prices.
A.7.7. Assessment of efficiency
The need for this project is well-established by extensive evidence of past and potential failures of
high-risk chemical dosing systems across Hunter Water’s treatment plants and network. This includes
documentation outlining mandatory directives from the EPA, reflecting significant EPA concern about
this risk. It is considered appropriate that Hunter Water should proceed with a Treatment Plant
Chemical Containment and Safety Upgrades Program.
The program has proceeded through, and includes cost estimates for, a Gateway 2 business case.
Data provided by Hunter Water of cost estimates for comparable works provides some confidence
that the estimates are accurate; the difference between cost estimates at Gateway 4 and Gateway 2
for similar network chemical dosing upgrades was just 4 per cent.
Given the potential complexity associated with having works distributed across various operating
sites, the approach to design and procurement appears appropriate. Leveraging in-house knowledge
and skills to deliver much of the design process is a practical means of ensuring that the works
interface soundly with operational requirements and address the conditions of each site. Similarly,
tendering for multiple contracts, rather than one or more larger package of works, is appropriate for
the nature and complexity of the works. Any benefits from possible economies of scale from a larger
contract (which may not be realised) are likely to be offset by greater scope risk and delivery
uncertainty. Likewise, marginal effort from administering multiple contracts should be offset by the
ability for smaller contractors to provide more competitive prices, as well as the ability to learn and
adapt each subsequent contract.

AITHER | Final Report 213
Hunter Water expenditure review
The main consideration in evaluating the efficiency of this upgrade program is the identification of the
preferred option. Although the works are justified – including responding to concern and specific
directives from the EPA – the selection of the preferred option is premised on the mitigation of risk in
alignment with Hunter Water’s risk appetite.
Hunter Water’s preferred option proposes greater investment based on a more risk averse position.
Selecting this option presupposes that – based on past performance – the EPA will be more inclined
to take action in relation to more of Hunter Water’s related facilities, regardless of whether those
assets have been constructed to industry standards and are otherwise not currently the subject of
specific EPA directives.
Specifically, Hunter Water has taken the view that the need for secondary containment is required
across all facilities, on the basis that the EPA has specified this need for selected facilities where
directives are currently in place. Hunter Water’s approach at these sites will be to undertake condition
assessment of the assets and where asset condition requires it the asset will be replaced. It is
unclear what assumptions have been made regarding the extent of secondary containment required
in the budget. Regardless there is no strict requirement or basis for this level of containment at
facilities that are not the subject of EPA action, reflecting an overly risk averse position that arises
because of the recent attention from the EPA. If not for the related directives, it is unlikely that this
position would be taken, and a more risk tolerant approach would be acceptable (which is also
consistent with wider industry practice).
Hunter Water’s preferred option implies that upgrades to some facilities are based on Hunter Water’s
past poor performance of related assets, in the absence of which a more balanced position
(consistent with Option 3) would have been acceptable. As a result, it is considered that the basis for
selecting the more costly Option 4 over Option 3 is an expense Hunter Water and its customers would
have not incurred but for the past performance by Hunter Water and is therefore considered
inefficient. As consequence and it is proposed that the supported expenditure should be reduced
from $24 million to $15 million.
The proposed level of expenditure for chemical containment works for the forecast regulatory
period is considered efficient based on Option 3 above. It is recommended that expenditure be
reduced by $9 million from $24 million to $15 million, comprising:
• a reduction of $4.5 million for works at water treatment plants
• a reduction of $4.5 million for works at wastewater treatment plants.
A.7.8. Recommended expenditure
It is recommended that the expenditure proposed by Hunter Water for this project be reduced by $9
million.
Table 104 Aither’s' recommended Capex for the upcoming determination period
Source
Capex Budget ($000’s, 2019-20)
2016 2017 2018 2019 2020 2021 2022 2023 2024 2025
Hunter Water’s
submission 0 0 0 0 513 2,563 6,150 6,150 6,150 3,075
Aither’s
adjustment of
submission
- - - - - (1,800) (1,800) (1,800) (1,800) (1,800)

AITHER | Final Report 214
Hunter Water expenditure review
Source Capex Budget ($000’s, 2019-20)
2016 2017 2018 2019 2020 2021 2022 2023 2024 2025
Aither
recommendation 0 0 0 0 513 763 4,350 4,350 4,350 1,275

AITHER | Final Report 215
Hunter Water expenditure review
Capital Project 8 - Major Wastewater Treatment Works Upgrade
Program (Other than Farley WWTP stage 3B)
Table 105 Summary of Other Wastewater Treatment Plant Upgrade Program
Service Wastewater
Capital project summary
driver/s As per Table 107 below
Project stage As per Table 107 below
Table 106 Hunter Water Capex - Actuals (2016-20) and proposed (2021-25)
Source Capex Budget ($000’s)
2016 2017 2018 2019 2020 2021 2022 2023 2024 2025
SIR/AIR 0 390 791 4,189 18,296 22,460 9,088 27,486 26,789 22,748
Note: Projects include S184, S220, S156, S214, S134, S161, S144.
A.8.1. Project description
Hunter Water has proposed several major upgrades to wastewater treatment plants in 2019-20 and
the forecast regulatory period. The works comprise renewal, improvements or expansion of assets
within Hunter Water’s wastewater treatment plants, typically to address growth and or compliance
concerns.
Wastewater treatment plant (WWTP) upgrades represent a significant investment and substantial
proportion of total expenditure proposed in the forecast period. Figure 65 illustrates proposed
expenditure on WWTP upgrades as a proportion of total wastewater expenditure for the period.

AITHER | Final Report 216
Hunter Water expenditure review
Source: Hunter Water AIR
Figure 65 Wastewater capital expenditure proposed for the forecast period
Hunter Water identifies eight major WWTP projects in its price submission (detailed in Technical
Paper 4). The largest project – the Farley WWTP Stage 3B upgrade – has been reviewed separately
and is discussed in more detail elsewhere.
The remaining seven projects and their principal drivers are summarised in Table 107.
Table 107 Major WWTP projects with proposed expenditure exceeding $10 million
Upgrade Project Capex
($million)
Total
Capex
($million)
Project
status /
Planned
completion
date
Drivers
Growth
Existing /
New
Mandatory
Standards
Asset &
Service
Reliability
Morpeth WWTP
Stage 4 AIR S184 G1/2026 60% 20% / 10% Nil
Farley WWTP
effluent pumping &
pipeline to Hunter
River AIR S220
G1/2024 50% 50% / 0% Nil
Burwood Beach
WWTP Stage 3
AIR S156
G1/2026 25% 50% / 25% Nil
Cessnock WWTP
AIR S214 G2/2023 20% 50% / 0% 30%
Dora Creek
WWTP Stage
2B*AIR S134
G1/2021 Nil 100% Nil
0
20000
40000
60000
80000
100000
120000
140000
Wastewater project capital expenditure ($000s, $2019-20 real)
Total WWTW upgrades (growth and mandatory standards)
Total wastewater capital expenditure
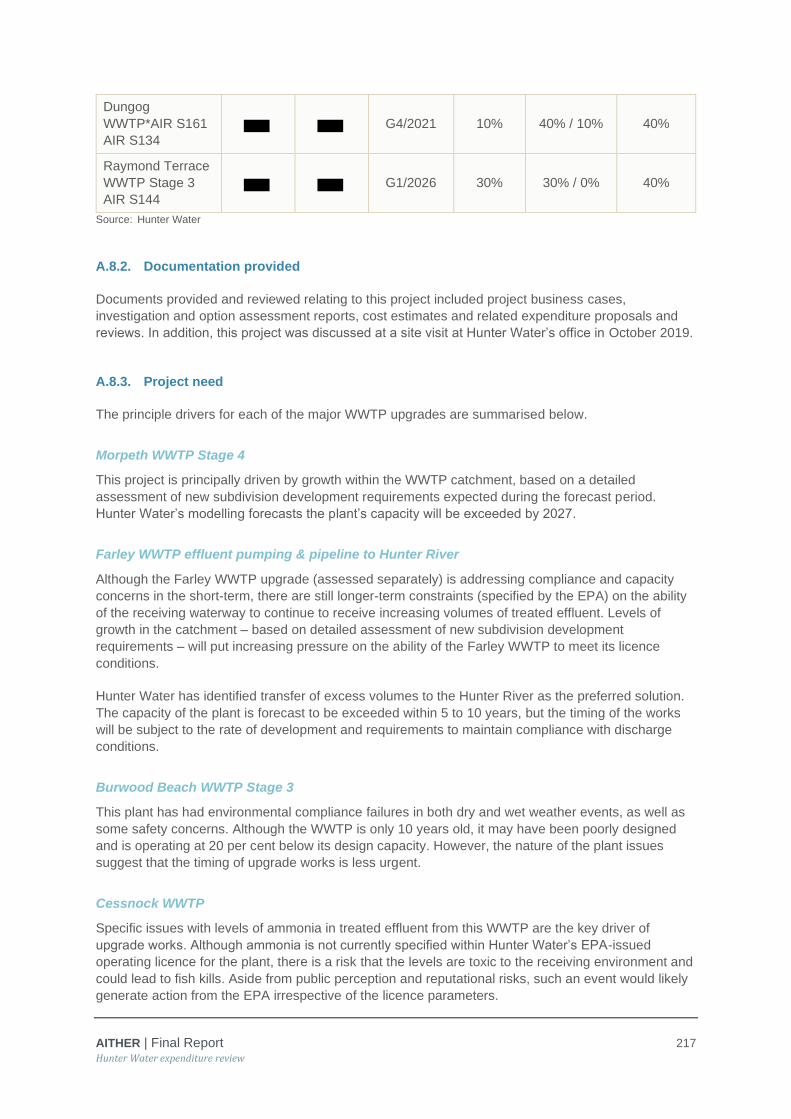
AITHER | Final Report 217
Hunter Water expenditure review
Dungog
WWTP*AIR S161
AIR S134
G4/2021 10% 40% / 10% 40%
Raymond Terrace
WWTP Stage 3
AIR S144
G1/2026 30% 30% / 0% 40%
Source: Hunter Water
A.8.2. Documentation provided
Documents provided and reviewed relating to this project included project business cases,
investigation and option assessment reports, cost estimates and related expenditure proposals and
reviews. In addition, this project was discussed at a site visit at Hunter Water’s office in October 2019.
A.8.3. Project need
The principle drivers for each of the major WWTP upgrades are summarised below.
Morpeth WWTP Stage 4
This project is principally driven by growth within the WWTP catchment, based on a detailed
assessment of new subdivision development requirements expected during the forecast period.
Hunter Water’s modelling forecasts the plant’s capacity will be exceeded by 2027.
Farley WWTP effluent pumping & pipeline to Hunter River
Although the Farley WWTP upgrade (assessed separately) is addressing compliance and capacity
concerns in the short-term, there are still longer-term constraints (specified by the EPA) on the ability
of the receiving waterway to continue to receive increasing volumes of treated effluent. Levels of
growth in the catchment – based on detailed assessment of new subdivision development
requirements – will put increasing pressure on the ability of the Farley WWTP to meet its licence
conditions.
Hunter Water has identified transfer of excess volumes to the Hunter River as the preferred solution.
The capacity of the plant is forecast to be exceeded within 5 to 10 years, but the timing of the works
will be subject to the rate of development and requirements to maintain compliance with discharge
conditions.
Burwood Beach WWTP Stage 3
This plant has had environmental compliance failures in both dry and wet weather events, as well as
some safety concerns. Although the WWTP is only 10 years old, it may have been poorly designed
and is operating at 20 per cent below its design capacity. However, the nature of the plant issues
suggest that the timing of upgrade works is less urgent.
Cessnock WWTP
Specific issues with levels of ammonia in treated effluent from this WWTP are the key driver of
upgrade works. Although ammonia is not currently specified within Hunter Water’s EPA-issued
operating licence for the plant, there is a risk that the levels are toxic to the receiving environment and
could lead to fish kills. Aside from public perception and reputational risks, such an event would likely
generate action from the EPA irrespective of the licence parameters.
AITHER | Final Report 218
Hunter Water expenditure review
Dora Creek WWTP Stage 2B
Upgrade works at this plant are driven by non-compliance with environmental requirements
associated with biosolids management.
Dungog WWTP
Upgrade works at the Dungog WWTP are currently under construction and originate from a directive
from the EPA. Although ongoing, aspects of the works (associated with sludge management) have
been deferred while Hunter Water prepares its business-wide biosolids strategy.
Raymond Terrace WWTP Stage 3
A range of assets at this facility have been assessed as in poor condition, which is contributing to
incidences of non-compliance with EPA licence conditions.
A.8.4. Options investigated
Each project has identifiable options that have been or are under consideration as part of typical
option identification and assessment processes. The range and nature of the options identified appear
reasonable and consistent with the types of approaches and solutions that would be expected.
The detailed options development and assessment process, including associated cost estimates,
have not been reviewed in detail for each project. However, based on the detailed review of the
Farley WWTP upgrade project, it is expected that the approach adopted for these projects is similarly
thorough and well-structured.
A.8.5. Cost estimate
The cost estimates across all seven projects have not been reviewed in detailed. However, based on
Hunter Water’s recent record of under-estimating scope and costs of projects of this nature at the
Gateway 1 stage, there is some risk that the scope of necessary works increases, along with the
associated costs.
The recent experience of the progression through the Gateway process of upgrade works at Farley
WWTP demonstrated that Hunter Water’s estimates were around 10 per cent below tender prices.
This process will have provided learnings that – along with an incremental improvement in
understanding of asset condition which will help reduce scope creep – should ensure that projects
approaching Gateways 3 and 4 should have acceptable cost estimates.
A.8.6. Procurement
Major works of this nature are procured through design and construction contracts, which are
competitively tendered by approved contractors on Hunter Water’s panel. Design and construct
contracts are an industry standard approach for works of this type. Efficiencies are realised by
requesting tenders from a pre-approved panel whilst still retaining sufficient competitive tension to
ensure that scope and quality expectations are delivered at best value.
A.8.7. Assessment of efficiency
The efficiency of the proposed projects in this program is influenced by three issues in particular:

AITHER | Final Report 219
Hunter Water expenditure review
• perceptions about the risk of environmental non-compliance
• uncertainty around future environmental compliance requirements
• the status of Hunter Water’s business-wide biosolids strategy and the associated implications for
projects to address biosolids management.
The assessment of efficiency is described below in relation to each of these key issues.
Risk of environmental non-compliance
The primary driver of related WWTP works in the current period has been a series of directives from
the EPA relating to failure to comply with licence conditions. The prevalence of this has generated
concern within Hunter Water about compliance risk across similar assets more broadly.
Projects that are still in a planning phase appear primarily to be driven by corporate concerns about
the approach that the EPA may take to future non-compliance. The planning is therefore being
conducted in an environment of risk minimisation in this regard.
Nevertheless, most of the planned projects in this program (Burwood Beach, Cessnock, Dungog,
Raymond Terrace and Dora Creek) have either specific EPA directions or clear current evidence has
been presented on environmental non-compliance challenges and Hunter’s Water position on these
plants is considered reasonable.
However, in the absence of recent and heightened attention from the EPA, it is likely that a more risk
tolerant approach to two major projects would have been taken, deferring their upgrade until such
time as the risk genuinely required mitigation.
Morpeth WWTP Stage 4 upgrade and Farley WWTP effluent transfer are upgrades driven by
concerns about growth leading to challenges complying with current discharge licence conditions. The
growth itself is associated with new urban subdivision, the timing and extent of which is inherently
uncertain.
Hunter Water provided presentations on the development of growth rates in each of these catchments
and how that growth impacts treatment capacity at the plants and its ability to meet current licence
conditions.
Data provided by Hunter Water (see Figure 66) indicates that Morpeth WWTP Stage 4 upgrade –
currently planned for completion in 2025-26 – will exceed its critical EPA licence condition (90th
percentile on BOD) in 2026-27. Growth in the Morpeth catchment within the 9-year period from 2018
is forecast at approximately 10 per cent over this period and appears to taper off beyond that period.

AITHER | Final Report 220
Hunter Water expenditure review
Source: Hunter Water
Figure 66 Equivalent population load projections for Morpeth WWTP
However, Greenfield development long-term growth forecasts are typically conservatively high.
Morpeth is in a comparatively large catchment, with forecast growth that is a relatively small
percentage increase in total load over a long time period. Given the experience of the past few years
there is also continuing uncertainty in the location of growth across the wider Hunter Water area. The
growth forecast is therefore not considered an immediately critical issue in determining the timing of
the upgrade of this plant. A delay in expenditure on this program by two years would appear
reasonable when comparing the load projection information above in Figure 66 with Morpeth’s
demonstrated plant capacity. Given the pressure on Hunter Water to invest in more critical activities, a
delay in implementing this upgrade is proposed. This would shift some $12.6 million beyond the
forecast period.
Figure 67 indicates that Farley WWTP is forecast by Hunter Water to exceed its critical EPA limits on
Total Nitrogen Load at its current discharge location in 2025-26. Hunter Water proposes expenditure
to complete the Farley WWTP effluent pipeline project in 2024 to deliver treated effluent to the Hunter
River. Joint investigations between Hunter Water and the EPA are also ongoing, with the exact nature
of the EPA discharge requirements still uncertain.

AITHER | Final Report 221
Hunter Water expenditure review
Source: Hunter Water
Figure 67 Forecast total nitrogen loads for Farley WWTP
The forecast point at which the effluent transfer pipeline is required is based on anticipated
performance of the Farley WWTP Stage 3B upgrade and forecast growth in flows over a nine-year
period.
Typically, the timing for further plant upgrades would be determined when the performance of such a
major plant upgrade as that involved with Stage 3B is thoroughly commissioned and testing. So, to
some extent Hunter Water’s forecast is based on the usually conservative plant performance
requirements set out in the stage 3B specification.
Long-term forecast growth in the Farley catchment, similar to that of Morpeth, would also be the
subject of optimistic local government and developer estimates. Flow growth at Farley has been
based on a forecast of 4,830 new properties in the 9-year period starting from 2018-19. Approximately
30 per cent of these are in areas zoned for development where development has not commenced.
The forecast growth rate is some 10 per cent higher than that experienced in the catchment in
previous years.
Given a range of factors (performance of the yet to be completed Stage 3B upgrade is likely to be a
conservative assessment; property development driving the growth estimates is at an early stage;
wider issues with recent experience of uncertainty in the location of growth and new connections; and
ongoing pressure on other parts of the program) it is suggested that the current planned completion
date of 2024 is unnecessarily conservative. The project completion date could be deferred to at least
a forecast date of 2026. This would shift one year of expenditure (some $11.3 million) beyond the
forecast period.
It is recommended that proposed expenditure be reduced for the forecast period by $24 million on
the basis that aspects of the program can be deferred without unreasonable risk to Hunter Water.

AITHER | Final Report 222
Hunter Water expenditure review
Uncertainty about future environmental compliance requirements
In some instances, the licence requirements for effluent discharges to receiving waterways are under
consideration by the EPA and yet to be resolved. Based on a discussion Aither and IPART held with
the EPA, it is evident that these issues are unlikely to be finalised for some time.
It is inappropriate for Hunter Water to proceed with upgrade works until such time as the objectives of
those works (that is, compliance with licence conditions) are clear and certain. However, in the
meantime, Hunter Water has taken a reasonable view that future licence obligations will be similar to
current conditions and is proceeding with planning on this basis. Given that licence conditions are
unlikely to be made less onerous than current arrangements, this provides confidence that forecast
expenditure is at least unlikely to over-estimate associated costs.
Status of the Biosolids Strategy
An action arising from Strategy 2017+3, Hunter Water’s Biosolids Strategy – which has identified
centralised management of biosolids as a preferred strategy – is currently at Gateway 1. Several of
the projects in this program include an expenditure allocation for biosolids management, which would
be redirected towards the construction of a centralised facility if this is approved to proceed. Based on
an assessment of the draft Biosolids Strategy (presented to the Hunter Water Board in October 2019
with a recommendation for further investigation), there are some relevant recommendations for
changes to the capital expenditure profile over the forecast period.
Notwithstanding the implications of uncertainty about licence conditions in some instances and
Hunter Water’s Biosolids Strategy, the majority of proposed expenditure is considered efficient.
Decisions about (and investment of) expenditure should be deferred until the outcomes of these
evolving directions are clear, but the basis for planning and estimating costs is appropriate.
However, it is considered that the timing of some projects within the program is not sufficiently
urgent and is underpinned by an unreasonable perception of risk. It is considered that expenditure
on these projects is inefficient and could be deferred without impacting Hunter Water’s
performance. Accordingly, it is recommended that proposed expenditure for the forecast period be
reduced by a total of $24 million.
A.8.8. Recommended expenditure
It is recommended that most of the expenditure proposed by Hunter Water be supported by IPART,
except for a reduction of $24 million associated with deferring unnecessary works.
Table 108 Aither’s' recommended Capex for the upcoming determination period
Source
Capex Budget ($000’s, 2019-20)
2016 2017 2018 2019 2020 2021 2022 2023 2024 2025
Hunter Water’s
submission 0 390 791 4,189 18,296 22,460 9,088 27,486 26,789 22,748
Aither’s
adjustment of
submission
- - - - - - - - (16,238) (7,688)
Aither
recommendation 0 390 791 4,189 18,296 22,460 9,088 27,486 10,551 15,061

AITHER | Final Report 223
Hunter Water expenditure review
Capital Project 9 - Stormwater Major Rehabilitation / Renewal
Program
Table 109 Summary of Stormwater Major Rehabilitation / Renewal Program
Service Stormwater
Capital project summary
driver/s Asset and Service Reliability 100%
Project stage Gateway 1 Approval – Preliminary Business Case
Table 110 Hunter Water Capex - Actuals (2016-20) and proposed (2021-25)
Source Capex Budget ($000’s)
2016 2017 2018 2019 2020 2021 2022 2023 2024 2025
SIR/AIR (R13) 0 0 0 0 0 800 1,538 3,075 4,100 4,100
A.9.1. Project description
This program covers major stormwater rehabilitation projects undertaken by Hunter Water, to ensure
that it continues to meet the obligations of its Operating Licence to provide, operate and maintain its
stormwater drainage system.
No explicit provision was made for these works in the current regulatory period. While minor
stormwater renewal and rehabilitation works are addressed through a separate business case, there
are also a number of established priorities for more significant work. The exact nature of the work
required is subject to further investigation, but major rehabilitation work has been identified as
required at four locations at a total cost of $13.612 million ($2017/18):
• Macquarie St, Mayfield
• Belford to Chatham St, Hamilton
• Station St, Waratah
• Christo Rd, Waratah.
A.9.2. Documentation provided
Documents provided and reviewed relating to this project included project business cases and related
expenditure proposals and reviews. In addition, this project was discussed at a site visit at Hunter
Water’s office in August and October 2019.
A.9.3. Project need
Hunter Water manages 96km of stormwater assets, the majority of which were constructed between
1920 and 1940. Other than capacity issues arising from extreme weather events, there have been no
significant issues with the system since its construction.

AITHER | Final Report 224
Hunter Water expenditure review
Condition inspections and assessments of the open (above-ground) parts of the system have been
undertaken at approximately five-year intervals. In 2011, a program to assess the condition of the
underground assets within the system was commenced.
In 2017 a failure in the Mayfield System under dry weather conditions highlighted issues of public
safety. This failure, together with the outcomes of the condition assessment program, resulted in
capital expenditure of $7.4 million on the Mayfield system and other high-priority works (commencing
in 2018-19), including $1.57 million forecast for 2020-21 that is not part of this project. There was no
provision for this expenditure at the time of the previous Price Determination.
The results of the condition assessments completed to date form the basis of the program proposed
for the next regulatory period. These assessments identified that the quality of concrete culverts and
pipework and consequently the rate of deterioration varied across the system. Hunter Water is
concerned that parts of the stormwater system have deteriorated to the extent that there is an
unacceptable risk of failure, which could lead to loss of system functionality and uncontrolled
subsidence. The consequences of such failures include the potential for property damage and
impacts on public safety.
Hunter Water’s Asset Management Plan (July 2019) summarises the condition assessment findings,
the risk assessment process and a prioritised works program. Below-ground inspection processes
utilise established techniques and Australian Standard approaches to condition identification, with a
systematic approach adopted to evaluate the density of defects. Following application of these
techniques, relevant structural expertise has been sought to identify those areas with highest
probability of failure.
The condition assessment is combined with the application of an appropriate risk assessment
technique. In combination with the information on failure probability, this considers the consequences
for the public from asset failure mechanisms (such as collapse during storm events leading to public
exposure, consequential flooding and traffic impact) to determine a risk rating for each asset section.
A.9.4. Options investigated
Based on the condition assessments and a risk-based assessment, Hunter Water developed a risk-
based priority list. The works proposed by Hunter Water in its business case for this project have
been restricted to the highest risk sections with a risk of failure within the next 5 years.

AITHER | Final Report 225
Hunter Water expenditure review
A.9.5. Cost estimate
An allowance of $13.612 million has been made for the forecast period, which includes some
$5.0 million for detail scoping, design and construction. This work will involve working with the public,
other stakeholders, and further testing to fully scope and specify the work and is not unreasonable at
this stage of the works.
A.9.6. Procurement
The project will be delivered by separate design and construct contract packages with specialist
contractors shortlisted where required.
A.9.7. Assessment of efficiency
A historical lack of detailed understanding about the condition of Hunter Water’s stormwater
understanding culminated in a series of performance issues in the current period. A thorough
condition assessment process has now been undertaken, utilising appropriate techniques and
relevant specialist expertise. A systematic and phased program for addressing observed deficiency
and risks in the system has been developed.
Enhanced monitoring and annual minor remedial programs have also been proposed in the ongoing
stormwater program, with the aim of minimising major rehabilitation works in the future. This should
contribute to rectifying the historical deficiency in management of these assets over time.
It is appropriate that Hunter Water should respond to risks to public safety and property arising from
the condition of their assets. The extent of the works proposed appear reasonable, with the
rehabilitation approaches tailored to the issues at each site. The measures proposed to rehabilitate
sections of the system are appropriate and consistent with industry practice.
The expenditure proposed for the stormwater major rehabilitation and renewal program for the
forecast period is considered efficient.
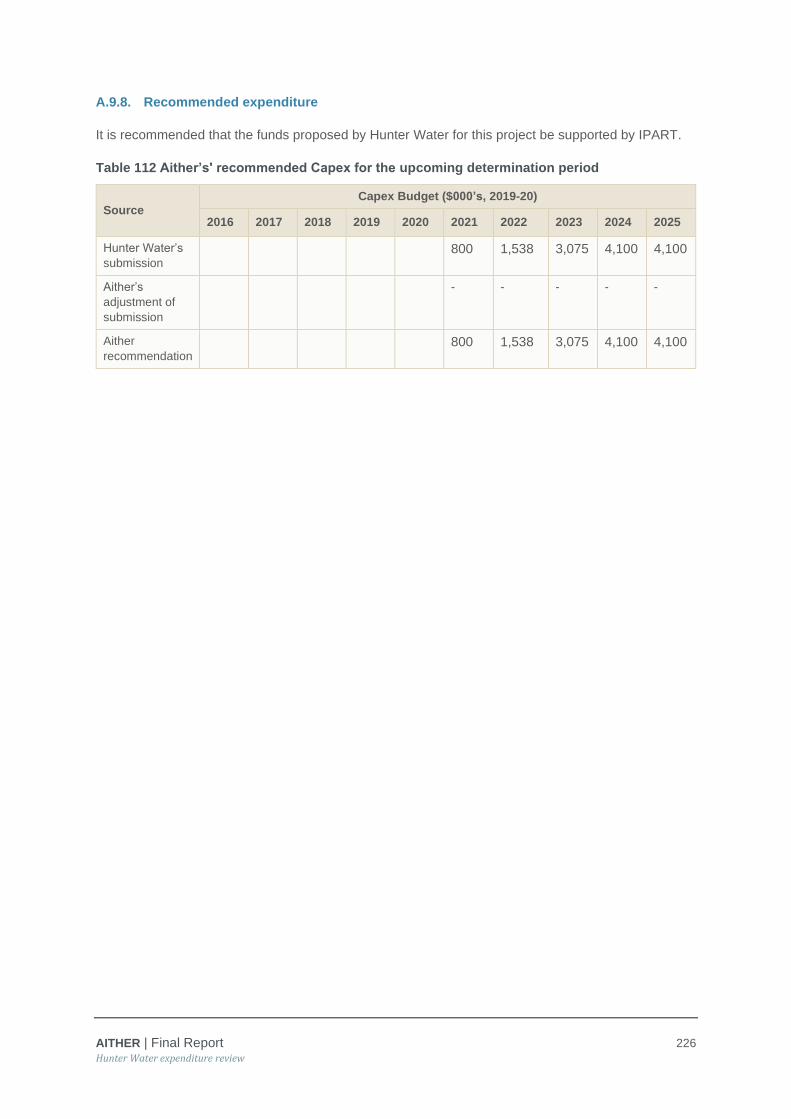
AITHER | Final Report 226
Hunter Water expenditure review
A.9.8. Recommended expenditure
It is recommended that the funds proposed by Hunter Water for this project be supported by IPART.
Table 112 Aither’s' recommended Capex for the upcoming determination period
Source
Capex Budget ($000’s, 2019-20)
2016 2017 2018 2019 2020 2021 2022 2023 2024 2025
Hunter Water’s
submission
800 1,538 3,075 4,100 4,100
Aither’s
adjustment of
submission
- - - - -
Aither
recommendation
800 1,538 3,075 4,100 4,100

AITHER | Final Report 227
Hunter Water expenditure review
Capital Project 10 – Water Loss Improvement Program
Table 113 Summary of Water Loss Improvement Program
Service Water
Capital project summary
driver/s
Growth (30%); Asset and service reliability (60%); Business
efficiency (10%)
Project stage Ongoing
Table 114 Hunter Water Capex - Actuals (2016-20) and proposed (2021-25)
Source
Capex Budget ($000’s)
2016 2017 2018 2019 2020 2021 2022 2023 2024 2025
SIR/AIR 3,485 7,790 9,840 8,405 3,280
Source: Annual Information Return, projects include (W200, W201, W202, W203)
A.10.1. Project description
The objective of this program of works is to reduce water loss across the network and therefore
contribute to water security for Hunter Water and provide additional time for future supply
augmentation decisions. The program is based on a forecast of $32.8 million over the upcoming
regulatory period to undertake initiatives to reduce water loss to minimise non-revenue water and
thereby increase the timing of any future supply augmentation.
This program consists of four primary initiatives:
• Active Leak Detection: this project involves contractors walking the water supply network and
listening for leaks from the watermain and service mains. This is initially undertaken through the
use of listening sticks, then locating actual leaks through installation of acoustic correlators.
• Pressure Management: this project involves the installation of automated pressure reducing
valves or utilisation of below-grade reservoirs (i.e. reservoirs which are normally only operated in
periods of high-demand) to reduce the pressure on the water network and customer fittings. This
process reduces the internal stress on the network and thereby reduces both the quantity of
leaks/breaks and the volume lost from those leaks/breaks.
• Specific Asset Losses: this project involves the investigation of deterioration and leaks of
specific assets such as reservoirs or trunk watermains, which can be individually repaired or
replaced. Examples include Black Hill Reservoir and the Chichester Trunk Gravity Main.
• District Metered Areas: this project involves the installation of network flow meters and zone
valves to segment the network to allow for a more tailored monitoring and analysis of localised
network performance.
A.10.2. Documentation provided
A range of documents was provided and reviewed for this program, comprising business cases,
option development and assessment, consideration of levelised costs and forecast water savings and
capital expenditure summary information. In addition, this project was discussed with Hunter Water at
site visits in August and October 2019.

AITHER | Final Report 228
Hunter Water expenditure review
A.10.3. Project need
Hunter Water states that the current supply system is vulnerable to drought due to relatively small
storages and high evaporative losses. Based on the most recent National Performance Report (2017-
18) indicates that:
• Hunter Water’s residential demand is approximately 10 per cent higher than other similar
metropolitan water utilities, and
• Hunter Water has a high rate of network losses compared to other similar metropolitan water
utilities.
Hunter Water notes that these factors exacerbate the risks associated with its water storage capacity.
Given the long lead-time for the planning for supply augmentation, reducing water loss and
conserving water are important factors in ensuring sufficient time to make efficient supply
augmentation decisions.
As part of its Operating Licence, Hunter Water was required to submit to IPART a proposed
methodology for determining its economic level of water conservation (i.e. Economic Level of Water
Conservation Methodology). This methodology is required to outline the principles relating to water
conservation for the following elements:
• Water leakage (within and downstream of its water treatment plants)
• Water recycling, and
• Water efficiency (including demand management).
Following the approval of this methodology, Hunter Water was required to develop and submit (as
part of its pricing submission) a water conservation work program based on this methodology. This
program of work is the proposed work program to comply with this conservation methodology.
The methodology involves the calculation of levelised costs of different water conservation initiatives
and comparing these costs with the value of water to determine whether the initiative is economically
efficient. Hunter Water has adopted the SRMC to value water for more temporary nature initiatives,
with the LRMC to value water for longer-term initiatives.
Through discussions with Hunter Water, the recent introduction of water restrictions on the customer
base has brought forward some of this work as a higher priority for the business.
A.10.4. Options investigated
The business case completed in June 2019 analysed five different options. These options were
variations of the level of conservation activities.
The business case supported the adoption of Option 4 from the options considered. This is based on
the fact that the investment provides a reduction in water loss that is within the ELWC Methodology
and provide a significant contribution to the deferral of supply augmentation.
The business case sought to approve development funding for the design and development of 10
pressure management zones and approve the design and construction of a further eight per cent of
DMAs.

AITHER | Final Report 229
Hunter Water expenditure review
Table 115 Options analysis
Option
Cost ($million; $2018-19)
Project
Capex
Levelised
Cost
Water
Loss
Reduction
Option 1 – Do Nothing $0 NA NA
Option 2 – Historical Water Loss Programs $1.0 $0.20/kL (0.1GL)
Option 3 – Lower Service Risk ELWC Program $13.4 $0.45/kL1 /
≤$2.11/kL 1.3GL
Option 4 – ELWC Program $31.9 $0.45/kL1 /
≤$2.34/kL 2.4GL
Option 5 – Aspirational Water Loss Reduction $117.6 $1.95/kL1 /
≤$29.74/kL 3.3GL
1 Short-run marginal cost projects
A.10.5. Cost estimate
The cost estimate for the overall program for the forecast period is $32.8 million. This is broken up
into the four projects as:89
• District Metered Areas - $15.4 million
• Pressure Management - $10.3 million
• Active Leak Detection - $6.2 million
• Point Source Control - $1.0 million.
A.10.6. Procurement
Works proposed would be undertaken by separate consultant detail design and construction
contracts. This is appropriate for works of this nature.
A.10.7. Assessment of efficiency
Hunter Water currently has a high water loss compared to other similar utilities. Given this and the
introduction of the ELWC methodology, water loss initiatives are a key focus for the business going
forward. As a result, Hunter Water has proposed a considerable increase in expenditure relating to
water loss compared to previous.
The proposed program involves considerable capital expenditure investments in pressure
management and district meters. These two initiatives comprise over 85 per cent of the total capital
budget for the program. These initiatives are common among water utilities to address water loss and
it would be expected that a water utility, operating efficiently, would have these measures in place. It
89 Annual Information Return

AITHER | Final Report 230
Hunter Water expenditure review
is noted that this level of expenditure is not expected to continue into the future as a significant
proportion of the initial expenditure is unlikely to be required in the near future.
Following the review of the program, Aither considers that the initiatives proposed by Hunter Water
are appropriate to invest in from a water conservation perspective and are common for metropolitan
water utilities to manage water conservation. Initiatives in pressure management and district metering
areas are not considered unique and more of a ‘catch-up’ in water conservation measures.
The cost estimates were based on previous experience with the technologies or activities, while
estimates of water savings for each initiative were based on previous studies and work undertaken by
Hunter Water and other utilities (e.g. Sydney Water). Where Hunter Water proposed a range of
possible water savings for the initiative, it adopted an estimate at the lower end of that range as a way
of adopting a conservative approach in relation to water savings (and thereby creating a higher hurdle
for the ELWC).
Aither considers the concept of applying the SRMC and LRMC to value water depending on the type
of initiative to be reasonable. It provides an additional layer of analysis to acknowledge that not all
initiatives should be treated equally in relation to water savings.
As part of the ELWC Methodology, Hunter Water is required to produce an annual Conservation
Report. This Conservation Report essentially outlines Hunter Water’s performance in relation to its
conservation initiatives to ensure that the actual expenditure incurred by Hunter Water is consistent
with the ELWC Methodology.
Through discussions with Hunter Water, it was stated that all identified leaks were rectified by Hunter
Water as this was business-as-usual activities. These rectification costs are not captured as part of
the levelised cost estimate for the methodology. The calculation of the levelised cost was based on
only the upfront cost for identifying water savings with each initiative, where further rectification costs
are required to realise the water savings these costs have not been included. As an example, Hunter
Water has identified the upfront costs for active leak detection, however the costs of rectifying the
leaks have not been considered.
Aither considers it appropriate that these rectification costs be captured as part of the estimate of the
levelised costs within the ELWC Methodology. This is a more holistic approach to ensuring that the
capturing of water losses is economically efficient and beneficial to customers. The rectification costs
would vary depending on the size of the leak, however similar assumptions could be made to ensure
a levelised cost estimate.
The costs of rectification are generally relatively low and therefore we do not expect the change in the
levelised costs for the initiatives proposed by Hunter Water to result in the initiatives no longer being
viable under the methodology.
The expenditure proposed for the water loss reduction program for the forecast period is
considered efficient.

AITHER | Final Report 231
Hunter Water expenditure review
A.10.9. Recommended expenditure
It is recommended that the funds proposed by Hunter Water for this program of expenditure be
supported by IPART.
Table 116 Aither’s' recommended Capex for the upcoming determination period
Source Capex Budget ($000’s, 2019-20)
2016 2017 2018 2019 2020 2021 2022 2023 2024 2025
Hunter Water’s
submission
3,485 7,790 9,840 8,405 3,280
Aither’s
adjustment of
submission
- - - - -
Aither
recommendation
3,485 7,790 9,840 8,405 3,280

AITHER | Final Report 232
Hunter Water expenditure review
Document history
Revision:
Revision no. 6
Author/s Tim Ryan; Chris Plunkett; Alex Redmond; Rex Dusting; David Heeps, Nick Clarke
Checked Ryan Gormly
Approved Chris Olszak
Distribution:
Issue date Thursday 14 December 2019
Issued to Independent Pricing and Regulatory Tribunal
Description Hunter Water Expenditure and Demand Review: Final Report
Citation:
Aither 2019, Hunter Water Expenditure and Demand Review: Draft Report, Aither Pty Ltd.
For information on this report:
Please contact: Tim Ryan
Mobile: 0418 140 857
Email: [email protected]

© 2019 Aither Pty Ltd. All rights reserved.
This document has been prepared on the basis of information available to Aither Pty Ltd at the date of
publication. Aither Pty Ltd makes no warranties, expressed or implied, in relation to any information contained in
this document. This document does not purport to represent commercial, financial or legal advice, and should not
be relied upon as such. Aither Pty Ltd does not accept responsibility or liability for any loss, damage, cost or
expense incurred or arising by reason of any party using or relying on information provided in this document. Any
party that uses information contained in this document for any purpose does so at its own risk.
The information contained in this document is confidential and must not be reproduced, distributed, referred to or
used, in whole or in part, for any purpose without the express written permission of Aither Pty Ltd.