a review of capital budgeting decisions in namibia’s
TRANSCRIPT

A REVIEW OF CAPITAL BUDGETING DECISIONS IN NAMIBIA’S
STATE-OWNED ENTERPRISES
A THESIS SUBMITTED IN
PARTIAL FULFILMENT OF THE REQUIREMENTS FOR THE
DEGREE
MASTER OF BUSINESS ADMINISTRATION
OF
THE UNIVERSITY OF NAMIBIA
BY
TALASKA GALAGA KATJIRURU
STUDENT NUMBER: 9603794
MARCH 2016
SUPERVISOR: PROFESSOR RAINER LENZ (UNIVERSITY OF APPLIED
SCIENCES BIE

i
Abstract
The objective of this discourse was to investigate the use of capital budgeting decision
in Namibian State-Owned Enterprises. Firstly, to examine if Namibian SOE’s are
using capital budgeting methods (like IRR, NPV, payback period etc.) for investment
decisions? Secondly to analyze if SOEs risk assessment methods (sensitivity analysis,
scenario analysis or Monte Carlos simulation) and standards are in place pertaining to
capital budgets. A computerized environment with the assistance of SPSS software
was used to analyze the multivariate data obtained from structured questionnaire.
According to the survey findings; capital budgeting practices in SOE’s seem to have
improved in Namibia with the majority of companies using the sophisticated DCF
techniques. The ensuing recommendations are made: the line ministries responsible
to execute ownership control over the sample SOE’s should ensure that capital
budgeting methods are applied, and capital budgets should be submitted to the line
Minister, in relation to section 19 (1) of the SOE’s Act. Board member in terms of
section 18 (1) of the SOE’s Act should include capital budget decision made as part of
the performance agreements that have to be signed between the Minister and each
board member. On the operational level, there is a need to train state-owned enterprise
management teams on the basics of capital budgeting techniques to reduce the high
dependency rate of formal capital budget analysis on external consultants.

ii
Table of Contents Abstract ...................................................................................................................... 1-i
List of Figures ............................................................................................................. iv
List of Tables................................................................................................................ v
ACKNOWLEDGEMENTS ........................................................................................ vi
DEDICATION ........................................................................................................... vii
DECLARATION ...................................................................................................... viii
1 Introduction ........................................................................................................... 1
1.1 Orientation of the proposed study ................................................................. 1
1.2 Background of financial performance of SOE’s in Namibia ........................ 3
1.3 Statement of the problem .............................................................................. 7
1.4 Objectives of the study .................................................................................. 8
1.5 Hypotheses .................................................................................................... 9
1.5.1 Hypothesis 1 ........................................................................................... 9
1.5.2 Hypothesis 2 ......................................................................................... 10
1.6 Significance of the study ............................................................................. 11
1.7 Empirical study ............................................................................................ 11
1.8 Limitation of the study ................................................................................ 11
1.9 Definition of terms ...................................................................................... 12
1.10 The Organization of the thesis ..................................................................... 13
2 Literature review ................................................................................................. 14
2.1 Defining capital budgeting .......................................................................... 14
2.2 Capital Budgeting Evaluation Techniques and Risk ................................... 15
2.2.1 Discounted cash flow methods ............................................................ 16
2.2.2 Risk measurement methods ................................................................. 25
2.3 Real options ................................................................................................. 31
2.4 Models used in capital budgeting and Investments ..................................... 32
2.4.1 Portfolio theory and capital budgeting ................................................. 32
2.4.2 Capital Asset Pricing Model ................................................................ 34
2.4.3 Top down theory of capital budgeting ................................................. 37
2.4.4 Arbitrage Pricing Theory ..................................................................... 38
2.5 Good Corporate Governance ....................................................................... 39
2.5.1 Corporate Governance Theories ....................................................................... 40
2.6 Conceptual framework ................................................................................ 43
2.7 Summary ..................................................................................................... 46
3 Research Methodology ....................................................................................... 47
3.1 Introduction ................................................................................................. 47
3.2 Research design ........................................................................................... 47
3.3 Population .................................................................................................... 48
3.4 Research Sample ......................................................................................... 48

iii
3.5 Research Instrument .................................................................................... 49
3.6 Research Procedure ..................................................................................... 49
3.7 Data analysis ................................................................................................ 50
3.8 Data Collection ............................................................................................ 50
3.8.1 Primary data ......................................................................................... 50
3.8.2 Secondary data ..................................................................................... 51
3.9 Method of Analysis ..................................................................................... 53
3.10 Ethical considerations .................................................................................. 54
3.10.1 Respect for anonymity and confidentiality .......................................... 54
3.10.2 Respect for privacy .............................................................................. 54
3.10.3 Informed consent .................................................................................. 55
3.11 Summary ..................................................................................................... 55
4 Analysis and discussion ...................................................................................... 56
4.1 Introduction ................................................................................................. 56
4.2 Empirical Findings and Analysis of data .................................................... 56
4.2.1 Findings on descriptive statistics ......................................................... 56
4.2.2 Cumulative frequency for variables 14 capital asset size .................... 58
4.2.3 Findings on measuring the relationship between variables ................. 59
4.2.4 Summary of case processing Findings ................................................. 62
4.2.5 Findings on Demographic physiognomies of state-owned enterprises 67
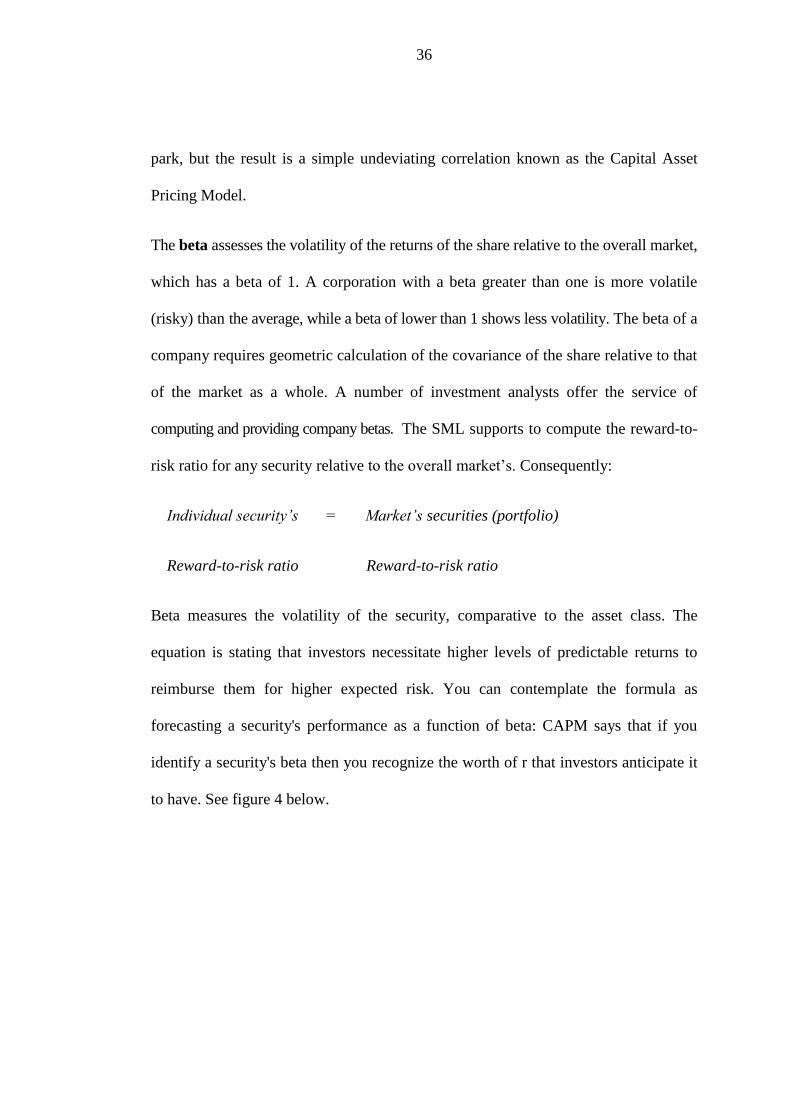
4.2.6 Capital project size ............................................................................... 67
4.2.7 Findings Capital projects average size formally analyzed. .................. 69
4.2.8 Findings on Formal capital projects analysis procedures .................... 71
4.2.9 Findings on lack of Control on Operating Expenses: .......................... 73
4.2.10 Research objective A............................................................................ 74
4.2.11 Research objective B: ........................................................................... 78
4.2.12 Research objective C: ........................................................................... 85
4.2.13 Research objective D: .......................................................................... 92
4.3 HYPOTHESIS TESTING ........................................................................... 98
4.4 Summary ................................................................................................... 101
5 Conclusion and recommendations .................................................................... 102
5.1 Introduction ............................................................................................... 102
5.2 Conclusion ................................................................................................. 102
5.3 Recommendations ..................................................................................... 105
5.4 Areas of further Research .......................................................................... 106
6 References ......................................................................................................... 107
Appendices ............................................................................................................... 111
Appendix A .............................................................................................................. 111
Appendix B .............................................................................................................. 119
iv
List of Figures
Figure 2. Multiple Internal Rates of Return 19
Figure 2.1 Decision Tree for SOE’s in the Selection of a Viable Projection 24
Figure 2.2 Simulations for NPV 28
Figure2.3 Market Security and Asset Class Linearity 37
Figure 2.4 Theoretical Framework 43
Figure 4. Frequency of the Size of Assets for SOE’s 69
Figure 4.1 Project Acceptance Rate 70
Figure 4.2 Presence of Formal Capital for Capital Projects for SOE’s 72
Figure 4.3 The most important and most difficult stages of Capital Budgeting 73
Figure 4.4 Capital Budgeting Techniques in use 76
Figure 4.5 Survey Evidence on the Popularity of different Capital Budgeting
Methods 78
Figure 4.6 Risk Assessment during Capital Budget Analysis 80
Figure 4.7 Namibia State Owned Risk Adjustment Procedures 82
Figure 4.8 Capital Decision Makers in SOE’s 86
Figure 4.9 The absence of standard operating Capital Projects outcomes for SOE’s 88
Figure 4.10 Expenditure Allocation for Namibian Government 90
Figure 4.11 Allocations of Capital Expenditure in Education is very little 91
Figure 4.12 Appointment of suitable members to serve NWR Board of Directors 92
Figure 4.13 Treatment of Shareholders and Indepence of mind 94
Figure 4.14 NWR financial data transparency 95
Figure 4.15 NWR Corporate Governance Board Ratings 97

v
List of Tables
Table 3.1 Research Sample 49
Table 4.1 Descriptive Statistics for Variables 1,8,10,11,12,13 and 14 58
Table 4.2 Cumulative Frequency for Variable 14 question 1 58
Table 4.3 Cumulative Frequency for Variable 19 question 5 59
Table 4.4 Correlations 60
Table 4.5 Case Processing Sum for SOE’s 64
Table 4.6 Size of Assets 68
Table 4.7 Capital Projects and Size 69
Table 4.8 Control on the Operating Expense 74
Table 4.9 Primary and Secondary Capital Budgeting Techniques in Use 77
Table 4.10 Highest Risk in Capital Budgeting 83
Table 4.11 Barrier in Real Options Implementation 87
Table 4.12 Most Preferred Capital Budgeting Methods in England and USA 89
Table 4.13 Sample 98
Table 4.14 Pearson Correlation Analysis 99

vi
ACKNOWLEDGEMENTS
My profound appreciation goes to several individuals who greatly contributed in some
way or the other to the realization of this thesis. Firstly, I shall thank my supervisor
Professor, Dr., Rainer Lenz who provided me with all the necessary guidance and
availed his precious time whenever I needed him most.
Secondly, I am grateful to my good friend D.R Mpunwa (DBA candidate) for proof
reading this thesis. Finally, I shall thank the entire management of the sampled SOE’s
to respond to the questionnaires and interviews.

vii
DEDICATION
I dedicate this thesis to my family Christa (wife), Nguvitjita (daughter) and
Rijandjee (daughter), relatives (the people with the blood of Katjiruru) and
fellow Omingondo villagers for their all-round support during my entire
academic life.

viii
DECLARATION
I, Talaska Galaga Katjiruru hereby declare that this study is a true reflection of
my own research and that this work or part thereof has not been submitted for a
degree at any other institution of higher education. Wherever contributions of
others are involved, every effort is made to acknowledge this clearly with due
reference to the literature.
No part of this thesis may be reproduced, stored in any retrieval system or
transmitted in any from or by means (e.g. electronic, mechanical, photocopying,
recording or otherwise) without the prior permission of the author or the
University of Namibia in that behalf.
I, Talaska Galaga Katjiruru grant the University of Namibia the right to
reproduce this thesis in whole or in part in any manner or format which the
University of Namibia may deem fit for any person or institution requiring it for
study and research; provided that the University of Namibia shall waive this right
if the whole thesis has been or is being published in a manner satisfactory to the
University.
………………………. ………………………………….
Talaska Galaga Katjiruru Date

1
1 Introduction
1.1 Orientation of the proposed study
In Namibia the government is encountering financial challenges facing State-Owned
Enterprises (SOE’s), more specifically in the area of capital projects being financed
and refinanced year after year without clear capital budgeting processes. To resolve
these challenges, it has promulgated the State-Owned Enterprises Governance Act
(Act 6, 2006). The act is established: “to make provision for the adequate governance
of state-owned enterprises and the checking of their performance; to make endowment
for the reorganization of state-owned enterprises; to institute the state-owned
enterprises governance council and delineate its authorities, onuses and tasks; and to
make provision for supplementary matters”, (State-owned Enterprises Governance
Act, 2006). Section 19 of the said act describes aspect of the Business and Financial
Section 19(3) of that governance act under the subheading “Business and Financial
plans”; list six items that are important for best financial performance of SOE’s,
irrespective the service or product provided by those SOE’s. This are listed as
subsections a) to f) of section 19(3).
In this study the researcher concentrates firstly on subsection (b) where the SOE’s are
required to submit a section of their business and financial plans constituting; “the
operating budget and the capital budget of the state-owned enterprise for the
subsequent financial year, with a depiction of the nature and scope of the activities to
2
be embarked on, encapsulating commercial strategies, pricing of products or services
and personnel requirements”; secondly subsection (d) where it is articulated that; “if
the state-owned enterprise anticipates to borrow money in the next financial year, a
universal suggestion of the borrowing plans of the state-owned enterprise for that
year”. The research proposal intents to investigate current capital budgeting practices
of SOE’s in Namibia, with specific attention to be given to capital expenditure
evaluation techniques that are normally employed in this important capital budgeting
decisions.
“Good financial management and capital investment decision making are precarious
to existence and long term accomplishment for firms”, (Bennounna, 2010).
“Sound/profitable capital budgeting decisions, inter-alia can have a salutary effect on
improving financial performance”, (Jain, 2012). Capital budgeting decision affects the
profitability of SOE’s, they have a marking bearing on its efficiency and competing
positions in the various industries as they relate to fixed assets, fixed assets are the
only earnings assets of a business enterprise, it is this asset which enable the firm to
generate production/sales, yielding profits. It should also be noted here that substantial
investments are needed for the acquisition and execution of capital budgeting
decisions, hence it is detained that incorrect investment decision have potential of
causing depression in the smooth functioning of even a well-run and efficient SOE.
Correct and sound capital budgeting decision can fetch spectacular returns and can be
instrumental in changing the fortunes of SOE’s that are currently in the spotlight for
all the wrong reason when it comes to financial performance, (Jain, 2012). As per
sound principles of financial management, long term investments/capital

3
expenditure/capital budget needs of the business enterprise should be financed from
permanent or long term sources of finance, (Jain & Yadav, 2005, p.38).
1.2 Background of financial performance of SOE’s in Namibia
State owned enterprises are often required to make decisions whose consequences are
felt over many years. Such decisions frequently involve large investments of money
and have uncertain actual outcomes that have long lasting effects on state-owned
enterprises.
Nonetheless the seeming virtues of capital budgets, opinions linger to be divided as
they have been during the past decades about the efficacy of capital budgets in
governments. In the present milieu in which some countries have budgetary surpluses
and use them to condense levels of public debt, there is bantam motivation to
resuscitate the debate about the prerequisite for capital budgets. A key challenge in
government budgeting is to express an appropriate balance between current and capital
expenditures. Poor long term investment decisions can affect the future firmness of an
organization because it is often challenging for state-owned enterprises to recover
money tied up in bad investments. Budgeting for government asset also remains not
well –assimilated into the formal budget preparation process in many countries.
Experience shows that in the nonexistence of properly systematized capital budgets,
governments resort to borrowing without due consideration of the sustainability
aspects, assets are incapably maintained and major projects suffer from largely poor
management and performance.
India reveals that higher cost of capital and ineffectiveness in technology usage are
not the important factors for reasons for failure for capital budget decisions. Issues to

4
do with the quality of capital projects, efficiency and the longevity of the projects
become probing questions for state-owned enterprises. (Singh, 2013)
State Owned Enterprises are continually faced with the problem of deciding whether
the current commitments of resources are worthwhile in terms of the present value of
the expected future benefits (Birman, 2013). If the benefits are likely to accrue
reasonably soon after the expenditure is made and if both the expenditure and the
benefits can be measured in dollars, the analysis of the problem is more simple than if
the expected benefits accrue over many years and there is considerable uncertainty as
to the amount of these benefits.
The general problem is that there are several methods used to evaluate capital
investments decisions, given the essence of capital investment not only for the country
but, also towards creation of shareholder’s wealth for individual state-owned
enterprises it may be helpful to investigate these practices used to evaluate these
projects.
The financial challenges facing State-Owned Enterprises can be articulated as follows,
in agreement with daily print media reports on SOE’s. After much toing and froing
between Cabinet committees over the year, a bill was lastly tabled in the National
Assembly last November”, (Dertlinger, 2013).
Privatization not the answer to SOE’s woes: Finance Deputy Minister Calle
Schlettwein says the privatization of SOE’s will not be the solution to government’s
headaches over their performance. Government should also encourage these

5
institutions to raise capital on the market. Schlettwein said another source of
inefficiency can be the lack of budget constraints, (Ihuhua, 2010)
Honorable Erkki Nghimtina has threatened to clamp down on under-
performing state owned enterprises falling under his ministry. Budgetary
constraints are topping the list with never-ending request for bail-outs, a
phenomenon the Namibia government will no longer tolerate, (Smit, 2013).
Poor budgeting cripple TransNamib. The financial mess that TransNamib finds
itself in cannot only be attributed to poor and ignorance of policy guidelines,
but started with a number of weaknesses identified during the annual
preparation of its budget, (Poolman, 2013).
From the above newspaper headlines and many more similar once on a daily basis in
Namibia, there is an impression that there seems to be financial performance problem
in Namibia’s SOE’s. This is similar to India as articulated by (Jain, 2012) when they
stated that “[t]here is a growing concern over poor financial performance of the central
public sector enterprises (PSE’s) in India”.
Notwithstanding the above current state of SOE’s in Namibia, it must be noted that
SOE’s have and will continue to play a major developmental role in the economies of
the world and Namibia is no exception. “Public investment has to play a fundamental
role in any pro-poor national development strategy, comprising the achievement of the
millennium development goals (MDGs)”, (Chang, 2007, p.6). “There is improved
interest in Ireland and many other countries in the part that state-owned enterprises
play in encouraging economic development” (Chang, 2013).

6
Chang also argues that there are respectable theoretical justifications for the existence of
SOEs for the following reasons:
Natural Monopoly: In industries where technological conditions
dictate that there can be only one supplier, the monopoly supplier may
produce at less than socially optimal level and appropriate monopoly
rents. Examples: railways, water, electricity
Capital Market Failure: Private sector investors may refuse to invest
in industries that have high risk and/or long gestation period. Examples:
capital-intensive, high technology industries in developing countries,
such as aircraft in Brazil or steel in the Republic of Korea (Chang,
2013)
Externalities: Private sector investors do not have the incentive to
invest in industries which benefit other industries without being paid
for the service. Examples: basic inputs industries such as steel and
chemicals
Equity: Profit-seeking firms in industries that furnish basic goods and
services may decline to serve less profitable customers, such as
underprivileged people or people existing in remote areas. Examples:
water, postal services, public transport, basic education (Chang, 2013)
It must further be noted; “despite the theoretical justifications for SOE’s and the many
examples of well performing SOEs, many SOE’s are not well run. Why? The most popular
explanation contains two elements: the principal-agent problem and the free-rider
problem, both based on the assumption of self -seeking individuals” (Chang, 2007, p.14).

7
The survey follows similar surveys conducted around the globe such as; Sandhl &
Sjogren 2002; Kester and Chong 2001; Kester, Chong, Isa, Skully & Wang 1999. This
survey is the first one of its kind in Namibia in general to focus on capital budgeting
of state-owned enterprise.
1.3 Statement of the problem
According to Peterson and Fabozzi, Capital budgeting is the process of analyzing
investment opportunities in long term assets which are expected to produce benefits
for more than a year (Bennounna, 2010). A dominant feature of any investment
analysis is discounted cash flow (DCF) methods, which take into consideration the
time value of money, is regarded as theoretically correct, and comprises at least four
discounting models: net present value (NPV), internal rate of return (IRR), modified
internal rate of return (MIRR), and profitability index (PI), stated by Brigham and
Ehrhardt (as cited in Bennouna et al. 2010, p.226).
Capital budgeting is the method by which firms govern how to invest their capital.
Encapsulated in this process are the decisions to invest in new projects, re-evaluate the
amount of capital currently invested in existing projects, apportion and ration capital
across divisions, and attain other companies (Gervas, 2013).
State Owned Enterprises are frequently required to make decisions whose
consequences are felt over many years. Such decisions frequently involve large
investments of money and have uncertain actual outcomes that have long lasting
effects on state-owned enterprises. Capital budgeting is a very complex and tedious
process that needs to be thoroughly checked and balanced. Investment decisions
involving the acquisition of long-lived assets are often referred to as capital

8
expenditure decisions because they require that capital (company funds) be expended
to acquire additional resources.
Investment decisions are also sometimes called capital budgeting decisions. Critical to
comprehending capital budgeting decisions is an appreciation of the time value of
money. Time value of money says that a Namibian dollar at present is worth more than
a Namibian dollar in the future. Consequently, there is always a need to change future
dollars into their corresponding present value.
Namibia’s SOE’s has to guard against skewed priorities towards white elephant’s
mega projects at the expense of economically productive activities. It is always noted
that an NPV greater than zero or an IRR greater than the required rate of return informs
managers that an investment opportunity will increase their firm’s value. Managers
should use these techniques to maximize shareholder wealth. However, a manager’s
performance (and bonus) is often measured on short-term accounting income. Thus,
there is an inherent conflict between what is good for the firm and what is good for the
manager.
1.4 Objectives of the study
The whole objective of this study is to make a review of capital budgeting decisions
in Namibia’s state-owned enterprises with specific reference:
A. To examine if Namibian SOE’s using capital budgeting methods (like IRR,
NPV, payback period etc.) for investment decisions?

9
B. To establish the kind of risk assessment methods (sensitivity analysis, scenario
analysis or Monte Carlos simulation) that state-owned enterprises are using in
approval of the underlying investment risk?
C. To determine the main barriers to the successful implementation of analytical
tools for investment decisions (like capital budgeting and risk assessment
methods) in Namibian SOE’s?
D. To establish the relationship between the use of financial investment methods
and Corporate Governance of SOE’s?
At the same time; with the survey results from this capital expenditures
implementation analysis, the researcher is able to also find answers to the SOE’s
specific challenges of principal-agent problem and the free-rider problem. Because it
is always said that: “given the self-seeking nature of humans, no SOE’s manager has
run the firm as efficiently as an owner-manager would run his own firm” (Chang, 2007,
p.14).
1.5 Hypotheses
1.5.1 Hypothesis 1
There is a relationship between financial investments and corporate governance of
State-Owned Enterprises in Namibia. For corporations located in countries with strong
corporate financial investments 𝑖 ≥ 1weak corporate governance allows managers to
follow their own goals at the shareholders’ expense. Were 𝑖 stands for financial
investments for state owned enterprise? Current research has focused on the conflict
between managers and shareholders. Where corporate governance is feeble managers
pay out not as much of in dividends and preserve larger fractions of their cash flows

10
to follow their own goals and this cause’s poor corporate investments. The other side
of paying out minute dividends is investing too much. This reason leads to expect 𝑖 ≤
1 in countries with weak corporate governance systems, corporate investments is
affected.
Some companies have striking investment opportunities, good corporate governance
and restricted financial resources (Tobin, 2013)however, both their leaders and their
shareholders benefit from their attaining high investments rates and rapid growth. For
these companies no battle between managers and shareholders over dividends and
investments policies exists. Indeed, these corporations are often fledgling firms in
rapidly growing industries –the kinds of companies that can agonize from asymmetric
information problems thus are to be expected to under invest so that 𝑖 ≥ 1. This
consideration leads to qualify our prediction (hypothesis) that for weak corporate
governance systems lead to poor corporate investment.
1.5.2 Hypothesis 2
Corporate Governance has no influence on corporate investments of State-Owned
Enterprises in Namibia. The findings supported by CBI/ Touch Ross 1995 directors’
opinions study which suggests that Cadbury (2002) recommendations have had no
positive impact on their corporate performance. The findings by Owusu (2012) states
that there is no direct evidence regarding the adoption and operation of the Ghanaian
code and its impact on corporate governance. This leads to the hypothesis that there
no direct correlation between corporate governance and corporate investments of state
owned enterprises (Cadbury, 2012).

11
1.6 Significance of the study
The researcher commends the Government of the Republic of Namibia for the
promulgation of the state-owned enterprise governance act that regulates all SOE’s
and that it must strictly be adhered to. However, the question at the back of the
researcher mind is to find out whether the guidelines in the SOE’s governance act is
indeed adhered to by Namibia’s SOE’s, especially the capital budgeting part thereof?
The research aims at finding out whether there are practical steps taken by the SOE’s
governance council to monitor and evaluate the subsequent outcome of the guidelines
provided in the SOE’s governance act specific to capital budgets? Also despite the
guidelines from the SOE’ governance act; the researcher could not find any studies on
SOE’s capital budgeting decision making processes in Namibia. The desire to provide
answers to this knowledge gap is the motivation for this research study.
1.7 Empirical study
The measuring instruments were administered to state-owned enterprises in Namibia.
To ensure that there is validity and reliability, Cronbach’s (coefficient of internal
consistency) was employed using Statistical Package for the Social Sciences (SPSS)
analysis. The names of the employees in the respective enterprises were treated as
highly confidential. A detailed discussion of the empirical study was furnished in
chapter five.
1.8 Limitation of the study
The research study was only limited to the findings of effective capital budgeting
decision making and not necessary the overall financial performance of SOE’s in
Namibia. At the same time SOE’s are also classified in the Namibian economy based

12
on different tiers, i.e. tier one, two and three respectively. The categorizing of tiers is
based on the size of revenue, staff compliment and total fixed assets under the care of
those specific SOE’s. The SOE’s in Namibia also have different functions according
to the mandate obtained from their establishing legislature; the functions vary in the
following different categories:
Economic and productive
Regulatory
Service rendering
State-owned enterprises are frequently required to execute multiple and sporadically
conflicting objectives, i.e., to attain loss-making communal policy goals (e.g.
universal service obligations, constant tariffs regardless of the costs of provision)
while operating commercially (Forfas, 2010, p.4). As a result of the various mandate
and specific reason for the establishment of these different types of categories
classifying SOE’s, the study is limited to the category of economic and productive
SOE’s because they are the once required to at least operate economically (Forfas,
2013). These SOE’s have to show financial performance
1.9 Definition of terms
Capital budgeting
Pamela and Peterson (2012:2) delineates capital budgeting as the process of
recognizing and choosing investments in long-lived assets or assets expected to
generate benefits over more than one year
Internal rate of Return

13
The internal rate of return is the discount rate at which the present value of expected
cash inflows from a project equals the present value of expected cash discharges of the
project. IRR is sometimes called the time adjusted rate of return.
Probability index Technique The profitability index (P.I) is the ratio of the present
value of change in operating cash inflows to the present value of investment cash
discharges s.
1.10 The Organization of the thesis
This research study covers the following outlines:
The beginning covers the study’s introduction, issues of capital budgeting, State
Owned Enterprises research objectives, research questions, significance of the
research and limitation of the study. Secondly it covers the introduction to the second
chapter, which include; conceptual framework, other capital budgeting theories,
capital budgeting techniques and reviews of literature. Chapter three covers the
research methodology, research design, population of the study, research sample,
research instruments, and data analysis and research ethics. Consequently, it has an
outline of the research findings; data analysis, and discussion of research objectives.
At the very end it covers the research conclusion and recommendations establishing
links between the study findings and the current situation before concluding with
references.

14
2 Literature review
In this section the researcher reviews the concept of budgeting in general, followed by
a review of the features relating to capital budgeting, synthesis the work of previous
research on capital budgeting as obtained, ending with a brief overview of cost of
capital and risk consideration, which comprise an essential part of capital budgeting.
2.1 Defining capital budgeting
Pamela and Peterson (2012:2) define capital budgeting as the process of recognizing
and choosing investments in long-lived assets or assets expected to generate benefits
over more than one year. Companies intermittently invest funds in assets and these
assets generate income and cash flows that the firm can either plough back in more
assets or pay to the owners. These assets embody the firm’s capital. Pamela and
Peterson (2012: 1) define capital as the firm’s total assets. It encapsulates all tangible
and intangible assets. The lexis capital also has come to mean funds employed to
finance the firm’s assets. In this sense capital encompass of notes, bonds, stock and
short term financing. (Pamela and Peterson, 2013) The lexis capital structure refers to
the synthesis of these diverse sources of capital used to finance a firm’s assets. The
company’s capital investment decision may be made up of a number of diverse
decisions, each referred to as a project and this project may impose the firm to increase
its investment in its working capital.
“On a tactical level, budgeting elucidates its competitive priority, advantages and
strategies for the future, employing cost forecast and demands limits to quantitatively

15
measure the feasibility of capital expansion projects”, The Controller Report as cited
in (Fruitticher et al. 2005). For premeditated purposes budgets provide expedient
information tools and control mechanism to company leaders, as well as partitioning
decisions rights with those holding unambiguous knowledge about the operation,
(Fruitticher, 2013). Little, Nace & Welker argues “budgeting is one of the ultimate
decision making processes in an organization. During budget formulation, officials
govern the portion of organizations assets that the manager of each unit will be
authorized to spend budgets often establish performance goals for the unit in terms of
cost, revenue and/or productions”, (Fruitticher, 2013).
Working capital is the assortment of assets needed for day to day operations that
support a firm’s long term investments. The investment decisions of a firm are
decisions regarding firm’s capital investment. Capital budgeting is unending process
and before a firm think about capital budgeting it must articulate its corporate strategy.
For example, Walt Disney company objective is to be the world’s premier family
entertainment company while Mattel manufacturer of toys such as Barbie and Disney
toys, Mattel strategy turned out to be a full line toy company and grow through
expansion into international toy company. How does a corporation attain its corporate
strategy? By making investments in long –lived assets that are maximize owner’s
wealth and selecting these projects is what capital budgeting is all about.
2.2 Capital Budgeting Evaluation Techniques and Risk
The worth of a company at present is the existing worth of all its future cash influxes.
These future cash influxes come from resources that are formerly in place and from

16
future investment opportunities. These future cash influxes are discounted at a rate that
represents investor’s assessments of improbability and when expected:
Worth of firm = Present value of all future cash influxes
= Present value of cash influxes from all assets in place
+ Present value of cash influxes from future investment opportunities.
The aim of the financial manager is to get the best out of the value of the firm and
subsequently owner’s wealth. The capital budget decision for a project involves
investigation: of its future cash flows, the extent of uncertainty linked with these future
cash flows, the value of these future cash flows bearing in mind uncertainty.
2.2.1 Discounted cash flow methods
The discounted cash flow measures the cash influxes and discharges of a project as if
they become apparent at a single point in time so that they associated in an appropriate
way. The discounted cash flow methods make a distinction on the use of money has
an opportunity cost –return forgone. The DCF methods explicitly and consistently
weight cash flows by the time value of money; they are often well-thought-out as better
methods to use for long-run decisions. Cash is invested now with the anticipation of
receiving a greater amount of cash in the future. Injecting accrual concepts of
accounting into DCF analysis should be circumvented as it creates confusion. There
are two methods of DCF which are net present value and internal rate of return.
2.2.1.1 Net Present –Value Method
NPV is computed using the required rate of return (RRR) which is the bottommost
acceptable rate of return on an investment. Gitman (2011) articulates it is the return

17
that the body could expect to receive elsewhere for an investment of corresponding
risk. This proportion is also called the discount rate, hurdle rate or opportunity cost of
capital because it typically must surpass the cost of funds as determined by the return
predicted by those who provide funds.
𝑁𝑃𝑉 = ∑𝐶𝐹𝑡
(1 + 𝑘)𝑡
𝑛
𝑡=1
− 𝐶𝐹0
= ∑ (𝐶𝐹𝑡𝑛𝑡=1 𝑥 𝑃𝑉𝐹𝐼𝑇𝑡) − 𝐶𝐹0
Where:
t = time of cash flow ; k = discount rate; CF = Net cash flow; PVIF = Present
value interest factor
The computation of NPV is as follows: Net present value of cash inflows –initial
investments. When working with IRR, the RRR is used as a point of contrast. Since
the cost of capital and the RRR are profoundly the same concept (Peterson, Pamela
and Fabozzi 2013:65) alludes that but from divergent perspectives the terms are used
interchanging ably in capital budgeting.
Given the irrevocable nature of a capital budgeting decision and its repercussions for
the growth, profitability and above all, even the continued existence of the firm, the
adoption of theoretically correct and sound evaluation techniques assumes paramount
significance (Jain & Yadav, 2010, p.41). “One of the pillars of finance theory is that
the worth of an asset or investment is identical to the discounted present value of its
future cash flows. The NPV rule states that if the present value of the projects future
cash flow surpasses the cost of the project, then the firm should accept the project. If

18
the NPV is negative, the firm should reject the project. Only project with positive net
present value are tolerable. Why? Because the return from these projects surpasses the
cost of capital. Bhimani, Horngren, Datar and Rajan (2012:414) articulate “Managers
favor projects with higher NPVs to projects with lower NPVs, if all other things remain
ceteris paribus”. When integrating inflation into the net present value they are two
internal consistent approaches which are nominal approach which predict cash inflows
and outflows in nominal monetary units and use nominal rates as the required rate of
return. Peterson, Pamela and Fabozzi 2013:66) states that real approach predicts cash
inflows and outflows in real monetary units and use real rate as the required rate of
return.
2.2.1.2 Internal Rate of Return
Gitman (2013) defines the internal rate of return as the discount rate at which the
present value of anticipated cash influxes from a project matches the present value of
expected cash discharge of the project. IRR is sometimes called the time adjusted rate
of return. (Gitman, 2013) As in the NPV method, the sources of cash flows and the
accounting treatment of individual cash flows are extraneous to the IRR calculations.
When a decision has to be made the ensuing conditions is used if IRR is bigger than
cost of capital accept the project. If the IRR is of a smaller amount than the cost of
capital reject the project. The IRR can be computed as follows:
$0 = ∑𝐶𝐹𝑡
(1 + 𝐼𝑅𝑅)𝑡
𝑛
𝑡=1
− 𝐶𝐹0
∑ 𝐶𝐹𝑡
(1+𝐼𝑅𝑅)𝑡𝑛𝑡=1 = 𝐶𝐹0

19
The appropriate discount rate should be the opportunity rate of return as measured by
the firms weighted average cost of capital (WACC). Whilst financial theory has
endorsed discounted cash flows (DCF) methods in relation to such naive methods as
payback and accounting rate of return, there may be conflict between the DCF method
of NPV and the IRR.
Multiple Internal rates of return
The archetypal project usually encompasses not only one large negative cash flow
initially followed by series of future positive flows. But, that is not continuously the
case in most of the times. If a company is involved in a project that uses
environmentally sensitive chemicals. It may cost a great deal to sell them, which will
cause a negative cash flow at the end of the project (Gitman, 2013).
Figure 2. Multiple internal rates of return
Source CIMA (2013)
As can be comprehended from the figure above that where the NPV of these cash flows
are made known for discount rates from 0% to 300%. The IRR is the discount rates

20
from 0% to 300 %. The IRR is the discount rate that attracts the NPV to be zero. The
present value deviates from negative to positive or from positive to negative at 265%.
Manifold elucidations yield on a series of cash flows take place whenever there is more
than one change from + to – or from – to +. There are also two conceivable solutions
for IRR, one for each sign change.
Furthermore, whilst academics have long promoted the use of NPV, owing to the
deficiency of IRR, until recently, firms have preferred to use IRR as a primary method
to evaluate capital projects” (Correia & Cramer, 2008, p.33). According to Bennouna
et al. 2010 “accepting DCF and NPV precisely, is only the first step towards effective
capital budgeting, it is crucial to ensure that capital expenditure techniques are
appropriately exploited which include the following:
Cash flow estimation, Discount rate, multiple discount rate and risk, Risk analysis
methods, emerging approaches – real options, Administrative procedures
(Bennounna, 2010)
“Cost of capital constitutes a vital part of capital budgeting in that it makes available
a yardstick to measure the worth of investment study and, thus executes the role of
accept/reject criteria. The accept/reject rule requires that a business enterprise avail of
only such investment opportunities as promise a rate of return higher than cost of
capital. Contrariwise the enterprise would be well instructed to reject projects whose
rate of return are less than the cost of capital. The cost of capital thus, offers a rational
mechanism for making best investment decision” (Jain & Yadav, 2010, p.43).
According to Chang, the argument is that, being part of the government, SOE’s are
able to secure superfluous finances if they make losses and get rescued with public

21
money if they are exposed with bankruptcy. In this way, it is further argued; SOE’s
can act as if the limits to their budgets are malleable, or “soft” (Chang, 2010, p.15).
Even though many SOE’s do get bailed out by the state in this way, there is also a facet
of cost of capital to conclude in the form of opportunity cost lost due to the budget
allocation to duplicated efforts of wrong capital budgeting decisions as well as the cost
of capital the governments incurs in raising funds on the capital markets to bail out
those SOE’s.
2.2.1.3 Payback Period
The payback period is universally used to calculate planned investments. The payback
period is the amount of time needed for the firm to convalesce its initial investment in
a project as computed from cash influxes. (Gitman, 2013) In the case of annuity, the
payback can be found by allotting the initial investment by the annual cash inflow. For
an assorted stream of cash influxes, the yearly cash influxes must be accrued until the
initial investments is recovered. The payback is well-thought-out to be the ingenuous
capital budgeting technique because it does not unambiguously reckon the time value
for money. When a payback is used to give and take decisions, the decision criteria is
that if the payback is less than the maximum acceptable payback period accepts the
project. If the payback is greater than the maximum acceptable payback period rejects
the project (Gitman, 2013).
The length of maximum acceptance is set by management. This value is set intuitively
on the basis of a number of factors comprising of the type of a project, the perceived
risk of the project and the supposed relationship between the payback period and the
share value. The main challenge of the payback is that the suitable payback period is

22
purely a subjective determined number. It cannot be quantified in light of the wealth
maximization objective because it is not grounded on discounting cash flows to decide
whether they add to the firm’s value. The second challenge is that this tactic fails to
take into account the time factor in the value of money (Gitman, 2013).
2.2.1.4 Profitability index technique
The profitability index (P.I) is the ratio of the present value of variation in operating
cash influxes to the present value of investment cash discharges:
P1 = 𝑷𝒓𝒆𝒔𝒆𝒏𝒕 𝒗𝒂𝒍𝒖𝒆 𝒐𝒇 𝒕𝒉𝒆 𝒄𝒉𝒂𝒏𝒈𝒆 𝒊𝒏 𝒐𝒑𝒆𝒓𝒂𝒕𝒊𝒏𝒈 𝒄𝒂𝒔𝒉 𝒊𝒏𝒇𝒍𝒐𝒘𝒔
𝒑𝒓𝒆𝒔𝒆𝒏𝒕 𝒗𝒂𝒍𝒖𝒆 𝒐𝒇 𝒕𝒉𝒆 𝒊𝒏𝒗𝒆𝒔𝒕𝒎𝒆𝒏𝒕 𝒄𝒂𝒔𝒉 𝒐𝒖𝒕𝒇𝒍𝒐𝒘𝒔
As a substitute the difference between the two present values as in the present value
NPV calculation, PI is the proportion of the two present values. Consequently, PI is a
deviation of NPV. By creation if the NPV is zero, P1 is one. The profitability index
elucidates how much worth we attain for each dollar capitalized. If the PI is more than
one, we get more than $1 for each $1 capitalized. If the P1 is less than one, we get less
than $1 for each $1 capitalized. Consequently, a project that rises owners’ wealth has
a P1 greater than one. Rebuffing or accepting investments having PI ‘s greater than 1
.0 is unswerving with rejecting or accepting investments whose NPV is greater than
$0.
2.2.1.5 Accounting rate of return
The accounting officer should be able to compute the accounting rate of return (ARR)
of a project. There are abundant ways of writing the ARR formula. Whichever the
accounting officer selects, be sure to use the same one throughout the calculation. It
may be that the question explicitly tells you to use a certain ARR formula:

23
𝐴𝑅𝑅 = 𝐸𝑠𝑡𝑖𝑚𝑎𝑡𝑒𝑑 𝑎𝑣𝑒𝑟𝑎𝑔𝑒 𝑝𝑟𝑜𝑓𝑖𝑡𝑠 𝑥 100%
𝐸𝑠𝑡𝑖𝑚𝑎𝑡𝑒𝑑 𝑎𝑣𝑒𝑟𝑎𝑔𝑒 𝑖𝑛𝑣𝑒𝑠𝑡𝑚𝑒𝑛𝑡
To calculate the worthiness of the average investment you must first sum the initial
investment cost to the residual value. Many financial managers make the mistake of
thinking that the average investment is calculated by taking the residual value from the
initial cost (CIMA, 2014).
2.2.1.6 Average rate of return
The rate of return on an investment that is computed by taking the total cash influx
over the life of the investment and dividing it by the duration in the life of the
investment. (CIMA, 2014) The average rate of return does not assurance that the cash
influxes are the same in a given year; it simply assurances that the return averages out
to the average rate of return.
2.2.1.7 Capital budgeting decisions and Hurdle rates
Each financial manager is dependent on expertise and by and large limitations of
managerial and organizational capital within the company face an opportunity set of
unconventional projects (Mancosa, 2015). Taking a project today may proscribe taking
another eye-catching project in the future. In that scenario deciding against a positive
NPV may be profitable and the question is when a manager should accept a project.
The prospect to attain a project in future is just an option and there is no tree cutting
example vis-à-vis that option. To value a project, it is perilous to use an exact
approximation of cost of capital. A company that has real options should be able to
approximation the cost of capital for it to make precise options.

24
2.2.1.8 Decision Trees
Beasley and Brigham (2005) articulates “decision trees are an interactive approach that
uses diagrams to map the numerous investment decisions alternatives and payoffs
along with their likelihoods of occurrence”. Their names are an etymology to the
branches of trees as illustrated in the figure below. Decision trees depend on estimates
of the probabilities related to the outcomes of competing courses of action. The
payouts of each course of action are weighted by the associated probability, the
weighted payouts are summed and the expected value of each course of action is then
determined. (Beasley, 2014) The alternative that provides the highest value is
preferred. When a state-owned enterprise wishes to choose between viable projects I
and J the decision tree can be computed as follows:
Figure 2.1 Decision tree for SOEs in the selection of a viable projection

25
Source (Gitman, 2013)
Project J will be selected because it has higher NPV of 15 000 unlike project that has
lower NPV of $10 000.
2.2.1.9 Capital Rationing
“Firms commonly operate under capital rationing –they have more accepted
independent projects than they can fund. Most firms operate under capital rationing”.
(Brealey , Myers & Framclin, , 2014). By and large firms attempt to ghettoize and
select the best acceptable projects subject to capital expenditure budget set by
management. Research has found that management internally implements capital
expenditure restrictions to circumvent what it deems to be inconsistent levels of new
financing, particularly debt. (Beasley, 2014)The objective of capital rationing is to
handpick the group of projects that offers the highest commonly net present value and
does not require more dollars than are budgeted. As an essential capital rationing the
unsurpassed of any mutually exclusive projects must be selected and placed in the
group of independent projects. (Beasley, 2014)
2.2.2 Risk measurement methods
2.2.2.1 Sensitivity Analysis
Investments are one of the central factors of economic growth. In market economy, a
vital condition for continuous viability and development of enterprises is the efficacy
of capital invested in projects. The decision to finance certain project is determined by
the goals which the company has set to itself. One of the methods in sensitivity analysis
is to show the extent the viability of a project is predisposed by variations in major
quantifiable variables. Sensitivity analysis judge the risks by recognizing the variables

26
that most influence a project’s net benefits and quantifying the degree of their
influence. Sensitivity analysis assists a manager to emphasis on those decisions that
are most sensitive and affluences the manager’s mind about those decisions which are
not so delicate. (Horngren, 2015)
Due to the application of sensitivity analysis (SA) it is conceivable to indicate those
variables to which NPV is most profound and the extent to which these variables may
change before the investments results in a negative NPV. Sensitivity analysis helps out
to find out why a project may fail. Subsequently, it is necessary to review any critical
variables to assess whether there is a strong possibility of events occurrence leading to
negative NPV. (Horngren, 2015) Sensitivity analysis helps identify the “what If”
question. Generating answers to what if questions were help assess how well a study
was stand up to scrutiny. Sensitivity analysis assists in identifying the worthiness of a
project. Brealey, Myers and Framclin (2006) despite the preceding advantages of
sensitivity analysis the major hitches for sensitivity analysis is that it does not take into
account the probabilities of events occurring. The next disadvantage of sensitivity
analysis is that it does not take into account the correlation among variables. In practice
all variables affect the results of the project and at the same time impair or improve
NPV resulting value (E.F, Besly and Brigham, 2013).
2.2.2.2 Scenario Analysis
Bigham and Davies (2012) states “Scenario analysis is a behavioral method similar to
sensitivity analysis but wider in scope. It assesses the impact on the firm’s return of
concurrent changes in a number of variables such as cash influxes, cash discharges s
and the cost of capital.” The state owned enterprise could assess the impact on the

27
firm’s return of concurrent changes in a number of variables such as cash influxes,
cash discharges s and the cost of capital. The state-owned enterprise could appraise the
impact of both inflation and low inflation on a project’s NPV. The decision maker can
use these estimates to analyze the risk involved the rate of inflation. The Capital
budgeting process is the effective handling of risk which is a significant but
multifaceted task. (Lumby S and Jones, C, 2013) Since the element of insecurity in
estimates of future cash flows, economic life of project and cost of capital cannot be
completely eliminated, each firm is expected to be familiar with and explicitly deal
with risk, (Jain & Yadav, 2010: 44). “The Irish and global economy has changed
ominously since the creation of many of their SOE’s. In the absence of regular reviews,
there are risks that SOE’s can drift from their founding goals or that individual SOE’s
goals may not reflect current national economic development needs” (Forfas, 2007:4).
Namibia being a new born Republic in 1990 is no exception to the changes of its own
economy as well as the global economy, consequently, greater risk consideration was
including Namibia’s economy specific risk and the global economy risk affecting the
researchable SOE’s and market risks are specific to the sample SOE’s.
2.2.2.3 Simulations
The process of generating random numbers and using the probability distribution for
cash inflows and cash discharges s enables the financial manager to govern values for
each of these variables. Although the gross cash inflows and cash discharges s are
simulated in the figure below urbane simulations include sales volume, sales price,
raw materials cost, labor cost. Maintenance expense and so on. One of the most
popular simulation models is Monte Carlo simulation models.

28
From the distribution of returns, the decision maker can conclude not only the expected
value of the return but also the probability of attaining or surpassing a given return.
The use of computers makes the simulation approach feasible. The output of
simulation provides a tremendous basis for decision making because it enables the
decision maker to review a continuum of risk return trade-offs rather than a single –
point estimate.
Figure 2.2 Simulations for NPV
Source Gitman (1997)
2.2.2.4 General risk premium
A return to recompense the investor for assuming differentiated company-wide risk
(Gitman, 2013). The weighted average cost of capital (WACC) is to a lesser amount

29
of the risk-free rate is the general risk premium”. The WACC is evaluated by
weighting the standard company dues and equity costs by the distinctive company debt
and equity capital percentages, and then totaling the weighted costs. If one were
evaluating companies, the WACC would be the discount rate since it replicates the
market's expected yields from the stock and debt of a company (Gitman, 2013).
2.2.2.5 Specific risk premium
A return that recompenses the investor for presupposes the unique risks interconnected
with a specific investment. The discount rate less the WACC is the Investment-specific
risk premium. Investors demand a premium beyond the WACC to pay off for this
individual investment risk. (Mancosa, 2015) For certain high-risk investments, this
premium can be quite high.
2.2.2.6 Risk adjusted discounting rates
A general approach for risk adjustment encompasses the use of risk adjusted discount
rates (RADRs). This approach uses this formula below for NPV calculation and then
adjust the risk
𝑁𝑃𝑉 = ∑𝐶𝐹𝑡
(1 + 𝑘)𝑡
𝑛
𝑡=1
− 𝐶𝐹0
= ∑ (𝐶𝐹𝑡𝑛𝑡=1 𝑥 𝑃𝑉𝐹𝐼𝑇𝑡) − 𝐶𝐹0
The risk adjusted discount rate (RADR) is the proportion of return that must be
acknowledged on a given project to recompense the firm’s owners satisfactorily that
is to preserve or improve the firm’s share price (Lumby S and Jones, C, 2013).
Financial managers, for that reason, assess the total risk of a project and use it to

30
regulate the risk adjusted discount rate the formulae for risk adjusted discount rate
(RADRs) can be computed as follows:
𝑁𝑃𝑉 = ∑𝐶𝐹𝑡
(1 + 𝑅𝐴𝐷𝑅)𝑡
𝑛
𝑡=1
− 𝐶𝐹0
RADRs fame stems from the fact that they are unswerving with the general disposition
of financial decision makers toward rates of return and they are straightforwardly
estimated and applied (Gitman, 2013). The first reason is noticeably a matter of
personal favorite, but the second is grounded on the computational expediency. State-
owned enterprise should create a number of risk classes with an RADR assigned to
each. Each project is then instinctively placed in the appropriate risk class and
associated RADRs. The employment of divisional costs of capital and accompanying
risk classes expedites state-owned enterprise to integrate incongruous levels of
divisional risk into the capital budgeting process and differentiate differences in the
levels of individual risks.
Innumerable studies have been accompanied in the USA regarding the techniques and
procedures used in evaluating risk in capital investment decisions (Bennounna, 2010).
71% of their respondents unequivocally considered risk and uncertainty. It was found
that 42.7% of these respondents adjusted for risk by accruing the lowest rate of return
or the cost of capital (Gitman, 2013). The major concern of the risk adjusted rate can
be idiosyncratic as risk cannot be quantified properly. In a similar study conducted by
Jog & Strivastava in Canada 1991, the employment of idiosyncratic, disparaging and
non-standard procedures in the estimation of cash flows, risk analysis and estimation
of appropriate cost of capital or discount rate was found to be relatively high.

31
Approximately a quarter of those participants did not have a proper risk analysis
procedure in place (Jog & Srivastava , 2014).
2.2.2.7 Return required for the Project’s Market Risk
When defining the premium for bearing the market risk this is done by stipulating the
premium for bearing the arithmetic mean amount of risk for the market as a whole.
Then employing the measure of market risk, fine tune this to reveal the market risk of
the assets. The market risk premium for the market as a whole is the variance between
the average expected market return, 𝒓𝒎 and the risk-free rate of interest 𝒓𝒇
If a state –owned enterprise acquired a resource whose market risk was identical as
that of the place where buyers and sellers meet as unabridged the expected yield of
𝒓𝒎 − 𝒓𝒇 to pay compensation state owned enterprise for market risk. (Beasley, 2014)
The market risk premium can be attuned of the specific project by multiplying it by
that project’s asset beta 𝜷𝒂𝒔𝒔𝒆𝒕 : 𝑪𝒐𝒎𝒑𝒆𝒏𝒔𝒂𝒕𝒊𝒐𝒏 𝒇𝒐𝒓 𝒎𝒂𝒓𝒌𝒆𝒕 𝒓𝒊𝒔𝒌 =
𝜷𝒂𝒔𝒔𝒆𝒕 ( 𝒓𝒎 − 𝒓𝒇) This is the supplementary return essential to recompense for the
project’s market risk. The 𝜷𝒂𝒔𝒔𝒆𝒕 fine tunes the risk premium for the market as a whole
to show the market risk of an exact project. When the risk premium is added back to
the cost of capital becomes;
𝑪𝒐𝒔𝒕 𝒐𝒇 𝒄𝒂𝒑𝒊𝒕𝒂𝒍 = 𝒓𝒇 + 𝜷𝒂𝒔𝒔𝒆𝒕(( 𝒓𝒎 − 𝒓𝒇) (Beasley, 2014)
2.3 Real options
A significant challenge for state-owned enterprise is dealing with risk. The old-
fashioned methods of evaluating projects are being challenged by an unconventional
approach that applies option pricing methods to real assets denoted to as real options

32
valuation (ROV). The interest in ROV emanates from the fact that the out-of-date
methods do not envisage directly the options manageable in many investments
projects.
Contemplate the typical options intrinsic in an investment opportunity 1) most every
project has an option to intemperance though there may be constrictions that affect the
option 2) many projects in state owned enterprise have the option to expand and 3)
many projects in state-owned enterprise have a choice to defer investment, putting off
the main investment expenses to some future date (Forfas, 2013). So how to reflect
these options within the background of the traditional methods? One method is to use
sensitivity analysis or simulations analysis. (Bennounna, 2010) Another tactic is the
use of decision tree analysis correlating probabilities to each of the possible results for
an event and mapping out the conceivable outcomes and the value of the investment
opportunity linked with these different outcomes (Birman, 2013). The rudimentary
idea of ROV is to contemplate that the price of a project goes beyond its assessment
as measured by the net present value.
𝑻𝒉𝒆 𝒔𝒕𝒓𝒂𝒕𝒆𝒈𝒊𝒄 𝑵𝑷𝑽 = 𝑺𝒕𝒂𝒕𝒊𝒄 𝑵𝑷𝑽 + 𝑽𝒂𝒍𝒖𝒆 𝒐𝒇 𝒕𝒉𝒆 𝒐𝒑𝒕𝒊𝒐𝒏
2.4 Models used in capital budgeting and Investments
2.4.1 Portfolio theory and capital budgeting
Every financial manager of a business will reckon the total risk of the business
prudently and endeavor to manage the risk in such a way that shareholders obtain the best
advantage. From an investment analysis point of view, investors reckon the most
effective way of investing funds. Brealy, Myers and Framclin (2006) says “It is well

33
known that placing all one's funds in one investment only is riskier than thinning out the
funds. This is known as diversification and the different investments, into which one
diversifies is known as a portfolio of investments”.
The portfolio theory has been developed further in current years. The theory holds that
rational investors all hold a portfolio rather than investing in a single investment. The effect
of this is that risk is less through holding a portfolio. Portfolio theory categorizes two
types of risk: systematic and unsystematic risk. Systematic (market, non-diversifiable,
nonspecific) risk relates to the economy and the stock market as a whole. Share prices
by and large are subject to fluctuations. Any investor who invests in these markets must thus
be subject to this risk as it cannot be eradicated through diversification. Unsystematic
(specific, diversifiable) risk relates to specific investments. This risk can be abolished
through investing in a portfolio. Quite simply, it is based on the principle that some
companies will achieve more when others do desperately and vice versa. The differences
between company risks can be eliminated, but the overall market risk cannot and everyone
has to dance to its tune, at least in the short run period (Brealey , Myers & Framclin, , 2014).
Portfolio analysis is expedient for diversifying through the firm’s investment
decisions. Applied to selection of investment proposals, portfolio theory has a number
of precincts. Probabilities of different outcomes must be estimated: fairly easy for
(e.g.) machine replacement; more difficult for (e.g.) new product development.
Shareholder preferences between risk and return may be problematic to know and
personal taxes may impact. “Portfolio theory is based on the idea of managers
evaluating the applicable probabilities and deciding the combination of activities for
the business. Managers have their job security to consider, while the shareholder can

34
easily buy and sell securities.” (Beasley, 2014). Managers may, therefore, be more risk
averse than shareholders, and this may distort managers’ investment decisions.
Projects may be of such a size that they are not easy to divide in harmony with
recommended diversification principles. The theory undertakes there are constant
returns to scale, in other words that the percentage returns provided by a project are
the same however much is invested in it. In practice, there are may be economies of
scale received from making a larger investment in a single project. Other facets of risk
not covered by the theory may need to be well-thought-out, e.g. Bankruptcy costs.
The portfolio approach to capital budgeting solve some challenges. The major
contribution includes procedures to consider a project and to measure a risk formally.
In portfolio model the decision to invest in an asset is partially a function of the asset’s
impact on the expected return of the firm. The investment decision is also a function
of the variance of the expected return. The potential investment and the co-variance
between the expected return and the expected returns to the other assets of the firm.
The challenge with the portfolio investment is that it focuses on the rates of return and
the risk associated with rates of return so that the lumpiness of the project and
economies of scale are not considered in investment decisions. One popular extension
of portfolio theory, the capital asset pricing model is an equilibrium model. The
critique of the CAPM is that the capital pricing model may not be useful in capital
budgeting.
2.4.2 Capital Asset Pricing Model
The CAPM was propounded by Harry Markowitz in 1962, and this work was
answerable for his winning the Nobel Prize some years later. Based on the natural

35
stability between risk and return of any given investment, Markowitz organized a
theory for asset description. In 1958, James Tobin protracted Markowitz's work by
totaling a risk-free asset to the analysis. This made it conceivable to influence or
deleverage portfolios on the efficient frontier.
In 1964, Sharpe chivalrous the CAPM. This makes robust suppositions that lead to
thought-provoking conclusions. Merely does the market portfolio place itself on the
efficient frontier, nonetheless, it is essentially Tobin's super-efficient portfolio.
According to CAPM, all investors should clutch the market portfolio, weighted or de-
leveraged with locations in the risk-free asset. CAPM also familiarize with beta and
related an asset's expected return to its beta.
The broad-spectrum idea behind CAPM is that investors need to be remunerated in two
ways: time value of money and risk. The time value of money is revealed by the risk-
free (rf) level in the formula and reimburses the investors for placing money in any
investment over a period of time. The other half of the formula embodies risk and
analyzes the amount of reimbursement the investor needs for taking on supplementary
risk. This is scheduled by taking a risk portion (beta) that recounts to the yields of the
asset to the market over a period and to the market premium (Rm-rf).
The CAPM asserts that the expected return of a security or portfolio generations the
rate on a risk-free security plus a risk premium. The security market line plots the
outcomes of the CAPM for all diverse risks (betas). In the structure of things, Bill
Sharpe made his first big innovation by demonstrating how the market must charge
securities in relation to their asset category. The derivation isn't precisely a walk in the
36
park, but the result is a simple undeviating correlation known as the Capital Asset
Pricing Model.
The beta assesses the volatility of the returns of the share relative to the overall market,
which has a beta of 1. A corporation with a beta greater than one is more volatile
(risky) than the average, while a beta of lower than 1 shows less volatility. The beta of a
company requires geometric calculation of the covariance of the share relative to that
of the market as a whole. A number of investment analysts offer the service of
computing and providing company betas. The SML supports to compute the reward-to-
risk ratio for any security relative to the overall market’s. Consequently:
Individual security’s = Market’s securities (portfolio)
Reward-to-risk ratio Reward-to-risk ratio
Beta measures the volatility of the security, comparative to the asset class. The
equation is stating that investors necessitate higher levels of predictable returns to
reimburse them for higher expected risk. You can contemplate the formula as
forecasting a security's performance as a function of beta: CAPM says that if you
identify a security's beta then you recognize the worth of r that investors anticipate it
to have. See figure 4 below.

37
Figure2.3 Market security and asset class linearity
Source CIMA (2012)
2.4.3 Top down theory of capital budgeting
The capital budgeting process has been described as a combination of bottom up
procedures where lower units solicit capital from strategic apex and top down
procedures where headquarters use their discretion to apportion capital downstream.
(E.F, Besly and Brigham, 2013). An extensive literature has examined the incentive
and information considerations that can emerge in bottom –up capital allocation
processes (Harris and Raviv 2010; Bernard et al 2012). In pragmatics top-down
methods are expected to be appropriate even in settings in which the strategic apex
receive request for funds from operational managers. By accumulating the information
contained in such request, the strategic apex end up accomplishing broader information
which supports the firm determine its overall investment expenditures. The pivotal role
is that communication between top management and operations is very indispensable
in capital budgeting because the information conveyed by investment choices can have
a significant influence on the stakeholder choices.

38
2.4.4 Arbitrage Pricing Theory
The arbitrage pricing theory is an equilibrium theory of expected returns for securities
concerning few suppositions about investor preferences (Jones, 2014). It seems to be
more universal than the CPM with less limitation. The significant difference between
CAPM and the APT is that the APT is not censoriously dependent on core market
portfolios as does the CAPM. Jones (2011:236) expounds that the APT is based on the
regulation of one price which articulates that two otherwise undistinguishable assets
cannot sell at different prices. Jones (2011:237) expounds on the differences and
similarities between CAPM and APT as follows: unlike CAPM, APT does not take
responsibility on a single period investment horizon, borrowing and lending at the rate
of return on the risk free asset. APT like CAPM undertakes that investors have
homogenous beliefs. Investors are risk averse utility maximizes, markets are perfect
and returns are engendered by a factor model. A factor model is used to show
fundamental risk factors that affect realized respected returns of securities. (Jones,
2014) These factors are not company factors but simply broad economic factors which
by definition represent an element of surprise in the risk factor. The APT model is
represented as follows𝑹𝑰= 𝑬( 𝑹𝑰 )+𝑩𝑰 𝑭𝑰 + 𝑩𝟐+ _____________________________________________________
Where 𝑹𝑰=𝒕𝒉𝒆 𝒂𝒄𝒕𝒖𝒂𝒍 𝒓𝒂𝒏𝒅𝒐𝒎 𝒓𝒂𝒕𝒆 𝒐𝒇 𝒓𝒆𝒕𝒖𝒏 𝒐𝒏 𝒔𝒆𝒄𝒖𝒓𝒊𝒕𝒚 𝒊 𝒊𝒏 𝒂𝒏𝒚 𝒈𝒊𝒗𝒆𝒏 𝒑𝒆𝒓𝒊𝒐𝒅 𝒕
𝒇 = 𝒕𝒉𝒆 𝒅𝒆𝒗𝒊𝒂𝒕𝒊𝒐𝒏 𝒐𝒇 𝒂 𝒔𝒚𝒔𝒕𝒆𝒎𝒂𝒕𝒊𝒄 𝒇𝒂𝒄𝒕𝒐𝒓 𝒇 𝒇𝒓𝒐𝒎 𝒊𝒕𝒔 𝒆𝒙𝒑𝒆𝒄𝒕𝒆𝒅 𝒗𝒂𝒍𝒖𝒆
𝑩𝑰=𝒔𝒆𝒏𝒔𝒊𝒕𝒊𝒗𝒊𝒕𝒚 𝒐𝒇 𝒔𝒆𝒄𝒖𝒓𝒊𝒕𝒚 𝒊 𝒕𝒐 𝒇𝒂𝒄𝒕𝒕𝒐𝒓
𝑬 ( 𝑹𝑰)=𝒕𝒉𝒆 𝒆𝒙𝒑𝒆𝒄𝒕𝒆𝒅 𝒓𝒆𝒕𝒖𝒓𝒏 𝒐𝒏

39
𝒆𝒊=𝒓𝒂𝒏𝒅𝒐𝒎 𝒆𝒓𝒓𝒐𝒓 𝒕𝒆𝒓𝒎 𝒖𝒏𝒊𝒒𝒖𝒆 𝒕𝒐 𝒔𝒆𝒄𝒖𝒓𝒊𝒕𝒚
2.5 Good Corporate Governance
The Cadbury Committee’s report delineated corporate governance as ‘the structure by
which corporations are directed and controlled’. The Cadbury Committee further
expounded on this definition ‘Boards of directors are accountable for the governance
of their corporation. (Cadbury, 2012) The shareholders’ role in governance is to
engage the directors and the auditors and to satisfy themselves that a suitable
governance structure is in place. The role of the board encapsulates setting up the
corporation’s strategic aims, furnishing the leadership to put them into effect,
supervising the administration of the business and reporting to shareholders on their
stewardship. (Cadbury, 2012) The board’s actions should respect laws, procedures and
the shareholders in general meeting.’ Good corporate governance assists to preclude
corporate scandals, fraud, and potential civil and criminal liability of the organization.
A good corporate governance image boosts the reputation of the corporation and
makes it more eye-catching to customers, investors, stakeholders, and contributors.”
With the dawn of the twenty-first century, corporate governance has accomplished
heightened essence and attention in government policy circles, academia, and the
popular press throughout much of the universe. Various reasons elucidate its current
prominence (Gee, 2013). The new century’s financial indignities affecting major
American firms, such as Enron, WorldCom and Arthur Andersen, and the resulting
loss of buoyancy on the investing public in the stock market led to melodramatic
declines in share prices and significant financial losses to millions of individual

40
investors. Both the public and the experts have recognized botched corporate
governance as a principal cause of the scandals.
Corporate finance law deals with the way in which a corporation raises money for its
business operations and how the corporation deals with its finances. By assessment,
corporate governance concentrates mainly on the systems by which companies are
directed and controlled (Pollard, 2014). It is the gathering of law and practices,
embedded in fiduciary duties and their application, that controls the conduct of those
in control of a corporation, and the means through which a plethora of nations furnish
a legal basis for corporations while preserving, to some extent, authority to control
abuses of these business corporations. Issues involved in the law and study of corporate
governance encapsulates formation and dissolution of corporations, financing,
structures such as board of directors and shareholders, the essence of the corporate
constitution, duties and responsibilities of those controlling corporations, the
importance of company meetings, protection of minorities within companies, and
insider trading and its essence in corporate governance. (Couldridge, 2014)
2.5.1 Corporate Governance Theories
Early company law was based on the stewardship theory. Directors were trusted to
trail their fiduciary duties to the corporation. They were anticipated to act as stewards
of shareholders’ interests and place these interests above their own. Over the years a
divergent theory emerged called the agency theory. This school of thought holds that
given the chance, directors will follow their own interests and cannot be anticipated to
adopt a stewardship viewpoint unless appropriate checks and balances are put in place
(Hampel, 2012). The recent annihilation in shareholder value of Enron, WorldCom,

41
Allied Irish Bank, and in South Africa, Leisure Net and Regal Bank disasters, would
influence many that the agency theory is perchance the more suitable one in respect of
the behavior of directors, and. senior executive management. Professor J. Lorsch,
Director of Research, Harvard Business School, was interrogated at the International
Conference on Corporate Governance (2003) if the disparaging greed related to "a few
rotten apples in the barrel?" His retorted by articulating that it was not simply a few
bad apples but that the barrel itself was rotten! Agency theory has been throw down
the gauntlet by what has become known as stakeholder theory. This theory claims that
the organization should serve the wider interests of investors and not just the
stakeholders (Couldridge, 2014).
Stakeholders encapsulate employees, customers, SOEs suppliers, communities and
creditors. It is contended that they all affect the long-term success of the business and
must be taken into account in the decision-making of the business. The Hampel
Committee (1998) in the UK discharged the stakeholder notion. "Directors are
accountable for relations with stakeholders, but are responsible to the shareholders."
In the researcher’s personal experience this is the foreseeable wisdom in boardrooms
in the UK and USA.
German and Japanese governance structures are more aligned with stakeholder theory.
The two extreme and opposite models cannot fully elucidate the convolution of
corporate reality (Pollard, 2014). They call for a new methodology to the
comprehension of corporate customs to assist the search for effective and efficient
SOEs governance. Their work is real in indicating that neither stakeholder nor agency
theory flawlessly aligns with the complication and reality of the current, modem

42
corporation. They do not suggest an approach that can virtually deal with the many
challenges recognized but call for radical research.
(King, 2013) dealt with this essential issue as follows: In governance terms one is
answerable at common law and by statute to the corporation if a director, and one is
accountable to the stakeholders recognized as relevant to the business of the
corporation. The stakeholder concept of being answerable to all genuine stakeholders
must be prohibited for the simple reason that to ask boards to be answerable to
everyone would result in them being accountable to no one. The contemporary
approach is for the board to recognize its stakeholders, embracing its shareowners and
to consent policies as to how the correlation with those stakeholders should be
advanced and managed in the interests of the corporation (King, 2013). King (2002)
agrees with the Hampel Committee (1998) that the board is not answerable to all
stakeholders, but does not merely accept agency theory where the board is responsible
for shareholders alone. Instead King follows corporate law and articulates that the
board is responsible for the corporation and responsible to recognized stakeholders.
This attitude was called the "Inclusive Approach" and positions the corporate to
embark on "triple bottom line reporting." This reporting make sure that the corporate
swells its focus from only "bottom line reporting" to "triple bottom line reporting."
This change squeezes the economic, social and environmental features of the
company's activities. In other words, the financial and nonfinancial features of a
company' business, the effect on the habitat of the product or the services generated
by corporate and the values, ethics and reciprocal correlation with stakeholders.

43
2.6 Conceptual framework
Is a scheme of concepts which a researcher will operationalize in the study in order to
achieve the set objectives?
Figure 2.4 Theoretical framework
Dependent Variable
Independent variables
Source, Adapted from Pamela and Peterson (2012:3)
The conceptual framework of this study is comprised of two variable namely
independent variables and dependent variable. Salkind (2012 p.24) articulates that a
dependent variable epitomizes the extent that reflects the results of a research study.
Return on Investment of
SOE’s
Capital budgeting
Techniques
Capital budgeting
models
Financial
techniques
Capital budgeting
and risk
Capital budgeting and
Corporate Governance

44
A dependent variable is assessed to appreciate whether the treatment or manipulation
of the independent variable had an outcome (Salkind, 2013). The dependent variable
of this research is state owned enterprise in Namibia. The state owned enterprises are
those companies whose major stakeholders are the government of Namibian. In total
they are 74 state-owned enterprises in Namibia. (Salkind, 2013) A stakeholder is a
persona or a corporation that has an interest in the running or managing of an
enterprise. The majority of the parastatal’ s in Namibia has not being performing well
in terms of profitability and imposes a lot of operational risk in the way they are
conducting their business.
The researcher seeks to examine if Namibian SOEs using capital budgeting methods
(like IRR, NPV, payback period etc.) for investment decisions. The independent
variables emanating from the study are variables such as capital budgeting techniques.
The capital budgeting techniques are the employment of NPV, IRR, profitability index,
payback period and hurdle rate. One of the pillars of finance theory is that the value of
an asset or investment is equal to the discounted present value of its future cash flows.
The NPV is a capital budgeting techniques which takes into cognizance the time value
of money through discounting rates. The NPV rule states that if the present value of
the projects future cash flow exceeds the cost of the project, then the firm should accept
the project. If the NPV is negative, the firm should reject the project. Only project with
positive net present value are tolerable. This variable is very important in that it tells
whether the investment will increase the state owned enterprise‘s value. The NPV
variable considers all the cash flows in the state-owned enterprise projects. It is very
essential variables because it considers the riskiness of future cash flows.

45
Another variable for this study is the payback period which is a capital budgeting
technique. The payback period for state-owned enterprises is very easy to compute and
a crude measure of liquidity, however the variables tend to ignore the time value of
money. The payback period ignores the riskiness of future cash flows. Within the
capital budgeting techniques, the research also focuses on the internal rate of return
variables.
The internal rate of return reckons the time value for money and takes into
consideration all cash streams and the riskiness of all future cash streams. It may not
give maximizing decision when choosing projects with capital rationing. Another
variable under capital budgeting techniques is the profitability index which takes into
consideration all cash flows and regards the riskiness of future cash flows. It is useful
in classification and choosing projects when the capital is rationing.
The other objective is to establish the kind of risk assessment methods (sensitivity
analysis, scenario analysis or Monte Carlos simulation) state-owned enterprises is
using in approval of the underlying investment risk. The genuineness of life is that
businesses do not function in a vacuum where there is no risk. Risk in business, or any
doings of life for that matter, is something everyone who assumes to do business must
be ready to come across. Risk is a theory that connotes a potential deleterious impact
to an asset or some unique of value that may emanate from some present process or
imminent event. In everyday usage, "risk" is recurrently used synonymously with the
possibility of a loss or threat.

46
2.7 Summary
Assets embody the firm’s capital which the firm’s total assets. It encapsulates all
tangible and intangible assets. These assets include physical assets such as land,
buildings, equipment and machinery as well as assets that signify property rights such
as accounts receivable, securities, patents and copyrights. The lexis capital also has
come to mean funds employed to finance the firm’s assets. In this sense capital
comprise of notes, bonds, stock and short term financing. The value of a firm now is
the present value of all its imminent cash flows. These imminent cash flows come from
assets that are previously in place and from imminent investment opportunities. Capital
budgeting techniques encompass of Payback, IRR, NPV, ARR, IRR, profitability
index all these are significant capital budgeting techniques. The NPV takes into
thoughtfulness the time value of money while the payback is not so much concerned
about the future riskiness of cash flow. The authenticity of life is that businesses do
not operate in a vacuum where there is no risk.

47
3 Research Methodology
3.1 Introduction
This chapter describes the research method used; the selection of the sample, data
collection and data analysis, the purpose of the study is a review of capital budgeting
decision in Namibia’s SOE’s?
3.2 Research design
The descriptive research method was used, since it was an attempt to provide a
complete and accurate description of the situation. The researcher followed the
quantitative design research method, taking the format of a survey research through a
structured questionnaire. The survey method was applied to collect information to
generate insights in order to answer the research question that reviews capital
budgeting decisions in Namibia SOEs. Due to a large number of SOEs and institutions
dealing with capital budgeting decisions, the survey method was useful in identifying
a small sample of those SOEs that can review capital budgeting decisions. The main
focus was on a broader understanding of current problems capital budgeting in
Namibia. The survey method enabled the researcher to collect data that could be useful
in identifying the importance of the availability of capital and skills in reviewing
capital budgeting decisions. Collective views from different stakeholders also assisted
in explicating capital budgeting techniques. Chief financial officers of SOEs were
interviewed in order to gather information on their operations. Questionnaires were
distributed to other stakeholders. A Pearson Bivariate correlation analysis was used
to test the hypothesis. Findings from this quantitative research method was applied at
the data analysis section of this research paper. However, qualitative nature of data
obtained was used as secondary information to the rest of this research study.

48
3.3 Population
A population list of all SOE’s in Namibia was obtained from Government Notice
No.5213 published 31 May 2013, categorizing those SOE’s according to their different
tier’s and establishment objectives. The list contains more than 74 SOE’s in either one
of the following category: economic and productive, regulatory and service rendering.
3.4 Research Sample
The research did not cover all the State-Owned Enterprises but only twenty-six
parastatals were selected. Twenty-six (26) SOE’s were in the category economic and
productive. All twenty-six (26) SOE’s from the economic and productive category
formed part of our purposefully selected sample. Economic and productive SOE’s are
required to implement sound capital budgeting decision to be able to function
economically. In other words, the SOE’s that were considered are the ones that show’s
certain characteristics and qualities that the researcher is specifically interested in
The study only made a review of capital budgeting methods of state –owned
enterprises. The research made use of multiple data sources to enhance data credibility.
These were the entity`s documentation: Annual reports, and Questionnaires. Research
was conducted using the time series regression analysis which is a statistical tool for
the investigation of relationships between variables over time.

49
Table 3.1 Research sample
State-owned enterprise Targeted group Number of samples
Chief financial officers 74 26
Total 74 26
Source Author Thesis (2013)
The first questionnaires drawn up were focused and forwarded to the chief financial
officers and accounts that were purposively selected.
3.5 Research Instrument
The data will be gathered through a structured questionnaire with questions covering
the research questions subdivided into sub-categories. This standardized form or
questionnaire to record all responses is needed for proper record keeping and to help
with the data analysis. The cogency and dependability of the data collected and
response rate achieved will depend to a large extent on the design of the questions. ‘If
one decides to collect data by asking questions, a standardized form or questionnaire
to record all responses is needed’ (Stead and Stewich, 2014).
3.6 Research Procedure
A structured questionnaire was delivered to the chief financial officers (CFO’s) of the
twenty-six (26) purposefully selected SOE’s. Names and contact detailed of those
CFO’s was obtained via personal visit to the SOE’s headquarters in Windhoek where
applicable. The questionnaire was circulated via personal deliveries to the respondents
at least three weeks before the collection date in order to give enough time to the

50
respondents to give informed data. Some managers were very busy and they were
incapable to decide how long it would take them to complete the questionnaire. In
those incidences telephone follow-up was done.
3.7 Data analysis
Due to the quantitative design of the data that was obtained through a structured
questionnaire, the researcher used computerized environment with the assistance of
the SPSS software to analyze the data, to describe the key structures of our data (Stead
and Stewich, 2014). The analysis was aimed at discovering whether SOE’s follow
conceptually correct basis of computing cost of capital, with the aim to detect whether
the techniques used in this SOE’s are consistent with finance theory. (Jain, 2012)
Descriptive statistics provided summaries about the sample that is made, in the form
of simple to understand histograms, bar diagrams and pie charts representing
frequencies of the various ranges of scores or values of a quantity. Furthermore, a
correlation analysis was drawn between the performance of SOE’s investments and
the use of capital budgeting and risk assessment methods for investment decisions.
3.8 Data Collection
3.8.1 Primary data
Primary data was assembled by designing a self-administered questionnaire (see
appendix A), that had to be distributed amongst the selected respondents in the twenty-
six state owned enterprises. Structured questionnaires method was used; the reason
for standardization is to minimize the occurrence of prejudices. Respondents were
requested to choose the right answer from multiple-choice questions as well as
answering the short open-ended questions. The right to seclusion of respondents was

51
taken into consideration. Respondents had the right to choose to be known or to remain
unidentified in responding to questions. All information received was confidentially
treated. The data collection was done through completion of structured questionnaires
by the sample respondents. A questionnaire is an instrument delivered to a plethora of
people in order to collect statistical information (Schindler, 2014). The questionnaire
addressed capital budgeting techniques also enshrined in International Monetary Fund
(IMF) and Organization Economic Commonwealth Development (OECD) discourses.
The questionnaires were designed for key informants from the enterprises on areas not
adequately addressed by other data sources. These were designed to collect data from
the Chief Financial officers and accountants. There are 26 active respondents from the
entity who participated in this research due to sensitivity of the investigation of
relationships between variables over time.
The questionnaires addressed issues of how they rate themselves with respect to capital
budgeting techniques, and addressing the questions on their awareness of any of those
principles and guidelines. It also addressed the challenges they are facing, and if there
are any objectives and targets they failed to meet in the previous years. If there were
targets, which the corporations found difficult to meet, the questionnaire requested
reasons to be provided. The questionnaire asked the participants to give suggested
solutions to the problems their corporations may be facing on capital budgeting
3.8.2 Secondary data
The study used Annual report of respondent on State-Owned Enterprises as well as
interviews to collect appropriate data. Moreover, the researcher also employed prior
studies and weigh it against existing data in order to furnish conclusions and competent

52
recommendations. The secondary sources of data came from published articles from
journals, books, internet, theses and related studies on business, organizational
administration, corporate governance, investments and capital budgeting. Attaining
secondary data are more appropriate to use because they are already summarized and
organized. Furthermore, analysis and interpretation are done more straightforwardly.
As much as annual reports are limited in that they are secondary data, their purpose of
providing audited information about a company’s business and financial operations
makes annual reports a reliable research tool. It provides the year‘s activities, financial
statement and an outlook for the future (Rice, 2014). A good yearly report can be an
influential way to give an account of how assets and powers were used and what was
attained in contrast to what was strategic, and to endorse better comprehension and
debate on how to advance future performance. By doing so, it has the latent to create
greater public conviction and assurance in the work of an entity (Treasury, 2013).
The researcher examined audited Annual Reports for the period of 2008-2012, being
observant for trends and several other apprehensions rose above. Annual Reports
provided information on the financial performance of the enterprise as well as their
position. It also reveals how an entity is governed. The findings of the study also
looked on what the enterprise reported about itself through its website apart from the
Annual Reports. Journal articles were used and secondary data was collected by
extensive review from the library books. It was noted that some state-owned
enterprises did not submit their financial statements to parliament as required by the
House of Assembly to do. The research was able to use the internet in order to collect
some of the data.

53
3.9 Method of Analysis
The descriptive method of data analysis was applied in the study:
Step 1:
The statistics was structured and arranged, by preparing the questionnaires for
analysis.
Step 2:
Statistics were read through, to attain a general sense of the data and to reflect on its
overall meaning. Example: What general ideas are respondent saying? What are their
suggestions about the ideas? What is the overall impression of the global depth,
trustworthiness and use of the information?
Step 3:
A systematic process was applied to generate a description of the setting as well as the
categories for analysis. This analysis is useful in designing detailed descriptions.
Step 4:
This step illustrates how the description and categories were symbolized in order to
express the findings of the analysis.
Step 5:
The concluding step in data analysis involved making an interpretation or meaning of
the information. All responses received from the different respondents were arranged
and carefully compared and analyzed

54
3.10 Ethical considerations
All information was treated confidentially and the anonymity of respondent
guaranteed. The information gathered from the participation in this project was used
for no other reason than the purpose of this study. The researcher functioned under a
code of ethics that forbids him to distribute or use information otherwise. Thus
respondent appeared to be honest with their responses, and ensured the success of this
project.
3.10.1 Respect for anonymity and confidentiality
The issue of confidentiality and anonymity is closely connected with the rights of
beneficence, respect for dignity and fidelity (Salkind, 2013). Anonymity was cosseted
when the subjects identified couldn’t be linked with personal responses. Individuals
were free to give and deny as much information as they wished to the person they
choose. The researcher bore in mind that all psychological and social implications that
are in contravention with confidentially were not taken in consideration.
3.10.2 Respect for privacy
Invasion of privacy takes place when private information such as beliefs, attitudes,
opinions and records is disseminated to others without the patents knowledge or
consent (Schindler, 2014). Whenever subjects repudiate to report on delicate
information they regard it as intrusion of privacy. The researcher respected clients who
didn’t want to divulge their age, income, marital status and other issues which they
regarded as intimate. The researcher took into cognizance the fact that an invasion into
privacy may create loss of dignity, friendship, or employment, feelings of
apprehension or guilt mortification or shame.

55
3.10.3 Informed consent
Another significant issue in student research involved human intervention to guarantee
that potential participants fully understood what they were being expected to do and
that they were informed if there were any potential unenthusiastic consequences of
such participation (Salkind, 2013). The most valuable way that the researcher used to
efficiently address informed consent was through the use of information sheet which
was provided to all those people who were invited to participate. Participants were
given the invitation appropriately in advance to permit them to prudently consider
whether they would participate.
3.11 Summary
The research did not cover all the public enterprises, but took a sample of a population
for the study. A questionnaire was used for collecting primary data. Annual reports of
the company and sample companies were used for collecting and gathering of
secondary data. Other sources such as journal articles, books and internet search were
also used for gathering appropriate secondary data.

56
4 Analysis and discussion
4.1 Introduction
This chapter presents the discussion and analysis of data collected through the
structured questionnaires articulated in chapter three from respondents namely CFO’s
of state-owned enterprises that participated in the research study. The researcher also
uses basic, descriptive and inferential statistics. Basic statistics includes the use of
frequency tables, graphic presentation and others. Descriptive statistics includes the
use of mean, standard deviation, median and mode. Inferential statistics is also a set of
approaches, but it is used to make conclusions or corollaries about physiognomies of
population based on data from a sample.
4.2 Empirical Findings and Analysis of data
The following objectives were used in order to analyze the data collected from the
state-owned enterprise: To examine if Namibian SOE’s are using capital budgeting
methods (like IRR, NPV, payback period etc.) for investment decisions? To establish
the kind of risk assessment methods (sensitivity analysis, scenario analysis or Monte
Carlos simulation) state-owned enterprises are using in approval of the underlying
investment risk? To determine the main barriers to the successful implementation of
analytical tools for investment decisions (like capital budgeting and risk assessment
methods) in Namibian SOE’s. To establish the relationship between the use of
financial investment methods and Corporate Governance of SOE’s.
4.2.1 Findings on descriptive statistics
The descriptive statistics describe the variables employed in this study; it enumerates
the characteristics of the random variables. The variables employed in the research

57
were from 1 to 21 questions. The descriptive statistics used in the table was to assess
the mean, standard deviation, minimum, maximum and variance. The data analyzed
in the study was comprised of multivariate which is a measurement made on the many
variables in the study. The measures of central tendency encapsulate the mean. While
measures of dispersion consisted of the standard deviation. The mean for the capital
budgeting techniques were as follows: scale 1–always, scale 2=sometimes, 3=often
and 4 never. The overall highest mean is 15.00 which denote the most popular capital
budgeting techniques in use for state-owned enterprises in Namibia are the Benefit
/cost ratio 23%, Net Present Value 23%, Internal Rate of Return (23%). The least used
capital budgeting techniques by state-owned enterprises are the Average Rate of
Return (8%) and the Payback period (8%).
The standard deviation is a measure of variability of sample data, it shows how data
is dispersed from the central tendency (Mpunwa, 2013). Chebyshev rule articulates the
lesser the standard deviation the greater the percentage measures are close to the mean.
The mean for the variables was 15.0 and the maximum variable was 23.0. The standard
deviation for variables 1 was as follows 5.04:

58
Table 4.1 Descriptive Statistics for Variables 1,8,10,11,12,13 and 14
Descriptive Statistics
N Minimum Maximum Mean Std. Deviation
VAR00001 17 7.00 23.00 15.0000 5.04975
VAR00008 0
VAR00010 0
VAR00011 1 1.00 1.00 1.0000 .
VAR00012 1 2.00 2.00 2.0000 .
VAR00013 1 3.00 3.00 3.0000 .
VAR00014 1 4.00 4.00 4.0000 .
Valid N (list wise) 0
4.2.2 Cumulative frequency for variables 14 capital asset size
The variable for the number of capital projects and its average size denoted that the
cumulative frequency was 50.0, 66.7, 83.3 and 100. Frequency distribution is the
organizing of raw data in table form using classes and frequencies. The cumulative
frequency is employed to define the number of observations that lie above a specific
value. The cumulative frequency for variables 19 was 66.7, 83.3 and 100.
Table 4.2 Cumulative Frequency for variable 14 question 1
VAR00014
Frequency Percent Valid Percent
Cumulative
Percent
Valid 3 50.0 50.0 50.0
1` 1 16.7 16.7 66.7
2 1 16.7 16.7 83.3
500mill-750mill 1 16.7 16.7 100.0
Total 6 100.0 100.0

59
Table 4.3 Cumulative Frequency for variable 19 question 5
VAR00019
Frequency Percent Valid Percent
Cumulative
Percent
Valid 4 66.7 66.7 66.7
3 1 16.7 16.7 83.3
IRR 1 16.7 16.7 100.0
Total 6 100.0 100.0
4.2.3 Findings on measuring the relationship between variables
The correlation measures the relationship between variables or the strong point of the
link between the variables. A plethora of variables used in the study are as follows:
Question 4,7,8,11,16 (See Appendix A). The degree of correlation between these
variables was measured using Pearson as follows:
r = 𝑛Ʃ𝑋𝑌−Ʃ𝑋Ʃ𝑌
√(𝑛Ʃ𝑋−2(Ʃ𝑋)2(𝑛Ʃ𝑦2−(Ʃ𝑦)²
Where X and Y represents pairs of data for two variables X and Y. n= the number of
pairs of data used in the analysis. In this study n=26. The correlation coefficient ranges
from -1 and +1. When r =+1 it denotes that the variables are perfectly positively
correlated. When r = -1 denotes that the variables are perfectly negatively correlated.
The variables -521, -464, -272 on Pearson correlation for significance 0.01 two tailed
testing describes that there are perfectly negatively correlated. When r is equal to zero
it denotes that the variables are uncorrelated variables 8, 10, and 11 these results are 0
which means these variables are uncorrelated.

60
Table 4.4 Correlations

61
VAR00001 VAR00008 VAR00010 VAR00011 VAR00012 VAR00013 VAR00014
VAR00001 Pearson
Correlation 1 .a .a .a .a .a .a
Sig. (2-
tailed)
. . . . . .
N 17 0 0 0 0 0 0
VAR00008 Pearson
Correlation .a .a .a .a .a .a .a
Sig. (2-
tailed) .
. . . . .
N 0 0 0 0 0 0 0
VAR00010 Pearson
Correlation .a .a .a .a .a .a .a
Sig. (2-
tailed) . .
. . . .
N 0 0 0 0 0 0 0
VAR00011 Pearson
Correlation .a .a .a .a .a .a .a
Sig. (2-
tailed) . . .
. . .
N 0 0 0 1 1 1 1
VAR00012 Pearson
Correlation .a .a .a .a .a .a .a
Sig. (2-
tailed) . . . .
. .
N 0 0 0 1 1 1 1
VAR00013 Pearson
Correlation .a .a .a .a .a .a .a
Sig. (2-
tailed) . . . . .
.
N 0 0 0 1 1 1 1
VAR00014 Pearson
Correlation .a .a .a .a .a .a .a

62
Sig. (2-
tailed) . . . . . .
N 0 0 0 1 1 1 1
a. Cannot be computed because at least one of the
variables is constant.
4.2.4 Summary of case processing Findings
In the table 2e below the variables in this study in total, are 24 the assets size for this
project which were big that’s is above N$ 750 million comprising of Nampower, Meat
Corporation, Development Bank of Namibia and Nampost. Meat Corporation, has a
plethora of projects per annum less than N$ 100. Million. They have formal capital
projects analysis procedures in place. Meat Corporation, employs the payback period
and another unspecified capital budgeting technique. At Meat Corporation, the risk
adjustment procedures which are prevalent are sensitivity analysis and scenario
analysis but they are deficient of Monte Carlo simulation. From the whole study, it
was noted that only Nampower indicated using all the risk adjustment procedure
including Monte Carlo simulation.
The capital budgeting decision makers for Meat Corporation is the board, and this was
the case for 80% of the respondents and the formal project analysis is done both by a
financial officer and most it’s a team decision for all SOE’s. The project acceptance
rate for Meat Corporation is above 50 % of all projects analyzed, this was true for all
respondents. Nampost despite having asset size, above N$ 750 million; the number of
capital projects and its average size are only between N$ 1 Million-N$ 100million.
The budgeting techniques in use at Nampost are the payback period and Benefit cost
ratio, this was true to all respondents with the addition of the Net Present Value method

63
joining the top three techniques in use. Nampost employs formal risk analysis,
sensitivity analysis and scenario analysis. The capital decision makers at Nampost are
done by team decision makers unlike the board decisions made at most of the SOE’s.
Those state-owned enterprises with asset size between N$ 1million and N$ 100million
included New Era, National Housing Enterprise and Agricultural Bank. Despite
having a small asset size, the respondents indicated that Agricultural Bank have an
average size of formally analyzed capital projects between N$500- N$750 million,
they also have standard capital project analysis procedures in place. The capital
budgeting technique at in use at Agricultural Bank is the internal rate of return. The
corporate only employs formal risk analysis but does not have risk adjusted discount
rate, sensitivity analysis, scenario analysis and Monte Carlo simulation. The
respondents from Agricultural Bank stated that good corporate governance leads to
good corporate investment. This can assist the corporation to make actual resolutions
and empower the company to achieve its goals.
Unlike Agricultural Bank, the National Housing Enterprise have the same asset size
but, the number of capital projects and its average size is small within N$300 000
N$500 000. National Housing Enterprise employs different capital budgeting
techniques which are: average rate of return, payback period and Benefit Cost Ratio.
New Era‘s asset size is between 1-100million which is constant to the number of
capital projects and its average size. The major difference between New Era and Meat
Corporation is that New Era employs NPV while Meat Corporation uses payback and
unspecified capital budgeting technique. The state owned enterprises have been
grouped into different variables with a small percentage of zero on its variables and

64
large percentages of 100 as indicated in the case processing summary for all variables
in the table below
Table 4.5 Case Processing Sum for SOEs

65
Case Processing Summary
Cases
Included Excluded Total
N Percent N Percent N Percent
VAR00001 * VAR00015 *
VAR00016 * VAR00017 *
VAR00018 * VAR00019 *
VAR00020 * VAR00021 *
VAR00022 * VAR00023 *
VAR00009
17 70.8% 7 29.2% 24 100.0%
VAR00003 * VAR00015 *
VAR00016 * VAR00017 *
VAR00018 * VAR00019 *
VAR00020 * VAR00021 *
VAR00022 * VAR00023 *
VAR00009
24 100.0% 0 .0% 24 100.0%
VAR00004 * VAR00015 *
VAR00016 * VAR00017 *
VAR00018 * VAR00019 *
VAR00020 * VAR00021 *
VAR00022 * VAR00023 *
VAR00009
24 100.0% 0 .0% 24 100.0%
VAR00005 * VAR00015 *
VAR00016 * VAR00017 *
VAR00018 * VAR00019 *
VAR00020 * VAR00021 *
VAR00022 * VAR00023 *
VAR00009
24 100.0% 0 .0% 24 100.0%
VAR00006 * VAR00015 *
VAR00016 * VAR00017 *
VAR00018 * VAR00019 *
VAR00020 * VAR00021 *
VAR00022 * VAR00023 *
VAR00009
24 100.0% 0 .0% 24 100.0%

66
VAR00007 * VAR00015 *
VAR00016 * VAR00017 *
VAR00018 * VAR00019 *
VAR00020 * VAR00021 *
VAR00022 * VAR00023 *
VAR00009
24 100.0% 0 .0% 24 100.0%
VAR00008 * VAR00015 *
VAR00016 * VAR00017 *
VAR00018 * VAR00019 *
VAR00020 * VAR00021 *
VAR00022 * VAR00023 *
VAR00009
0 .0% 24 100.0% 24 100.0%
VAR00010 * VAR00015 *
VAR00016 * VAR00017 *
VAR00018 * VAR00019 *
VAR00020 * VAR00021 *
VAR00022 * VAR00023 *
VAR00009
0 .0% 24 100.0% 24 100.0%
VAR00011 * VAR00015 *
VAR00016 * VAR00017 *
VAR00018 * VAR00019 *
VAR00020 * VAR00021 *
VAR00022 * VAR00023 *
VAR00009
1 4.2% 23 95.8% 24 100.0%
VAR00013 * VAR00015 *
VAR00016 * VAR00017 *
VAR00018 * VAR00019 *
VAR00020 * VAR00021 *
VAR00022 * VAR00023 *
VAR00009
1 4.2% 23 95.8% 24 100.0%
VAR00012 * VAR00015 *
VAR00016 * VAR00017 *
VAR00018 * VAR00019 *
VAR00020 * VAR00021 *
VAR00022 * VAR00023 *
VAR00009
1 4.2% 23 95.8% 24 100.0%

67
VAR00014 * VAR00015 *
VAR00016 * VAR00017 *
VAR00018 * VAR00019 *
VAR00020 * VAR00021 *
VAR00022 * VAR00023 *
VAR00009
1 4.2% 23 95.8% 24 100.0%
VAR00002 * VAR00015 *
VAR00016 * VAR00017 *
VAR00018 * VAR00019 *
VAR00020 * VAR00021 *
VAR00022 * VAR00023 *
VAR00009
24 100.0% 0 .0% 24 100.0%
a. Limited to first 100 cases.
4.2.5 Findings on Demographic physiognomies of state-owned enterprises
In analyzing the data from the questionnaires it was found that although the majority
of questions only have one logical answer, the respondents carefully chose more than
one answer. In order to apply an unswerving approach in data capturing, the first
answer given to specific question was reckoned as the participant’s answer.
The firms surveyed for this study were identified as being state-owned enterprise. A
21 question survey questionnaire was self-administered to the state-owned enterprise
see exhibit below of the state-owned enterprise which participated in this study.
Twenty 26 questionnaire were delivered to the purposefully selected SOE’s, and the
response rates of the questionnaire were 38%.
4.2.6 Capital project size
Measured by total assets, state-owned in this study are quite large as shown in the
Table 3 below:

68
Table 4.6 Size of Assets
The majority of the state-owned enterprise fall within N$500-N$750million and over
N$750 million in terms of the size of the assets. This denotes that stated owned
enterprises in this study are large. Thirteen percent of the companies fall within the
N$500 00 –N$ 1million, N$1-N$100 million and N$100-N$500million. Twenty-five
percent of the state-owned enterprises fall within the bracket of above N$1million –
N$100million and above N$500-over N$750 million. The frequency of state owned
enterprise that have assets above N$500 000 – N$1million and N$100million –
N$500million is one while the majority of state-owned surveyed enterprise with a
frequency of two have size of assets worth N$ 500-N$ 750million and cumulative
frequency of participants is eleven See figure below and table
Size of Assets Percentage
Less than N$ 300 000
N$ 300 000 –N$ 500 000
More than N$ 500 000 –N$ 1 million 12.5%
Above N$ 1 million – N$ 100 million 25%
Above N$ 100million – N$ 500 million 12.5%
N$ 500million – N$ 750 million 25%
Over N$ 750 million 25%
69
Figure 4. Frequency of the size of assets for SOEs
4.2.7 Findings Capital projects average size formally analyzed.
Table 4.7 Capital projects and size
Source Author Thesis (2014)
To determine the extent of the capital budgeting in the sample, the respondents were
asked the number of capital projects and its average size that they formally analyze in
the state owned enterprise per annum. Twenty-seven percent of the respondents are
above N$ 1 million to N$100 million, followed by state-owned enterprise with assets
0 0.5 1 1.5 2
300000-500000
500000-1million
1million-
100million-500million
500million-750million
over 750million
Frequency
Size of Assets
Size of Project Frequency Cumulative
Frequency
Percentage No projects
Less than N$ 300 000 1 1 9 15
N$ 300 000 –N$ 500 000 2 3 18 12
More than N$ 500 000 –N$
1 million
1 4 9 5
Above N$ 1 million – N$ 100
million
3 7 27 7.3
Above N$ 100million – N$
500 million
2 9 18 379
N$ 500million – N$ 750
million
1 10 9 1
Over N$ 750 million 1 11 9 1

70
above N$100million to N$500 million. Two of the state-owned enterprise falls within
the assets range of N$ 300-N$500 million and have twelve projects done. The majority
of the projects were 379 which had eighteen percent and cumulative frequency of nine.
The majority of the capital projects falls above N$100million-N$500 million. These
results support the notion that this segment of the state-owned enterprise are on a
growth stage. The table below presents the project acceptance rate of those projects
that are formally analyzed. None of the state-owned reported had an acceptance rate
of less than 25%. Thirteen percent (13%) of the state-owned enterprise in Namibia
accept project within the 25 to 50% while eighty-seven percent (87%) of the state
owned enterprise acceptance rate is over 50%. This high acceptance rate can be due to
the high growth rate of the State-Owned Enterprises in Namibia. Atkinson and Le
Brato (1997) measured the acceptance rate. They found that 57% of the firms accepted
over 50% of their capital budgeting projects.
Figure 4.1 Project Acceptance rate
Source Author Thesis (2014)
0%
20%
40%
60%
80%
100%
less than10%
10 to25%
25 to50%
0ver50%
0 0 13% 87%
Pe
rce
nt
of
pro
ject
acc
ep
ted
Project acceptance rate
71
4.2.8 Findings on Formal capital projects analysis procedures
Capital budgeting analysis procedures is a process of evaluating how to invest in
capital assets; that is assets that provide cash flow benefits for more than one year
(CIMA, 2014). The very popular approach for looking at present values for projects is
discounted cash flows (Bennounna, 2010). The entire decision has to be looked at and
assess the variables and outcomes with an analytical hierarchy. Multiple attitude
decision model (MADM) encapsulate capital projects and each feature in the decision
needs to be considered inversely.
One of the most important steps in capital budgeting is to follow up and equate your
estimates to actual results. This post analysis or review can assist recognize
predisposition and boo-boos within the overall process. A formal tracking system of
capital projects also keeps everyone honest. Different methods for evaluating capital
projects prevalent in most state-owned enterprise is the use of a mix of economic
criteria that adheres to principles of financial management namely the use of Net
Present Value, Modified Internal rate of return, payback period and Benefit Cost Ratio.
The findings of the research indicate that sixty-three percent of the surveyed
participants stated that there are formal capital projects analysis procedures in their
state-owned enterprises while the minority of thirty-seven percent articulated that there
are no project analysis standards in the state-owned enterprises. The figure below
shows the presence of formal capital projects for state owned enterprises.

72
Figure 4.2 Presence of formal capital for capital projects for SOEs
The survey instrument requested that the responding State Owned Enterprise choose
the most multifaceted and the most substantial stage of the capital budgeting. As far
as the most important stage in the capital budget process was concerned for state-
owned enterprise, 50% of the state-owned enterprises specified that project definition
and cash flow estimation was the most important. Thirty-eight percent (38%) of the
state-owned enterprise articulated that project implementation was the most important.
Twelve percent (12%) of the respondents indicated financial analysis and project
selection to be the most important stages in capital budgeting process. As far as the
most difficult part of the capital budgeting process is concerned, 50% state-owned
enterprises indicated project implementation is the most difficult part of the capital
budgeting process. Thirty-nine 39% percent of the participants articulated the most
difficult part of the capital budgeting process is the financial analysis and project
selection. Eleven percent (11%) of the respondents stated project review is the most
difficult part of the budgeting process. See figure below:
yes63%
no37%
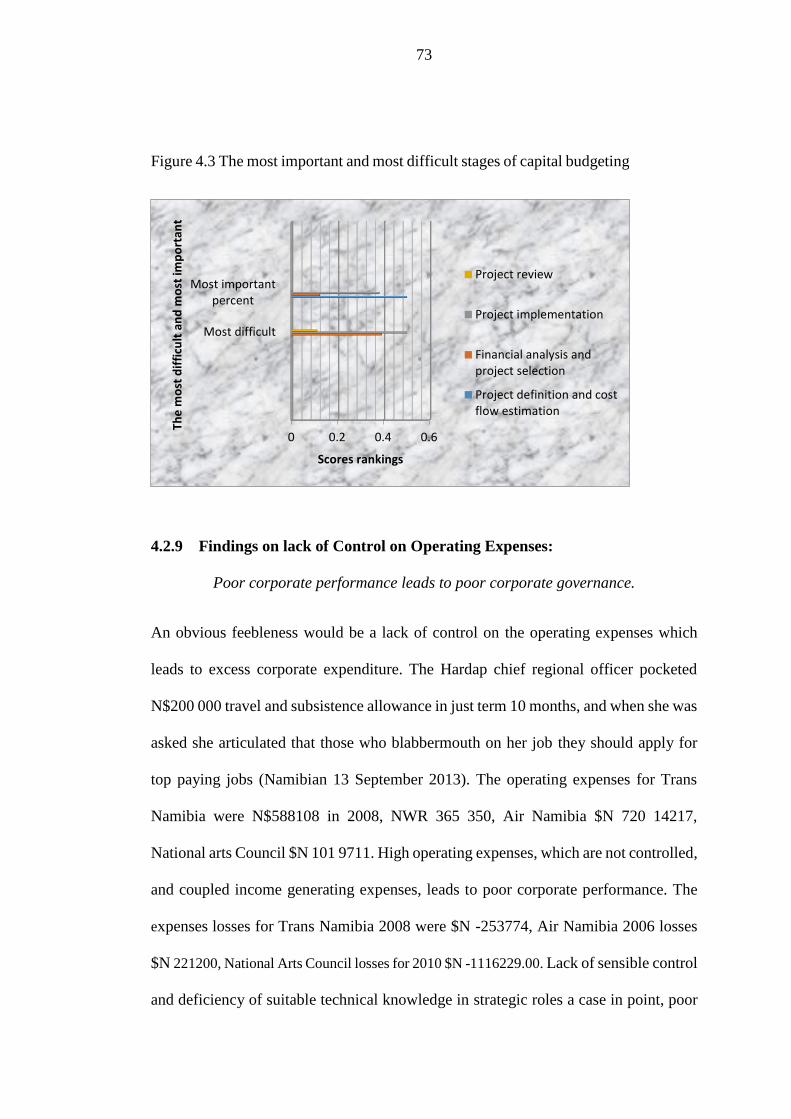
73
4.2.9 Findings on lack of Control on Operating Expenses:
Poor corporate performance leads to poor corporate governance.
An obvious feebleness would be a lack of control on the operating expenses which
leads to excess corporate expenditure. The Hardap chief regional officer pocketed
N$200 000 travel and subsistence allowance in just term 10 months, and when she was
asked she articulated that those who blabbermouth on her job they should apply for
top paying jobs (Namibian 13 September 2013). The operating expenses for Trans
Namibia were N$588108 in 2008, NWR 365 350, Air Namibia $N 720 14217,
National arts Council $N 101 9711. High operating expenses, which are not controlled,
and coupled income generating expenses, leads to poor corporate performance. The
expenses losses for Trans Namibia 2008 were $N -253774, Air Namibia 2006 losses
$N 221200, National Arts Council losses for 2010 $N -1116229.00. Lack of sensible control
and deficiency of suitable technical knowledge in strategic roles a case in point, poor
0 0.2 0.4 0.6
Most difficult
Most importantpercent
Scores rankings
The
mo
st d
iffi
cult
an
d m
ost
imp
ort
ant
Project review
Project implementation
Financial analysis andproject selection
Project definition and costflow estimation
Figure 4.3 The most important and most difficult stages of capital budgeting

74
financial management will lead to poor corporate performance. A rapid deficiency for
staff involved in accounting or control may suggest inadequate resourcing and will
make control straining because of lack of continuity. The findings of other researchers
(Cadbury, 2012)articulate poor corporate performance is due to poor corporate
governance.
Table 4.8 Control on the operating expense
4.2.10 Research objective A
To examine if Namibian SOE’s are using capital budgeting methods (like IRR, NPV,
payback period etc.) for investment decisions.
Time Value of Money (“TVM”) is a significant concept in financial management.
TVM is based on the concept that a Namibian dollar that you have today is worth more
2006 2007 2008 2010
Trans Namibia
operating
expenses
588 108 408596
Trans Namib
losses
(253774) 65672
NWR operating
expenses
365 350 148873 078
Air Namibia
operating
expenses
72014217
National Arts
Council
1019711
TransNamib
losses
253774 65672
NWR losses -17584558
Air Namibia
losses
-22 1200
National Arts
losses
1116229

75
than the promise or expectation that you will receive a Namibia dollar in the future.
Money that you hold today is value more because you can invest it and earn interest.
After all, you should receive some recompense for preceding spending. A case in point,
you can capitalize your Namibian dollar for one year at a 6% annual interest rate and
accumulate N$1.06 at the expiration of the year. You can say that the future value of
the Namibian dollar is N$1.06 given a 6% interest rate and a one-year duration it
follows that the present value of the N$1.06 you expect to receive in one year is only
N$1.00. The Research Objective A of this study was to examine if Namibian SOE’s
are employing capital budgeting methods (like IRR, NPV, payback period etc.) for
investment decisions.
The choices presented in the survey instrument were indistinguishable to the options
supplied by Ester and Geller 1981 study and Schmidgall and Damitio in their 1990
study. Brealey & Myers (2003) elucidate that managers make capital budgeting
decisions based on the supposition that the primary goal of the business is to take full
advantage of the shareholder’s wealth. This postulation means that a business will
invest in projects that will make a positive net present value. This perception is
advocated by much empirical work ( Graham & Harvey, 2015) and many others
explain why DCF techniques have been prevailing techniques for evaluating capital
budgeting decisions predominantly in large more structured business ( Graham &
Harvey, 2015). On the other hand, empirical work ( Graham & Harvey, 2015)
established that due to limited managerial skills, non-complicated techniques such as
payback methods continue to govern capital budgeting decision making in smaller
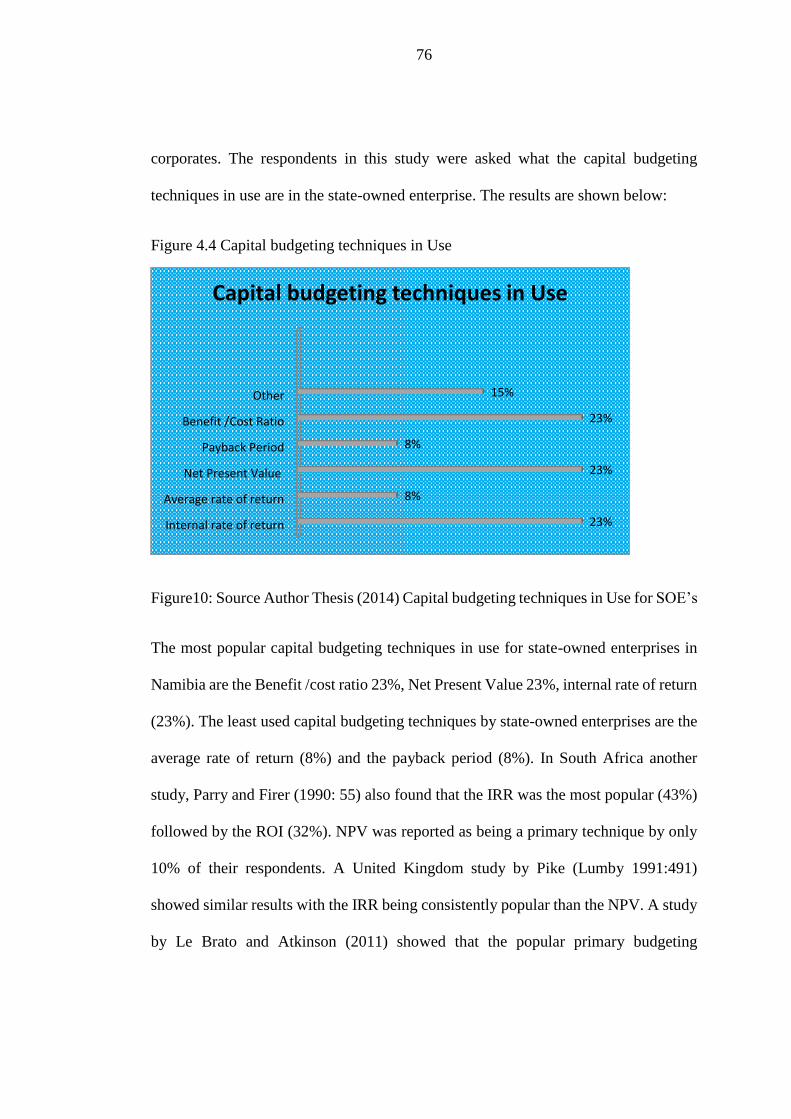
76
corporates. The respondents in this study were asked what the capital budgeting
techniques in use are in the state-owned enterprise. The results are shown below:
Figure 4.4 Capital budgeting techniques in Use
Figure10: Source Author Thesis (2014) Capital budgeting techniques in Use for SOE’s
The most popular capital budgeting techniques in use for state-owned enterprises in
Namibia are the Benefit /cost ratio 23%, Net Present Value 23%, internal rate of return
(23%). The least used capital budgeting techniques by state-owned enterprises are the
average rate of return (8%) and the payback period (8%). In South Africa another
study, Parry and Firer (1990: 55) also found that the IRR was the most popular (43%)
followed by the ROI (32%). NPV was reported as being a primary technique by only
10% of their respondents. A United Kingdom study by Pike (Lumby 1991:491)
showed similar results with the IRR being consistently popular than the NPV. A study
by Le Brato and Atkinson (2011) showed that the popular primary budgeting
Internal rate of return
Average rate of return
Net Present Value
Payback Period
Benefit /Cost Ratio
Other
23%
8%
23%
8%
23%
15%
Capital budgeting techniques in Use

77
techniques were the complicated or discounted cash flow methods such as NPV 29%
and internal rate of return 57%. See figure below:
Table 4.9 Primary and Secondary Capital budgeting techniques in Use
Source LeBruto and Atkinson (2011)
As in table six above there are numerous elements that can enter into the Time Value
of Money - that magical notion that permits you to quantify your goals in N$ amounts
- as well as five "variables" that interact in any given situation. A key perception of
TVM is that only amount of money or a sequence of identical, consistently-spaced
disbursements or receipts assured in the future can be altered to a corresponding worth
today. Contrariwise, you can control the value to which a single sum or a sequences
of future payments will produce to at some future date (Atkinson, 2014).

78
Figure 4.5 Survey evidence on the popularity of different capital budgeting methods
CFOs (2014)
As shown above most respondents cited Net Present value and internal rate as their
most recurrently used capital budgeting methods 74.9 of CFOs or almost constantly
used IRR. Companies that recompense dividend tend to have higher leverage ratios
than non-dividend payers, were also ominously more probable to use NPV and IRR
than companies that do not pay dividend.
4.2.11 Research objective B:
To establish the kind of risk assessment methods (sensitivity analysis, scenario
analysis or Monte Carlos simulation) are state-owned enterprises using in approval
of the underlying investment risk?
Portfolio theory identifies two types of risk: systematic and unsystematic risk.
Systematic (market, non-diversifiable, nonspecific) risk relates to the economy and the
stock market as a whole. Share prices generally are subject to fluctuations. Any investor
who invests in these markets must thus be subject to this risk as it cannot be eliminated
through diversification. Unsystematic (specific, diversifiable) risk relates to specific
79
investments. This risk can be eliminated through investing in a portfolio. Quite simply, it is
based on the principle that some companies will perform well when others do badly and vice
versa. The differences between company risks can be eliminated but the overall market risk
cannot and everyone has to dance to its tune, at least in the short run period.
The veracity of life is that corporation do not function in an unadulterated world where
there is no risk. Risk in corporation, or any activity of life for that matter, is something
every person who assumes to do business must be ready to encounter. Risk is a
conception that denotes a potential negative bearing to an asset or some distinctive of
worth that may emanate from some current process or future event. In ordinary usage,
"risk" is frequently used synonymously with the likelihood of a loss or threat. Risk
does not constantly only refer to the evasion of negative outcomes. In finance, risk is
only a portion of the variance of possible outcomes. Insurance is a classic instance of
an investment that mitigate risk - the buyer pays a guaranteed amount, and is secure
from a potential large loss. The survey respondents were asked if they are conducting
risk assessment during capital budgeting process. The results were as follows: The
state-owned enterprises in Namibia indicated they carry out risk assessment during
capital budgeting. Thirteen percent 13% of the respondents indicated they do not
conduct risk assessment during capital budgeting while eighty seven percent (87%) of
the state-owned indicated they conduct risk assessment for capital budgeting. See
figure below:

80
Figure 4.6 Risk assessment during capital budget analysis
Source Author Thesis (2014)
Commonly speaking, Risk Management is the process of assessing, or assessing risk
and emerging strategies to manage it (Hilma, 2014). Strategies encompass reassigning
the risk to another party, circumventing the risk, plummeting the negative outcome of
the risk, and accommodating some or all of the significances of a precise risk. Out-of-
date risk management stresses on risks restricting from corporeal or lawful causes (e.g.
natural catastrophes or fires, misfortunes, death, and litigations). Financial risk
management, on the other hand, stresses on risks that can be accomplished employed
traded financial instruments. In ideal risk management, a ranking process is tracked
whereby the risks with the maximum loss and the utmost probability of happening are
handled first, and risks with lower probability of occurrences and lower loss are
handled later. In pragmatics the process can be very multifarious, and harmonizing
risks with a high chance of manifestation but lower loss versus a risk with high loss
but lower probability of manifestation can often be exploited.
0
0.2
0.4
0.6
0.8
1
0 13%
0 87%
Agr
ee
me
nt
sco
res
Risk assessment during capital budget analysis

81
Intangible risk management pinpoints a new type of risk - a risk that has a 100% chance
of happening but is unnoticed by the organization due to a deficiency of identification
ability. For case in point, knowledge risk occurs when deficient knowledge is applied.
Relationship risk occurs when relationship maladroitness occurs. Process-engagement
risk occurs when operational maladroitness occurs. These risks unswervingly lessen
the proficiency of knowledge workers, lessening cost efficacy, profitability, service,
quality, standing, brand worth, and earnings quality. Intangible risk management
consents risk management to generate instantaneous charge from the identification and
lessening of risks that reduce productivity (Hilma, 2014).
Risk management also faces complications apportioning resources. This is the notion
of opportunity cost. Resources spent on risk management could have been expended
on more profitable activities. Again, best risk management minimizes spending while
make the most of the reduction of the negative special effects of risks.
Sensitivity analysis and scenario analysis are two approaches for dealing with project
risk to arrest the variability of cash influxes and NPV are sensitivity analysis and
scenario analysis. Gitman 2012: 359 Sensitivity analyses is an interactive approach
that uses many conceivable values for a given variable such as cash influxes to assess
that variable impact on the firm return measured by NPV. These techniques are
frequently handy in generating feet for variability of return in response to changes in
a key variable. Scenario analysis is a behavioural approach similar to sensitivity
analysis but greater in scope (Horngren, 2015). It assesses the impact on the firm’s
return of immediate changes in a number of variables such as cash influx, cash
discharges and cost of capital.

82
Figure 4.7 Namibia State owned risk adjustment procedures
Source Author Thesis (2014)
Forty-eight percent of state-owned enterprise is conducting formal risk analysis. Three
percent of the state-owned enterprise in Namibia carries out risk adjusted discount rate.
Thirty-nine (39%) of the respondents carry out sensitivity analysis while 9% of state
owned enterprise conduct scenario analysis. Only one (1%) percent of the respondents
indicated that they are employing Monte Carlo Simulation. Monte Carlo Simulation
is a skill used to recognize the impact of risk and indecision in financial, project
management, cost and other forecasting models. In Monte Carlo simulation a random
variable is particular for each task based on the range of approximations. This model
is based on this random variable. A study conducted by Hall (2012) indicate 46.2 %
regarded project definition and cash flow analysis estimation as the most risk,
Financial analysis and project selection was considered to be 24.6 % risky while
project implementation was regarded to be 29.2 % risky.
0
10
20
30
40
50
60
70
80
90
100
Formalrisk
analysis
Riskadjusteddiscount
rate
Sensitivityanalysis
Scenarioanalysis
MonteCarlo
simulation

83
According to Graham and Harvey (2013) companies with highly leveraged were also
more likely to use sensitivity and simulation analysis in part to analyze in part to assess
the probability of financial distress. Companies whose CEO have MBAs were more
expected to use IRR and NPV and to be proficient than companies whose CEOs have
no MBAs. Other than NPV and IRR the payback period was the most recurrently used
capital budgeting technique (56% always or almost used it; see figure above). Monte
Carlo Simulation model has a plethora of advantages which are very flexible in which
there is no limit to the analysis. Monte Carlo simulation method can be generally
extended and developed as required. It is very stress-free to be comprehended by those
who don’t have mathematics background. The disadvantages of Monte Carlo
simulation: solutions are not precise but hinge on the number of recurrent runs used
to generate the output statistics. The Monte Carlo simulation usually requires a
computer and the calculations can take much longer than analytical models.
Table 4.10 Highest risk in capital budgeting
Source Hall (2012: 19)

84
Operating risk rises from the fauna of the operating activities of the firm. The type of
industry often defines the general cost structure of a firm (proportions of fixed and
variable costs, capital- or labor- intensive production processes) and/or the pattern of sales
revenue. (Hall, 2014). The total costs of production are customarily divided into fixed and
variable costs and the capacity of operating risks are based on the section of fixed costs
to total production costs. Fixed costs can act as a "lever", whereby a small change in sales
revenue can be magnified into a larger change in profits. The financial manager of a company
can use methods such as Cost-Volume-Profit (CVP) analysis to assess the operating risk of
the firm. However, a comparison between companies in the same industry on the basis
of CVP analysis shows that differences exist. This indicates that management has some
degree of control over the cost structure of the company (Hall, 2014).
Financial risk rises from the degree to which a firm trust on debt to finance its operations.
When a firm borrows, it is liable for the interest payments of debt. Whilst operating risk
refers to the proportions of the firm's fixed total production costs, financial risk is essentially
illustrated by the proportion of debt capital to the total capital of the corporation. Interest
payments can be thought of as the firm's fixed cost of finance. Financial risk is entirely
under the control of the firm's management (Hall, 2014).
This is the risk that a corporation or individual will be incapable to pay the contractual
interest or principal on its debt responsibilities. This type of risk is of unambiguous
concern to financiers who hold bond's within their portfolio. Government bonds,
predominantly those bestowed by the Federal government, have the minimum amount
of failure to pay risk and minimum amount of returns while corporate bonds tend to
have the uppermost amount of failure to pay risk nevertheless, also the higher interest

85
rates. Bonds with lower chances of default are well-thought-out to be “investment
category,” and bonds with higher likelihoods are well-thought-out to be junk bonds.
Country Risk this symbolizes to the risk that a nation state won't be able to pay for its
financial onuses. When a country is defaulting it can hurt the demonstration of all other
pecuniary instruments in that nation as well as other states it has connotations with.
Country risk spread over to stocks, bonds, mutual funds, options and futures that are
bestowed within a specific country. This type of risk is most recurrently seen in
unindustrialized markets or countries that have a simple deficit. When investing in
foreign countries you must replicate the fact those currency exchange rates can alter
the price of the asset as well. Foreign exchange risk spread over to all financial
instruments that are in exchange other than your local currency.
Every financial manager of a business will consider the total risk of the business carefully
and attempt to manage the risk in such a way that shareholders receive the best advantage.
From an investment analysis point of view, investors consider the most effective way
of investing funds. It is well known that placing all one's funds in one investment only is
more risky than spreading the funds. This is known as diversification and the different
investments, into which one diversifies is known as a portfolio of investments.
4.2.12 Research objective C:
To determine the main barriers to the successful implementation of analytical tools
for investment decisions (like capital budgeting and risk assessment methods) in
Namibian SOE’s.

86
Critical success factors are the assistance of internationally experienced experts, the
reliability of incentives and the criteria applied for capital budgeting. Expert’s
assistance is essential for making capital budgeting decision become a success.
Expert’s assistance to sub-borrowers is necessary to make sure that projects developers
are able to meet the requirements. Reliability of incentives is necessary for planning
of project investment.
The surveyed of state-owned enterprise indicated that the capital decision makers are mainly
the board who constitute 43% followed by team decision makers 29% , external consultants
who make up 14% and the financial officer 14%. See figure below
Figure 4.8 Capital decision makers in SOEs
According to the author’s analysis of barriers in penetration of real options to capital
budgeting process of state-owned enterprises. Causation can be seen general and
individual barriers in order of their importance.
0 0.1 0.2 0.3 0.4 0.5
board
External cosultants
Financial officer
Team decision

87
Table 4.11 Barrier in real options implementation
Order Barrier in real option ‘s Implementation
1 Project implementation difficulties
2 Method complexity
3 Difficulty interpretation
4 Distrust in intangible values
5 Lack of complex software solution
6 Other
As a foremost obstacle towards option execution is the project implementation
complications. State-owned enterprises feel that implementation options to their
financial valuation system are not an easy task and require more effort than any other
metric. Once the process is set challenges to do with method complexity, difficulty
interpretation, distrust in intangible values, lack of complex software and others. Fifty-
four percent (54%) state-owned enterprises articulated they don’t have standard
procedures in place if capital projects outcome are not as expected. While ten percent
(10%) indicated that they have standard procedures in place and the remaining 36%
were not sure. See figure below

88
Figure 4.9 The absence of standard operating capital projects outcomes for SOEs
Source Author Thesis (2014)
The capital budgeting techniques preferred in USA and UK can be shown as below:
The most preferred methods are IRR 55% in UK and 56% in USA while the most used
method in Namibia by state-owned enterprise is IRR 23%, Benefit cost ration 23% and
NPV 23%. The payback method constitutes 8% by state owned enterprise while in
USA 69% and UK 39%. The level of literacy in the interpretation of these capital
budgeting techniques is of paramount importance taking into cognizance the level of
understanding of the state-owned enterprises (Maher M and Anderson, 2014). Not
most of the top management of state-owned enterprises in Namibia have an MBA to
interpret the capital budgeting methods. Developed countries have high income.
Knowledge based market economy which is both innovative and provides a unique
excellence of life to all populace.
0
10
20
30
40
50
60
70

89
Table 4.12 Most preferred capital budgeting methods in England and USA
Method UK USA
IRR 55% 56%
NPV 52% 41%
Discounted Payback 54% 65%
Discounted cash flow 5% 3%
Payback Period 69% 39%
Accounting rate of return 20% 19%
Source Hall (2012: 19)
Budget allocations remain undoubtedly the most used source of capital for
development in Namibia. Government budget allocation is central to the pace of
capital accumulation in the economy. Building productive, competitive and functional
human resources for economic growth. Developing knowledge based economy.
Capitalize on productive expenditures and diminishes unproductive ones. Education
and Health are fundamental. Education has high positive externalities lowers fertility,
reinforces national capacity. Emphasis on primary and secondary education on a better
impact. Educating women impacts positively on health and educating of children. It
provides geographical balance. Characteristically pro-poor expenditures are primary
education, primary health care, rural roads, basic services of water and sewerage. The
four largest spending ministries in Namibia are Education, Finance, Health and

90
Defense which is in total accounted for over 51% of the total government expenditure
in 2011/2012.
Figure 4.10 Expenditure allocation for Namibian government
Source Ministry of Finance (2014)
Improving education is one of the significances government has set itself to attain over
the upcoming years and government knows that for underprivileged and
unemployment to be condensed a country needs educated and skilled people. The
unemployment rate in Namibia is high which about 27% is. Although education
obtains more allocation which is the national wealth is expends more than 90% of its
budget on consumption or current expenditure and disbursements are very little, less
than 10% on capital expenditure this stills elucidate why there is high deficiency of
schools, hostels, text books, school desks in Namibia. See figure below

91
Figure 4.11 Allocations of capital Expenditure in Education is very little
Ministry of Finance (2013)
Over the past 20 years the government to a certain extent has made strides on
promoting equity education between the black and white. However, it should be noted
that increasing government expenditure has not rendered the economy to significant
job creation and economic growth as Namibia still positions among countries with
maximum unemployment, maximum income inequality at 0.6 and rising poverty. If
government expenses could not end unemployment rising form 37% in 2000 to 51%
in 2008 there is an immense need for the government to boost manufacturing
companies in the country. TIPEEG is designed at solving unemployment, inequality
and poverty by unravelling employment opportunities in diverse sectors of Namibian
economy. TIPEEG growth supports employment creation in agriculture, tourism,
transport and housing & sanitation. TIPEEG has to some extent fostered employment
however it is very weak in its current form and does not have tangible employment

92
created by allocation of resources. A disjointed policy and all fingers and thumbs
decision making in government can lead to replication of effort, misuse of financial
resources, misuse of time and incongruous outcomes.
4.2.13 Research objective D:
To establish the relationship between the use of financial investment methods and
Corporate Governance of SOE’s.
4.2.13.1 Rights of shareholders to organizational performance
Appointment of Suitable members to serve on NWR Board of directors
Figure 4.12 Appointment of Suitable members to serve NWR board of directors
Sources Hilma (2013)
Hilma (2013) stated that fifty-four percent of the participants declined to make a
comment concerning the appointment of suitable members to serve on the board, while
29% indicated that the appointment of board members was political. Only 16%
indicated that the selection of suitable members was based on merit. The researcher
observed that the current board 2013-2015 is comprised of 50% Vambo tribe, 25%
0 5 10 15 20
merit
reputation
Political
No comment

93
Herero and 25% Zambezi. The majority of the board members are women (63%) and
all board members are Namibians. Carter (2002:11) articulates that board diversity can
be defined as a variety in the composition of the board. Observable diversity includes
race, ethnic background, nationality; gender and age while less visible diversity
comprises educational functional, occupational background, industry experience and
organizational membership (Kang et al 2007:4). Some of the benefits of board
multiplicity encapsulates creativity and diverse perspectives access to resources and
connections, career motivations in effect problem solving (Carter, 2015) . Women hold
few board seats in Japan, Europe, Australia and Canada is estimated as 0.4%, 8.0%,
8.7% and 10.6 percent respectively. A study emphasizes that companies with higher
% age of directors with industry experience have higher anomalous returns better
checking lower risk of distress (Papalconstantinou 2007:30).
The findings by Hilma (2013) indicate that the procedure for appointing suitable
candidate to serve on the board must be revisited and appointment must be done on
merit. One hundred percent of the respondents articulated that the shareholders right
of sharing the profits is being breached, because the company is experiencing
interminable losses for the past years up to date. The researcher observed that some of
the decisions made by the corporate board do conflict with the operations of the
organizations because the majority of the board members lack proper training on
corporate governance and ethics. The corporate governance framework should guard
shareholders’ rights. Basic shareholder rights embrace the right to 1) secure methods
of ownership registration; 2) express or transfer shares; 3) obtain appropriate

94
information on the corporation on appropriate and regular basis; 4) participate and vote
in general shareholder meetings.
The equitable treatment of shareholders and independence of mind
Freedom for executive to execute their responsibilities
Figure 4.13 Treatment of shareholders and indepence of mind
Source Hilma (2013)
Hilma (2013) states that Eight four (84%) of the participants articulated that
shareholders give board members and executive management freedom to execute their
responsibilities without fear. While 16% of the respondents indicated that they are not
given the freedom to execute their responsibilities without fear. Consequently, the 16%
of the participants are being subjected to the use of fear and threats in order to make
biased decisions. Independence of mind is that state of cognizance that permits the
endowment of an opinion without being pretentious by influences that give and take
proficient judgment, allowing an individual to act with truthfulness and exercise
YES
NO

95
detachment and specialized judgment CIMA (2011:416). Independence in appearance
is the circumvention of facts and situations that are so momentous that a rational and
knowledgeable third party having information of all appropriate information including
any safeguards applied would reasonably determine a firm’s or a member of the
assurance team’s integrity, impartiality or professional skepticism had been
compromised.
4.2.13.2 Disclosure and transparency
Hilma (2013) states Ninety-nine 99% of the respondents articulated that NWR
company has an internal audit function, sixty-one percent emphasized that the audit
and finance committee members were technically proficient and able to assess the
company compliance. The majority of the respondents (56%) were not sure concerning
the transparent financial reporting of company data while 12 % of the population
indicated that the financial reporting was absolutely not transparent. Thirty percent
(30%) of the populace asserted that the financial transparency of NWR was perfect.
Figure 4.14 NWR Financial data transparency
0%
10%
20%
30%
40%
50%
60%
YES NO NOT SURE

96
Source Hilma (2013)
OECD (2009) philosophies of corporate governance highlight that release should
include, but not be restricted to, substantial information on: The financial and operating
outcomes of the company, company objectives, and key share ownership and filled by
election rights, members of the board and key executives, and their salary. Material
calculable risk factors, material challenges concerning workforces and other
shareholders, governance structures and policies.
4.2.13.3 The responsibilities of the board
Hilma (2013) states that fifty-one percent of the respondents stated that NWR is not
self-sustaining in terms of finance. Seventy-nine percent of the respondents articulated
that the company has not paid dividend during its inception while the remaining 21 %
were not sure. The respondents rated the corporate board as follows see figure below:
10% said there is poor corporate governance, 46% articulated that the corporate
governance at NWR was average, 44% indicated that NWR has good corporate
governance. The researcher observed that the corporate governance summary should
endorse the strategic guidance of the company and the operative monitoring of
management by the board, and the board’s responsibility to the company and the
shareholders. The researchers observed that the board members should act on a fully
sensible basis, in virtuous, with due conscientiousness and care, and in the paramount
interest of the company and the shareholders. Where board decisions may distress
diverse shareholder groups inversely, the board should treat all shareholders
justifiably. NWR corporate governance Board Ratings

97
Figure 4.15 NWR corporate governance Board Ratings
Source Hilma (2013)
The OECD (2014) states that the board should be selecting, compensating, observing
and, when necessary, replacing significant administrators and supervising succession
planning, reviewing key administrative and board compensation, and make certain a
formal and translucent board nomination process. Among other things the researcher
observed that the board should be monitoring and managing latent conflicts of interest
of administration, board members and stakeholders, together with misuse of corporate
assets and abuse in related party transactions. Confirming the integrity of the
corporation's accounting and financial reporting systems, plus the independent audit,
and that apposite system of control are in place, in particular, systems for monitoring
risk, financial control, and passivity with the law (OECD, 2014). Monitoring the
efficacy of the governance practices under which it operates and making changes as
needed.
0
2
4
6
8
10
12
14
16
18
poor Average good excellent

98
4.3 HYPOTHESIS TESTING
In order to answer the hypothesis, the researcher used the surveyed question; Are there
other non-financial criteria used in major investment decision? The results of the
sample are indicated below: Pearson Bivariate Correlation Analysis
Table 4.13 Sample
Entire sample N=26
ID Tenure CDO BS TA SOE INDUSTRY
ID 1 0.21 0.24 0.12 0.28 0.4 0
Tenure 1 -0.0 0.12 0.17 0.1 0.
CDO 1 0.14 0.22 0.23 0.02
BS 1 0.87 -0.0 0.23
TA 1 0.0 0.23
SOE 1 0.04
Industry 1
Table 9: Source Author Thesis (2014) Pearson Correlation Analysis
R 2=0.234, Test Sig =0.00 (referring to Question 21 on Appendix A)
Regression equation ID =-1.34 +0.016 Tenure +0.40 CDO + 0.169 BS + 0.426 + 0.280
SOE +0.002 Industry

99
Table 4.14 Pearson correlation analysis
Entire sample N=26
B STD error Beta t Sig Tolerance VIF
ID 1.46 0.4 0 -3.7 0.0
Tenure 0.01 1 -0.0 1.4 0.17 0.9 1.07
CDO 0.45 0.0 1 2.2 0.22 0.8 1.1
BS 0.158 0.2 0,2 1.3 0.87 -0.90 1.102
TA 0.573 0.1 0.1 2.2 1 0.849 1.1
SOE 0.293 0.25 0.25 3.6 0.0 0.833 1.2
Industry 1.0
SE PB NEP EI BEM INDUSTRY
SE 1 0.17 0.22 0.09 0.27 0.365
PB 1 -0.080 0.11 0.202 0.118
NEP 1 -0.108 0.12 0.172
EI 1 0.003 -0.012
BEM 1 0.184
INDUSTRY 1
Source (Author, 2014)
R 2=0.025, Test Sig =0.00 (referring to Question 21 on Appendix A)
Regression equation ID =-1.463 +0.00PB +0.459 NEP + 0.58 BE
EI = 0.293
Key ID = major investment decision SE –Safety of employees

100
Tenure – Director PB –Public benefit
CDO- Director Duality NEP – maintain existing programs
BS –Board size EI- Environmental impact
TA –Total Assets BEM- Black economic empowerment
SOE –State owned enterprise
Correlation 0.01 (2 tailed test)
The overall outcomes show that investment decision for state-owned is positively
interrelated to the CEO contract, the CEO duality, board size, total assets and firm
performance. In the state-owned enterprise investment decision of state –owned
enterprise is positively interconnected to the CEO duality, total assets and firm
performance. There is an association between financial investments and corporate
governance of state-owned enterprises in Namibia. For corporations located in states
with robust corporate financial investments𝑖 ≥ 1; weak corporate governance permits
managers to track their own goals at the shareholders’ expense. The hypothesis is
accepted. The findings of this research support the findings of Bohren et al (2011) who
found that good corporate governance mechanisms improve the proficiency of capital
apportionment within firms and lax underinvestment’s generates under investment
rather than overinvestment. Chang et al (2011) who found that corporate governance
mechanisms distress investment decisions of the firm. Ruiz –Porns and Lopez –Mateo
(2011) who found that the separation of ownership inspires investment decisions and
cash flow really impact on investment of the firm. Ownership and control structures
significantly the firm’s investment decisions (Aldright, 2014).

101
4.4 Summary
The majority of the state-owned enterprise fall within N$500-N$750million and over
N$750 million in terms of the size of the assets. This denotes that stated owned
enterprises in this study are large. Thirteen percent of the companies fall within the
N$500 000 –N$ 1million, N$100-N$500 million and N$100-N$500million. Twenty-
five percent of the state-owned enterprises fall within the bracket of above N$1million
–N$100million and above N$500-over N$750 million. Twenty-seven percent of the
respondents are above N$ 1 million to N$100 million, followed by state-owned
enterprise with assets above N$100million to N$500 million. Two of the state-owned
enterprise falls within the assets range of N$ 300 000-N$500 000 and have twelve
projects done. As far as the most essential stage in the capital budget was concerned
state-owned enterprise, 50% of the state-owned enterprises pointed out that project
definition and cash flow estimation was the most important. Thirty-eight percent
(38%) of the state-owned enterprise articulated that project implementation was the
most important. Twelve percent (12%) of the respondents indicated financial analysis
and project selection to be the most important stages in capital budgeting process. As
far as the most difficult part of the capital budgeting process is concerned the 50%
state-owned enterprises indicated project implementation is the most difficult part of
the capital budgeting process. Thirty-nine 39% percent of the respondents indicated
the most challenging part of the capital budgeting is the financial enquiry and project
selection.
102
5 Conclusion and recommendations
5.1 Introduction
The universal objective of this study is to investigate the use of capital budgeting
decisions in Namibian State-Owned Enterprises. This chapter discusses the conclusion
taking into consideration the objectives, literature study, research questions as the
critical point of this study. Included are the recommendations derived from the
conclusions.
5.2 Conclusion
Basing on the preceding findings and analysis, it can be concluded that in most of the
respondents; capital budgeting practices in State-Owned Enterprises seem to have
improved in Namibia with the majority of companies using sophisticated discounted
cash flow (DCF) techniques. The majority of the state-owned enterprise fall within
N$500-N$750million and over N$750 million. This denotes that stated owned
enterprises in this study are large.
The majority of the capital projects falls above $N100million-N$500 million. These
results support the notion that this segment of the state-owned enterprises are on a
growth stage. As far as the most significant phase in the capital budget process was
concerned for state-owned enterprise, half of the State-Owned Enterprises pointed out
that project definition and cash flow approximation was the most significant. While
one third of the State-Owned Enterprises articulated that project implementation was
the most important. The other respondents indicated financial analysis and project
selection to be the most important stages in capital budgeting.

103
The majority of the State-Owned Enterprises indicated project implementation is the
most challenging part of the capital budgeting. The minority of the respondents
showed the most challenging part of the capital budgeting process are the financial
analysis and project selection. The least of the respondents stated project review as the
most difficult part of capital budgeting processes.
The most popular capital budgeting techniques in use for state-owned enterprises in
Namibia are the Benefit /cost ratio, Net Present Value, internal rate of return. The least
used capital budgeting techniques by state-owned enterprises are the average rate of
return and the payback period.
In tandem with finance theory the survey exposes that the sample SOE’s are risk
averse. To assess risk, forty-eight percent of state-owned enterprise is conducting
formal risk analysis. Three percent of the state-owned enterprise in Namibia carries
out risk adjusted discount rate. The minority of the respondents carry out sensitivity
analysis while lesser number of state owned enterprise conduct scenario analysis. Only
one of the participants pointed out they are employing Monte Carlo Simulation. Monte
Carlo Simulation is a skill used to appreciate the impact of risk and ambiguity in
financial, project management, cost and other forecasting models. The variable for the
number of capital projects and its average size denoted that the cumulative frequency
was 50.0, 66.7, 83.3 and 100.
The findings of this research support a study done by Bohren et al (2011) that found
that good corporate governance mechanisms improve the efficiency of capital
allocation within firms, and lax underinvestment’s produces under investment rather
than overinvestment. Furthermore, Chang et al (2011) could be cited who found that

104
corporate governance mechanisms affect investment decisions of the firm. The
separation of ownership encourages investment decisions and cash flow positively
impact on investment of the firm (Markowitz, 2015). Aldiright et al (2010) who found
that ownership and control structures significantly the firm’s investment decisions.
As a main obstacle towards option execution is the project implementation
complications. State-owned enterprises feel that implementation options to their
financial valuation system are not an easy task and require more effort than any other
metric. Once the process is set challenges to do with method complexity, difficulty
interpretation, distrust in intangible values, lack of complex software and others. The
majority of State-Owned Enterprises articulated they don’t have standard procedures
in place if capital projects outcome is not as expected. A few indicated that they have
standard procedures in place and the remaining were not sure.
In general, those SOE’s that are big with capital asset sizes of over N$ 100 million
have capital project analyzed annually in correlation with their assets sizes. They have
formal capital project analysis procedures in place. This large SOE’s seems to be a risk
averse the most using some form of risk assessment procedures. However, only one of
this large SOE’s are using Monte Carlo simulations for risk assessment. Capital budget
decision makers in 80% of all the correspondents are indicated to be the board;
however, formal analysis are mostly done by external consultants Project acceptance
rate of all analyzed project is above 50% for the sample SOE’s.
On the other side of the coin, those SOE’s with asset sizes of less than N$ 100 million,
does not have a project in correlation with their assets sizes; some indicated more

105
others indicated fewer figures. The small SOE’s indicated no knowledge of any form
of risk assessment procedures.
5.3 Recommendations
Considering preceding conclusions of the study, the following recommendations are
made: The line ministries responsible to execute ownership control over the sample
SOE’s should ensure that capital budgets are indeed done and submitted to the line
Minister. In relations to section 19 (1) of the SOE Act this capital budgets should form
part of the Business and Financial Plans to the portfolio Minister. Board member in
relation to section 18 (1) of the SOE’s Act should include capital budget decision made
as part of the performance agreements that have to be signed between the Minister and
each board member, to help with the monitoring and assessments of the individual
performance of the board members. On the operational level, there is need to train
state-owned enterprise management teams on the basics of capital budgeting
techniques to reduce the high dependency rate of formal capital budget analysis on
external consultants. Finance teams should be more risk sensitive and start using more
complex risk assessment procedures like Monte Carlo Simulation and Scenario
Analysis. It is suggested that SOE’s should put in place standard operating capital
budgeting procedures to be employed in the evaluation of all capital projects and their
respective outcomes. It is also commended that SOE’s should develop good corporate
governance mechanisms to improve on the efficient capital allocation. Efficient
allocation of resources of SOE’s to capital projects should be done to allow
infrastructural development. It is recommended that there should be incessant training
for financial staff on capital budgeting techniques.

106
5.4 Areas of further Research
It is recommended, further research should focus on the following: What is the role of
the hurdle rate in behavioral capital budgeting in SOE’s. What is the hypothesis of one
unique discount rate for financing and investing for appropriate capital budgeting?
Why is it that the government allocates large amount of money in education but still
the demand for schools is very high, and there is a shortage of schools in Windhoek in
particular and the whole country in general.

107
6 References
Graham & Harvey. (2015). How do CFOs make capital budgeting and capital structure
decision. Journal of applied corporate finance, 16-17.
Aldright, C. (2014). Capital budgetng Techniques. London: Investopedia.
Atkinson, L. B. (2014). A survey of Capital Budgeting Methods. Journal of Hospitality
Finance, 15-16.
Author. (2014). Capital budgeting Techniques . Windhoek: Unpublished .
Beasley, S. &. (2014). Principles of Finance . London: Cengage Learning .
Bennounna, K. M. (2010). Improved Capital budgeting decision lesson from Canada.
Management Decision, 48(2).
Birman, H. a. (2013). The Capital Budgeting Decision Economic analysis of
investments projects 9th Edition, . New York: Rout ledge Publishers.
Brealey , Myers & Framclin, . (2014). Principle of corporate Finance. 8th Edition.
New York: Mc Grew Publishers.
Cadbury, A. (2012). Corporate governance and Chairmanship. Oxford : Oxford
University Press.
Cadbury, S. A. (2012). The financial aspects of Corporate Governance. London: Gee
and Company.
Carter, H. (2015). Managing good governance in Higher Education. Washington:: Mc
Grew Publishers.

108
Chang, H. (2013). Institutional Change and Economic development. Cambridge :
cambridge University Press.
CIMA. (2014). Cost and management Accounting. London: Elsierver.
Couldridge, D. (2014). Towards an integrated corporate governance for conformance
and performance, MBA thesis. Capetown: University of Capetown.
Dertlinger, A. (2013). Capital budgeting techniques. London: Investopedia.
E.F, Besly and Brigham. (2013). Essentials of managerial finance 13th Edition.
London: Thomson South Western.
Forfas, A. (2013). The role of State owned enterprises: Providing infrastructure and
supporting economic recovery. Ireland: Springer.
Fruitticher, A. (2013). Management Accounting Research . London: Springer.
Gee, M. (2013). Corporate governance in developing Countries. London: Springer.
Gervas, C. (2013, February 12). local government Review. Justice of the Peace limited
, pp. 1-6.
Gitman, L. &. (2013). Forecasting and evaluation practices and performance, a survey
of capital budgeting techniques used by major U.S firms . Financial
management , Fall 66-7.1.
Hall, C. (2014). Business Taxation and Financial decisions. . Washington: Springer
Publishers.
Hampel, C. (2012). Committee on Corporate Governance Final report. London: Gee.

109
Hilma, C. (2014). Corporate performance and corporate governance for State owned
Enterprise. Windhoek: Esami.
Horngren, C. B. (2015). Financial & Management Accounting. Washington: : Cram
101 publishers.
Ihuhua, A. (2010). Debates of National Assembly . Windhoek: Parlimentary reports .
Jain, P. K. (2012). Financial management practices in public sector enterprises: a study
of capital budgeting decision. . Journal of Advances in Management Research,,
2 (1), 32-46.
Jog & Srivastava . (2014). Capital budgeting practices in corporate Canada,. Financial
Practice and Education, Fall/Winter 37-43.
Jones, R. (2014). Student Affairs Budgeting and Financial Management in the midst
of Fiscal crisis. Washington: : Springer Publishers.
Lumby S and Jones, C. (2013). Corporate Finance theory and Practice 7th Edition.
London: Longman Publishers.
Maher M and Anderson, T. (2014). Corporate governance: Effects on firm
performance and economic growth,. Washington: OECD publishers.
Mancosa. (2015). Investments . Capetown: Mancossa .
Markowitz, H. (2015). Handbook of decision making Risk management. Washington:
Springer Publishers.
Mpunwa, D. (2013). Statistics for business. Windhoek: Business School.

110
OECD. (2014). corporate governance King Report 111 Compliance . Capetown:
Longman.
Pamela and Peterson. (2013). Capital Budgeting Theory and Practise . New York:
Wiley and Sons Publishers .
Pollard, D. S. (2014). Corporate governance and Global financial Crisis. London:
Springer.
Poolman, E. (2013). South Africa in the World Economy. Capetown: Mc Graw Hill .
Rice, J. (2014). Financial Management,. Journal of International students Vol 3 , An
interdisciplinary peer review publication .
Salkind, N. (2013). Exploring Research. Johannesburg: Pearson Publishers. .
Schindler, C. &. (2014). Marketing Research. Washington: Cram 101 Publishers.
Singh, J. a. (2013). Information systems and design. London: Springer.
Smit, L. (2013). Real options and investments under uncertainty. London: MIT press.
Stead and Stewich. (2014). Fundamentals of Research Methodology. London:
Springer.
Tobin, J. (2013). The changing face of Economics: Conversations with cutting edge
Michigan. Boston: University of Michigan Press.
Treasury. (2013). Capital budgeting. Windhoek: Ministry of Finance .

111
Appendices
Appendix A
SURVEY QUESTIONNAIRE
The Chief Financial Officer/Finance Manger
State Owned Enterprise
Introduction
I would like to thank you for taking the time to participate in this survey. This survey
is part of my master’s research program in Finance which I am pursuing at the
Namibian Business School at the University of Namibia. This survey will take
approximately 20 minutes to complete. Completed questionnaires should be sent to
Talaska Galaga Katjiruru via e-mail to email address [email protected] , or
please call cell phone number +264811274609 and I will be glad to pick it up from
your place.
Purpose of the study: Is review of capital budgeting decision in Namibia’s SOE’s?
Confidentiality: Be assured that your responses will not be distributed to third parties
and no names will be used in the report.
Personal plea: It will be highly appreciated if you support my research by completing
the questionnaire at least by 20 December 2013.
Yours faithfully,
Talaska Galaga Katjiruru (MBA Student – UNAM)

112
1) What is the asset size of your state owned enterprise?
2) What is the number of capital projects and its average size that you formally
analyze in your state owned enterprise per annum?
Size of Projects Tick appropriate Indicate number
Less than N$ 300 000
N$ 300 000 –N$ 500 000
More than N$ 500 000 –N$ 1 million
Above N$ 1 million – N$ 100 million
Above N$ 100million – N$ 500 million
N$ 500million – N$ 750 million
Over N$ 750 million
3) Are there formal capital projects analysis procedures (standards) in place in
your organization?
Tick appropriate
Yes
No
Size of Assets Tick appropriate
Less than N$ 300 000
N$ 300 000 –N$ 500 000
More than N$ 500 000 –N$ 1 million
Above N$ 1 million – N$ 100 million
Above N$ 100million – N$ 500 million
N$ 500million – N$ 750 million
Over N$ 750 million

113
4) What are the capital budgeting techniques in use in your state owned
enterprise, tick appropriate?
Capital budgeting techniques in use Use
Internal rate of return
Average rate of return
Net Present Value
Payback period
Benefit/Cost Ratio
Other
5) Rate the importance of the capital budgeting techniques in use by your
institution, rank accordingly? Scale: 1= always; 2 = sometimes; 3 = often; 4 =
never
Capital budgeting techniques in use Rank
Internal rate of return
Average rate of return
Net Present Value
Payback period
Benefit/Cost Ratio
Other
6) Are there other non-financial criteria used in major investment decisions, rank
accordingly? Scale: 1= always; 2 = sometimes; 3 = often; 4 = never
Item Rank
Safety of employees
Public benefit
Necessity of maintaining existing programs (e.g. NDP4)
Environmental Impact
Black economic empowerment

114
If others – please mention below!
---------------------------------------------------------------------------------------------
---------------------------------------------------------------------------------------------
---------------------------------------------------------------------------------------------
---------------------------------------------
7) Do you do any risk assessments during capital budget analysis?
Tick appropriate
Yes
No
8) What risk adjustment procedure do you use if any?
Risk adjustment procedure Tick Appropriate
Formal risk analysis
Risk adjusted discount rate
Sensitivity analysis
Scenario Analysis
Monte Carlo Simulation

115
9) What are the most difficult and the most important stages of the capital
budgeting process, rank accordingly? Scale: 1= most difficult; 2 = difficult ;
3 = important ; 4 = most important
The most difficult and the most important stages of the capital budgeting process Rank
1) Project definition and Cash flow estimation
2) Financial analysis and project selection
3) Project implementation
4) Project review
Both 1 &2
Both 2&3
Both 2 &4
Both 3 &4
10) Who are the capital budgeting decision makers in your organization?
Decision maker Tick appropriate
Board
External consultant
Financial officer
Team decision
Other
11) Capital budgeting analysis is mostly done by?
Analysis mostly done by Tick appropriate
Board
External consultant
Financial officer
Team decision
Other
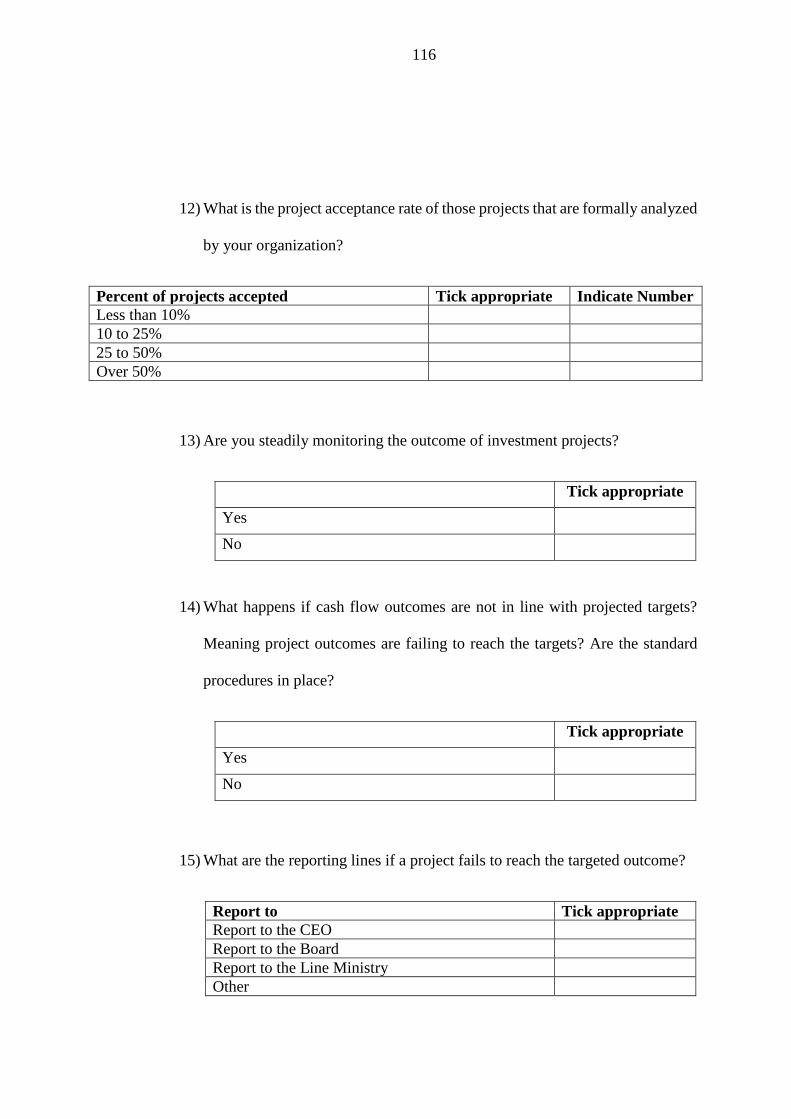
116
12) What is the project acceptance rate of those projects that are formally analyzed
by your organization?
Percent of projects accepted Tick appropriate Indicate Number
Less than 10%
10 to 25%
25 to 50%
Over 50%
13) Are you steadily monitoring the outcome of investment projects?
Tick appropriate
Yes
No
14) What happens if cash flow outcomes are not in line with projected targets?
Meaning project outcomes are failing to reach the targets? Are the standard
procedures in place?
Tick appropriate
Yes
No
15) What are the reporting lines if a project fails to reach the targeted outcome?
Report to Tick appropriate
Report to the CEO
Report to the Board
Report to the Line Ministry
Other

117
16) Do you have standard procedures in place if capital projects outcome re not
as expected?
Tick appropriate
Yes
No
17) Are exist strategies and exit point defined and exit losses calculated before an
investment is done?
Tick appropriate
Yes
No
18) Defined your exit strategy in cases of projected outcome are not in line with
your targets?
-------------------------------------------------------------------------------------------------
-------------------------------------------------------------------------------------------------
-------------------------------------------------------------------------------------------------
-------------------------------------------------------------------------------------------------
--------------------------------------------------------
19) Does your organization have any public reporting procedure on outcome of
your capital budgeting process?
Tick appropriate
Yes
No

118
20) Do you publish your investment and corporate risks within your annual report
Tick appropriate
Yes
No
21) Explain why good corporate governance can leads to good corporate
investment?
------------------------------------------------------------------------------------------------------
------------------------------------------------------------------------------------------------------
------------------------------------------------------------------------------------------------------
------------------------------------------------------------------------------------------------------
------------------------------------------------------------------------------------------------------
-------------------------------------------------------------------------

119
Appendix B
Source Author Thesis 2014 Participating List of SOE’s in the study
TransNamib Holdings Ltd
Air Namibia
August 26 Holdings (Pty) Ltd
Meat Corporation of Namibia
Telecom Namibia
Namibia Wild Life Resort
Namibia Post
Namibia Ports Authority
Namibia Agronomic Board
Agricultural Bank of Namibia
Development Bank of Namibia
Namibia Airports Company
Namibia Development Corporation
Namibia Institute of Pathology
Namibia Water Corporation
National Housing Enterprise
Namibia National Reinsurance corporation
New Era Publication Company
Offshore Development Company
Star Protection Services
Windhoek Machine Fabrik

120
Namibia Power Corporation
Roads Contractor Company
Road Fund Administration
Luderitz Waterfront Limited
Zambezi Waterfront Limited