a review of on-road vehicle mitigation measures · 9/12/2006 · a review of on-road vehicle...
TRANSCRIPT

A REVIEW OF ON-ROAD VEHICLE MITIGATION MEASURES
Contract AQ-04-01: Developing Effective and Quantifiable
Air Quality Mitigation Measures
September 12, 2006
By
Elizabeth Ann Yura
Douglas Eisinger, PhD
Deb Niemeier, PhD, PE
Abstract
Background: On-road vehicular mitigation measures are programs or strategies designed to
decrease the amount of vehicular emissions for a particular region or area, and are necessary for
the development of State Implementation Plans. These control measures can reduce vehicular
emissions directly or indirectly. There has been growing interest in assessing the effectiveness
of control measure programs that are proposed or have been implemented in practice.
Methods: This study reviewed a range of literature to provide insight into available control
measures with their large- and small-scale applications for both gasoline and diesel fueled
vehicles. Large-scale measures were classified into four categories: fleet retirement/replacement,
retrofitting, inspection and maintenance, and fuel additives/alternative fuel vehicles. Small-scale
measures included transportation system management, travel demand management, and special
focus on project-level diesel particulate matters (DPM).
Results: The vehicle mitigation measures could be essential strategies to reduce vehicular
emissions and mitigate negative health effects. At both large and small scales, the cost-
effectiveness of different measures may vary widely. Improving Inspection/Maintenance (I/M)
programs seemed to be the most cost-effective measure among large-scale measures. Many
project-level measures appeared costly and their cost-effectiveness were hard to quantify due to
involving expensive marketing tactics with cooperation from the public, employers, and trucking
industry.

About The U.C. Davis-Caltrans Air Quality Project
http://AQP.engr.ucdavis.edu/
Department of Civil & Environmental Engineering
University of California
One Shields Ave., Davis, CA 95616
(530) 752-0586
Mission: The Air Quality Project (AQP) seeks to advance understanding of transportation
related air quality problems, develop advanced modeling and analysis capability within the
transportation and air quality planning community, and foster collaboration among agencies to
improve mobility and achieve air quality goals.
History: Since the 1990s, the U.S. Federal Highway Administration and Caltrans have funded
the AQP to provide transportation-related air quality support. Caltrans and AQP researchers
identify and resolve issues that could slow clean air progress and transportation improvements.
Accessibility: AQP written materials and software tools are distributed through our
website, peer-reviewed publications, conference presentations, training classes, formal reports
and technical memoranda, and periodic newsletters.
Research: AQP investigations focus on project-level, regional-scale, and national-level
assessments. Tools and publication topics cover pollutant-specific problems such as those
involving particulate matter, carbon monoxide, carbon dioxide, ozone and air toxics; activity
data collection and assessment for on- and off-road vehicles and equipment; mitigation options
such as transportation control measures; policy analyses addressing transportation conformity
and state implementation plan development; litigation support; and goods movement
assessments.
Project Management
Principal Investigator and Director: Deb Niemeier, PhD, PE
Program Manager: Douglas Eisinger, PhD
Caltrans Project Manager: Mike Brady, Senior Environmental Planner
Air Quality and Conformity Coordination
Division of Transportation Planning, MS-32
California Department of Transportation
1120 N Street, Sacramento, CA 94274
(916) 653-0158

iii
TABLE OF CONTENTS
Section Page
LIST OF TABLES ......................................................................................................................... iv
LIST OF FIGURES .........................................................................................................................v
INTRODUCTION ...........................................................................................................................1
LARGE-SCALE CONTROL MEASURES ....................................................................................4
Fleet Retirement/Replacement Programs ............................................................................4
Retrofitting ...........................................................................................................................7
Inspection and Maintenance (I/M) .....................................................................................12
Fuel Additives and Alternative Fuel Vehicles ...................................................................16
Cost Effectiveness ..............................................................................................................19
PROJECT LEVEL CONTROL MEASURES ...............................................................................24
Transportation System Management (TSM) .....................................................................26
Transportation Demand Management (TDM) ...................................................................28
Special Focus: Project Level Diesel CMs ..........................................................................32
Cost Effectiveness ..............................................................................................................33
CONCLUSIONS............................................................................................................................35
REFERENCES ..............................................................................................................................37

iv
LIST OF TABLES
Table Page
1. NAAQS current standards ...........................................................................................................1
2. California and federal HDDV exhaust PM standards over time ..................................................5
3. California and federal HDDV exhaust NOx standards over time ................................................5
4. Lifetime emissions of diesel buses ..............................................................................................6
5. PM emissions reductions from retrofit/rebuild ............................................................................9
6. Estimated reduction in PM2.5 and hydrocarbon emissions due to a 2010 retrofit program .......11
7. Median estimate of statistical deaths averted per year per 1,000 vehicles retrofit in 2010 .......11
8. Projected emissions reductions by 2030 from diesel sulfur control ..........................................16
9. Advantages and disadvantages of clean fuels ............................................................................18
10. Cost effectiveness of large-scale mitigation measures ............................................................20
11. Possible project-level control measures ...................................................................................25
12. Cost effectiveness of large-scale mitigation measures ............................................................34

v
LIST OF FIGURES
Figure Page
1. Diesel vehicle PM emissions in California for 2000 and 2010 ...................................................5
2. Diesel vehicle NO2 emissions in California for 2000 and 2010 ..................................................6
3. Past and future NOx emissions for California ..............................................................................8
4. Past and future PM emissions for California ...............................................................................8
5. Average emission reductions before and after Smog Check .....................................................13
6. Gas cap failure rate for before and after Smog Check by testing station ..................................15

1
A REVIEW OF ON-ROAD VEHICLE MITIGATION MEASURES
Introduction
The Clean Air Act of 1990 required the Environmental Protection Agency (EPA) to
establish the National Ambient Air Quality Standards (NAAQS), which set national standards
for pollutants which were considered harmful or hazardous to human health and the environment
[1]. The pollutants and their standards are shown in Table 1.
Table 1: NAAQS current standards [1].
Pollutant Primary
Standards Averaging Times
Secondary
Standards
Carbon
Monoxide
9 ppm
(10 mg/m3)
8-hour1 None
35 ppm
(40 mg/m3)
1-hour1 None
Lead 1.5 µg/m3 Quarterly Average Same as Primary
Nitrogen
Dioxide
0.053 ppm
(100 µg/m3)
Annual
(Arithmetic Mean) Same as Primary
Particulate
Matter (PM10)
50 µg/m3
Annual2
(Arithmetic Mean) Same as Primary
150 ug/m3 24-hour
1 -
Particulate
Matter (PM2.5)
15.0 µg/m3
Annual3
(Arithmetic Mean) Same as Primary
65 ug/m3 24-hour
4
Ozone 0.08 ppm 8-hour5 Same as Primary
Sulfur Oxides
0.03 ppm Annual
(Arithmetic Mean) -
0.14 ppm 24-hour1 -
- 3-hour1
0.5 ppm
(1300 ug/m3)
1 Not to be exceeded more than once per year.
2 To attain this standard, the 3-year average of the weighted annual mean
PM10 concentration at each monitor within an area must not exceed 50ug/m3.
3 To attain this standard, the 3-year average of the weighted annual mean
PM2.5 concentrations from single or multiple community-oriented monitors
must not exceed 15ug/m3.
4 To attain this standard, the 3-year average of the 98th percentile of 24-hour
concentrations at each population-oriented monitor within an area must not
exceed 65ug/m3.
5 To attain this standard, the 3-year average of the fourth-highest daily
maximum 8-hour average ozone concentrations measured at each monitor
within an area over each year must not exceed 0.08 ppm.

2
According to the Clean Air Act section 176(c)(1)(B), if a transportation project is
federally supported, it should not cause any violations, increase the severity of current violations,
or effect the timely attainment of standards in any area. Areas that do not meet the NAAQS
standards (non-attainment areas), or areas that have previously violated NAAQS standards
(maintenance areas), are required to develop State Implementation Plans (SIPs) [2, 3]. SIPs
document how the NAAQS standards will be met or maintained, and should take into account
the cost of the program, the amount of emissions reduced, and also document how the SIP will
affect current regulatory programs [2, 3]. Additionally, SIPs for non-attainment areas must
include regional emissions budgets for the nonattainment pollutants and their precursors.
Because PM2.5 non-attainment areas risk losing federal funding, NAAQS attainment is an
important issue currently facing the state Departments of Transportation (DOTs) and
Metropolitan Planning Organizations (MPOs) [3].
Hot-spot analysis is required for carbon monoxide (CO) and particulate matter (PM)
nonattainment areas, and can assess potential (new or worsened) NAAQS violations [2];
however, implementation strategies to prevent violations are not provided in the regulations. In
addition, there is growing interest in evaluating mobile source air toxics at the hotspot level.
Some MPOs and DOTs have voiced concern about the effectiveness of control measure
programs, as well as the lack of information about proven measures already implemented [4].
Vehicular control measures are programs or strategies designed to decrease the amount of
vehicular emissions for a particular region or area, and are necessary for the development of
SIPs. Control measures can reduce vehicular emissions for an area or region directly (by
changing the amount emissions coming directly from the vehicle), or indirectly (by reducing
congestion/or number of vehicles on the road). Direct control measures can include vehicle
3
retrofits, stricter engine emission standards, engine modifications, and fuel reformulations to
achieve emission reductions, while indirect control measures include strategies such as
implementing rideshare programs, building toll roads to reduce traffic, and encouraging use of
public transportation/biking/walking. Although control measures will reduce emissions, their
effectiveness depends on their applicability (what emissions/situations are they most suited for)
as well as their cost-effectiveness (dollars per ton of pollutant reduced). Some control measures
are more effective at a smaller-scale, or project level, while others are more appropriate for
large-scale or regional levels. Small-scale mitigation measures are emissions reducing strategies
that are more applicable at a project-level, such as reducing congestion (and therefore emissions)
on a busy stretch of highway. To reduce congestion, a carpool, or HOV lane could be installed,
or converting the highway into a toll-road could also encourage people to take a different route,
and therefore reduce congestion. It would not be feasible (both in cost and applicability) to
require stricter emission standards for a highway or intersection to reduce emissions; therefore, it
would be a large-scale control measure, and not applicable on a project-level.
The following literature review is designed to provide insight into available control
measures for both gasoline and diesel fueled vehicles, and to also distinguish between their
small- and large-scale applications (small-scale in this context means at the project or
microscale, and large-scale applications refers to regional- or state- or national-scale controls).
The review focuses on control strategies applicable to the range off mobile source emissions,
such as CO, PM, and ozone precursor pollutants such as volatile organic compounds (VOCs)*
and oxides of nitrogen (NOX). However, the assessment places special emphasis on diesel
* Many documents in this review used different terms for the organic vehicular emissions, including hydrocarbons
(HC or HCX), volatile organic carbons (VOCs), and reactive organic gases (ROGs). For the exact compounds
specified by each term, please refer to the referenced document from which the term was originally used.

4
particulate matter (DPM), since various studies have emphasized DPM as the single most
important air toxic in urban areas [5, 6].
Large-Scale Control Measures
Two main ways to reduce vehicular emissions without reducing vehicle numbers would
be to reduce tail pipe emissions, and reduce traffic congestion. There are many large-scale ways
to reduce vehicular emissions, including: (1) introducing newer and cleaner vehicles into older
fleets by implementing early retirement/replacement programs, (2) retrofitting existing vehicles,
(3) implementing/enforcing more inspection and maintenance (I/M) programs, and (4)
introducing emission reducing fuels, or fuel additives, including the use of alternative fuel
vehicles. For large-scale emission control strategies to be successful, they should concentrate on
controlling the emissions of groups of vehicles currently on the road, as well as future vehicles
introduced into the fleet. The following is a comparison of the cost effectiveness and emission
reducing capabilities of the emissions control strategies listed above.
Fleet Retirement/Replacement Programs
Heavy-duty diesel vehicle (HDDV) PM emissions have declined over time due to more
stringent new-vehicle emission standards. The EPA established exhaust smoke standards for
HDDVs beginning in 1970; however, it was not until 1988 that exhaust PM standards were
implemented [7]. Tables 2 and 3 show PM and NOX standards over time.

5
Table 2: California and federal HDDV exhaust PM standards over time [8-12].
PM exhaust emission standards for
HDDVs model year
California and Federal Emissions Standards
(g/bhp-hr)
1988-1990 0.60
1991-1993 0.25
1994-2006 0.10
2007 and beyond 0.01
Table 3: California and federal HDDV exhaust NOX standards over time [8-12].
NOX exhaust emission standards for
HDDVs model year
California and Federal Emissions Standards
(g/bhp-hr)
1988-1990 6.0
1991-1997 5.0
1998-2001 4.0
2002-2006 2.0
2007 and beyond 0.2
Figures 1 and 2 show estimated decreases in PM and NOX in diesel vehicles due to new
engine emissions standards.
0
1000
2000
3000
4000
5000
6000
7000
8000
Pass
enge
r ca
r
Ligh
t-du
ty tru
ck
Med
ium-d
uty ve
hicle
Hea
vy-d
uty truc
ks
Scho
ol B
us
Urb
an B
us
Mot
or H
ome
Total
PM 2000
PM 2010
Figure 1: Diesel vehicle PM emissions (in Tons/Year) in California for 2000 and
2010 (Light-duty trucks: up to 5,750 lbs. GVWR, medium-duty vehicle: 5,751-
8,500 lbs. GVWR, and heavy-duty trucks: over 8,501 lbs. GVWR) [8].

6
0
50000
100000
150000
200000
250000
Pass
enge
r ca
r
Ligh
t-du
ty tru
ck
Med
ium-d
uty ve
hicle
Hea
vy-d
uty truc
ks
Sch
ool B
us
Urb
an B
us
Mot
or H
ome
Tota
l
NOx 2000
NOx 2010
Figure 2: Diesel vehicle NOX emissions (in Tons/Year) in California for 2000
and 2010 [8].
In another study, Schimek (2001) found that a 1998 transit bus (an urban example of a
high-emitting diesel vehicle) emits 50% less PM, and 5% less NOX than a bus built 8 years
earlier. An increase in emissions due to vehicle age and higher standards (both PM and NOX) is
shown Table 4 for diesel buses. The following calculations assume that engines are rebuilt in the
eighth year after accumulating about 290,000 miles and follow this same mileage accumulation
curve. Transit buses were used because they have been the focus of previous emissions
regulations, and are regularly found in large numbers in cities [13].
Table 4: Lifetime emissions of diesel buses[13].
Model year Lifetime emissions (Mga)
PM NOX
1990 0.514 8.847
1998 0.242 8.352
Difference 0.272 0.495 aMg = 10
6 g

7
Although new emission standards are meant to reduce overall emissions, the benefits can
be offset by the lack of new vehicles being introduced into the fleet. As engines are built to be
more durable, they will last longer, and the positive impact of introducing cleaner vehicles into
the fleet will decrease over time. In addition, emission standards applied to only new vehicles,
along with the durability of diesel engines, can discourage rapid fleet turnover [14, 15]. In order
to gain the benefits of newer and cleaner vehicles (particularly diesel vehicles), vehicle
scrappage and/or retirement programs can be implemented to remove older high emitting
vehicles from fleet. These programs are usually operated by a private organization that pay the
owners of older vehicles to voluntarily turn their high-emitters over for scrapping, or removal
from the road [16]. Vehicles are usually eligible for scrapping based on their model year or age;
however, as the number of older vehicles in the fleet decreases, so will the benefits of vehicle
scrappage/retirement programs.
Retrofitting
For many years, it has been widely understood that a small fraction of motor vehicles
produces the majority of emissions for any single pollutant. A common approximation ahs been
to estimate that 10% of vehicles produce 50% of the emissions for any single pollutant [1],
although in recent years data indicate that, as the vehicle fleet rolls over to cleaner operating
vehicles, an even smaller fraction of vehicles may be responsible for the bulk of the emissions
[17]. An effective long-term way to reduce tail pipe emissions is to target gross polluters by
either replacing, or retrofitting them. These programs target all gross polluting vehicles (both
heavy- and light-duty); however, PM emitted from heavy-duty diesel vehicles (HDDV) has been
identified as one of the most important pollutants form a public health perspective and is

8
therefore a greater concern [13]. Estimated PM and NOX emissions for California are shown in
Figures 3 and 4 for both gasoline and diesel vehicles.
0
100
200
300
400
500
600
700
800
2005 2010 2020
NO
X E
mis
sio
ns
(T
on
s/d
ay
)
Gasoline
Diesel
Figure 3: Past and future NOX emissions for California [18].
0
5
10
15
20
25
2005 2010 2020
PM
Em
iss
ion
s (
To
ns
/da
y)
Gasoline
Diesel
Figure 4: Past and future PM emissions for California [18].

9
Although NOX and PM are predicted to decrease over time, this will only occur if
assumed vehicle turnover rates occur. Newer diesel engines will produce less PM and NOX;
however, diesel vehicles are long-lived and it will take many years for older vehicles to be
replaced by cleaner-operating vehicles. In addition, because DPM is an important contributor to
air toxics risk, there is a greater need to either replace older HDDV, or retrofit them with newer,
cleaner technologies.
For the control of PM and NOX, re-designing engines to produce higher pressure and a
shorter burning period (more precise regulation of the fuel/air mixture) can result in a decrease in
emissions [13]. Also, changes in the fuel injection system, intake air system, and combustion
chamber can all result in lower emissions of PM and NOX [13]. Included in the 1990 Clean Air
Act Amendments was a retrofit/rebuild program, which required the addition of PM emissions
reductions kits when, for example, a bus engine was rebuilt [1, 2, 19]. A “full retrofit kit” and a
“25% retrofit kit” had to be EPA certified for a specific engine type, and would reduce bus PM
emissions to 0.10 g/bhp-h. Depending on the retrofit kit and bus model type, the kits could
potentially result in an overall PM reduction rate ranging from 30% to more than 50% (full kit);
a “25% retrofit kit” can also be used to reduce current emissions by 25%, at a lower cost to the
installer. [13]. The lifetime PM emissions are shown in Table 5 for each kit type.
Table 5: PM emissions reductions from retrofit/rebuild [13]
Engine Type (kit type) Lifetime PM emissions (Mga)
No kit With kit Δ
1987 or older diesel (full) 0.340 0.050 0.290
1987 or older diesel (25%) 0.679 0.408 0.272
1988-1989 diesel (25%) 0.408 0.289 0.119 aMg = 10
6 g = 1.102 Tons

10
Diesel retrofit technologies can target many different types of emissions, one being
particulate matter (PM). Ways to control PM from a diesel engine include diesel particulate
filters (DPFs) and diesel oxidation catalysts (DOCs). DPFs can drastically reduce PM emissions,
usually by 80 to 95%, as well as reducing hydrocarbon and carbon monoxide emissions [15].
DPFs trap particulate matter on a filter, and then, depending on the type of DPF, burn the matter
off, releasing small amounts of water and carbon dioxide. This “filter regeneration” can occur in
many different ways, sometimes as a result of a catalyst. Using a catalyzed filter causes the PM
to ignite at the typical temperature of exhaust, and has been used successfully worldwide as a
retrofit technology [15]. Although this type of filter has been used with positive results, it is not
compatible with many older engine types, and also because of its requirement of an ultra-low
sulfur fuel (<=30ppm sulfur), for optimum filter performance [15]. Because of these restrictions,
an actively regenerating filter is sometimes used. This filter does not require any special fuel
regulations, and is also compatible with older diesel engines. Although use of this filter has less
restrictions then the catalyzed filter, it is still considered an experimental retrofit, and has not
been used in mass production for larger fleet sizes [15]. These active regeneration filters use a
burner (fuel or electric) to heat the exhaust, which burns off the PM from the filter. This method
causes increased fuel consumption because of the extra energy needed by the burner to heat the
exhaust. DOCs are an alternative form of PM control that oxidizes the soluble organic fraction of
the PM released overall reducing PM emissions by 20-50% [15]. DOCs are established
technology that is easy to retrofit and maintain; although they are a more popular and cheaper
way to retrofit, they are also not as effective as a DPF [15]. A table of emission reductions due to
DPFs and DOCs is shown in Table 6.
11
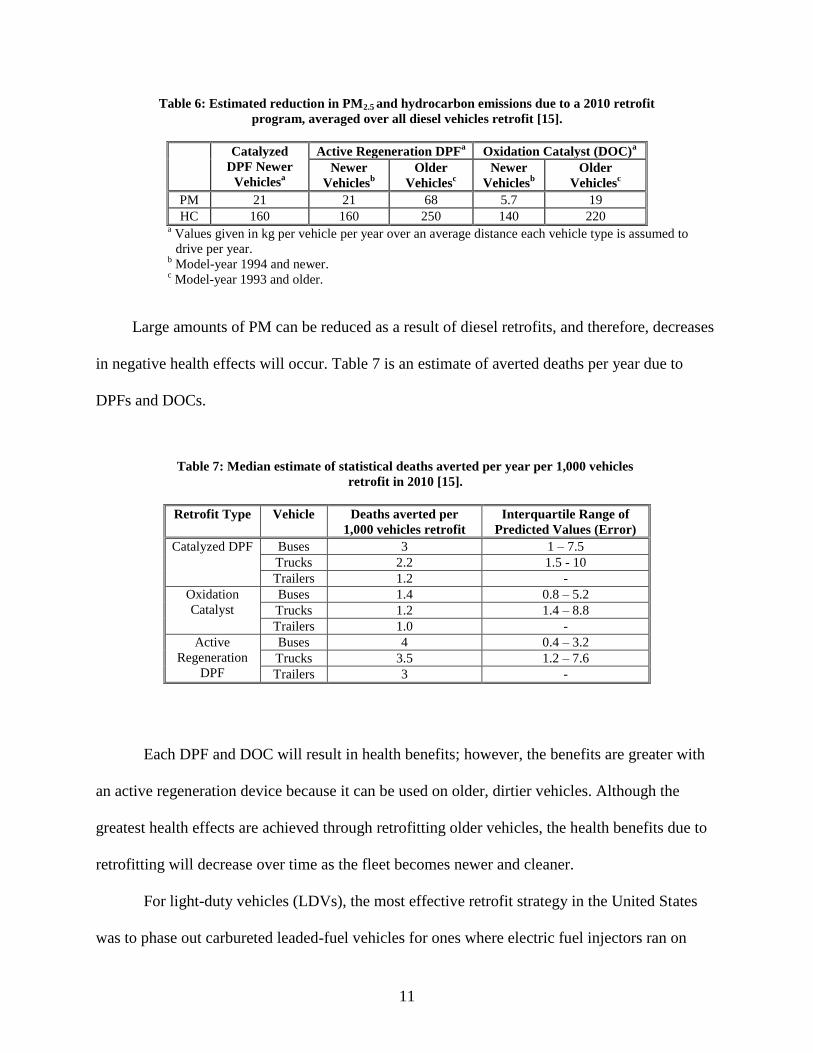
Table 6: Estimated reduction in PM2.5 and hydrocarbon emissions due to a 2010 retrofit
program, averaged over all diesel vehicles retrofit [15].
Catalyzed
DPF Newer
Vehiclesa
Active Regeneration DPFa Oxidation Catalyst (DOC)
a
Newer
Vehiclesb
Older
Vehiclesc
Newer
Vehiclesb
Older
Vehiclesc
PM 21 21 68 5.7 19
HC 160 160 250 140 220 a Values given in kg per vehicle per year over an average distance each vehicle type is assumed to
drive per year. b Model-year 1994 and newer.
c Model-year 1993 and older.
Large amounts of PM can be reduced as a result of diesel retrofits, and therefore, decreases
in negative health effects will occur. Table 7 is an estimate of averted deaths per year due to
DPFs and DOCs.
Table 7: Median estimate of statistical deaths averted per year per 1,000 vehicles
retrofit in 2010 [15].
Retrofit Type Vehicle Deaths averted per
1,000 vehicles retrofit
Interquartile Range of
Predicted Values (Error)
Catalyzed DPF Buses 3 1 – 7.5
Trucks 2.2 1.5 - 10
Trailers 1.2 -
Oxidation
Catalyst
Buses 1.4 0.8 – 5.2
Trucks 1.2 1.4 – 8.8
Trailers 1.0 -
Active
Regeneration
DPF
Buses 4 0.4 – 3.2
Trucks 3.5 1.2 – 7.6
Trailers 3 -
Each DPF and DOC will result in health benefits; however, the benefits are greater with
an active regeneration device because it can be used on older, dirtier vehicles. Although the
greatest health effects are achieved through retrofitting older vehicles, the health benefits due to
retrofitting will decrease over time as the fleet becomes newer and cleaner.
For light-duty vehicles (LDVs), the most effective retrofit strategy in the United States
was to phase out carbureted leaded-fuel vehicles for ones where electric fuel injectors ran on

12
unleaded gasoline [20]. By using electric fuel injectors, the engine can run more oxygen rich and
fuel lean, decreasing the overall emissions [13]. In addition, using rare-earth oxides (REOs) in
catalytic converters (REO catalysts) is a cost effective way to reduce emissions by an average of
99% for CO, 80% for HC, and 92% for NOX [20].
Inspection and Maintenance (I/M)
States or areas that are located within an ozone transport region, and are classified as a
non-attainment area, are required by the CAA to implement I/M programs. In addition, larger
metro statistical areas (MSA) may be required, depending on their size, to implement I/M
programs as well, regardless of their attainment status [21]. A “basic” I/M program uses
relatively simple equipment to measure tail pipe emissions while a vehicle idles; however, in
areas that contain more challenging air quality issues, the CAA Amendments of 1990 require an
“enhanced” I/M program be implemented [22]. An “enhanced” I/M program usually uses a
dynamometer, which is a more complex piece of equipment [22]. Enhanced smog checks are
estimated to reduce fleet emissions in California on an average of 17% for HCs, 9% for NOX,
and 28% for CO [23], with another possible estimate is a 14-28% reduction of HCs in Southern
California’s South Coast Air Basin [22].
An I/M program works by requiring inspection (either basic or enhanced) on a periodic
basis; in California, I/M (or “Smog Checks”) are required once every two years and upon change
of ownership in the larger metropolitan areas. Tests can be completed at a centralized,
decentralized, or hybrid station. A centralized station is commonly referred to as a Test-Only
station, which only tests for emissions, and does not do any on-site vehicular repairs. Although
this type of station has a low cost to operate, and performs a high volume of inspections, there

13
are fewer testing sites, and sometimes a longer travel time to reach them [17]. In addition, if the
vehicle is repaired off-site, and returns to a centralized location only to fail the test again
(referred to as the “ping-pong” effect), it may potentially discourage motorists from seeking
additional vehicle repair [17]. The second type of inspection station solves this “ping-pong”
effect by providing on-site vehicles repairs, and is a decentralized or Test-and-Repair station.
Test-and-Repair stations are low volume, but larger in number, resulting in smaller lines when
compared to a Test-Only station [17]. Although the Test-and-Repair stations are more
convenient to motorists, they are also more difficult to monitor, and lead to more instances of
fraud [17]. Test-and-repair stations have a potential conflict of interest: they may intentionally
fail vehicles in order to receive more money in on-site repairs; or, they may intentionally pass
vehicles that require repair, to maintain good customer relationships [17]. Also, the lack of
quality control of monitoring and repair equipment can result in fewer emissions reduced.
Average emission reductions for both types of testing stations are shown in Figure 5.
0
5
10
15
20
25
30
35
40
HC 5015 HC 2525 CO 5015 CO 2525 NO 5015 NO 2525
Pollutant
% R
ed
ucti
on
Test-Only
Test-and-Repair
Figure 5: Average emission reductions before and after Smog Check [24].

14
From Figure 5, it is shown that average emission reductions can be as large as 35% for
some pollutants, and have the potential to dramatically decrease emissions of HCs, CO, and NOX
for a non-attainment area. However, from Figure 5 it is also shown that the amount of emission
reductions can depend heavily upon the type of station conducting the inspection. Since SIP
emission reductions depend on at least 40% of vehicles with the highest probability of failure
visiting a Test-Only facility [24], if fewer vehicles are directed there, an overestimation of
emissions reductions can occur. If Test-and-Repair stations consistently perform poorly, they
give gross emitters a greater probability of escaping repair through I/M programs. As a solution
to this problem, hybrid stations can be used, which incorporate a number of high volume Test-
Only stations with fewer low-volume Test-and-Repair stations [17]. Under this program, a larger
fraction of vehicles which are estimated to have high emissions are sent to Test-Only stations,
which ensures those vehicles will be tested at stations with high quality control [17]. Although
the program can significantly reduce NOX, CO, and HC emissions, a significant portion of high
emitting vehicles must be directed to Test-Only stations to achieve significant results [24].
In addition to tail-pipe inspections, gas cap inspections are also conducted at I/M
facilities. The gas cap is an important component which prevents fumes from inside the tank
from releasing into the atmosphere; however, it is one that should be repeatedly replaced over the
vehicles’ lifetime [17]. If a faulty gas cap is not replaced, an estimated 20 g of HC per day of
evaporative emissions will be released [17]. Reductions in gas cap failures before and after smog
check is shown in Figure 6. For this test, there was no difference between the Test-Only and
Test-and-Repair stations.

15
0
2
4
6
8
10
12
14
Before Smog Check After Smog Check
Gas C
ap F
ailu
re R
ate
(%
)
Test-Only
Test-and-Repair
Figure 6: Gas cap failure rate for before and after Smog Check by
testing station [24].
Although vehicles in some areas are required by the CAA to visit I/M facilities yearly,
many vehicles, including gross polluters, avoid inspection to prevent potential costly repairs. As
a solution to this problem, remote sensing of gross polluters (similar to red light sensors) has
been suggested near schools and off/on ramps to freeways as a way to catch vehicles illegally
avoiding I/M programs [25]. In addition, these sensors can be a useful way to track fleet
emissions, as well as estimate the effectiveness of I/M repairs over time [25]. Although remote
sensors may be used to catch delinquent vehicles, there are several problems when using this
equipment conjointly with I/M programs. If apparent gross polluters are identified under this
system, and letters are sent to the owners of these, it is estimated that only 35%-40% of people
are likely to respond [26]. In addition, since only one second of the vehicle’s emission profile is
recorded by the remote sensor, the emissions captured may not accurately represent the total
emissions of the vehicle [25]. False reporting (or false positives for gross polluting) could
potentially decrease public support, and decrease the effectiveness of the program [26]. Without

16
an effective way to enforce I/M compliance, gross polluters that refuse inspection will hinder the
ability of the program to reduce emissions.
Fuel Additives and Alternative Fuel Vehicles
Changing the fuel of a vehicle is an effective way to reduce emissions in both light- and
heavy-duty vehicles. One way to change the composition of the fuel is by adding a cetane
number enhancer. Adding this enhancer will cause the fuel to ignite earlier, requiring less fuel
for the same power output, as well as reduction in NOX emissions [27]. Because these
reformulated fuels for heavy-duty vehicles require no engine modifications, they are also a cost-
beneficial way to reduce emissions [27]. In addition to decreasing NOX, PM reductions are also a
priority when reducing heavy-duty vehicular emissions. By requiring the sulfur content in diesel
fuels to decrease, sulfur particulate formation will be reduced, and will also reduce damage to
emissions control systems that are sensitive to higher sulfur contents fuels [13]. Throughout
2006, the EPA will require a reduction in sulfur content in diesel fuels to be no more than 15
ppm for use in highway vehicles, for terminal level, and for retail stations fleets [12]. The EPA
estimates that the decrease in sulfur particulate will prevent 8,300 premature deaths, over 9,500
hospitalizations and 1.5 million missed work days [12]. Each new truck or bus will be
approximately 90% cleaner, with projected emissions reductions (by 2030) shown in Table 8.
Table 8: Projected emissions reductions by
2030 from diesel fuel sulfur control [12].
Emission Reduced Tons
NOX 2.6 million
Non-Methane HC 115,000
PM 109,000

17
Another way to reduce emissions from diesel vehicles is to replace a portion of the diesel
fuel with biodiesel. Biodiesel is diesel fuel that is made from natural, renewable resources, such
as vegetable oils [28]. A study by Graboski et al. (1996) compared emissions from 5 different
fuels, including a 20, 35, 65, and 100% biodiesel (blended with diesel fuel) mixture, and a
reference fuel (no biodiesel); the engine efficiency for the biodiesel blends, biodiesel and the
reference fuel did not change [28]. For the mixture containing only 35% biodiesel, the NOX
emissions increased by 1%, with little change of the other emissions; however, for the 100%
biodiesel, the NOX increased by 11%, the PM decreased by 66%, the CO was reduced by 47%,
and the HCs were reduced by 44%. This study concludes that biodiesel may decrease some
emissions, such as PM, CO, and HCs, but it does not reduce NOX [28].
For light-duty vehicles (LDVs), the EPA has regulated gasoline fuels and additives to
decrease emissions, and in the past has banned lead and highly volatile gasoline across the
country [29]. The EPA began requiring (beginning in 1995) that severe ozone nonattainment
areas use reformulated gasoline (RFG) in the summer to reduce ozone precursors [29]; the use of
RFG blends show a much lower total mass of toxins emitted than average industry level gasoline
[30]. RFG blends combine compounds such as aromatics, olefin, and oxygenates such as ethyl
tert-butyl ether (ETBE) or methyl tert-butyl ether (MTBE) with gasoline to maintain an octane
level decreased by the phasing out of lead compounds [30]. However, because of the
groundwater contamination cause by MTBE, some states have banned its use in RFG [29].
Although using RFG reduces VOCs such as formaldehyde and benzene, they do little to decrease
(and in some cases increase) NOX emissions; however, reducing the sulfur content can
effectively decrease vehicular NOX [30]. As a result, the allowable sulfur content in gasoline has

18
been reduced by the EPA, to an average of 30 ppm, and a cap of 80 ppm sulfur requirement that
must be implemented by the end of 2006 [29].
The replacement of current vehicles with vehicles that run on clean fuels (fuels that
produce fewer emissions than current gasoline/diesel fuels) is another option for reducing
vehicular emissions. This option is less widely used because it requires engine modification, or
total vehicle replacement which can be costly. Replacing current vehicles with ones that run on
electricity, ethanol, methanol, natural gas (methane), or propane are all options that will produce
less emissions then vehicles currently running on gasoline or diesel fuel [31]. A summary of the
advantages and disadvantages associated with these vehicles is available from the EPA, and is
also shown in Table 9.
Table 9: Advantages and disadvantages of clean fuels [31].
Fuel Advantages Disadvantages
Electricity Potential for zero vehicular emissions
Power plant emissions easier to control
Can recharge at night when power demand is
low
Current technology is limited
Higher vehicle cost; lower vehicle range,
performance
Less convenient refueling
Ethanol Excellent automotive fuel
Very low emissions of ozone-forming HCs and
toxics
Made from renewable sources
Can be domestically produced
High fuel cost
Somewhat lower vehicle range
Methanol Excellent automotive fuel
Very low emissions of ozone-forming HCs and
toxics
Can be made from a variety of feedstock,
including renewables
Fuel could initially be imported
Somewhat lower vehicle range
Natural
Gas
Very low emissions of ozone-forming HCs,
toxics, and CO
Can be made from a variety of feedstock,
including renewables
Excellent fuel, especially for fleet vehicles
Higher vehicle cost
Lower vehicle range
Less convenient refueling
Propane Cheaper than gasoline today
Most widely available clean fuel today
Somewhat lower emissions of ozone-forming
HCs and toxics
Excellent fuel, especially for fleet vehicles
Cost will rise with demand
Limited supply
No energy security or trade balance benefits

19
As shown in Table 9, many of the alternative clean fuels have their advantages; however,
the cost to produce the fuels as well as the limited available technology make them more suited
for fleet vehicles, and not for most passenger vehicles.
Cost Effectiveness
Estimated costs for possible large-scale mitigation measures are shown in Table 10. It is shown
that each CM can have a large range of high and low cost-effective options. Although
introducing more stringent NAAQS for new vehicles every few years could be a cost-effective
way to reduce emissions, the price per ton of emissions reduced would increase over the years
due to complexity of reducing the emissions of the cleaner vehicle. Also, if approximately 10%
of vehicles produce 50% or more of the pollution, this solution does little to reduce the emissions
of cars already present on the road [1]. Some aspects of retrofitting or retiring vehicles can be
cost-effective; however, replacing entire fleets can cost as much as $4 million/ton for the
reduction of ROGs [32, 33]. Additionally, replacing current fleets with alternative fuel vehicles
can be cost-effective; however, without readily available fueling stations, these technologies are
not feasible for large-scale passenger use [31]. By retrofitting older HDV and LDV, and using
fuel additives in existing engines, there are more cost effective possibilities for reducing
vehicular emissions. However, the CM with the most cost-effective measures is improving
current I/M programs. Although this is not a complete list of control measures and their cost-
effectiveness, I/M programs have frequently been listed as core air pollution controls for urban
areas [22].

20
Table 10: Cost effectiveness of large-scale mitigation measures.
Control Measures
Potential
Emission
reductions (%)
Cost effectiveness
Range ($/Ton) Average
Cost
Effectiveness
($/Ton)
Source Category and
Affected Vehicle
Type:
Gasoline (G) or
Diesel (D)
Type Pollutant Low High Low High
New-vehicle
standards
G and
D
Require on-board
diagnostics on new diesel and gasoline
trucks and buses
NOX - 1.1 - $28,251 $28,251
[32, 33]
ROG - 4.2 - $162,228 $162,228
New-vehicle
standards
G and
D
Stricter Engine
Standards (1991-1998)
NOX - - - $419 $419 [13]
New-vehicle
standards
G and
D
Stricter Engine
Standards (1991-1996)
PM - - - $3,207 $3,207 [13]
Retrofitting D
Retrofit emission
controls on heavy
duty diesel vehicles
NOX 1.7 24.0 $4,700 $17,000 $10,850
[32, 33] ROG 3.1 7.7 $0 $90,500 $45,250
Retrofitting D
Retrofit heavy-duty
diesel vehicles with dual fuel (LNG and
diesel) engines
NOX - 30.2 - $31,700 $31,700 [32, 33]
Retrofitting G
Retrofit with 3-way
catalysts on
gasoline-burning
heavy duty trucks
that currently have 2-way catalysts or
no catalysts
NOX 2.2 89.9 $200 $2,300 $1,250
[32, 33]
ROG 2.7 55.9 TBD TBD TBD
Retrofitting G
Install new engines with 3-way catalysts
on gasoline-burning
heavy duty trucks that currently have
2-way catalysts or no catalysts
NOX 3.6 70.9 $3,000 $13,000 $8,000
[32, 33]
ROG 0.3 52.8 TBD TBD TBD
Retrofitting D
Repower heavy- duty diesel vehicles
with newer, lower
emitting engines
NOX 17.8 $9,100 $10,500 $9,800
[32, 33]
ROG - 79.1 $36,300 $87,100 $61,700
Retrofitting G and
D
Reduce emission
from heavy-duty
vehicles serving transportation
facilities
NOX 0.0 0.3 - $13,000 $13,000
[32, 33]
ROG NA NA - $420,000 $420,000
Retrofitting D Heavy-duty engine
ECM recalibration
NOX - 7.2 - $149 $149
[32, 33] ROG - 23.8 - $1,135 $1,135

21
Table 10: Cost effectiveness of large-scale mitigation measures (continued).
Retrofitting G
Implement a
program to replace
catalysts in light duty vehicles and
trucks, including
SUVs
NOX 5.4 9.6 $3,800 $6,800 $5,300 [32, 33]
ROG 5.3 8.9 $3,900 $6,500 $5,200
Retrofitting D 25% Reduction
retrofit kit PM - - $8,800 $20,150 $14,475 [13]
Retrofitting D Full reduction
retrofit kit PM - - - $32,800 $32,800 [13]
Fuel
Additives D
Use emulsified
diesel fuel in all diesel-burning
heavy duty
vehicles
NOX 2.1 8.3 - $38,989 $38,989 [32, 33]
Fuel
Additives G
CA Phase 3 Reformulated
Gasoline
VOC +
NOX - - $2,000 $2,000 $2,000 [34]
Fuel
Additives G
Federal Phase 2 Reformulated
Gasoline
VOC +
NOX - - $3,600 $83,500 $43,550 [34]
Fuel
Additives G
CA Phase 2 Reformulated
Gasoline
VOC +
NOX - - $3,600 $45,000 $24,300 [34]
I/M G and
D
Provide free
replacement gas caps to light- and
medium-duty
vehicle owners
ROG - 1.8 $31,000 $142,000 $86,500 [32, 33]
I/M G and
D
Improve smog
check
NOX 4.8 7.3 $10,700 $12,700 $11,700 [32, 33]
ROG 3.4 7.2 $11,400 $13,700 $12,550
I/M G and
D
Increased smoking vehicle enforcement
NOX - 0.1 - $696,300 $696,300 [32, 33]
ROG - 2.5 - $15,800 $15,800
I/M G and
D
Use remote sensors and license plate
photos to identify
smoking vehicles
ROG - 0.0 - $324,633 $324,633 [32, 33]
I/M G and
D
Allow district to opt into test-only
program
NOX - 1.1 - $6,523 $6,523
[32, 33] ROG - 1.4 - $4,882 $4,882
I/M D
Include NOX
screening in the
heavy-duty vehicle inspection program
NOX - 1.6 - $7,900 $7,900
[32, 33]
ROG - 10.4 - $24,700 $24,700
I/M G
End the motorcycle smog check
exemption
NOX - 3.8 - $167,880 $167,880 [32, 33]
ROG - 6.7 - $30,166 $30,166

22
Table 10: Cost effectiveness of large-scale mitigation measures (continued).
I/M D
Augment truck and bus inspections with
community-based
inspections
NOX 0.1 2.4 - $4,000 $4,000
[32, 33]
ROG 0.6 8.6 - $10,000 $10,000
I/M D
Establish a heavy-
duty smog check program
NOX - 2.6 - $7,900 $7,900 [32, 33]
ROG - 6.7 - $24,800 $24,800
I/M G and
D
Halt the rolling
30-year exemption in the Smog
Check program
NOX - 0.5 - $25,100 $25,100
[32, 33] ROG - 2.3 - $9,500 $9,500
I/M G and
D
Transfer Smog
Check operations
to a government
agency
NOX - 1.1 - $6,004 $6,004
[32, 33] ROG - 1.4 - $4,493 $4,493
I/M G and
D
Inspection and
Maintenance
NOX +
VOC - - $1,800 $5,800 $3,800 [34]
I/M G and
D Remote Sensing
NOX +
VOC - - - $4,100 $4,100 [34]
I/M G and
D
Inspection and
Maintenance
NOX +
HC - - - $5,300 $5,300 [35]
I/M G and
D
Inspection and
Maintenance
NOX +
HC - - $4,400 $9,000 $6,700 [17]
Fleet
retirement/
replacement
programs
G and
D
Implement a light
duty vehicle
retirement program
for gross polluters
NOX 0.7 1.3 $59,000 $118,000 $88,500
[32, 33]
ROG 1.2 1.8 $39,300 $59,000 $49,150
Fleet
retirement/
replacement
programs
D
Accelerate the turnover of older,
higher emitting
engines to cleaner, late model engines
for heavy duty
diesel vehicles
NOX 2.6 27.4 $7,000 $34,000 $20,500
[32, 33]
ROG 4.0 40.0 $50,000 $500,000 $275,000
Fleet
retirement/
replacement
programs
G and
D
Establish Clean
Fleet Requirements for public fleets
NOX 0.1 0.2 $13,000 $30,000 $21,500
[32, 33] ROG 0.1 0.2 $25,000 $59,000 $42,000
Fleet
retirement/
replacement
programs
D
Purchase new low-
emission heavy-duty
vehicles instead of
diesel vehicles
NOX - 1.6 - $95,800 $95,800
[32, 33]
ROG - 1.3 - $3,900,00
0 $3,900,000
Fleet
retirement/
replacement
programs
G and
D
New Capital Transit
Systems/Vehicles
NOX +
VOC - - $8,500 $471,000 $239,750 [34]
Fleet
retirement/
replacement
programs
G and
D
Conventional Transit Service
Upgrades
NOX +
VOC - - $3,800 $120,000 $61,900 [34]

23
Table 10: Cost effectiveness of large-scale mitigation measures (concluded).
Fleet
retirement/
replacement
programs
G and
D
Conventional-Fuel
Bus Replacement
NOX +
VOC - - $11,000 $39,900 $25,450 [34]
Fleet
retirement/
replacement
programs
G and
D
Old-vehicle
Scrappage
NOX +
VOC - - $2,500 $6,400 $4,450 [34]
Alternative
Fuel
Vehicles
G and
D
Alternative-Fuel
Buses
NOX +
VOC - - $6,700 $569,000 $287,850 [34]
Alternative
Fuel
Vehicles
G and
D
Compressed
Natural Gas
Vehicles
NOX + VOC
- - $0 $3,600 $1,800 [34]
Alternative
Fuel
Vehicles
G and
D Methanol Vehicles
NOX +
VOC - - $5,300 $43,600 $24,450 [34]
Alternative
Fuel
Vehicles
G and
D
Hybrid Electric
Vehicles
NOX +
VOC - - $1,100 $18,900 $10,000 [34]
Alternative
Fuel
Vehicles
G and
D Electric Vehicles
NOX +
VOC - - $6,600 $72,400 $39,500 [34]
Alternative
Fuel
Vehicles
G and
D
Liquefied Petroleum
Gas Vehicles
NOX +
VOC - - $13,000 $80,000 $46,500 [34]
Alternative
Fuel
Vehicles
G and
D Ethanol Vehicles
NOX + VOC
- - $12,600 $152,200 $82,400 [34]
Alternative
Fuel
Vehicles
G and
D
Alternative-Fuel Vehicles
NOX + VOC
- - $4,000 $31,600 $17,800 [34]
Project-Level Control Measures
Project-level control measures are those that are applicable on a small-scale level, and
can be used to improve air quality over a limited range, such as a section of roadway, or area of a
city. These CMs are driven largely by PM hot-spots, and by conformity assessments for CO;
however, diesel particulate matter (DPM) and HCs are also of growing concern. CMs that reduce
vehicular emissions on the project level work in two main ways: by changing the behavior of
drivers, Transportation Demand Management (TDM), or by changing the way traffic flows,
Transportation System Management (TSM). Examples of TSM and TDM are shown in Table 11.

24
Table 11: Possible project-level control measures [3, 16, 34, 36, 37].
Project-Level
Control
Measure
Categories Examples
TSM
Roadway Limitations
Install High Occupancy Vehicle (HOV) lanes
Increase roadway capacity (increase lanes)
Limit access to clean vehicles (ZEV, pZEV,
SULEV, ULEV)
Limited use/access to downtown areas (during
peak congestion times)
Charge to enter congested area
Set up a toll road system
Traffic Operations
Traffic signal timing
Ramp metering
Turning restrictions
Conversion of two-way to one-way streets
Accident Avoidance Enhance roadside assistance
Visual electronic traffic alerts
Commercial vehicle
control
Loading zone controls
Truck routing/scheduling
TDM
Park-and-Rides Additional park-and-ride facilities
Employer
Programs/Ridesharing
Employer trip reduction programs
Telecommute (Satellite work centers)
Permitting flexible work schedules
Vanpools
Ridesharing
Public education Additional public outreach
Bicycle/pedestrian-
oriented programs
Bicycle paths
Secure bicycle storage
Pedestrian malls
Road limitations to support non-motorized
vehicles and pedestrians
Transit/paratransit
improvements
Shuttles
Bus service
Rail service
Additional park-and-ride facilities
Pricing Gasoline/vehicle taxation
Transit fare/toll adjustments
Trip reduction
ordinances (TROs)
Requiring a reduction of VMT, trips, or other
methods of reducing travel
Parking management Parking restrictions /rate changes
Other Controls Truck controls
Reductions in truck or vehicle idling
Re-direct trucks around central business areas
Designated loading zones

25
Transportation System Management (TSM)
Single occupancy vehicles (SOVs) as a percentage of commuters have increased over the
years [38]. It has been hypothesized that these increases have resulted because of increased
vehicle availability, an increase in vehicle ownership (because of increased wages, or decrease in
vehicle ownership cost), or because ridesharing has lost its convenience/cost effectiveness for the
commuter [38]. One way to reduce the amount of SOVs on the roadway is to introduce
incentives for HOVs. HOV lanes are lanes designated for use by vehicles with more than one
occupant, and include vanpools, carpools, and transit vehicles. The EPA lists HOV
implementation as one of the most popular CM, and can add additional capacity to a roadway,
decreasing congestion and therefore vehicular emissions [16]. HOV lanes can operate full-time,
during peak hours for commuter traffic, and can also involve reversal of travel direction
depending on the more congested trip direction [16]. In addition, adding parking facilities at the
entrance to HOV lanes may also decrease vehicular emissions by making a more efficient
transfer point between the vehicle and the HOV lane [16]. It has also been suggested that
offering the use of HOV lanes to SOVs for a small fee would reduce traffic congestion and also
reduce the cost of implementation. Although the additions of HOV lanes are a popular choice
when reducing vehicular emissions, they may not have as great of emission reducing potential.
Some studies suggest that HOV lanes have an average emissions reduction of about 1%, which is
small compared to its potential cost [16]. In addition, the EPA estimates that the average time for
a HOV lane to be planned, designed, and constructed can be between 3 to 8 years [16].
Traffic operations are used to increase traffic system efficiency, and are achieved by
improving traffic flow along corridors and intersections. Decreases in idling time as well as
improving traffic speeds can reduce emissions such as CO and HC, and in some cases can even

26
decrease fuel consumption [29]. An increase in efficient traffic signalization can improve traffic
flow through both intersections and entrances and exits to freeways. For local streets and
intersections, timing traffic signals to correspond with peak traffic flows can minimize delays;
also, removing traffic signals that are no longer necessary can also improve traffic flows during
peak times [16]. Although improving signal timing can initially prevent idling and congestion,
additional cars may be attracted to these corridors that are experiencing less traffic, causing a
displacement of vehicles, and little emissions reductions [16]. Also, extensive fieldwork and
intensive observation of congested areas must be performed before signaling improvements or
signal removal is made. Another way to improve traffic flow is to improve the systems efficiency
by introducing new signage or lane markings. Preventing left-turns at busy intersections or
changing roads from two-way to one-way can achieve improved flow of the roadway during
peak traffic hours [16]. These methods require little construction, and are easily implemented in
short amounts of time causing improved circulation for localized areas [16, 29].
Accident avoidance measures include using visual electronic traffic alerts and rapid
response teams when there are roadway delays. Visual electronic traffic alerts can warn
approaching motorists of accidents, abrupt changes in speeds, or time delays due to construction
or accidents. These signs can also suggest alternative routes; however, this is sometimes seen as
a displacement of emissions instead of increasing the flow of traffic [26]. Rapid response teams
are used for faster removal of stalled vehicle or debris that is causing congestion in the roadway.
In some cases, such as with the TranStar Management Center in Houston, response time by
authorities to reach incidents has decreased by one-third [34]. This decrease in response time will
speed up the process of removing wreckage/debris from the roadway, and therefore decrease
opportunities for additional accidents as well as minimize delays and congestion.

27
Transportation Demand Management (TDM)
The 1990 CAAA requires the implementation of employer programs or ozone
nonattainment areas that are sever and extreme, and can consist of mandatory and voluntary
measures [2]. Employer-based programs can be very cost effective, and are primarily
implemented in urban areas (population ≥ 250,000) by employers that have 100 employees or
more working on-site [16]. There are three main types of employer-based programs identified by
the EPA, the first one being general travel allowance programs [16]. The administrative costs for
these programs are low, and involve giving bonuses to employees for use of any transportation
mode [16]. The only cost incurred by the employer is the actual cost of the bonus, and this type
of program can lead to additional benefits such as reductions in cost of employee parking and
parking maintenance [16]. The other two types of employer-based programs are specific
allowance and flexible use allowance programs. These programs budget money for specific
transit programs, such as vanpools, or flexible use of funds for many different transit providers;
however, they can be very costly and complicated due to their great accounting and monitoring
needs [16]. In addition to the EPA listed programs, employers can establish or mandate other
trip-reduction programs, such as ridesharing, bicycling/walking, and guaranteed ride home
programs which assist commuters if they miss their bus/train [34]. Although the commuter
market is the best target for these types of ridesharing programs, without financial incentives,
high employee turnover as well as a lack of employer funding with decrease the effectiveness of
these programs. Tax incentives, subsidy programs, and enabling legislation (such as mandating
employer involvement) are all needed to successfully create long-term employer-based CMs. In
addition to trip-reducing programs, employers can also allow employees the options of

28
telecommuting, flextime, and compressed work weeks. These programs allow employees to
either work from home, set their own arrival/departure times, or work more than eight hours per
day for a shorter amount of days per week [16]. All these measures allow a reduction in
commuter traffic, and can reduce emissions during peak commuter times. Since these measures
are voluntary, they do not require government funds, and are easy to implement at a low cost if
they are carefully coordinated by employers and employees [16]. In 1997, the Commuter
Connections program was established in the Washington D.C. region, and aimed to reduce SOV
travel [34]. Using the assistance of government funding, this organization promoted
transportation demand strategies to employers, and over a course of two years reduced daily trips
by 7300, and VMT reductions of 90,000 [34].
Public education and outreach programs are designed to inform the public about a
region’s emission problem (most commonly ozone), and encourage voluntary emission reducing
programs. Programs that promote proper vehicle maintenance or the reducing/combining of
vehicle trips can be successful in reducing emissions, and can also result in an increase in transit
ridership as well as a reduction in roadway congestion [34]. “Ozone action Days” or “Spare the
Air” days can be popular programs that promote reducing trips on days/times when ozone
formation is more likely to occur [26]. Offering reduced or free public transit rides on these days
can help increase awareness of public transportation, resulting in an overall increase in year-
round ridership [34].
Bicycle and pedestrian programs can involve the construction or improvement of
pedestrian walkways as well as bicycle paths. Employer-based programs can also improve these
programs by offering bicycles for employee use, shower and locker facilities, free bicycle
maintenance and supplies (such as helmets, bicycle lights, etc.), free or cost-reduced bicycles,

29
bonus days off for bicycle use, and occasional tardiness allowances [16]. The EPA suggests that
walking and bicycling can be substituted for trips less than one-half miles and 5 miles,
respectively; although the VMT reduced is small, emissions reductions may be greater due to the
elimination of some cold-start and hot-soak emissions [16]. In addition, zoning that promotes
dense developments incorporating both housing and commercial areas could potentially increase
the use of bicycle and pedestrian walkways [29].
Public transit includes buses, rail transportation (both heavy and light), and paratransit
(passenger transportation that does not involve set routes or schedules). The EPA identified three
main ways public transit could be improved, and includes system/service expansion projects,
system/service operational improvements, and inducements to transit users [16]. The goal of
expansion projects is to increase ridership of public transit, and can be accomplished by
increasing the number of routes and/or increasing the frequencies of the service [16]. However,
similar goals can also be met, sometimes at a lower cost, by making operational improvements;
these improvements focus on scheduling changes and geographical coverage to increase transit
use [16]. In addition, inducements to potential transit users can focus on marketing strategies,
customer, or fare structures can cause a beneficial increase in public/paratransit use [16].
Although these strategies are designed to decrease vehicular congestion by encouraging
commuter use, the costs of the projects must be seriously evaluated, and aggressive marketing
strategies must be used to make this CM cost effective [16]. The Transportation Research Board
(TRB) evaluated many CMs, one being a free shuttle serving riders commuting out of Chicago.
Service began in 1996, and, with steady ridership increases over time, the program expanded its
shuttle service from vans to busses. An evaluation in the early 2000s showed that 55% of
commuters using the service reported that they used to ride alone [34]. It is estimated that this
30
SOV decrease has reduced VOCs by a total 2.7 tons, and eliminated 1.8 million VMT [34].
Although improving public transit may initially be costly, it is a long-term solution for reducing
VMT and the resulting vehicular emissions.
Park-and-Ride facilities are designed to accommodate passengers transferring to public
transit, carpools, vanpools, or any other ridesharing program [36]. Transportation agencies can
either formally or informally designate these lots, and their use reduces emissions by reducing
the number of trips make from home to work [16]. Most of these lots are built near highway
interchanges or key areas along heavily traveled roadways, which are not close to the business
district or center of town [16]. The costs of acquiring land and maintenance requirements are
high, but not as costly as HOV facilities [16].
Trip-reduction ordinances (TROs) consist of voluntary or mandatory reduction in VMT,
trips, or the use of alternative forms of transport, such as public transit or ridesharing [16]. These
programs are most successful when used by employees and agencies, and are most applicable to
larger businesses. TROs can be used to enforce employer-based trip reduction programs, with
violation penalties ranging from fines to criminal prosecution (although this severe punishment is
rarely used) [16]. Because TROs can become a burden on small or new businesses, this TDM is
most commonly applied to businesses with more than 50 employees [16].
Parking controls and parking management are designed to reduce vehicle trips or VMT
by offering parking incentives to those that rideshare. By increasing parking costs or decreasing
parking availability for SOVs, drivers are encouraged to participate in vanpools, carpools, or
other ridesharing programs to obtain preferential parking [16, 29]. Some examples of parking
controls are: preferential parking for HOVs, an increase in parking costs, limitations on public
and private parking spaces, and parking structures that discourage long-term parking through

31
fees [16]. The emissions reductions from these programs are hard to quantify but are most
successful when used jointly with employer-based rideshare programs, and when adequate
pedestrian, bicycle, and other transit facilities are located nearby [16].
Special Focus: Project Level Diesel CMs
For smaller sections of roadway that are near to pollution sensitive populations (such as
schools), project level control measures should be used to reduce vehicular emissions in these
sensitive areas. Diesel exhaust contains over 40 substances listed as toxic air contaminants by the
Air Resources Board (ARB), and the small particles that comprise DPM are severe lung irritants
[39]. The strict regulation of diesel emissions is important to maintain low cancer risks and
prevent other potential lung related conditions for those exposed to exhaust near roadways.
Although retrofitting and other large-scale CMs are successful at reducing diesel emissions, they
are not feasible for project-level needs. Truck controls such as idling limits, scheduling changes,
or re-routing HDDVs around emissions sensitive areas are all options to reduce diesel exposure.
By restricting truck use in central business areas or in emission sensitive areas (such as schools),
emissions can be reduced where there are potentially more pedestrians. Limiting delivery
schedules, designating loading zones, and mandating delivery consolidation for multiple
businesses can also decrease local street congestion, or congestion during peak hours in a central
business district [16]. To implement this CM, many things must be taken into consideration, such
as current truck routes, financial impacts on the economy due to truck relocation, and also the
direct costs occurred by the businesses for the truck controls [16, 37]. Additionally, idling
controls can be used to lower CO emissions from diesel- or gasoline-powered vehicles in
nonattainment areas [16, 37]. By controlling the construction of businesses with drive-through

32
facilities, and restricting the idling times of commercial delivery trucks, additional emissions can
be reduced [16]. Truck idling uses the diesel engine to produce a small load, such as running an
air conditioner, while producing excess emissions [29]. Using auxiliary engines to provide a
small load (instead of the diesel engine supplying the load) is an idling reduction technology that
could reduce fuel consumption by approximately 15% [29]. Also, regulations mandating a
maximum idling time (~15 minutes) can also be used to cut down on excess emissions of
vehicles making deliveries, as well as buses that are loading/unloading for extended periods of
time [29, 37]. For idling/trucking restrictions to successfully reduce emissions, the cooperation
of the trucking industry, local businesses, and effective legal restrictions is required [16].
Cost Effectiveness
Estimated costs for potential regional CMs are shown in Table 12.

33
Table 12: Cost effectiveness of large-scale mitigation measures.
Control Measures
Potential
emission
reductions (%)
Cost effectiveness
Range ($/Ton)
Average Cost
Effectiveness
($/Ton)
Source Category and
Affected Vehicle
Type:
Gasoline (G) or
Diesel (D)
Type Pollutant Low High Low High
TDM G and
D
Develop a station car/low emission
vehicle share
program
NOX - 0.1 - $1,784,153 $1,784,153
[32, 33]
ROG - 0.1 - $1,585,935 $1,585,935
TDM G and
D
Encourage
participation in an Automobile
Maintenance
Organization
NOX - 0.9 - $85,800 $85,800
[32, 33]
ROG - 0.8 - $88,900 $88,900
TDM G and
D
Develop and fund a program for
neighborhood
electric vehicles
NOX - 0.0 - $2,948,754 $2,948,754
[32, 33]
ROG - 0.1 - $2,790,821 $2,790,821
TDM G and
D
Shuttles, Feeders, Paratransit
NOX + VOC
- - $12,300 $1,970,000 $991,150 [34]
TDM G and
D Bicycle/Pedestrian
NOX +
VOC - - $4,200 $345,000 $174,600 [34]
TDM G and
D
Subsidies and
Discounts
NOX +
VOC - - $900 $550,000 $275,450 [34]
TDM G and
D Park-and-Ride Lots
NOX + VOC
- - $8,600 $70,700 $39,650 [34]
TDM G and
D
Employer Trip Reduction
Programs
NOX +
VOC - - $5,800 $176,000 $90,900 [34]
TDM G and
D Vanpool Programs
NOX + VOC
- - $5,200 $89,000 $47,100 [34]
TDM G and
D Charges and Fees
NOX +
VOC - - $900 $50,000 $25,450 [34]
TDM G and
D Telecommute
NOX +
VOC - - $13,300 $8,230,000 $4,121,650 [34]
TSM G and
D
Re-evaluate the
traffic volumes that trigger ramp-
metering lights
NOX - 1.0 - $1,206 $1,206
[32, 33]
ROG - 1.0 - $2,218 $2,218
TSM G and
D HOV Facilities
NOX +
VOC - - $15,700 $333,000 $174,350 [34]
TSM G and
D
Freeway/Incident
Management
NOX +
VOC - - $2,300 $544,000 $273,150 [34]
TSM G and
D
Traffic Signalization
NOX + VOC
- - $6,000 $128,000 $67,000 [34]
Many project-level CMs are costly because they involve expensive marketing tactics
along with cooperation from the public, employers, and the trucking industry. The effectiveness

34
of each program can vary by region, and also depends on the agency/industry who is
implementing the CM. It may be more costly for smaller businesses to implement employer-
based rideshare programs, therefore the cost effectiveness will decrease due to their limited
resources [16]. Also, it is more complicated to estimate the cost effectiveness of project-level
CMs. In some cases, these CMs will cause unexpected benefits, such as a rideshare program
reducing congestion as well as providing a reduction in trips. Project-level CMs must be
thoroughly evaluated before implementation, and may not initially be a cost-effective solution.
However, if these CMs are properly promoted and contain incentives for participation, the
benefits (including cost-effectiveness) have the potential to increase over time.
Conclusions
Control measures can reduce vehicular emissions directly, or indirectly, and are essential
strategies to reduce negative health effects due to vehicular emissions exposure. In areas where
there are potential NAAQS violations, control measures must be evaluated, and their cost-
effectiveness quantified to effectively reduce vehicular emissions. A control measure is
successful when it reduces a specified vehicular pollutant in a cost effective manner; therefore,
CMs must be thoroughly evaluated before implementing. To successfully implement a control
measure, it must first be determined if the pollution problem is regional one or if it is a project-
level (or hot-spot) problem. Although some project-level CMs can be successful on the region-
level (such as ridesharing), the inverse is not always true (retrofitting is not a cost-effective
project-level CM). Also, the control measure’s effectiveness at controlling the targeted pollutant
must be carefully evaluated. Because some CMs only work for specific pollutants (i.e. RFG can
decrease VOCs, but potentially increase NOX), the applicability of the CM must be investigated
[30]. Additionally it is also necessary, especially for TSMs, to thoroughly market the CM to
35
make it successful [16]. For programs that involve changing the behavior of a driver, incentives
can help make SOV driving less desirable and will lead to a reduction in vehicle trips and a
decrease in emissions. When CMs are implemented successfully, they can reduce vehicular
emissions on a regional- and project-level scale, and provide a way to meet NAAQS standards in
a cost-effective manner.

36
References
1. U. S. Environmental Protection Agency, National Ambient Air Quality Standards. 1990.
2. Clean Air Act Amendments. 1990.
3. Tamura, T.M., et al., Transportation and Particulate Matter: Assessment of Recent
Literature and Ongoing Research. March 15, 2005, Prepared for the U.S. Federal
Highway Administration.
4. McCarthy, M., D. Eisinger, and H.R. Hafner, FWHA PM Research Plan: Workshop
Summary. May 13, 2005, U.S. Federal Highway Administration.
5. California Air Resources Board, The California Almanac of Emissions and Air Quality,
2005 Edition. 2005.
6. South Coast Air Quality Management District, Multiple Air Toxics Exposure Study
(MATES-II): Final Report. 2000.
7. U.S. Environmental Protection Agency, Health Assessment Document for Diesel Engine
Exhaust. 2002.
8. California Air Resources Board, California's Diesel Risk Reduction Plan, Appendix III--
Mobile Diesel-fueled Engines: Report on the Need for Further Regulation of Particulate
Matter Emissions. 2000.
9. California Air Resources Board, Proposed Amendments to the California Diesel Fuel
Regulations--Staff Report: Initial Statement of Reasons. 2003.
10. California Air Resources Board, Final Regulation Order. 2004.
11. U. S. Environmental Protection Agency, Emission Standards Reference Guide for Heavy-
duty and Non-road Engines. 1997.
12. U.S. Environmental Protection Agency, Heavy-duty Engine and Vehicle Standards and
Highway Diesel Fuel Sulfur Control Requirements. 2000.
13. Schimek, P., Reducing Emissions from Transit Buses. Regional Science and Urban
Economics, 2001. 31: p. 433-451.
14. Gruenspecht, H.K., Differentiated Regulation: The Case of Auto Emissions Standards.
The American Economic Review, 1982. 72(2): p. 328-331.
15. Stevens, G., A. Wilson, and J.K. Hammitt, A Benefit-Cost Analysis of Retrofitting Diesel
Vehicles with Particulate Filters in the Mexico City Metropolitan Area. Risk Analysis,
2005. 25(4): p. 883-899.
16. Texas Transportation Institute and Texas Department of Transportation, The Texas Guide
to Accepted Mobile Source Emission Reduction Strategies. 2003.
17. National Research Council, Evaluating Vehicle Emissions Inspection and Maintenance
Programs. 2001, National Academy Press: Washington, DC.
18. California Air Resources Board, On-Road Emissions from EMFAC2002 Release for
California. 2004.
19. U. S. Environmental Protection Agency, Summary of Potential Retrofit Technologies.
2006.
20. Jones, M., R. Wilson, and J.M. Norbeck, A Systems Evaluation on the Effectiveness of a
Catalyst Retrofit Program in China. Environmental Science and Technology, 2001.
35(17): p. 3416-3421.
21. U. S. Environmental Protection Agency, I/M Regulations. 1992.

37
22. Eisinger, D., Evaluating Inspection and Maintenance Programs: A Policy-Making
Framework. Journal of the Air and Waste Management Association, 2005. 55: p. 147-
162.
23. Wenzel, T., et al., Evaluation of the Enhanced Smog Check Program: A Report to the
California Inspection and Maintenance Review Committee. 2000.
24. Klausmeier, R., et al., Technical Note: Smog Check Station Performance Analysis, Based
on Roadside Test Results. 2000, Prepared for the California Bureau of Automotive
Repair, Engineering and Research Branch.
25. U. S. Environmental Protection Agency, Guidance on Use of Remote Sensing for
Evaluation of I/M Program Performance. 2004.
26. Eisinger, D., D. Niemeier, and T. Kear, Draft: Improving Air Quality Along Freeways.
2004, UCDavis - Caltrans Air Quality Project.
27. Clark, N.N., et al., Factors Affecting Heavy-Duty Diesel Vehicle Emissions, in Journal of
the Air and Waste Management Association. 2002. p. 84-94.
28. Graboski, M.S., J.D. Ross, and R.L. McCormick, Transient Emissions from No. 2 Diesel
and Biodiesel Blends in a DDC Series 60 Engine. 1996, Society of Automotive
Engineers: Warrendale, PA.
29. State and Territorial Air Pollution Program Administrators (STAPPA) and Association of
Local Air Pollution Control Officials (ALAPCO), Controlling Fine Particulate Matter
Under the Clean Air Act: A Menu of Options. 2006.
30. Committee on Ozone-Forming Potential on Reformulated Gasoline, et al., Ozone-
Forming Potential of Reformulated Gasoline. 1999, The National Academies Press.
31. U. S. Environmental Protection Agency, Clean Fuels: An Overview. 1994.
32. Sacramento Metropolitan Air Quality Management District, Potential Control Measure
Overview: Difficult Measures. 2003.
33. Sacramento Metropolitan Air Quality Management District, Potential Control Measure
Overview: Promising Measures. 2003.
34. Transportation Research Board, The Congestion Mitigation and Air Quality Improvement
Program, Assessing 10 Years of Experience, Special Report 264. 2002, National
Academy Press: Washington, DC.
35. California Air Resources Board and Department of Consumer Affairs/Bureau of
Automotive Repair, April 2004 Evaluation of the California Enhanced Vehicle Inspection
and Maintenance (Smog Check) Program, Report to the Legislature. 2005.
36. Eisinger, D. and D. Niemeier, Transportation Control Measures (TCMs): Guidance for
Conformity and State Implementation Plan Development. 2004, Final Report Prepared for
The California Department of Transportation by The University of California, Davis, CA,
and Sonoma Technology, Inc., Petaluma, CA.
37. U. S. Environmental Protection Agency and Federal Highway Administration,
Transportation Conformity Guidance for Qualitative Hot-spot Analyses in PM2.5 and
PM10 Nonattainment and Maintenance Areas. 2006.
38. Transportation Research Board, Trends in Single Occupant Vehicle and Vehicle Miles of
Travel Growth in the United States: Final Report. 1998, The National Academies Press.
39. California Air Resources Board and Office of Environmental Health Hazard Assessment,
Report to the Air Resources Board on the Proposed Identification of Diesel Exhaust as a
Toxic Air Contaminant. 1998, California Air Resources Board: Sacramento.