a review of the entso-e transparency platform · vva, copenhagen economics, neon, deloitte 12 –...
TRANSCRIPT

VVA, Copenhagen Economics, Neon, Deloitte 12 – 2017
Internal
Energy
Market
A review of the ENTSO-E Transparency Platform
Output 1 of the “Study on the quality of electricity
market data” commissioned by the European
Commission

2
Table of Contents
1. Objective ..................................................................................................................... 4
2. About the ENTSO-E Transparency Platform ...................................................................... 4
2.1. Content and size ................................................................................................................................. 4
2.1.1. Datasets and data items .......................................................................... 4
2.1.2. Geographic concepts .............................................................................. 6
2.1.3. Size ................................................................................................... 7
2.2. Data download .................................................................................................................................... 7
2.3. Data upload ......................................................................................................................................... 8
2.4. Governance .......................................................................................................................................... 8
2.5. Future plans and further development of the Platform............................................................... 9
3. Methodology ............................................................................................................... 10
3.1. Evaluation criteria ............................................................................................................................ 10
3.1.1. Completeness ..................................................................................... 10
3.1.2. Accuracy ........................................................................................... 10
3.1.3. Timeliness ......................................................................................... 11
3.1.4. User friendliness .................................................................................. 11
3.2. Review of other quality assessments ........................................................................................... 11
3.2.1. Internal ENTSO-E assessments ............................................................... 11
3.2.2. ETUG process ..................................................................................... 12
3.2.3. ACER opinions .................................................................................... 12
3.3. Statistical data analysis ................................................................................................................... 12
3.4. Online user survey ........................................................................................................................... 13
3.5. Expert interviews .............................................................................................................................. 14
3.6. Limitations ......................................................................................................................................... 16
4. Findings ..................................................................................................................... 16
4.1. Completeness .................................................................................................................................... 16
4.1.1. Missing data (data gaps) ....................................................................... 17
4.1.2. Reporting data gaps and public documentation of issues ................................ 31
4.1.3. Broadening the scope ........................................................................... 31
4.2. Accuracy ............................................................................................................................................. 32
4.2.1. Comparison with other sources ............................................................... 34
4.2.2. Other accuracy issues ........................................................................... 43
4.2.3. Reporting inaccuracies and public documentation of issues ............................. 44
4.2.4. Inaccuracy in data definitions ................................................................. 44
4.3. Timeliness .......................................................................................................................................... 45
4.3.1. Outage data and UMMs ......................................................................... 46
4.3.2. Overwriting forecasts ............................................................................ 48

3
4.3.3. Delays in data availability ...................................................................... 48
4.4. User friendliness ............................................................................................................................... 48
4.4.1. Website and GUI ................................................................................. 49
4.4.2. Automatic download ............................................................................. 51
4.4.3. Issues with data files ............................................................................ 52
4.4.4. Displaying data availability and “master data” ............................................. 53
4.4.5. Data documentation ............................................................................. 53
4.4.6. User support and contacts...................................................................... 54
5. Suggestions and conclusions ......................................................................................... 55
5.1. Priorities ............................................................................................................................................. 55
5.1.1. Light users ......................................................................................... 55
5.1.2. Frequent users .................................................................................... 55
5.2. Suggestions for improvements ...................................................................................................... 55
5.2.1. Improve information and navigation ......................................................... 55
5.2.2. A crowd-sourced public data quality log ..................................................... 56
5.2.3. Automatic quality reporting .................................................................... 57
5.2.4. Machine-readable metadata ................................................................... 57
5.2.5. Governance, ownership and incentives ...................................................... 57
4
1. OBJECTIVE
The objective of this work package is to evaluate the quality of data published through
the ENTSO-E Transparency Platform (TP) as well as the user friendliness of the platform
itself. It is our aim to be constructive and solution-oriented so that this work can contrib-
ute to improving the TP going forward. This section of the study was carried out by Neon.
2. ABOUT THE ENTSO-E TRANSPARENCY PLATFORM
The ENTSO-E Transparency Platform (TP) is an online data platform for European electricity
system data. It was established through the Regulation (EU) No. 543/20131, sometimes
called the Transparency Regulation, which also prescribes which data must be published.
It is our understanding that the purpose of the TP is to serve market participants, such as
generators, retailers and traders. Transparency is meant to reduce insider trading and level
the playing field between small and large actors. The TP currently has 8800 registered
users, a number that indicates interest not only from market participants but also from
researchers and other parties. Sometimes the TP is referred to as EMFIP, which was the
name of the project initiated to deliver the TP. The TP is developed, maintained and oper-
ated by the European Network of Transmission System Operators for Electricity2 (ENTSO-
E), an industry body.
There is an overlap between some of the data provided on the TP with other data platforms
that are in place for market participants to disclose inside information according to Article
4 of Regulation (EU) No. 1227/2011 (REMIT)3, including e.g. EEX Transparency4. This af-
fects so-called “Urgent Market Messages” (UMMs), which on the TP are published in the
Outages data domain. While the Transparency Regulation requires that the specified data
be published on the TP, REMIT leaves the choice of platform open to market participants.
Several so-called “Inside Information Platforms”5 have emerged to allow market partici-
pants to fulfil their REMIT obligations. The TP, which entered into force after REMIT,
publishes some data that are published on Inside Information Platforms as well, but is not
an Inside Information Platform itself.
2.1. Content and size
The Regulation 543/2013 stipulates in detail which data items must be published for which
geographic entity (see Section 2.1.2). The TP includes no other data than those mentioned
in the Regulation, but it sometimes includes data for geographic entities for which publi-
cation is not obligatory.
2.1.1. Datasets and data items
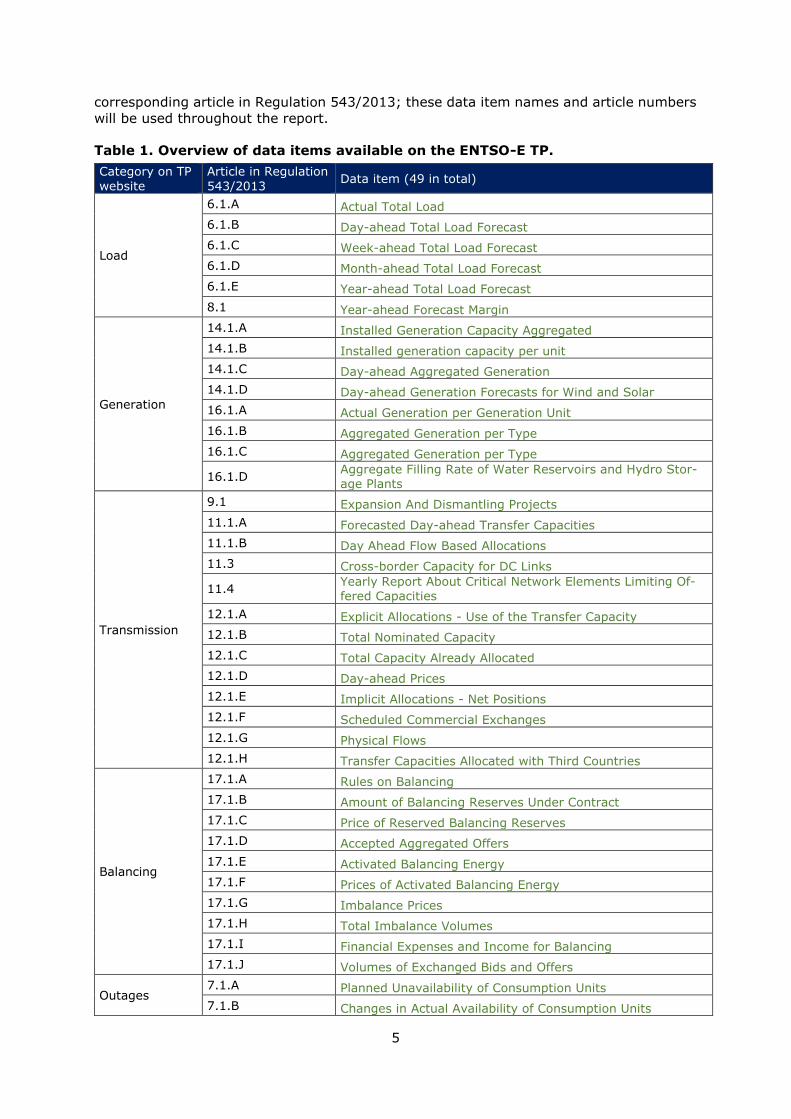
The Regulation, in Articles 6–17, specifies a total of 49 data items to be published on the
TP, each of which carries an alphanumerical identifier based on the respective article (Table
1). On the TP website, the data items are organized somewhat differently; they are
grouped into six categories (“data domains”): Load, Generation, Transmission, Balancing,
Outages and Congestion Management. They include 55 sub-categories in total. The differ-
ence from the number of Regulation articles comes about as the website combines some
of the data items into the same sub-category and splits up others over multiple sub-cate-
gories. Table 1 maps out the data items based on their category on the TP website and
1 http://data.europa.eu/eli/reg/2013/543/oj 2 https://www.entsoe.eu/Pages/default.aspx 3 http://data.europa.eu/eli/reg/2011/1227/oj 4 http://www.eex-transparency.com/ 5 https://www.acer-remit.eu/portal/list-inside-platforms
5
corresponding article in Regulation 543/2013; these data item names and article numbers
will be used throughout the report.
Table 1. Overview of data items available on the ENTSO-E TP.
Category on TP
website
Article in Regulation
543/2013 Data item (49 in total)
Load
6.1.A Actual Total Load
6.1.B Day-ahead Total Load Forecast
6.1.C Week-ahead Total Load Forecast
6.1.D Month-ahead Total Load Forecast
6.1.E Year-ahead Total Load Forecast
8.1 Year-ahead Forecast Margin
Generation
14.1.A Installed Generation Capacity Aggregated
14.1.B Installed generation capacity per unit
14.1.C Day-ahead Aggregated Generation
14.1.D Day-ahead Generation Forecasts for Wind and Solar
16.1.A Actual Generation per Generation Unit
16.1.B Aggregated Generation per Type
16.1.C Aggregated Generation per Type
16.1.D Aggregate Filling Rate of Water Reservoirs and Hydro Stor-age Plants
Transmission
9.1 Expansion And Dismantling Projects
11.1.A Forecasted Day-ahead Transfer Capacities
11.1.B Day Ahead Flow Based Allocations
11.3 Cross-border Capacity for DC Links
11.4 Yearly Report About Critical Network Elements Limiting Of-fered Capacities
12.1.A Explicit Allocations - Use of the Transfer Capacity
12.1.B Total Nominated Capacity
12.1.C Total Capacity Already Allocated
12.1.D Day-ahead Prices
12.1.E Implicit Allocations - Net Positions
12.1.F Scheduled Commercial Exchanges
12.1.G Physical Flows
12.1.H Transfer Capacities Allocated with Third Countries
Balancing
17.1.A Rules on Balancing
17.1.B Amount of Balancing Reserves Under Contract
17.1.C Price of Reserved Balancing Reserves
17.1.D Accepted Aggregated Offers
17.1.E Activated Balancing Energy
17.1.F Prices of Activated Balancing Energy
17.1.G Imbalance Prices
17.1.H Total Imbalance Volumes
17.1.I Financial Expenses and Income for Balancing
17.1.J Volumes of Exchanged Bids and Offers
Outages 7.1.A Planned Unavailability of Consumption Units
7.1.B Changes in Actual Availability of Consumption Units

6
Category on TP website
Article in Regulation 543/2013
Data item (49 in total)
10.1.A Planned Unavailability in the Transmission Grid
10.1.B Changes in Actual Availability in the Transmission Grid
10.1.C Changes in Actual Availability of Off-shore Grid Infrastruc-
ture
15.1.A Planned Unavailability of Generation Units
15.1.B Changes in Actual Availability of Generation Units
15.1.C Planned Unavailability of Production Units
15.1.D Changes in Actual Availability of Production Units
Congestion management
13.1.A Redispatching
13.1.B Countertrading
13.1.C Costs of Congestion Management
2.1.2. Geographic concepts
Some data items in the Generation and Outages data domains are reported by individual
generation and consumption units. The majority of all other data items are aggregates
for geographical areas or borders between them. Four main different geographical con-
cepts are used:
• countries,
• bidding zones BZ (areas in which there is a uniform spot price),
• control areas CA (areas in which the grid is operated by a single system operator)
and
• market balance areas MBA (areas in which there is a uniform balancing energy
price).
Altogether, they account for 206 differently named areas, of which 143 are located inside
the EU. However, most countries are congruent with exactly one of each of the other con-
cepts, reducing the number of unique geographical entities to 91 (of which 67 are in the
EU). Unique areas are identified by the same Energy Identification Code6 (EIC), a coding
scheme developed by ENTSO-E. These geographical concepts are summarized in Table 2.
In a few countries, different concepts do not align, including the Scandinavian countries
(2–5 bidding zones each), Italy (18 bidding zones) and Germany (4 control areas). Market
balancing areas mostly coincide with bidding zones, except for Austria, Germany, Luxem-
bourg and Italy.
Table 2. Summary of geographical concepts along which data are published.
Areas Of which EU Borders Of which EU
Countries 42 28 34 34
Bidding zones 65 48 166 152
Control areas 46 32 148 146
Market balance areas 52 34 17 17
Total 205 143 348 332
Unique entities 90 66 255 241
Notes: “Unique entities” counts congruent entities only once / all EICs + 6 non-EU countries without EICs. The list of country borders listed in CSV files retrieved via FTP is incomplete. For example, “Scheduled Commercial
6 https://www.entsoe.eu/data/energy-identification-codes-eic/eic-documentation/Pages/default.aspx
7
Exchanges” (12.1.F) are reported between the Czech Republic and Germany, but not between the Czech Republic and Austria. For an overview on geographical concepts, see https://neon-energie.de/transparency-platform.
For each data item, the Regulation specifies the concept to be used for reporting, in most
cases control areas. However, to accommodate user interests, many data items are
available for some of the other concepts, mostly bidding zones and countries, resulting in
double or triple publishing of the same reported values. For example, “Actual Total Load”
(6.1.A) is available for all three concepts.
Borders can exist between all geographic concepts: borders between bidding zones, bor-
ders between countries and so on. For example, “Cross Border Physical Flows” (12.1.G)
are reported for each border between neighbouring bidding zones as required by the Reg-
ulation and for borders between control areas (but not for intra-German control-area
borders).
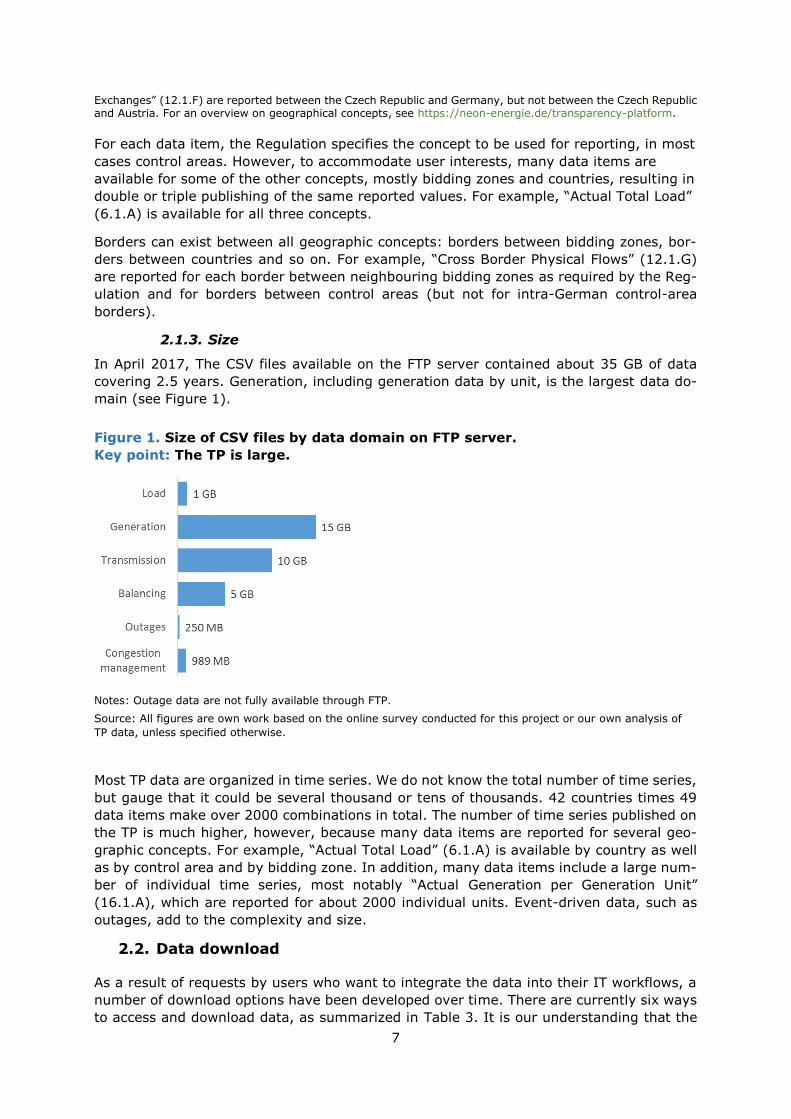
2.1.3. Size
In April 2017, The CSV files available on the FTP server contained about 35 GB of data
covering 2.5 years. Generation, including generation data by unit, is the largest data do-
main (see Figure 1).
Figure 1. Size of CSV files by data domain on FTP server.
Key point: The TP is large.
Notes: Outage data are not fully available through FTP.
Source: All figures are own work based on the online survey conducted for this project or our own analysis of
TP data, unless specified otherwise.
Most TP data are organized in time series. We do not know the total number of time series,
but gauge that it could be several thousand or tens of thousands. 42 countries times 49
data items make over 2000 combinations in total. The number of time series published on
the TP is much higher, however, because many data items are reported for several geo-
graphic concepts. For example, “Actual Total Load” (6.1.A) is available by country as well
as by control area and by bidding zone. In addition, many data items include a large num-
ber of individual time series, most notably “Actual Generation per Generation Unit”
(16.1.A), which are reported for about 2000 individual units. Event-driven data, such as
outages, add to the complexity and size.
2.2. Data download
As a result of requests by users who want to integrate the data into their IT workflows, a
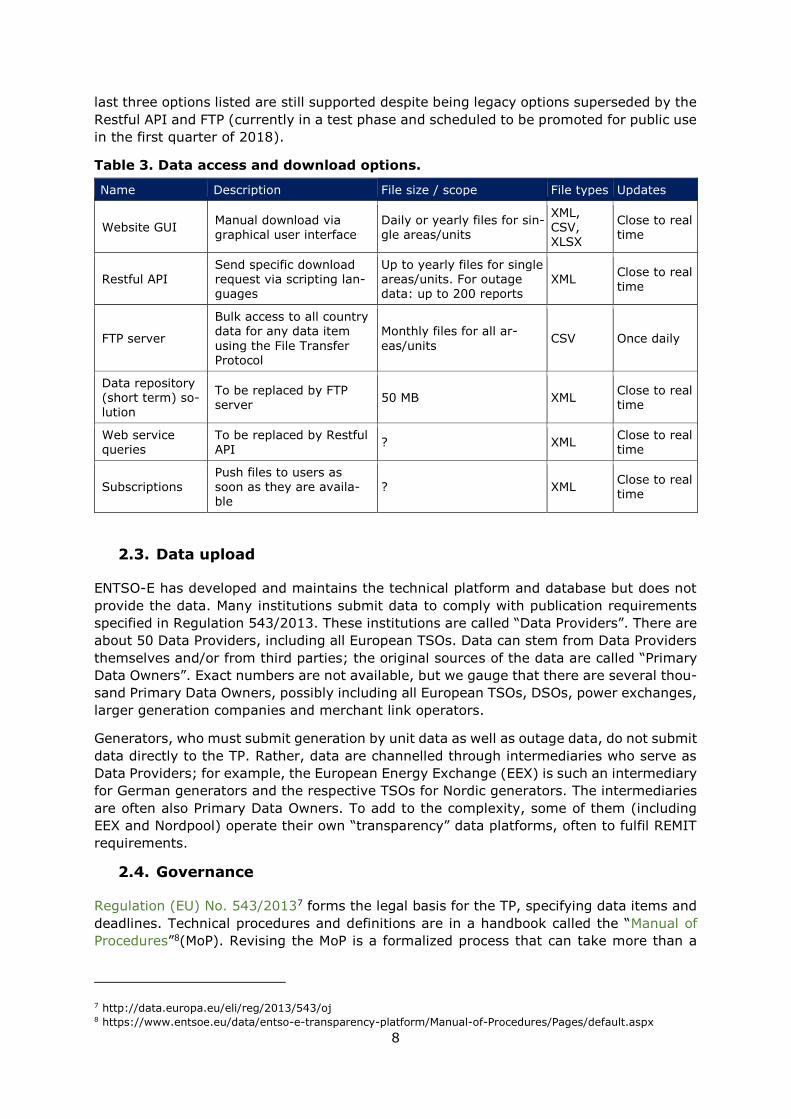
number of download options have been developed over time. There are currently six ways
to access and download data, as summarized in Table 3. It is our understanding that the
8
last three options listed are still supported despite being legacy options superseded by the
Restful API and FTP (currently in a test phase and scheduled to be promoted for public use
in the first quarter of 2018).
Table 3. Data access and download options.
Name Description File size / scope File types Updates
Website GUI Manual download via graphical user interface
Daily or yearly files for sin-gle areas/units
XML, CSV, XLSX
Close to real time
Restful API Send specific download request via scripting lan-guages
Up to yearly files for single areas/units. For outage data: up to 200 reports
XML Close to real time
FTP server
Bulk access to all country data for any data item
using the File Transfer Protocol
Monthly files for all ar-
eas/units CSV Once daily
Data repository (short term) so-lution
To be replaced by FTP server
50 MB XML Close to real time
Web service queries
To be replaced by Restful API
? XML Close to real time
Subscriptions Push files to users as soon as they are availa-
ble
? XML Close to real time
2.3. Data upload
ENTSO-E has developed and maintains the technical platform and database but does not
provide the data. Many institutions submit data to comply with publication requirements
specified in Regulation 543/2013. These institutions are called “Data Providers”. There are
about 50 Data Providers, including all European TSOs. Data can stem from Data Providers
themselves and/or from third parties; the original sources of the data are called “Primary
Data Owners”. Exact numbers are not available, but we gauge that there are several thou-
sand Primary Data Owners, possibly including all European TSOs, DSOs, power exchanges,
larger generation companies and merchant link operators.
Generators, who must submit generation by unit data as well as outage data, do not submit
data directly to the TP. Rather, data are channelled through intermediaries who serve as
Data Providers; for example, the European Energy Exchange (EEX) is such an intermediary
for German generators and the respective TSOs for Nordic generators. The intermediaries
are often also Primary Data Owners. To add to the complexity, some of them (including
EEX and Nordpool) operate their own “transparency” data platforms, often to fulfil REMIT
requirements.
2.4. Governance
Regulation (EU) No. 543/20137 forms the legal basis for the TP, specifying data items and
deadlines. Technical procedures and definitions are in a handbook called the “Manual of
Procedures”8(MoP). Revising the MoP is a formalized process that can take more than a
7 http://data.europa.eu/eli/reg/2013/543/oj 8 https://www.entsoe.eu/data/entso-e-transparency-platform/Manual-of-Procedures/Pages/default.aspx

9
year. An annex to the MoP is the “Detailed Data Descriptions”9, which specifies data items
in more detail than the Regulation.
In March 2015, the ENTSO-E Transparency User Group10 (ETUG) was established as the
primary forum for stakeholders to discuss issues, definitions and upcoming changes. ETUG
has 32 core and around 40 remote members, most of whom are market participants. The
meetings are closed to the public but the minutes of all ETUG meetings are published on
the ENTSO-E website.
2.5. Future plans and further development of the Platform
As of September 2017, ENTSO-E is in the process of developing the TP to reflect stake-
holders’ requests for improvements. Such improvements are anticipated to be available in
2018. The MoP also is in the process of being revised. Updates regarding this process can
be found on the TP website11. This report reflects the state of the TP and its components
as of mid-2017 (data was retrieved April–September 2017). Planned changes and future
improvements were not reviewed or assessed in this report.
9 https://www.entsoe.eu/fileadmin/user_upload/_library/resources/Transparency/MoP%20Ref02%20-%20EM-
FIP-Detailed%20Data%20Descriptions%20V1R4-2014-02-24.pdf 10 https://www.entsoe.eu/data/entso-e-transparency-platform/User-Group/Pages/default.aspx 11 https://www.entsoe.eu/data/entso-e-transparency-platform/Manual-of-Procedures/Pages/default.aspx
10
3. METHODOLOGY
This report evaluates the quality of the data published through the TP along three crite-
ria: completeness, accuracy and timeliness. The user friendliness of the platform itself is
assessed as well.
To deliver a thorough, comprehensive and fair assessment, we applied four complementary
approaches: a review of other (previous) TP evaluations, new statistical data analysis, an
online user survey and expert interviews. In general, there is a good match among these
sources of information: often issues that we encountered in our analysis also were men-
tioned by users and surfaced in previous evaluations. We are confident that taken together,
these four sources provide a comprehensive view of the quality and usability of the TP. As
mentioned earlier, the analysis reflects the data as of mid-2017. This section first describes
the four evaluation criteria and then proceeds by outlining the four methods we employed.
3.1. Evaluation criteria
Four criteria were applied to assess the quality of the TP: completeness, accuracy, timeli-
ness and user friendliness. These criteria are mentioned in Regulation 543/2013 and
specified in the Terms of Reference issued by the European Commission tendering the
study contract.
3.1.1. Completeness
Regulation 543/2013 prescribes in detail which data items shall be published in the TP;
hence, assessing completeness is verifying whether this is the case. We therefore aim to
answer the following questions:
• Are data provided for all geographic entities that apply (bidding zones, borders,
market balancing areas)?
• Are any values missing within the time series?
• Are users informed about missing data and can users report missing data?
• What types of data would users like to find on the TP, going beyond the Regula-
tion?
We gauge that there might be tens of thousands of time series published on the TP, plus
event-driven data (recall Section 2.1.3). Displaying completeness information for each of
these time series is beyond the scope of this report. We therefore focus on a subset of data
items we deem particularly important and/or where users have indicated completeness
concerns during the interviews and the online survey we conducted.
3.1.2. Accuracy
The accuracy analysis shall identify whether data are “correct”. This includes the ques-
tions:
• Are data different from other sources or can they otherwise be identified as incor-
rect?
• Are data definitions applied consistently within the TP?
• Are users informed about inaccuracy and can users report inaccuracies?
• Are data definitions accurate?
We rely on user feedback through the online survey and expert interviews as well as EN-
TSO-E’s quality assessment to identify problematic areas. In addition, the accuracy of some
data is assessed by comparing the TP to other data sources such as ENTSO-E’s Power
Statistics, the websites of individual TSOs, Eurostat and national statistical sources. The
selection of the data items tested is driven by the availability of data to which TP data can

11
be compared reasonably. Such a comparison can indicate inconsistencies but never, by
itself, identify “wrong” data. This is due to two reasons: first, data sources do not share
identical data definitions, hence differing values may arise as a result of differing data
definitions rather than inaccuracies. Second, we are not claiming that the other data
sources are “correct”. Inconsistencies can also arise, of course, if TP data are more accu-
rate than those of the other source.
3.1.3. Timeliness
Evaluating timeliness means determining whether data have been published on time. Pub-
lication deadlines are specified by data item in Regulation 543/2013. Data entries in the
TP are marked with a timestamp that could be checked against the respective benchmark.
However, Data Providers can update data by overwriting previous submissions. In this
case, the information of when data were published first is no longer available. A statistical
ex-post assessment of the timeliness of data publication 2015–2016 is thus not possible.
We therefore rely on user input for the timeliness assessment, in particular from market
participants, that we have collected through the online survey and interviews. The results
should be read as reflecting user experiences and expectations. While this has caveats, we
deem it the best approach feasible within the scope of this report. The timeliness analysis
addressed questions including:
• Are outage data and UMMs reported accurately and in a useful way?
• Are forecasts overwritten?
• Are there delays in data availability?
3.1.4. User friendliness
User friendliness—which we interpret as usability—does not concern the content (data) of
the TP but rather the structure of the platform itself. It includes topics such as navigating
the website, data documentation and the availability of download options. We assess
user friendliness by reporting on our own experience of working with the TP, but more
importantly based on the online survey and the expert interviews conducted. In particu-
lar, we ask questions such as:
• Can users find the data they need?
• Are data logically presented?
• Is it clear to users which data are available?
• Is the reason for data unavailability clear to users?
• Is data documentation clear, sufficient and easy to find?
• Can users easily select and access the data they wish to download?
• Do data files contain data in a form that is easy to process?
• Are the download options properly documented so that users are informed about
the possible download options and how to use them?
• Do the download options allow for easy, fast and reliable access to the data?
• Are service requests handled efficiently and satisfactorily?
3.2. Review of other quality assessments
This report is not the first to assess the quality of the TP. ENTSO-E has done various
internal quality assessments, ETUG is a channel through which users have reported issues
and ACER has published opinions on the matter. These assessments informed our statisti-
cal analysis.
3.2.1. Internal ENTSO-E assessments
ENTSO-E has internal reporting tools in place to monitor completeness and timeliness of
data submission by the Data Providers. Aggregates of the data completeness measure

12
have been reported to ETUG and to ACER occasionally (e.g. ETUG meeting 20.10.201512:
“provision of data is estimated to [be] more than 85%”), but have not been made public
in a systematic manner. Several of our interview partners reported that this is due to
reservations by the Data Providers, which want to avoid being called out for not complying
with publication obligations.
Users can report individual data quality issues by emailing the TP service desk13. During
the early phase of the TP, in Q1/2015, the service desk received around 260 support re-
quests; in Q1–Q2 2017, it received a similar number of requests.
3.2.2. ETUG process
ETUG meets a few times each year and serves as a representative of users’ views during
processes to improve the TP. The meetings are closed to the public but the minutes are
published on the ENTSO-E website14. We received a provisional membership to ETUG for
this project and thus could review ETUG documents assessing the TP beyond those that
are publicly available. Documents we used for the analysis include slide decks regarding
revising the MoP and issues with the TP reported by users, including via an April 2015
online survey15 answered by 65 users focusing on user-friendliness issues.
3.2.3. ACER opinions
ACER is legally obliged to provide opinions on the TP and revisions to it. Furthermore, ACER
staff are themselves users of the TP, so they have experience working with it and familiarity
with its strengths and shortcomings. ACER has released opinions regarding the TP that we
found helpful for our analysis, including opinions on the launch of the TP and on updates
to the MoP, in particular the December 2013 opinion “On the Manual of Procedures for the
ENTSO-E Central Information Transparency Platform”16 and the February 2017 opinion “On
the First Update of the Manual of Procedures for the ENTSO-E Central Information Trans-
parency Platform”17.
3.3. Statistical data analysis
The goal of the statistical data analysis is to have an overview of the data quality by stud-
ying data for all EU Member States for the period 2015–16. This requires three steps: (i)
extract the data from the TP database, (ii) process and condense them into a workable
format and (iii) produce statistics and graphical representations that allow for an assess-
ment along the evaluation criteria.
We chose the FTP as our download option because it provides data for all geographical
entities in one place. It should be noted that the FTP server is operating in a test phase.
On the FTP server, data are bundled in monthly CSV files grouped in 88 folders that can
be mapped to the 49 data items specified in the Regulation and listed in Table 1. One file
usually contains the reported values for one data item for all areas for the given month as
a vertical list. Often the same values are contained two- or threefold due to the overlapping
geographical concepts.
12 https://www.entsoe.eu/Documents/MC documents/Transparency Platform/ETUG/151020_ETUG_Mi-
nutesdraft-vfinal.pdf#page=5 13 https://entsoe.zendesk.com/hc/en-us/requests/new/ 14 https://www.entsoe.eu/data/entso-e-transparency-platform/User-Group/Pages/default.aspx 15 https://www.entsoe.eu/Documents/MC documents/Transparency Platform/150416_ETUG user feedback re-
port.pdf 16 http://www.acer.europa.eu/Official_documents/Acts_of_the_Agency/Opinions/Opinions/ACER Opinion 26-
2013.pdf 17 http://www.acer.europa.eu/official_documents/acts_of_the_agency/opinions/opinions/acer opinion 02-
2017.pdf

13
For processing and analysing the files, we use both Microsoft Excel and Jupyter Note-
books18, an open-source web application that allows creating and sharing documents that
contain live code, visualizations and explanatory text. Scripts are written in the program-
ming language Python. The Excel files as well as the code used for our data analysis are
open source and can be downloaded19.
3.4. Online user survey
We sent an online survey to data users to get a representative and statistically significant
picture of the quality of the TP according to users. The survey was initiated with the ex-
pectation that results would not necessarily be factual but would reflect user perceptions
and could be crosschecked via our statistical analysis. The survey questions were drafted
by Neon and updated after a pilot survey. Following approval from the European Commis-
sion, we sent out the survey in July to the first wave of recipients. Over 600 potential data
users based in 12 European countries received the survey. Table 4 lists the survey ques-
tions.
80 data users, mostly affiliated with research institutions (63%), answered the survey. Of
those who answered the survey, most users use Load (91%), Generation (85%) and Trans-
mission (60%) data domains. 75% of users report that they use the data for fundamental
power system modelling, 56% for statistical analysis and 38% for econometric analysis.
Respondents are also heterogeneous in their frequency of accessing TP data: 46% of users
report downloading data a couple times each year, 31% download data a couple times
each month and 16% download data several times each day. Table 4 lists the questions of
the online survey. Many questions were multiple choice and gave broad categories as op-
tions rather than specific definitions or methodologies.
Table 4. Questions in online user survey.
Part I: Introduction
• Which datasets from the Transparency Platform have you used?
• Do you rely on Transparency data to make business decisions?
• What do you use Transparency data for? [Fundamental power system modelling/Econo-
metric analysis/Statistical analysis/Other (write-in)]
• Approximately how frequently do you download data from the Transparency Platform?
[Rarely—I do so a couple of times each year/Regularly—I do so a couple of times each
month/Frequently—I do so several times each day/Other (write-in)]
• How experienced are you with analysing (downloaded) Transparency Platform data? [Not
very—I use the data rarely/Somewhat—I use the data on a monthly basis/Very—I use
the data everyday/Other (write-in)]
Part II: Completeness
• Are there missing observations or gaps in the data? [There are many gaps/There are
some gaps/There are no gaps/I’m not sure]
• Please specify any incompleteness issues regarding gaps in the data by time series
and/or geographic area.
• Are there any types of data not currently available that you would like to see provided
on the Transparency Platform?
18 http://jupyter.org/ 19 http://neon-energie.de/transparency-platform
14
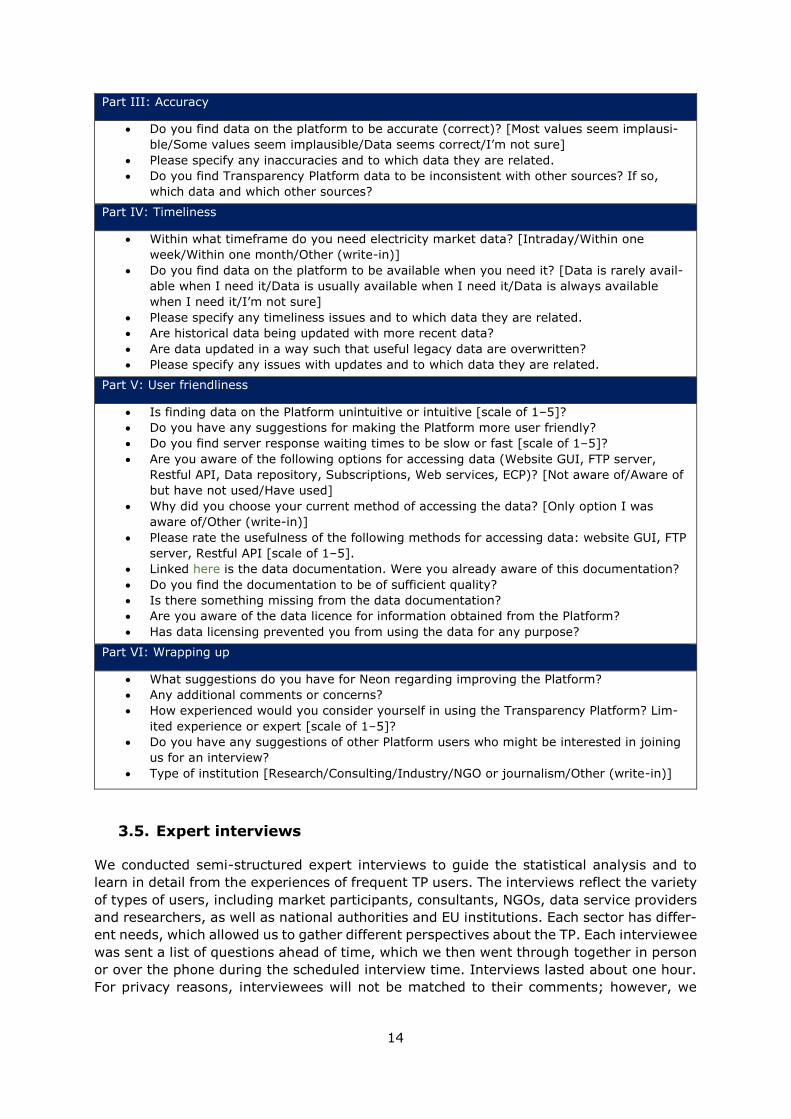
Part III: Accuracy
• Do you find data on the platform to be accurate (correct)? [Most values seem implausi-
ble/Some values seem implausible/Data seems correct/I’m not sure]
• Please specify any inaccuracies and to which data they are related.
• Do you find Transparency Platform data to be inconsistent with other sources? If so,
which data and which other sources?
Part IV: Timeliness
• Within what timeframe do you need electricity market data? [Intraday/Within one
week/Within one month/Other (write-in)]
• Do you find data on the platform to be available when you need it? [Data is rarely avail-
able when I need it/Data is usually available when I need it/Data is always available
when I need it/I’m not sure]
• Please specify any timeliness issues and to which data they are related.
• Are historical data being updated with more recent data?
• Are data updated in a way such that useful legacy data are overwritten?
• Please specify any issues with updates and to which data they are related.
Part V: User friendliness
• Is finding data on the Platform unintuitive or intuitive [scale of 1–5]?
• Do you have any suggestions for making the Platform more user friendly?
• Do you find server response waiting times to be slow or fast [scale of 1–5]?
• Are you aware of the following options for accessing data (Website GUI, FTP server,
Restful API, Data repository, Subscriptions, Web services, ECP)? [Not aware of/Aware of
but have not used/Have used]
• Why did you choose your current method of accessing the data? [Only option I was
aware of/Other (write-in)]
• Please rate the usefulness of the following methods for accessing data: website GUI, FTP
server, Restful API [scale of 1–5].
• Linked here is the data documentation. Were you already aware of this documentation?
• Do you find the documentation to be of sufficient quality?
• Is there something missing from the data documentation?
• Are you aware of the data licence for information obtained from the Platform?
• Has data licensing prevented you from using the data for any purpose?
Part VI: Wrapping up
• What suggestions do you have for Neon regarding improving the Platform?
• Any additional comments or concerns?
• How experienced would you consider yourself in using the Transparency Platform? Lim-
ited experience or expert [scale of 1–5]?
• Do you have any suggestions of other Platform users who might be interested in joining
us for an interview?
• Type of institution [Research/Consulting/Industry/NGO or journalism/Other (write-in)]
3.5. Expert interviews
We conducted semi-structured expert interviews to guide the statistical analysis and to
learn in detail from the experiences of frequent TP users. The interviews reflect the variety
of types of users, including market participants, consultants, NGOs, data service providers
and researchers, as well as national authorities and EU institutions. Each sector has differ-
ent needs, which allowed us to gather different perspectives about the TP. Each interviewee
was sent a list of questions ahead of time, which we then went through together in person
or over the phone during the scheduled interview time. Interviews lasted about one hour.
For privacy reasons, interviewees will not be matched to their comments; however, we

15
have assigned a number to each interviewee so that a single expert’s opinions are identi-
fiable throughout the report as belonging to a unique person, e.g. all statements marked
[3] were given by the same interviewee.
We conducted 23 interviews (Table 5). Interviewees were identified through our network,
the ETUG members list and recommendations from contacts including previous interview-
ees. Although we aimed for geographic diversity in scheduling interviews, the experts we
talked to skewed from Western Europe. To remedy this, we followed up with experts in
Southern and Eastern Europe; however, we still were not able to schedule any interviews
with experts from these regions.
Table 5. List of interview partners.
Name Institution Sector
Jan Abrell ETH Zürich Academia
Lissy Langer TU Berlin Academia
Jens Weibezahn TU Berlin Academia
Florian Ziel University Duisburg-Es-sen
Academia
Paul-Frederik Bach Freelance consultant Consulting
Philip Hewitt EnAppSys Data service provider
Olivier Corradi Tomorrow Data service provider
Talia Parisi Genscape Data service provider
Ralf Uttich RWE Industry
Christian Bärwolf LEAG Industry
Jens Wimschulte Vattenfall Industry
Chris Münster Vattenfall Industry
Tobias Schulz Vattenfall Industry
Sigurd Pedersen DONG Energy Industry
Dave Jones Sandbag NGO
Antonella Battaglini Renewables Grid Initia-
tive
NGO
Thorsten Lenck Agora Energiewende NGO
Mara Marthe Kleiner Agora Energiewende NGO
Rafael Muruais-Garcia ACER Policy
Marcus Mittendorf EEX Power exchange & data service pro-vider
Katrin Petri EEX Power exchange & data service pro-vider
Filippo Pirovano EDF Trading Trading
Notes: One interviewee did not consent to being identified by name; thus, 22 names are listed.
During the project, a workshop with members of DG ENER—Balazs Josza, Andras Hujber
and Mathilde Carbonnelle—and ENTSO-E—Mark Csete, Dalius Sulga, Tomas Sumskas and
Cris Cotino—was held with the intention of receiving feedback on our preliminary findings.
The discussions further informed this report.

16
3.6. Limitations
The size of the TP presents a limitation to this report: not all data items can be scrutinized
to the same degree, nor can all findings be presented in tables or figures. An additional
limitation is presented by the fact that we used a snapshot of data retrieved in mid-2017.
Any improvements thereafter remain neglected in this report. Also, in using the FTP to
access data, some features of the data were inaccessible to us such as the differentiation
of missing data by “not expected” (n/e) and “not available” (N/A). In the CSV files retrieved
through FTP, missing data are not there; the entry is missing altogether. Some of these
issues may exist because the FTP is in a test phase. Wherever possible, we added infor-
mation manually retrieved from the GUI.
4. FINDINGS
The following findings are based on information we have learned from other qualitative
assessments, our statistical data analysis, online survey results and expert interviews.
They are discussed along the four evaluation criteria: completeness, accuracy, timeliness
and user friendliness. The lines between these four categories are not always clear. For
example, we discuss the issues of outages/ UMMs as well as forecasts being overwritten
with actuals in Section 4.3, although they also could be considered issues of completeness
or accuracy.
Our analyses reveal shortcomings, including gaps in most items we assessed, on which we
will elaborate in the following. Several of the market actors that we interviewed stated that
they rely on other platforms or commercial firms such as Bloomberg because they do not
trust the TP to provide up-to-date, complete and accurate data. Another result of our anal-
ysis is that the TP has improved over time. The quality of several (but not all) data items
has improved. Usability has improved, the biggest step probably being the introduction of
FTP and API as means to download data.
4.1. Completeness
Assessing completeness means verifying whether all data items specified in Regulation
543/2013 are available on the TP for all geographic entities that apply and for all time
steps since January 5, 2015, when the Regulation came into force. We identified two types
of issues regarding completeness:
• Missing data: data that should be published are not (data gaps)
• Information about missing data: users are not informed about data gaps
Additionally, some users requested broader coverage and identified data they would be
interested in that go beyond what is prescribed in Regulation 543/2013.
It should be noted that many data items are useful only if they are reported completely.
Missing load, price, transmission or generation data even in “only” 1% of all time steps can
render the raw time series useless for many use cases. For such time series, anything
below 100% completeness would seem unsatisfactory. Even though gaps can be filled us-
ing data processing software, doing so could introduce a bias to the data because the gaps
might not be random.
Insufficiently accurate data definitions can lead to data gaps; however, since such short-
comings are also a source of inaccurate data, we will address issues related to data
definitions in Section 4.2. Two issues that involve problems related to completeness of
data are UMMs and useful historical data being overwritten with updated values. These
issues will be elaborated upon in Section 4.3.
17
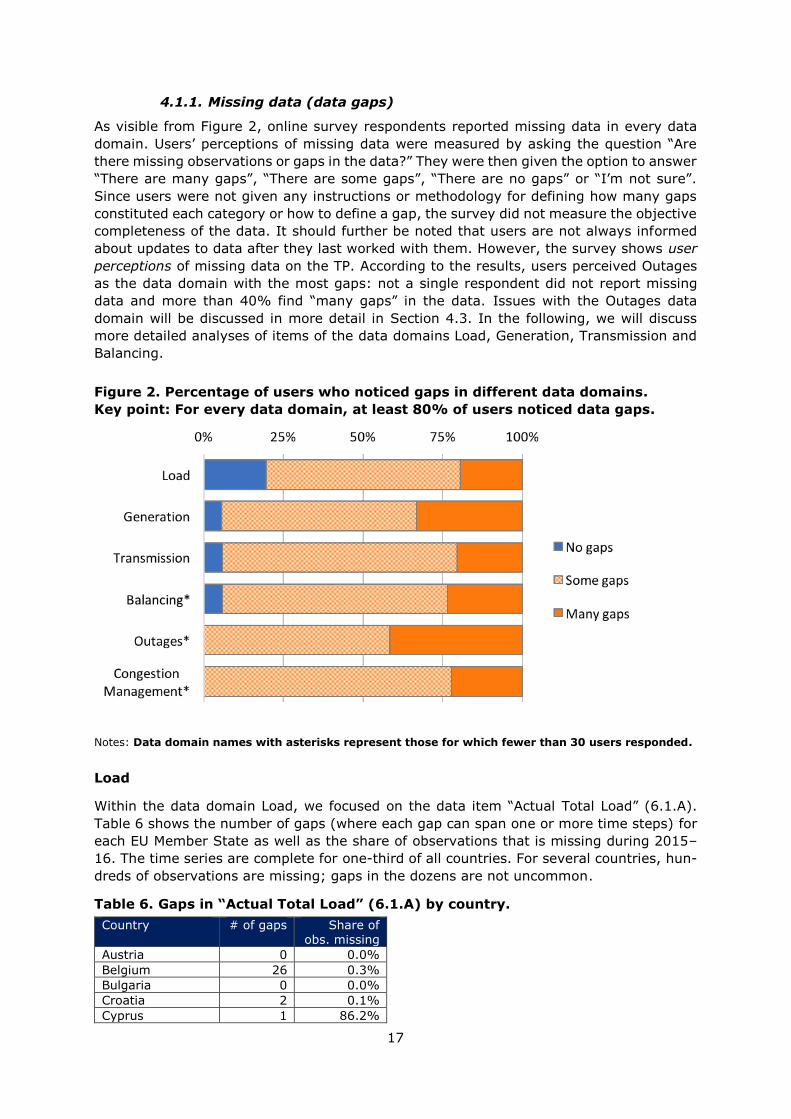
4.1.1. Missing data (data gaps)
As visible from Figure 2, online survey respondents reported missing data in every data
domain. Users’ perceptions of missing data were measured by asking the question “Are
there missing observations or gaps in the data?” They were then given the option to answer
“There are many gaps”, “There are some gaps”, “There are no gaps” or “I’m not sure”.
Since users were not given any instructions or methodology for defining how many gaps
constituted each category or how to define a gap, the survey did not measure the objective
completeness of the data. It should further be noted that users are not always informed
about updates to data after they last worked with them. However, the survey shows user
perceptions of missing data on the TP. According to the results, users perceived Outages
as the data domain with the most gaps: not a single respondent did not report missing
data and more than 40% find “many gaps” in the data. Issues with the Outages data
domain will be discussed in more detail in Section 4.3. In the following, we will discuss
more detailed analyses of items of the data domains Load, Generation, Transmission and
Balancing.
Figure 2. Percentage of users who noticed gaps in different data domains.
Key point: For every data domain, at least 80% of users noticed data gaps.
Notes: Data domain names with asterisks represent those for which fewer than 30 users responded.
Load
Within the data domain Load, we focused on the data item “Actual Total Load” (6.1.A).
Table 6 shows the number of gaps (where each gap can span one or more time steps) for
each EU Member State as well as the share of observations that is missing during 2015–
16. The time series are complete for one-third of all countries. For several countries, hun-
dreds of observations are missing; gaps in the dozens are not uncommon.
Table 6. Gaps in “Actual Total Load” (6.1.A) by country.
Country # of gaps Share of obs. missing
Austria 0 0.0%
Belgium 26 0.3%
Bulgaria 0 0.0%
Croatia 2 0.1%
Cyprus 1 86.2%
18
Country # of gaps Share of obs. missing
Czech Republic 19 0.7%
Denmark 2 2.7%
Estonia 27 0.4%
Finland 47 0.3%
France 15 0.1%
Germany 0 0.0%
Greece 28 0.4%
Hungary 3 0.0%
Ireland 78 1.2%
Italy 14 2.5%
Latvia 21 0.2%
Lithuania 55 2.5%
Luxembourg 0 0.0%
Malta 1 100.0%
Netherlands 0 0.0%
Poland 0 0.0%
Portugal 0 0.0%
Romania 20 0.8%
Slovakia 35 0.3%
Slovenia 1 0.0%
Spain 18 0.2%
Sweden 1 7.5%
United Kingdom 0 0.0%
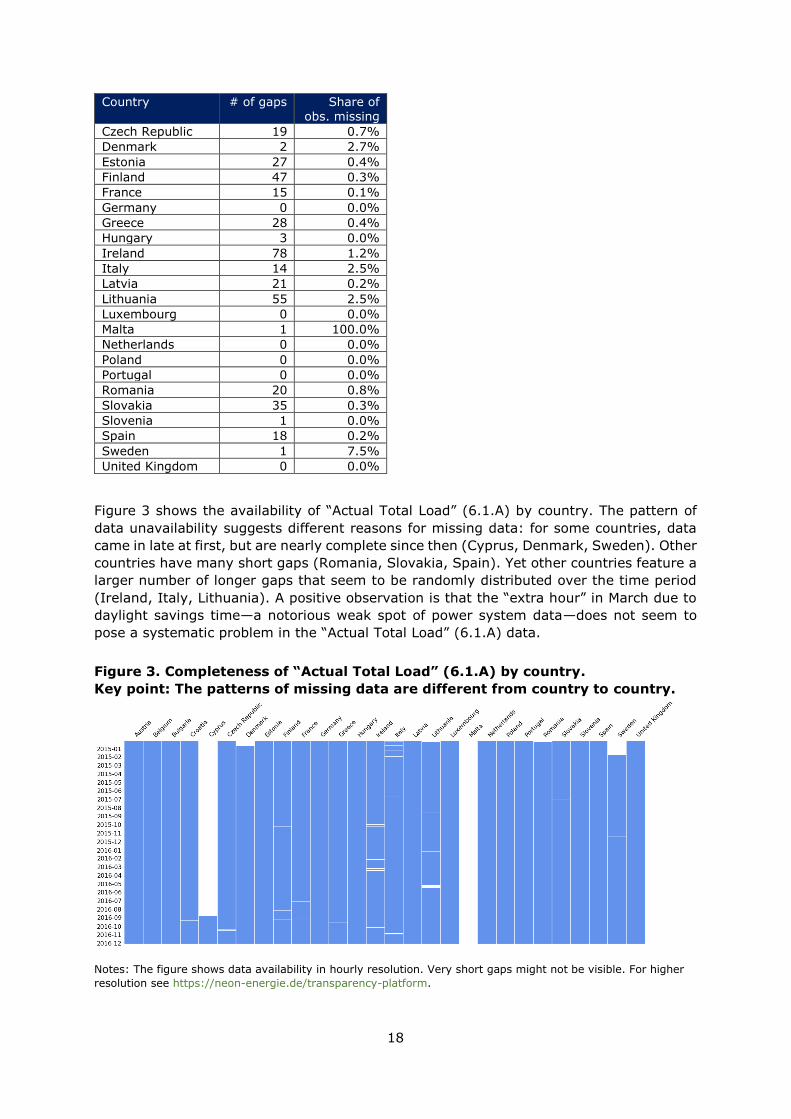
Figure 3 shows the availability of “Actual Total Load” (6.1.A) by country. The pattern of
data unavailability suggests different reasons for missing data: for some countries, data
came in late at first, but are nearly complete since then (Cyprus, Denmark, Sweden). Other
countries have many short gaps (Romania, Slovakia, Spain). Yet other countries feature a
larger number of longer gaps that seem to be randomly distributed over the time period
(Ireland, Italy, Lithuania). A positive observation is that the “extra hour” in March due to
daylight savings time—a notorious weak spot of power system data—does not seem to
pose a systematic problem in the “Actual Total Load” (6.1.A) data.
Figure 3. Completeness of “Actual Total Load” (6.1.A) by country.
Key point: The patterns of missing data are different from country to country.
Notes: The figure shows data availability in hourly resolution. Very short gaps might not be visible. For higher
resolution see https://neon-energie.de/transparency-platform.

19
Generation
During an ETUG meeting, ENTSO-E reported that service desk complaints often concerned
missing generation data from Austria, Belgium, the Czech Republic, Germany, Spain, Hun-
gary, Ireland, Italy, Luxembourg, the Netherlands, Slovenia and Sweden. However, it is
not clear to us if these complaints reflect a systematic pattern.
For this report, we studied the items “Aggregated Generation per Type” (16.1.B&C) and
“Actual Generation per Generation Unit” (16.1.A). Figure 4 shows the former, focusing on
the most common technologies. Coloured cells show the share of observations missing
(reported as “N/A” on the TP website). White fields containing “n/e” indicate that genera-
tion data from that country and technology are not expected on the TP. Cases of 100%
“N/A” also could indicate a misconfiguration where no data are expected; that is, “n/e”
should be reported instead. Croatia (all values “N/A”) as well as Luxembourg and Malta
(all values “n/e”) do not report any data for this data item.
Few time series are complete. Coverage is nearly complete in Austria, Belgium, Germany,
Denmark and Portugal. In Italy and Slovenia, a year is missing for some or all technologies,
resulting in shares of around 50% missing values for the two years covered.
20
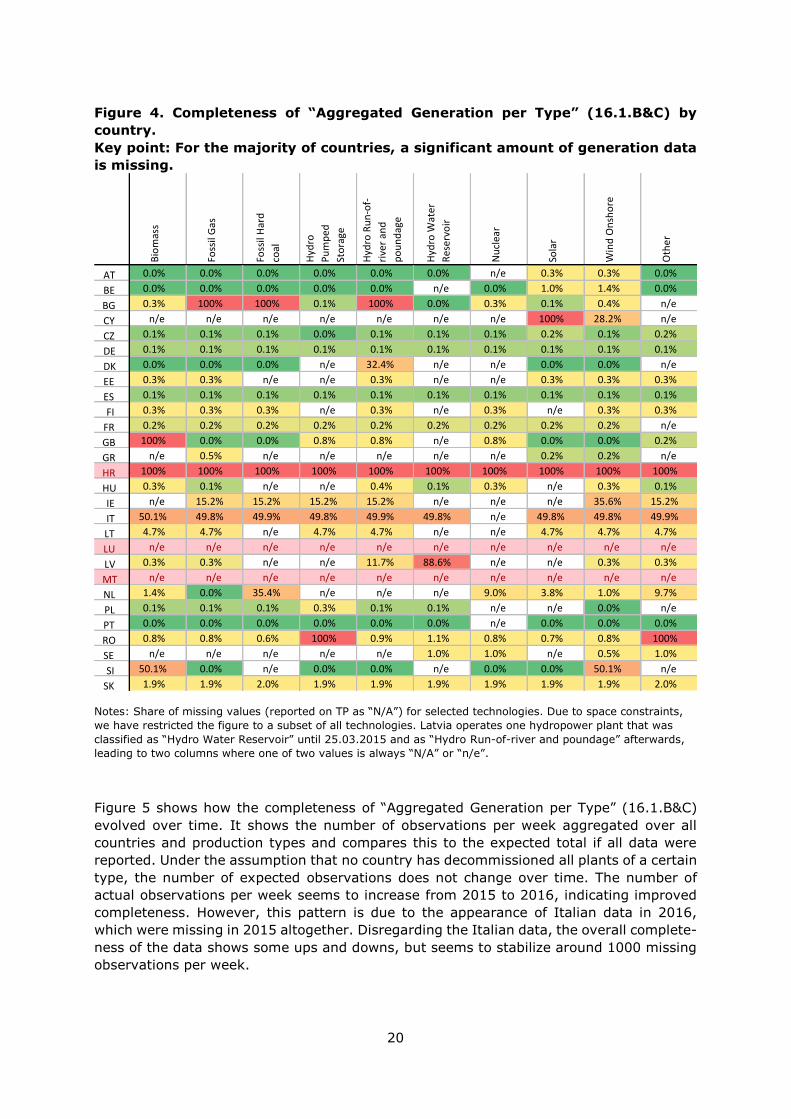
Figure 4. Completeness of “Aggregated Generation per Type” (16.1.B&C) by
country.
Key point: For the majority of countries, a significant amount of generation data
is missing.
Notes: Share of missing values (reported on TP as “N/A”) for selected technologies. Due to space constraints,
we have restricted the figure to a subset of all technologies. Latvia operates one hydropower plant that was
classified as “Hydro Water Reservoir” until 25.03.2015 and as “Hydro Run-of-river and poundage” afterwards,
leading to two columns where one of two values is always “N/A” or “n/e”.
Figure 5 shows how the completeness of “Aggregated Generation per Type” (16.1.B&C)
evolved over time. It shows the number of observations per week aggregated over all
countries and production types and compares this to the expected total if all data were
reported. Under the assumption that no country has decommissioned all plants of a certain
type, the number of expected observations does not change over time. The number of
actual observations per week seems to increase from 2015 to 2016, indicating improved
completeness. However, this pattern is due to the appearance of Italian data in 2016,
which were missing in 2015 altogether. Disregarding the Italian data, the overall complete-
ness of the data shows some ups and downs, but seems to stabilize around 1000 missing
observations per week.
Biomass
FossilGas
FossilHard
coal
Hydro
Pumped
Storage
HydroRun-of-
riverand
poundage
HydroW
ater
Reservoir
Nuclear
Solar
WindOnshore
Other
AT 0.0% 0.0% 0.0% 0.0% 0.0% 0.0% n/e 0.3% 0.3% 0.0%
BE 0.0% 0.0% 0.0% 0.0% 0.0% n/e 0.0% 1.0% 1.4% 0.0%
BG 0.3% 100% 100% 0.1% 100% 0.0% 0.3% 0.1% 0.4% n/e
CY n/e n/e n/e n/e n/e n/e n/e 100% 28.2% n/e
CZ 0.1% 0.1% 0.1% 0.0% 0.1% 0.1% 0.1% 0.2% 0.1% 0.2%
DE 0.1% 0.1% 0.1% 0.1% 0.1% 0.1% 0.1% 0.1% 0.1% 0.1%
DK 0.0% 0.0% 0.0% n/e 32.4% n/e n/e 0.0% 0.0% n/e
EE 0.3% 0.3% n/e n/e 0.3% n/e n/e 0.3% 0.3% 0.3%
ES 0.1% 0.1% 0.1% 0.1% 0.1% 0.1% 0.1% 0.1% 0.1% 0.1%
FI 0.3% 0.3% 0.3% n/e 0.3% n/e 0.3% n/e 0.3% 0.3%
FR 0.2% 0.2% 0.2% 0.2% 0.2% 0.2% 0.2% 0.2% 0.2% n/e
GB 100% 0.0% 0.0% 0.8% 0.8% n/e 0.8% 0.0% 0.0% 0.2%
GR n/e 0.5% n/e n/e n/e n/e n/e 0.2% 0.2% n/e
HR 100% 100% 100% 100% 100% 100% 100% 100% 100% 100%
HU 0.3% 0.1% n/e n/e 0.4% 0.1% 0.3% n/e 0.3% 0.1%
IE n/e 15.2% 15.2% 15.2% 15.2% n/e n/e n/e 35.6% 15.2%
IT 50.1% 49.8% 49.9% 49.8% 49.9% 49.8% n/e 49.8% 49.8% 49.9%
LT 4.7% 4.7% n/e 4.7% 4.7% n/e n/e 4.7% 4.7% 4.7%
LU n/e n/e n/e n/e n/e n/e n/e n/e n/e n/e
LV 0.3% 0.3% n/e n/e 11.7% 88.6% n/e n/e 0.3% 0.3%
MT n/e n/e n/e n/e n/e n/e n/e n/e n/e n/e
NL 1.4% 0.0% 35.4% n/e n/e n/e 9.0% 3.8% 1.0% 9.7%
PL 0.1% 0.1% 0.1% 0.3% 0.1% 0.1% n/e n/e 0.0% n/e
PT 0.0% 0.0% 0.0% 0.0% 0.0% 0.0% n/e 0.0% 0.0% 0.0%
RO 0.8% 0.8% 0.6% 100% 0.9% 1.1% 0.8% 0.7% 0.8% 100%
SE n/e n/e n/e n/e n/e 1.0% 1.0% n/e 0.5% 1.0%
SI 50.1% 0.0% n/e 0.0% 0.0% n/e 0.0% 0.0% 50.1% n/e
SK 1.9% 1.9% 2.0% 1.9% 1.9% 1.9% 1.9% 1.9% 1.9% 2.0%

21
Figure 5. Weekly number of “Aggregated Generation per Type” (16.1.B&C) ob-
servations.
Key point: We cannot identify a trend toward improvement of completeness over
time.
Notes: In a week, the expected number of observations 42,504 = 168 hours x 253 country–type combina-
tions. Excepting Italy, it is 40,320 = 168 hours x 240 country–type combinations. The total number of
country–type combinations on the FTP server is 260; however, this includes combinations that are always
marked as “n/e” on the TP website and are thus disregarded.
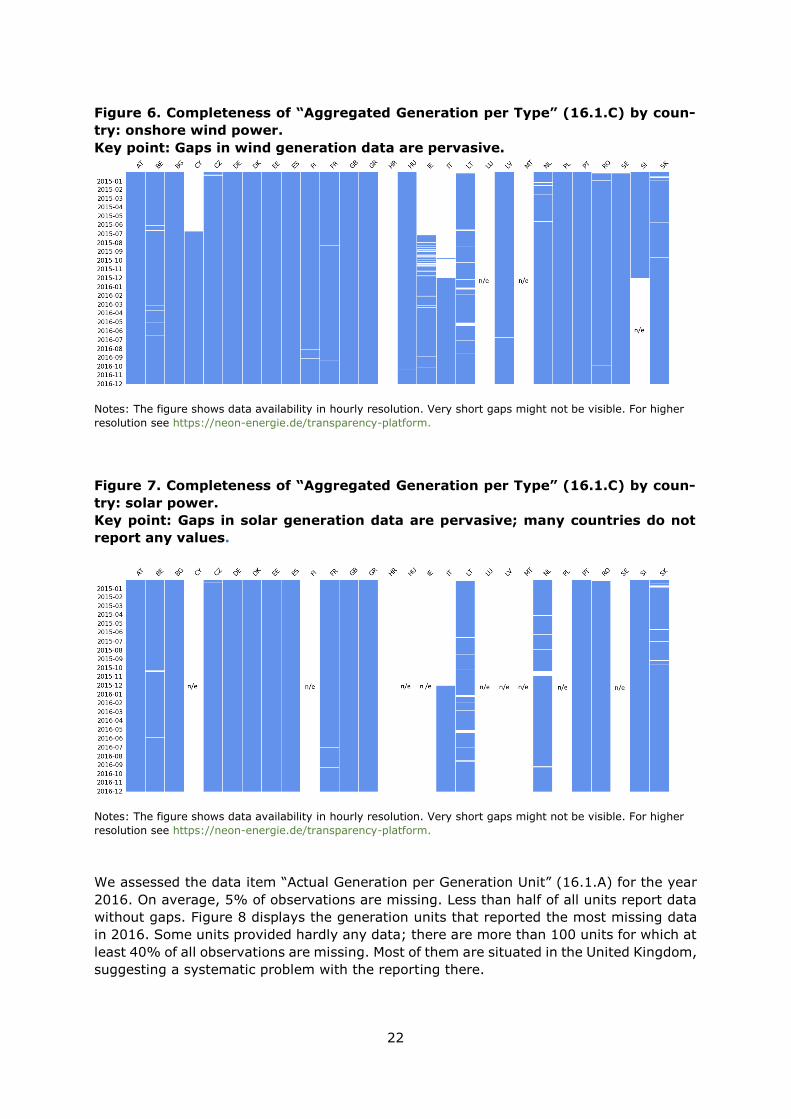
To better understand the pattern in missing data, we plot the temporal distribution of the
gaps of solar and wind generation in Figure 6 and Figure 7, respectively. According to
Regulation 543/2013, TSOs are required to report wind and solar generation if they con-
tribute to at least 1% of a country’s total generation. In the case of solar, Finland, Hungary,
Ireland, Latvia, Lithuania, Poland and Sweden do not seem to meet this threshold. The
wind and solar data from other countries feature many short gaps. Overall, there is no
general trend towards improvement over time.
22
Figure 6. Completeness of “Aggregated Generation per Type” (16.1.C) by coun-
try: onshore wind power.
Key point: Gaps in wind generation data are pervasive.
Notes: The figure shows data availability in hourly resolution. Very short gaps might not be visible. For higher
resolution see https://neon-energie.de/transparency-platform.
Figure 7. Completeness of “Aggregated Generation per Type” (16.1.C) by coun-
try: solar power.
Key point: Gaps in solar generation data are pervasive; many countries do not
report any values.
Notes: The figure shows data availability in hourly resolution. Very short gaps might not be visible. For higher
resolution see https://neon-energie.de/transparency-platform.
We assessed the data item “Actual Generation per Generation Unit” (16.1.A) for the year
2016. On average, 5% of observations are missing. Less than half of all units report data
without gaps. Figure 8 displays the generation units that reported the most missing data
in 2016. Some units provided hardly any data; there are more than 100 units for which at
least 40% of all observations are missing. Most of them are situated in the United Kingdom,
suggesting a systematic problem with the reporting there.

23
Figure 8. Generation units with highest share of missing observations.
Key point: More than 100 power plants missed reporting 40% or more of the
time.
Source: Own figure based on data provided by Dave Jones, Sandbag.
Notes: Accounting for units >100 MW. To account for the possibility of “mothballed” or decommissioned units, only the period between the first and the last reported value of each unit was regarded as expected. This way,

24
no data are expected for new power plants before they started operating or for old plants after they were decommissioned. It is assumed that no plants that were decommissioned in 2016 went back online in the same year.
Figure 9. Missing observations in “Actual Generation per Generation Unit”
(16.1.A) in 2016, averaged by country.
Key point: In Ireland, the United Kingdom and Bulgaria, generators on average
provided less than 60% of all data.
Source: Own figure based on data provided by Dave Jones, Sandbag.
Notes: Figure shows the share of missing observations by country for EU Member States. There are no data for
Irish generation units after 24.05.2016 and none for Bulgarian units before 16.05.2016, leading to high per-
centages of missing values. In the United Kingdom, generators on average provided little more than half of all
data. No data at all are provided for Cyprus, Luxembourg, Malta and Croatia, possibly due to no generators
>100 MW existing in these countries. Generation units located in Sweden, Hungary, Poland, Romania, Latvia,
Slovakia and Slovenia provided virtually all (<0.5% missing) data.
Responses by interviewees and survey participants are consistent with our findings. In
addition, it was pointed out that the 100 MW reporting threshold for individual units seems
to be applied inconsistently—sometimes to entire power stations, in other cases to individ-
ual electricity generators. More issues with completeness included reporting gaps in
German gas plants, Spanish solar production and for all production types in the Nether-
lands. These are the issues mentioned:
• Not all power plants above 100 MW are included in “Actual Generation per Gener-
ation Unit” (16.1.A). [survey]
• There are frequently data gaps in “Aggregated Generation per Type” (16.1.B&C).
[survey]
• Some German fossil gas plants are missing from generation data (16.1.A). [11]
• Some German generating units are missing data in “Actual Generation per Gener-
ation Unit” (16.1.A). [survey]
• In Spain, there are data gaps regarding solar production (16.1.B&C). [3]
• There are no data for “Aggregated Generation per Type” (16.1.B&C) in Italy for
2015. [survey]
• Data for “Aggregated Generation per Type” (16.1.B&C) are incomplete in the Neth-
erlands. [14] [survey]

25
Transmission
Within the data domain Transmission, we evaluated the data items “Day-ahead Prices”
(12.1.D) and “Scheduled Commercial Exchanges” (12.1.F). “Scheduled Commercial Ex-
changes” (12.1.F) is one of the patchier data items, as Figure 10 illustrates. For some time
series, a year of data is missing, which is the case for some of the Italian, Lithuanian and
Norwegian borders. Others exhibit frequent shorter gaps, e.g. borders between Bulgaria
and Greece and their respective neighbours.

26
Figure 10. Completeness of “Scheduled Commercial Exchanges” (12.1.F) by bid-
ding zone borders.
Key point: Exchange data are patchy with different patterns of missing data.
Notes: The figure shows data availability in hourly resolution. Very short gaps might not be visible. For higher
resolution see https://neon-energie.de/transparency-platform.

27
Table 7 lists the 63 borders between bidding zones for which we found incomplete data.
51 borders (45%) had no data gaps.
Table 7. Gaps in “Scheduled Commercial Exchanges” (12.1.F) by bidding zone
border.
Bidding zone border # of gaps Share of
obs. miss-ing
NO5 -> NO3 5 59%
NO3 -> NO5 4 59%
TR -> BG 16 26%
BG -> TR 15 26%
GR -> BG 10 24%
GR -> AL 28 23%
UA -> PL 2 12%
MK -> BG 20 11%
BG -> MK 19 11%
DE_AT_LU -> SE4 5 8%
SE4 -> DE_AT_LU 5 8%
GR -> IT_GR 7 8%
TR -> GR 9 4%
GR -> TR 8 4%
GR -> MK 9 3%
BG -> RS 10 2%
RS -> BG 10 2%
RS -> MK 2 2%
AL -> ME 1 1%
NO5 -> NO1 9 1%
AL -> GR 5 1%
BA -> HR 4 1%
ME -> BA 3 1%
RU -> EE 1 1%
LV -> RU 1 1%
RU -> LV 1 1%
FI -> NO4 1 1%
NO5 -> NO2 4 1%
HR -> BA 3 1%
GB -> IE_SEM 2 1%
IE_SEM -> GB 2 1%
PL -> SE4 3 1%
SE4 -> PL 3 1%
LT -> RU_KGD 1 1%
DK1 -> DK2 1 1%
DK2 -> DK1 1 1%
IT_GR -> GR 4 1%
IT_NORD_FR -> FR 1 1%
ME -> AL 3 1%
AL -> RS 1 1%
BA -> RS 1 1%
RS -> AL 1 1%
RS -> BA 1 1%
BY -> LT 3 1%
LT -> BY 1 1%
RU_KGD -> LT 3 1%
BG -> GR 3 1%
BA -> ME 2 1%
FR -> IT_NORD_FR 1 1%
HR -> RS 1 1%
ME -> RS 1 1%
RS -> HR 1 1%
28
Bidding zone border # of gaps Share of obs. miss-
ing
MK -> RS 1 1%
NO5 -> NO3 5 59%
NO3 -> NO5 4 59%
TR -> BG 16 26%
BG -> TR 15 26%
GR -> BG 10 24%
GR -> AL 28 23%
UA -> PL 2 12%
MK -> BG 20 11%
BG -> MK 19 11%
DE_AT_LU -> SE4 5 8%
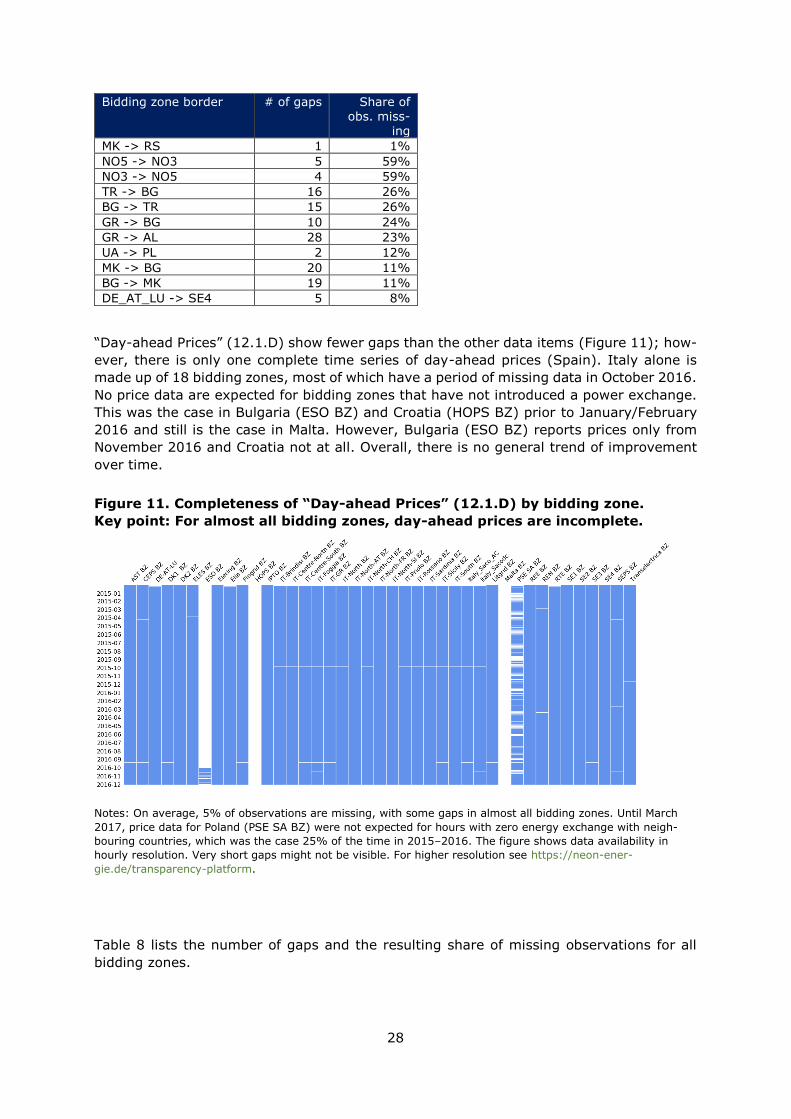
“Day-ahead Prices” (12.1.D) show fewer gaps than the other data items (Figure 11); how-
ever, there is only one complete time series of day-ahead prices (Spain). Italy alone is
made up of 18 bidding zones, most of which have a period of missing data in October 2016.
No price data are expected for bidding zones that have not introduced a power exchange.
This was the case in Bulgaria (ESO BZ) and Croatia (HOPS BZ) prior to January/February
2016 and still is the case in Malta. However, Bulgaria (ESO BZ) reports prices only from
November 2016 and Croatia not at all. Overall, there is no general trend of improvement
over time.
Figure 11. Completeness of “Day-ahead Prices” (12.1.D) by bidding zone.
Key point: For almost all bidding zones, day-ahead prices are incomplete.
Notes: On average, 5% of observations are missing, with some gaps in almost all bidding zones. Until March
2017, price data for Poland (PSE SA BZ) were not expected for hours with zero energy exchange with neigh-
bouring countries, which was the case 25% of the time in 2015–2016. The figure shows data availability in
hourly resolution. Very short gaps might not be visible. For higher resolution see https://neon-ener-
gie.de/transparency-platform.
Table 8 lists the number of gaps and the resulting share of missing observations for all
bidding zones.

29
Table 8. Gaps in day-ahead prices by bidding zone.
Bidding zone # of gaps Share of obs. missing
AST BZ 2 0.3%
CEPS BZ 3 0.4%
DE-AT-LU 2 1.0%
DK1 BZ 2 0.3%
DK2 BZ 1 0.1%
ELES BZ 3 0.4%
ESO BZ 11 93.8%
Elering BZ 1 0.1%
Elia BZ 3 1.1%
Fingrid BZ 3 0.4%
HOPS BZ 1 100.0%
IPTO BZ 1 0.0%
IT-Brindisi BZ 1 0.8%
IT-Centre-North BZ 1 0.8%
IT-Centre-South BZ
2 1.0%
IT-Foggia BZ 3 1.1%
IT-GR BZ 2 1.0%
IT-North BZ 1 0.8%
IT-North-AT BZ 0 0.5%
IT-North-CH BZ 1 0.8%
IT-North-FR BZ 0 0.5%
IT-North-SI BZ 0 0.5%
IT-Priolo BZ 1 0.8%
IT-Rossano BZ 1 0.8%
IT-Sardinia BZ 1 0.8%
IT-Sicily BZ 2 1.0%
IT-South BZ 1 0.8%
Italy_Saco_AC 2 1.0%
Italy_Sacodc 2 1.0%
Litgrid BZ 3 0.4%
Malta BZ 1 100.0%
PSE SA BZ 775 25.4%
REE BZ 1 0.0%
REN BZ 4 0.5%
RTE BZ 2 1.0%
SE1 BZ 1 0.1%
SE2 BZ 2 0.3%
SE3 BZ 2 0.3%
SE4 BZ 1 0.1%
SEPS BZ 5 0.7%
Transelectrica BZ 2 0.4%
Responses by interviewees and survey participants are consistent with our findings. Noted
issues included incomplete “Physical Flows” (12.1.G) and “Scheduled Commercial Ex-
changes” (12.1.F). These are the issues mentioned:
• Cross-border “Physical Flows” (12.1.G) are often incomplete. [4]
• “Forecasted Day-ahead Transfer Capacities” (11.1.A) seem to display the mini-
mum in the indicated forward period. [1]
• Nearly four months of data are missing for United Kingdom–Ireland “Forecasted
Day-ahead Transfer Capacities” (11.1.A). [survey]
• There are gaps in “Scheduled Commercial Exchanges” (12.1.F) for Germany. [sur-
vey]
30
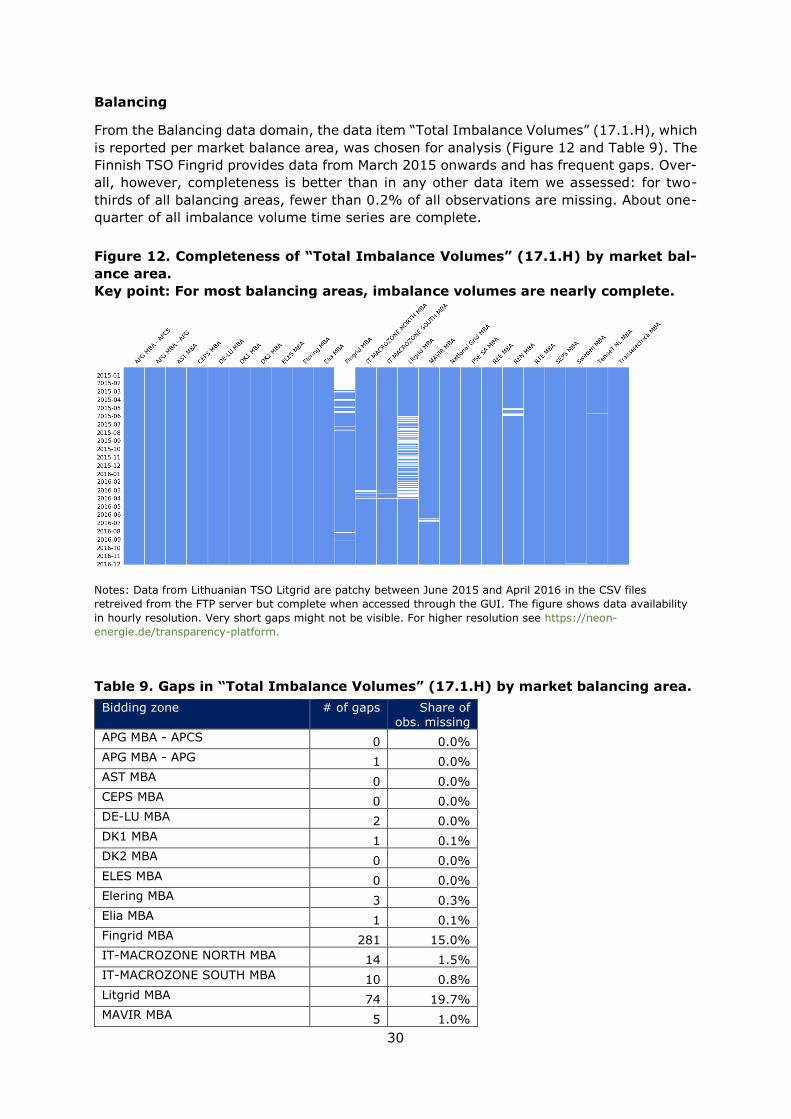
Balancing
From the Balancing data domain, the data item “Total Imbalance Volumes” (17.1.H), which
is reported per market balance area, was chosen for analysis (Figure 12 and Table 9). The
Finnish TSO Fingrid provides data from March 2015 onwards and has frequent gaps. Over-
all, however, completeness is better than in any other data item we assessed: for two-
thirds of all balancing areas, fewer than 0.2% of all observations are missing. About one-
quarter of all imbalance volume time series are complete.
Figure 12. Completeness of “Total Imbalance Volumes” (17.1.H) by market bal-
ance area.
Key point: For most balancing areas, imbalance volumes are nearly complete.
Notes: Data from Lithuanian TSO Litgrid are patchy between June 2015 and April 2016 in the CSV files
retreived from the FTP server but complete when accessed through the GUI. The figure shows data availability
in hourly resolution. Very short gaps might not be visible. For higher resolution see https://neon-
energie.de/transparency-platform.
Table 9. Gaps in “Total Imbalance Volumes” (17.1.H) by market balancing area.
Bidding zone # of gaps Share of obs. missing
APG MBA - APCS 0 0.0%
APG MBA - APG 1 0.0%
AST MBA 0 0.0%
CEPS MBA 0 0.0%
DE-LU MBA 2 0.0%
DK1 MBA 1 0.1%
DK2 MBA 0 0.0%
ELES MBA 0 0.0%
Elering MBA 3 0.3%
Elia MBA 1 0.1%
Fingrid MBA 281 15.0%
IT-MACROZONE NORTH MBA 14 1.5%
IT-MACROZONE SOUTH MBA 10 0.8%
Litgrid MBA 74 19.7%
MAVIR MBA 5 1.0%
31
Bidding zone # of gaps Share of obs. missing
National Grid MBA 6 0.0%
PSE SA MBA 2 0.1%
REE MBA 1 0.0%
REN MBA 9 1.6%
RTE MBA 73 0.2%
SEPS MBA 1 0.1%
Sweden MBA 5 0.6%
TenneT NL MBA 23 0.2%
Transelectrica MBA 0 0.0%
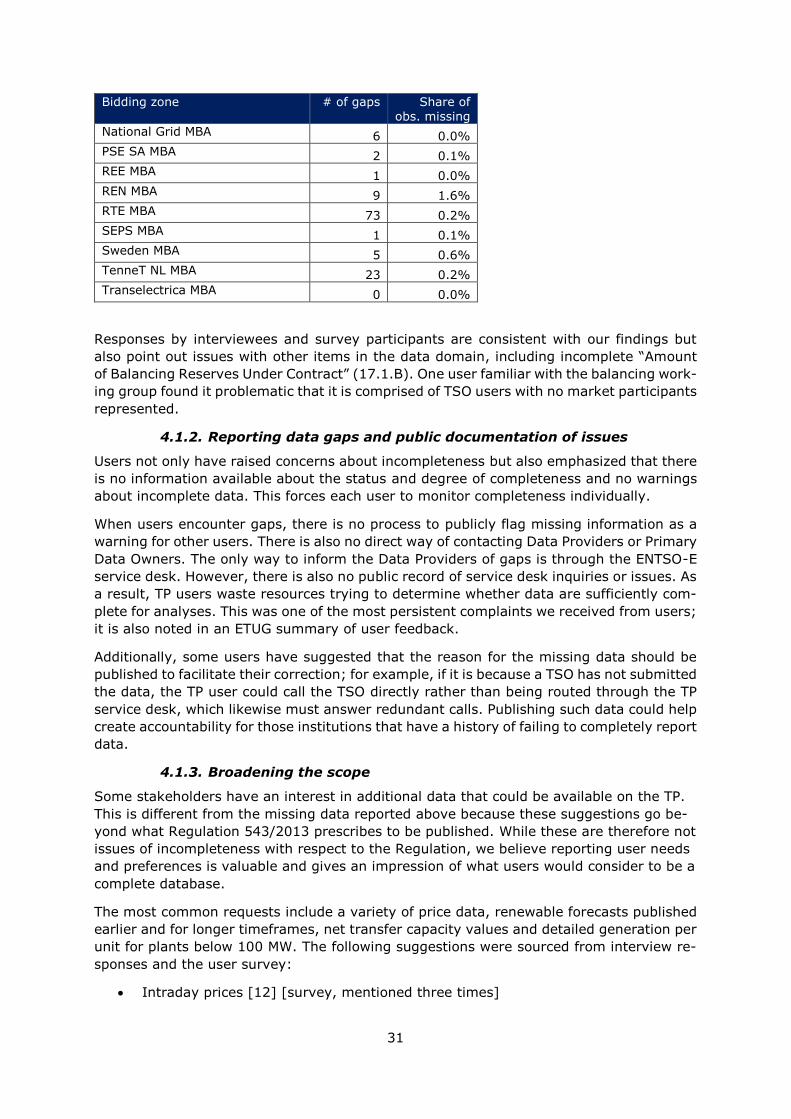
Responses by interviewees and survey participants are consistent with our findings but
also point out issues with other items in the data domain, including incomplete “Amount
of Balancing Reserves Under Contract” (17.1.B). One user familiar with the balancing work-
ing group found it problematic that it is comprised of TSO users with no market participants
represented.
4.1.2. Reporting data gaps and public documentation of issues
Users not only have raised concerns about incompleteness but also emphasized that there
is no information available about the status and degree of completeness and no warnings
about incomplete data. This forces each user to monitor completeness individually.
When users encounter gaps, there is no process to publicly flag missing information as a
warning for other users. There is also no direct way of contacting Data Providers or Primary
Data Owners. The only way to inform the Data Providers of gaps is through the ENTSO-E
service desk. However, there is also no public record of service desk inquiries or issues. As
a result, TP users waste resources trying to determine whether data are sufficiently com-
plete for analyses. This was one of the most persistent complaints we received from users;
it is also noted in an ETUG summary of user feedback.
Additionally, some users have suggested that the reason for the missing data should be
published to facilitate their correction; for example, if it is because a TSO has not submitted
the data, the TP user could call the TSO directly rather than being routed through the TP
service desk, which likewise must answer redundant calls. Publishing such data could help
create accountability for those institutions that have a history of failing to completely report
data.
4.1.3. Broadening the scope
Some stakeholders have an interest in additional data that could be available on the TP.
This is different from the missing data reported above because these suggestions go be-
yond what Regulation 543/2013 prescribes to be published. While these are therefore not
issues of incompleteness with respect to the Regulation, we believe reporting user needs
and preferences is valuable and gives an impression of what users would consider to be a
complete database.
The most common requests include a variety of price data, renewable forecasts published
earlier and for longer timeframes, net transfer capacity values and detailed generation per
unit for plants below 100 MW. The following suggestions were sourced from interview re-
sponses and the user survey:
• Intraday prices [12] [survey, mentioned three times]

32
• Renewable forecasts earlier and further into the future [survey, mentioned four
times]
• Net transfer capacity [survey, mentioned three times]
• Detailed generation per power plant for plants under 100 MW [11] [survey, men-
tioned twice]
• Physical flows per transmission line [14] [survey]
• Planned schedule evolution [14] [survey]
• Geo-referenced, openly licensed grid model of the transmission network [survey,
mentioned twice]
• Detailed generation per technology [survey, mentioned twice]
• Installed capacities [survey, mentioned twice]
• Spot market bids [2]
• Prices for gas, oil, fuel, coal and emission certificates (EUAs) [survey]
• Future prices [survey]
• Generation schedules [survey]
• Combined heat and power capacity [survey]
• Forecasted interconnector capacity as daily and/or hourly time series with unavail-
abilities accounted for [survey]
• Reasons for outages [survey]
• All EICs for power plants [survey]
• Physical transmission capacities [survey]
• Plant availability on an hourly basis [survey]
• Weather data [survey]
• Redispatch forecasts [survey]
• Transit and/or transmission losses [survey]
• Load split by sectors [survey]
• Run-of-the-river hydropower [survey]
• Intraday volumes [survey]
• State of hydro reservoir per plant, including minimum and maximum levels [sur-
vey]
• Production by production type (as opposed to production by fuel, which is what
the current production by production type data report) [survey]
• Forecast net transfer capacity data [9]
• Environmental data [10]
• Final quota offer for cross-border capacity [12]
• Curtailment [12]
• Day-ahead scheduled generation by fuel type [1]
• Categorizing flow into industry, household and services [17]
However, most users preferred to focus on improving the quality of the existing data items
rather than adding any more items at this stage.
4.2. Accuracy
The accuracy analysis aims to identify whether data are “correct”. We compared values on
the TP to values reported elsewhere. It should be noted that differing values may result
from differing data definitions rather than being proof of inaccurate values; however, our
results concern cases in which the data were reasonably comparable. We found four major
issues related to the accuracy of the TP:
• Inconsistencies with other ENTSO-E data,
• Inconsistencies with other data sources,
• Information about inaccuracy: users are not informed about incorrect data and
• Inaccurate data definitions.

33
From January to June 2017, there were 68 service desk requests regarding discrepancies,
differing values and incorrect data. In the ETUG survey, 18% of users characterised their
trust in the reliability of TP data as “little”, with another 41% responding “a moderate
amount”; more than 54% of users had noticed data inconsistencies while using the TP. In
its opinion on the first update of the MoP, ACER noted that despite improving other aspects
of the TP, ENTSO-E had failed to address improvements in assuring data quality.
In our own survey, half of all respondents reported TP data to be inconsistent with other
sources, mentioning the ENTSO-E Ten-Year Network Development Plan, Yearly Statistics
and Mid-term Adequacy Forecast; Eurostat; SKM SYSPOWER; balancing data provided by
RTE; installed capacity per production unit published on regional REMIT platforms; planned
production published on EEX; sum of generation from BDEW and national TSO and industry
reports. According to our online survey, users noticed at least some inaccuracies in all data
domains, as displayed in Figure 13. Users were asked the question “Do you find data on
the platform to be accurate (correct)?”. They were then given the options “Most values
seem implausible”, “Some valuables seem implausible”, “Data seems correct” and “I’m not
sure”. Since users were not given instructions or methodology for defining how many im-
plausible values constituted each category, the survey did not measure the objective
accuracy of the data. It further should be noted that users are not always informed about
rectifications of the data after they last worked with them. However, the survey results
show users’ perceptions of accuracy on the TP.
Figure 13. Percentage of users who noticed implausible values in different data
domains.
Key point: For all data domains, about half or more of users have noticed implau-
sible values.
Notes: Data domain names with asterisks represent those for which fewer than 30 users responded.
Two issues that involve problems related to accuracy of data are UMMs and useful historical
data being overwritten with updated values. However, these issues will be elaborated on
in Section 4.3.

34
4.2.1. Comparison with other sources
One way to check whether TP data are accurate is to compare them to other trusted
sources. However, for many data items other sources do not exist, are blocked by a pay-
wall, are proprietary or are not available in one central spot. We therefore focused on a
few data items for which we compared TP data with sources such as ENTSO-E’s Power
Statistics (formerly “Data Portal”), Eurostat and data collected from individual TSOs’ web-
sites. For some of these data items, it is possible that the definitions differ depending on
the source; however, we believe the results give a valid analysis of data inconsistencies.
Load
We compare the data item “Actual Total Load” (6.1.A) to two other sources of load data:
ENTSO-E provides load data in sections of its website separate from the TP called “Data
Portal” (for data from years until 2015) and “Power Statistics” (years after 2016). It is our
understanding that the data provided by the Data Portal and the Power Statistics are
sourced and processed separately. Monthly aggregated load data are available under the
titles “Monthly consumption”20 (Data Portal) and ”Monthly Domestic Values”21 (Power Sta-
tistics). A second source of load data is Eurostat’s “Supply of electricity - monthly data
(nrg_105m)”22. These sources differ in two important aspects:
• TP data are delivered close to real time (one hour after the operating period),
while the other sources undergo revisions.
• TP data require total load, while the Data Portal/Power Statistics may report a share
of the total, as indicated by the possibility to report a country-specific “Representa-
tivity Factor”.
The first difference implies that we can expect random deviations between TP and the other
sources resulting from close-to-real-time estimation errors. These errors should not be
systematic, i.e. they should average out over longer time periods. The second difference
implies that the Data Portal/Power Statistics data and Eurostat data in those countries that
have a Representativity Factor smaller than 100% could be smaller than TP values. The
reported Representativity Factors23 are always 100% for all countries, however; thus,
these sources should be reporting total load.
In almost all countries we find significant, persistent deviations among all three sources;
in most cases, TP numbers are smaller than the other statistics (Figure 14). Deviations in
the double-digit percentage range are not uncommon. Moreover, deviations vary among
countries: in Slovakia, TP load is somewhat larger than both other sources while in Austria,
it is about 20% smaller.24 This suggests that the deviations are not due to a difference in
data definition among sources.
20 https://www.entsoe.eu/data/data-portal/consumption/Pages/default.aspx 21 https://www.entsoe.eu/data/statistics/Pages/default.aspx 22 http://appsso.eurostat.ec.europa.eu/nui/show.do?dataset=nrg_105m. Eurostat does not report electricity
consumption explicitly: as we learned upon enquiring with their help desk, Eurostat explained that in their Elec-
tricity the data item “Gross inland consumption” should in fact be read as net imports. Assuming that electricity
consumption equals gross generation + imports, we thus calculate electricity consumption by adding “Gross
electricity generation - Total” + “Gross inland consumption”. 23 https://www.entsoe.eu/data/statistics/Pages/monthly_domestic_values.aspx 24 For the Austrian case, we were informed by ENTSO-E that “the reason for the deviation in Austria results
from different definitions of the respective sources. On the Transparency Platform, Total Load includes only
data of the control area APG. Instead, the values on Power Statistics include data for the whole country (also
including data of large industry with own production units and railroad consumption, which are not directly con-
nected to the grid of APG).”

35
Figure 14. Deviation of load between TP and other sources.
Key point: “Actual Total Load” (6.1.A) values are inconsistent with other sources’
load data, including ENTSO-E Power Statistics. The deviations are often signifi-
cant in size (>10%).
Notes: 2015–16. Blue bars are calculated as “Eurostat minus TP” and orange bars as “Data Portal/Power Statis-
tics minus TP”.
Figure 15 gives more detail for selected countries on a month-by-month basis (Eurostat
data is not available at a finer granularity). The level of consistency as well as the pattern
of deviations differ among countries. This suggests that the underlying problems are dif-
ferent depending on the country. TP data for Austria are different in level and pattern from
other sources in 2015. They seem to match the data from other sources more since early
2016, when the Austrian TSO APG improved the algorithm for calculating the total load
data. In Germany, the difference between TP data and other sources is sometimes small
(August 2015) and sometimes large (January and December 2016). Consistency does not
seem to improve over time. TP data for France is similar (albeit not identical) to Power
Statistics, while Eurostat is larger at a quite constant margin. This pattern suggests that
Eurostat applies a different data definition, but both definitions seem to be applied con-
sistently. TP data for Italy are different in level and pattern from other sources. Denmark
is a case with dramatic and fluctuating deviations over time. The inconsistencies in the
Netherlands seem to have improved since 2015.
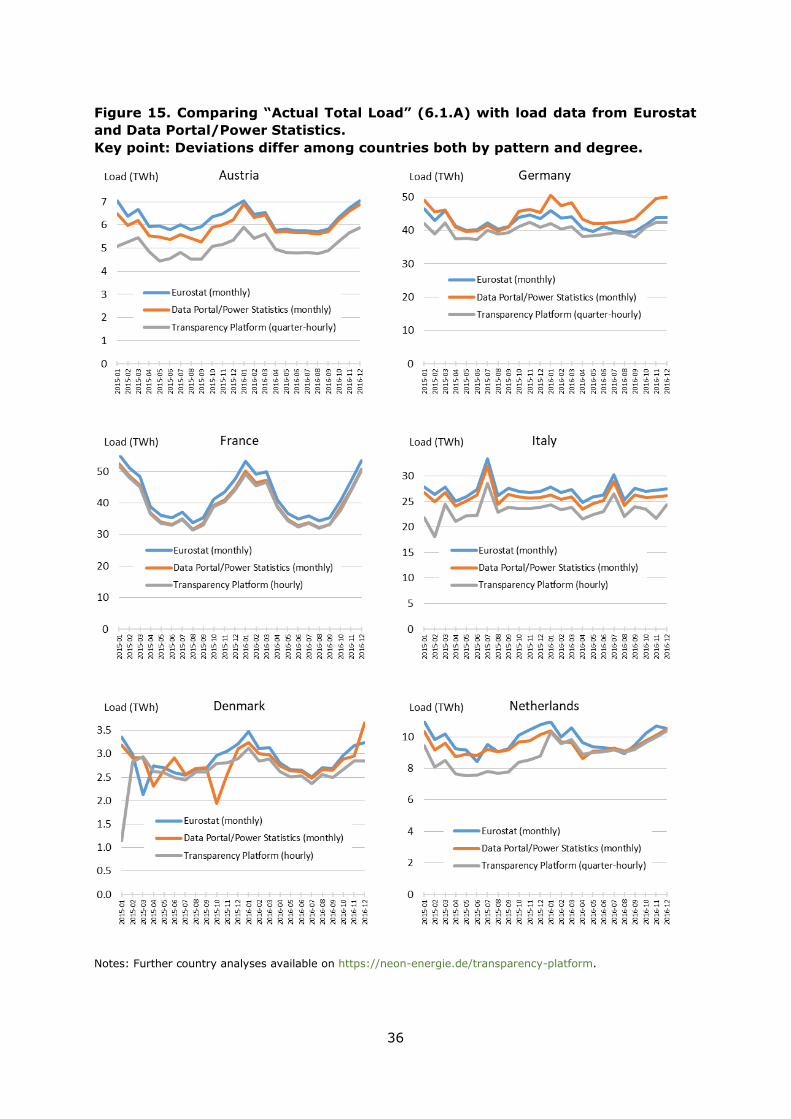
36
Figure 15. Comparing “Actual Total Load” (6.1.A) with load data from Eurostat
and Data Portal/Power Statistics.
Key point: Deviations differ among countries both by pattern and degree.
Notes: Further country analyses available on https://neon-energie.de/transparency-platform.

37
Generation
We compare the data item “Aggregated Generation per Type” (16.1.B&C) to other sources
of generation data: for Germany, we compare all technologies to data published by two
official German sources. To get a comparable dataset for yearly generation, net generation
is taken from the German Federal Statistical Office (Destatis)25. Generation data by wind
and solar and most biomass units are missing in this dataset since it only includes gener-
ation by units with an installed capacity >= 1 MW26. For these production types, gross
data, which includes consumption by power plants, are taken from AG Energiebilanzen27.
Since differences between net and gross generation are minor for renewables, this is
deemed a reasonable approach.
Figure 16 shows the result of the comparison. We find differences between the two datasets
for most production types. Differences for individual production types could be due to di-
verging rules on assigning individual power plants to production types but should cancel
each other out when aggregating all production types. This is partly the case, the most
significant example being fossil gas: on the TP 15 TWh are reported for fossil gas—67%
less than the 47 TWh reported by Destatis. This is counteracted by a larger value for
“Other” generation on the TP (39 TWh compared to 1 TWh on Destatis). Combined cycle
gas turbines are reported as “Other” generation on the TP, explaining this discrepancy (see
Section 4.2.4). For hard coal, the TP reports 78 TWh compared to 100 TWh on Destatis.
Differences for renewable and nuclear generation are minor, with practically identical re-
ported generation for wind and solar. When summing up all technologies, however, total
generation as reported by Destatis is higher by 29 TWh than the TP data (551 TWh - 522
TWh), the reason for which is unclear.
25 https://www-genesis.destatis.de/genesis/online/data?operation=abruftabelleAbrufen&selectionname=43311-
0001 26 https://www.destatis.de/DE/Publikationen/Qualitaetsberichte/Energie/MBElektrizitaetsWaermeerzeugung-
Stromerzeugungsanl066K.pdf?__blob=publicationFile#page=4 27 http://www.ag-energiebilanzen.de/index.php?article_id=29&fileName=20170811_brd_stromerzeugung1990-
2016.xlsx
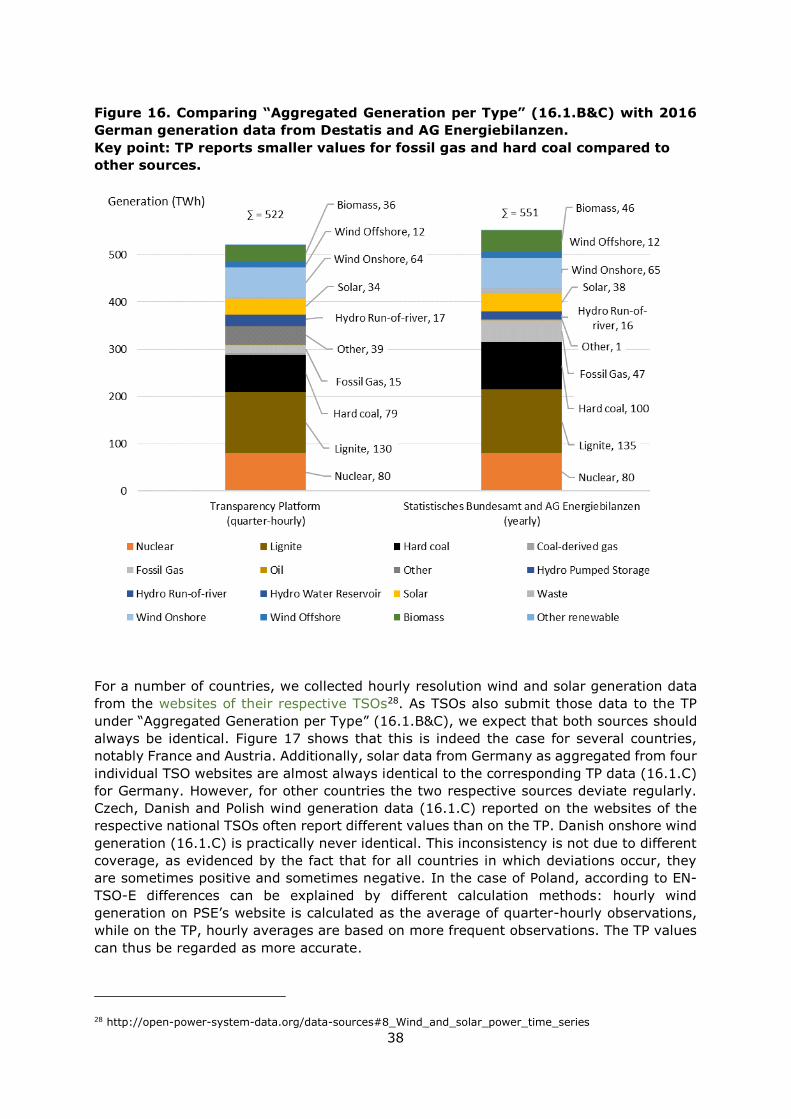
38
Figure 16. Comparing “Aggregated Generation per Type” (16.1.B&C) with 2016
German generation data from Destatis and AG Energiebilanzen.
Key point: TP reports smaller values for fossil gas and hard coal compared to
other sources.
For a number of countries, we collected hourly resolution wind and solar generation data
from the websites of their respective TSOs28. As TSOs also submit those data to the TP
under “Aggregated Generation per Type” (16.1.B&C), we expect that both sources should
always be identical. Figure 17 shows that this is indeed the case for several countries,
notably France and Austria. Additionally, solar data from Germany as aggregated from four
individual TSO websites are almost always identical to the corresponding TP data (16.1.C)
for Germany. However, for other countries the two respective sources deviate regularly.
Czech, Danish and Polish wind generation data (16.1.C) reported on the websites of the
respective national TSOs often report different values than on the TP. Danish onshore wind
generation (16.1.C) is practically never identical. This inconsistency is not due to different
coverage, as evidenced by the fact that for all countries in which deviations occur, they
are sometimes positive and sometimes negative. In the case of Poland, according to EN-
TSO-E differences can be explained by different calculation methods: hourly wind
generation on PSE’s website is calculated as the average of quarter-hourly observations,
while on the TP, hourly averages are based on more frequent observations. The TP values
can thus be regarded as more accurate.
28 http://open-power-system-data.org/data-sources#8_Wind_and_solar_power_time_series
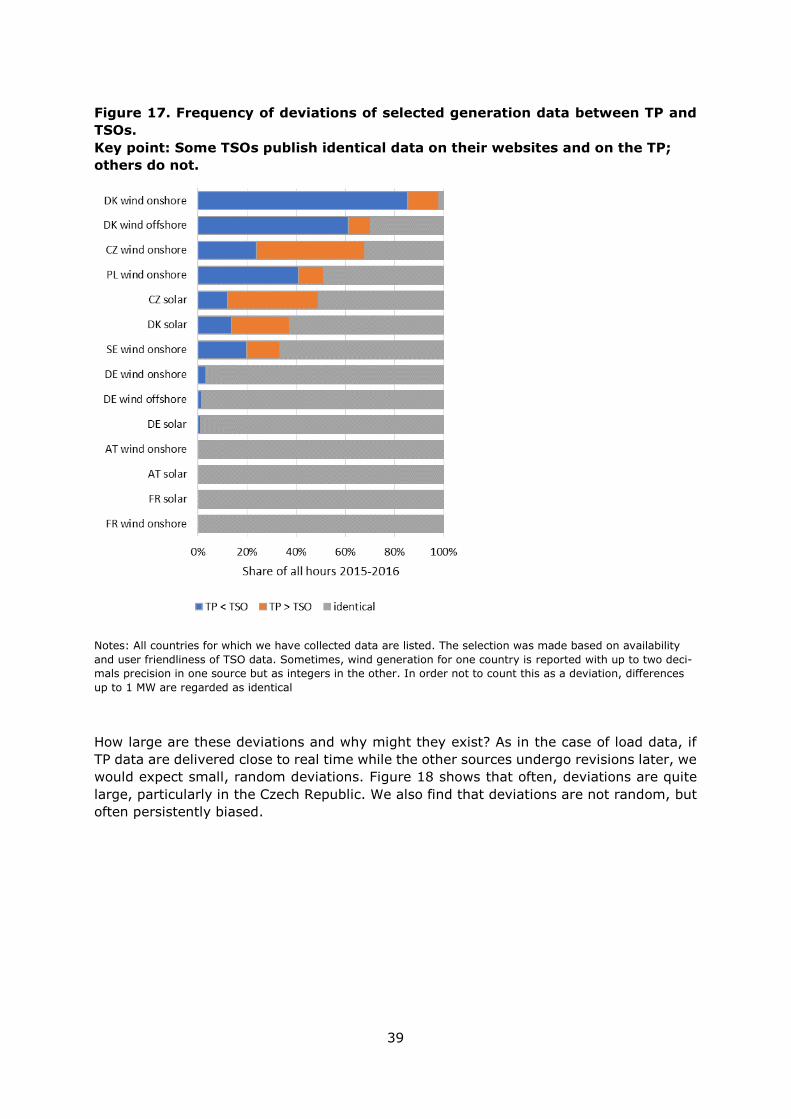
39
Figure 17. Frequency of deviations of selected generation data between TP and
TSOs.
Key point: Some TSOs publish identical data on their websites and on the TP;
others do not.
Notes: All countries for which we have collected data are listed. The selection was made based on availability
and user friendliness of TSO data. Sometimes, wind generation for one country is reported with up to two deci-
mals precision in one source but as integers in the other. In order not to count this as a deviation, differences
up to 1 MW are regarded as identical
How large are these deviations and why might they exist? As in the case of load data, if
TP data are delivered close to real time while the other sources undergo revisions later, we
would expect small, random deviations. Figure 18 shows that often, deviations are quite
large, particularly in the Czech Republic. We also find that deviations are not random, but
often persistently biased.
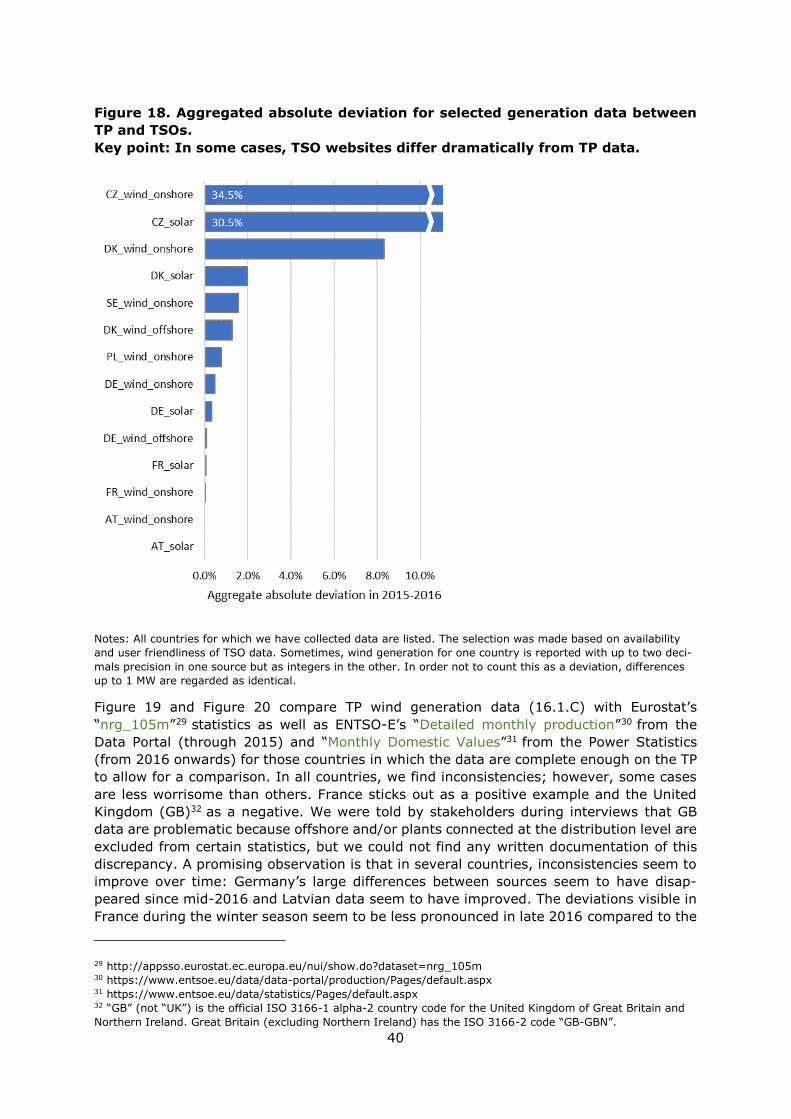
40
Figure 18. Aggregated absolute deviation for selected generation data between
TP and TSOs.
Key point: In some cases, TSO websites differ dramatically from TP data.
Notes: All countries for which we have collected data are listed. The selection was made based on availability
and user friendliness of TSO data. Sometimes, wind generation for one country is reported with up to two deci-
mals precision in one source but as integers in the other. In order not to count this as a deviation, differences
up to 1 MW are regarded as identical.
Figure 19 and Figure 20 compare TP wind generation data (16.1.C) with Eurostat’s
“nrg_105m”29 statistics as well as ENTSO-E’s “Detailed monthly production”30 from the
Data Portal (through 2015) and “Monthly Domestic Values”31 from the Power Statistics
(from 2016 onwards) for those countries in which the data are complete enough on the TP
to allow for a comparison. In all countries, we find inconsistencies; however, some cases
are less worrisome than others. France sticks out as a positive example and the United
Kingdom (GB)32 as a negative. We were told by stakeholders during interviews that GB
data are problematic because offshore and/or plants connected at the distribution level are
excluded from certain statistics, but we could not find any written documentation of this
discrepancy. A promising observation is that in several countries, inconsistencies seem to
improve over time: Germany’s large differences between sources seem to have disap-
peared since mid-2016 and Latvian data seem to have improved. The deviations visible in
France during the winter season seem to be less pronounced in late 2016 compared to the
29 http://appsso.eurostat.ec.europa.eu/nui/show.do?dataset=nrg_105m 30 https://www.entsoe.eu/data/data-portal/production/Pages/default.aspx 31 https://www.entsoe.eu/data/statistics/Pages/default.aspx 32 “GB” (not “UK”) is the official ISO 3166-1 alpha-2 country code for the United Kingdom of Great Britain and
Northern Ireland. Great Britain (excluding Northern Ireland) has the ISO 3166-2 code “GB-GBN”.

41
years before. A reporting bug seems to have shifted Dutch Power Statistics data by one
month in 2015, an error that did not reoccur in 2016. It should be noted, however, that
some users require long time series of data, such that the stark inconsistencies found
during 2015 remain an issue for them.
Figure 19. Deviation of wind generation between TP and other sources.
Key point: TP wind generation data (16.1.C) often deviate significantly from
other sources (>10%), including ENTSO-E Power Statistics.
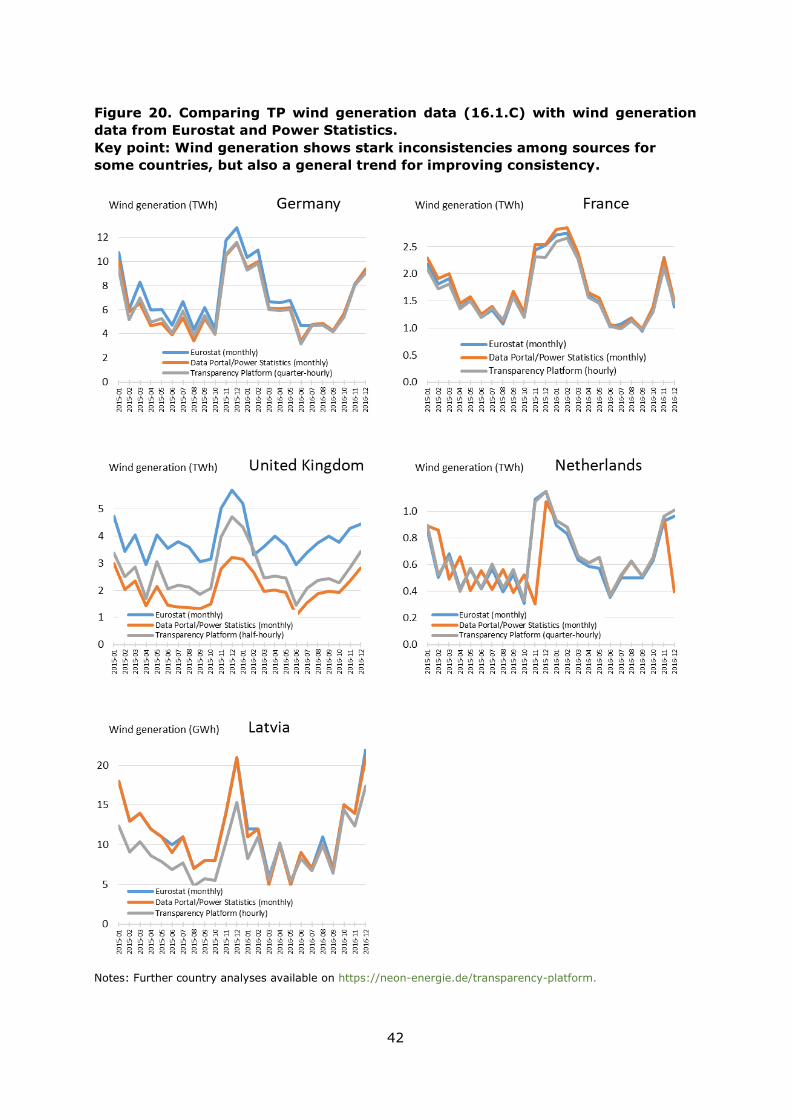
42
Figure 20. Comparing TP wind generation data (16.1.C) with wind generation
data from Eurostat and Power Statistics.
Key point: Wind generation shows stark inconsistencies among sources for
some countries, but also a general trend for improving consistency.
Notes: Further country analyses available on https://neon-energie.de/transparency-platform.
43
4.2.2. Other accuracy issues
In some cases, inconsistencies can be identified by comparing with the TSO data or with
data from a vendor. Both the ETUG summary of user feedback and many of the experts
we interviewed identified national TSO data as often conflicting with values reported on
the TP. However, in other cases, the only source for the data is ENTSO-E, and while data
users may be sceptical of data accuracy they also cannot verify values.
In our interviews and user survey, users mentioned issues with data in the Generation and
Load data domains. Reported inaccuracies included values for “Aggregated Generation per
Type” (16.1.B&C), especially in the Netherlands, and out-of-service production units in
“Installed generation capacity per unit” (14.1.B) not labelled as such. Other issues included
implausible generation values, including solar production (16.1.C) at night and values re-
ported in “Day-ahead Generation Forecasts for Wind and Solar” (14.1.D) identical to those
reported in “Aggregated Generation per Type” (16.1.B&C) for wind and solar. Users also
expect the sum of generation (16.1.A/16.1.B&C) to correspond with the sum of “Actual
Total Load” (6.1.A) and “Scheduled Commercial Exchanges” (12.1.F), which does not seem
to be the case.
The ETUG user survey also identifies issues with data from Switzerland, Germany, France,
the Netherlands and the United Kingdom and border data for Austria–Germany, Switzer-
land–France, Germany–Switzerland, Germany–Czech Republic, Poland–Czech Republic
and United Kingdom–Ireland, but it remains unclear whether these geographic entities face
larger inaccuracy problems than others. Issues reported to us include:
Generation
• Some units that are out of service have not been removed from “Installed genera-
tion capacity per unit” (14.1.B); these data should be preserved for historical
reasons but should be labelled as such. [12] [14]
• “Actual Generation per Generation Unit” (16.1.A) does not add up to the values
presented in “Aggregated Generation per Type” (16.1.B&C). [survey]
• Users expect the sum of generation (16.1.A/16.1.B&C) to correspond with the
sum of “Actual Total Load” (6.1.A) and “Scheduled Commercial Exchanges”
(12.1.F), which does not seem to be the case. [survey]
• French wind and solar generation (16.1.C) and capacity (14.1.A) appear to be in-
accurate. [survey]
• There have been observed instances of solar production (16.1.C) during night-
time hours in France. [3]
• Dutch wind generation data (16.1.C) are identical to Dutch wind forecast data
(14.1.D), which is implausible. [2]
• Dutch “Aggregated Generation per Type” (16.1.B&C) appears to be inaccurate.
[1] [2] [15] [survey twice]
• Certain plants in the Netherlands have poor data. [2]
• “Aggregated Generation per Type” (16.1.B&C) in Romania appears implausible.
[survey]
• Concentrated solar power and photovoltaics generation (16.1.C) are reported in the
same category, which is allowed according to the Regulation, but impractical for
analyses.
Load
• Some national “Actual Total Load” (6.1.A) time series include implausible values.
[survey]
• The German “Actual Total Load” (6.1.A) data should be approximately 9 GW
higher. [survey]
44
• Dutch “Day-ahead Total Load Forecast” (6.1.B) is 10x higher than “Actual Total
Load” (6.1.A).
4.2.3. Reporting inaccuracies and public documentation of issues
As in the case of completeness, users are not informed about inaccuracies, nor can they
inform other users if they identify problematic data. Additionally, there is no established
procedure for addressing inconsistencies between the MoP and the TP website. All requests
are routed through the service desk and are not published.
4.2.4. Inaccuracy in data definitions
Regulation 543/2013 specifies data definitions, but at a relatively high level. More details
are given in the Detailed Data Descriptions, which are an annex to the MoP. However,
these leave room for interpretation. Additionally, since they are an annex to the MoP, any
changes to the data definitions require the same (lengthy) procedure as changing the MoP,
even if they only serve as clarification.
These unclear data definitions lead to inaccurate data with subsequent confusion on the
user side along with inconsistent interpretation by Data Providers. Users we contacted had
issues with definitions, including of forecast net transfer capacity, a lack of standardization
among TSOs of data definitions and opaque measurement and estimation methodologies.
One example is the case of “Aggregated Generation per Type” (16.1.B&C), in which gen-
eration by combined cycle natural gas power plants is not reported under “Fossil Gas” but
under “Other”. However, users only learned about this after inquiring at the service desk33
as it is not mentioned in the documentation files. Users pointed out the following issues:
General
• Data are in general not well defined. [4]
• It is unclear which value hourly data are reporting; for example, is it the value at
the start of the hour, the end of the hour or an average value of minute data?
[survey]
• Each TSO does what it feels is right when it reports data with no enforced stand-
ardization. [3]
Load
• It is hard to find a good, correct definition of “total load”. [9] [16] [survey]
• For the “Actual Total Load” (6.1.A) it is not documented which grid level the load is
based on or whether generation from power plants connected below the high-volt-
age grid (i.e. renewables) is deducted, which is relevant to Germany. [1] [19]
Generation
• There is a general lack of metadata on generation plants. [1] [5] [survey]
• Different TSOs employ different definitions of generation and production units, lead-
ing to inconsistencies in the “Installed generation capacity per unit” (14.1.B) and
the generation outages (15.1.A–D). This is due to vague definitions in the Detailed
Data Descriptions stating that a generation unit means “a single electricity genera-
tor belonging to a production unit” and a “production unit is understood as a facility
for generation of electricity made up of a single generation unit or of an aggregation
of generation units”. The definition of production units leaves open whether the
33 From an email from the ENTSO-E service desk, Jul 4, 15:02 CEST:
”Other means other conventional and in our case it includes combined cycle gas turbines.
Definition: Others = Total generation – (a+b+c)
a) Renewable energy (based on projections and forcasts [sic]).
b) Power Stations directly connected to the High-Voltage Grid (Measurements).
c) Fossil Coal-derived gas (Schedule based, no measures)”
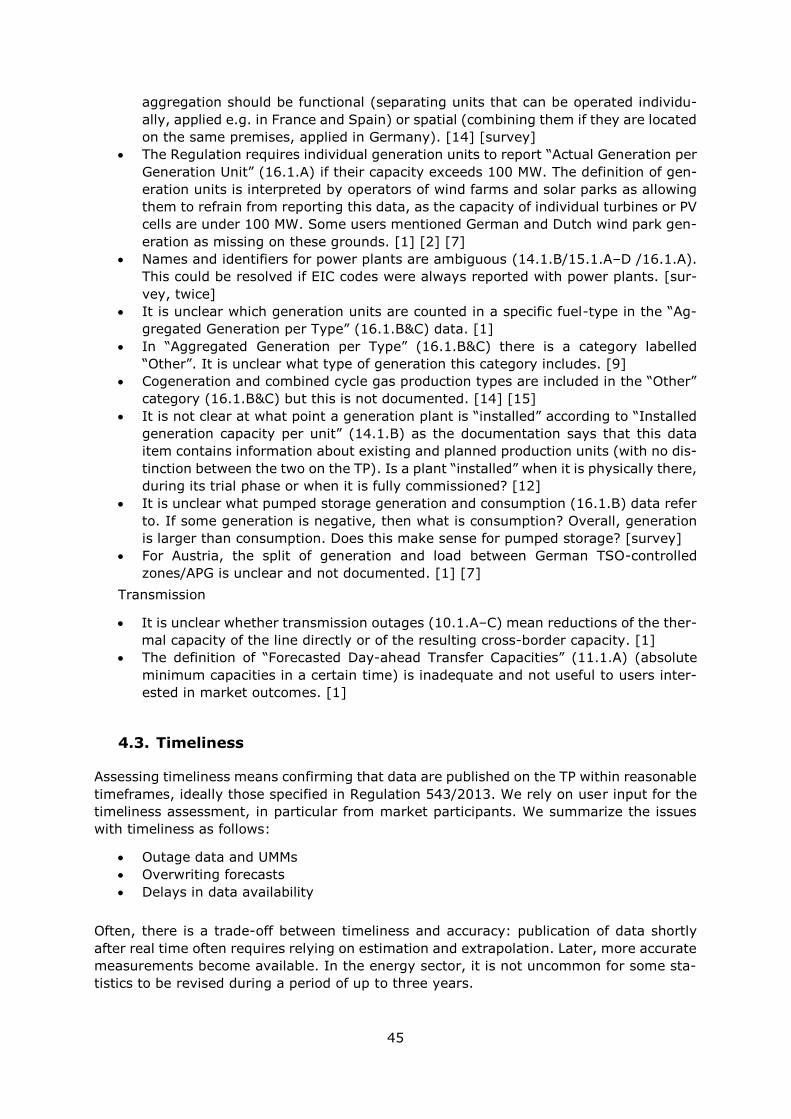
45
aggregation should be functional (separating units that can be operated individu-
ally, applied e.g. in France and Spain) or spatial (combining them if they are located
on the same premises, applied in Germany). [14] [survey]
• The Regulation requires individual generation units to report “Actual Generation per
Generation Unit” (16.1.A) if their capacity exceeds 100 MW. The definition of gen-
eration units is interpreted by operators of wind farms and solar parks as allowing
them to refrain from reporting this data, as the capacity of individual turbines or PV
cells are under 100 MW. Some users mentioned German and Dutch wind park gen-
eration as missing on these grounds. [1] [2] [7]
• Names and identifiers for power plants are ambiguous (14.1.B/15.1.A–D /16.1.A).
This could be resolved if EIC codes were always reported with power plants. [sur-
vey, twice]
• It is unclear which generation units are counted in a specific fuel-type in the “Ag-
gregated Generation per Type” (16.1.B&C) data. [1]
• In “Aggregated Generation per Type” (16.1.B&C) there is a category labelled
“Other”. It is unclear what type of generation this category includes. [9]
• Cogeneration and combined cycle gas production types are included in the “Other”
category (16.1.B&C) but this is not documented. [14] [15]
• It is not clear at what point a generation plant is “installed” according to “Installed
generation capacity per unit” (14.1.B) as the documentation says that this data
item contains information about existing and planned production units (with no dis-
tinction between the two on the TP). Is a plant “installed” when it is physically there,
during its trial phase or when it is fully commissioned? [12]
• It is unclear what pumped storage generation and consumption (16.1.B) data refer
to. If some generation is negative, then what is consumption? Overall, generation
is larger than consumption. Does this make sense for pumped storage? [survey]
• For Austria, the split of generation and load between German TSO-controlled
zones/APG is unclear and not documented. [1] [7]
Transmission
• It is unclear whether transmission outages (10.1.A–C) mean reductions of the ther-
mal capacity of the line directly or of the resulting cross-border capacity. [1]
• The definition of “Forecasted Day-ahead Transfer Capacities” (11.1.A) (absolute
minimum capacities in a certain time) is inadequate and not useful to users inter-
ested in market outcomes. [1]
4.3. Timeliness
Assessing timeliness means confirming that data are published on the TP within reasonable
timeframes, ideally those specified in Regulation 543/2013. We rely on user input for the
timeliness assessment, in particular from market participants. We summarize the issues
with timeliness as follows:
• Outage data and UMMs
• Overwriting forecasts
• Delays in data availability
Often, there is a trade-off between timeliness and accuracy: publication of data shortly
after real time often requires relying on estimation and extrapolation. Later, more accurate
measurements become available. In the energy sector, it is not uncommon for some sta-
tistics to be revised during a period of up to three years.
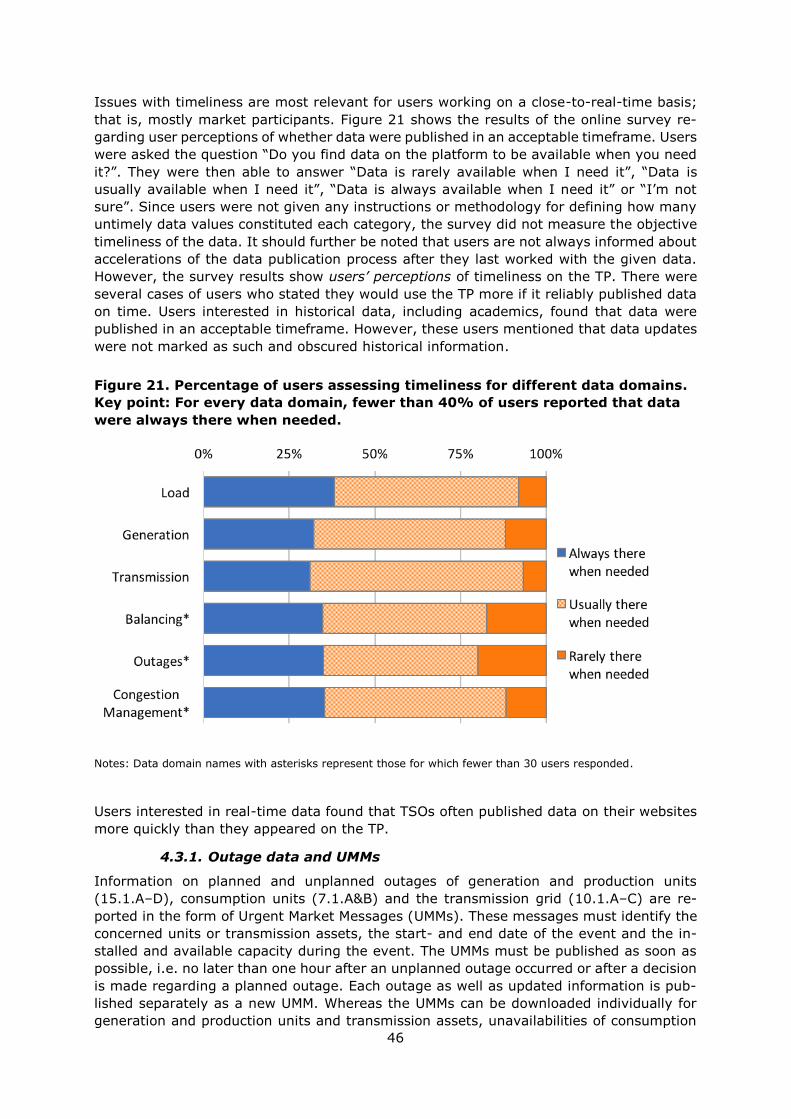
46
Issues with timeliness are most relevant for users working on a close-to-real-time basis;
that is, mostly market participants. Figure 21 shows the results of the online survey re-
garding user perceptions of whether data were published in an acceptable timeframe. Users
were asked the question “Do you find data on the platform to be available when you need
it?”. They were then able to answer “Data is rarely available when I need it”, “Data is
usually available when I need it”, “Data is always available when I need it” or “I’m not
sure”. Since users were not given any instructions or methodology for defining how many
untimely data values constituted each category, the survey did not measure the objective
timeliness of the data. It should further be noted that users are not always informed about
accelerations of the data publication process after they last worked with the given data.
However, the survey results show users’ perceptions of timeliness on the TP. There were
several cases of users who stated they would use the TP more if it reliably published data
on time. Users interested in historical data, including academics, found that data were
published in an acceptable timeframe. However, these users mentioned that data updates
were not marked as such and obscured historical information.
Figure 21. Percentage of users assessing timeliness for different data domains.
Key point: For every data domain, fewer than 40% of users reported that data
were always there when needed.
Notes: Data domain names with asterisks represent those for which fewer than 30 users responded.
Users interested in real-time data found that TSOs often published data on their websites
more quickly than they appeared on the TP.
4.3.1. Outage data and UMMs
Information on planned and unplanned outages of generation and production units
(15.1.A–D), consumption units (7.1.A&B) and the transmission grid (10.1.A–C) are re-
ported in the form of Urgent Market Messages (UMMs). These messages must identify the
concerned units or transmission assets, the start- and end date of the event and the in-
stalled and available capacity during the event. The UMMs must be published as soon as
possible, i.e. no later than one hour after an unplanned outage occurred or after a decision
is made regarding a planned outage. Each outage as well as updated information is pub-
lished separately as a new UMM. Whereas the UMMs can be downloaded individually for
generation and production units and transmission assets, unavailabilities of consumption

47
units are aggregated by bidding zone or control area. Most market participants whom we
interviewed identified UMMs as an area of concern for a number of reasons: many users
are missing a versioning scheme or timestamp that would allow coherently connecting the
individual UMMs. There is no functionality to allow generation plants to combine infor-
mation on a single power plant into one “profile” or message. Furthermore, users were
concerned about duplicate UMMs reported for single generation facilities, inconsistencies
when trying to download UMM information via API and FTP, slow reporting times on the
part of power plants, inconsistent information compared to other data sources, information
that was not provided in a useful order and country-specific issues in Belgium, Germany,
the UK, Italy and the Netherlands.
Interviewees have reported the following specific issues:
• There are often duplicate UMMs reported with identical values. [1] [14] [survey]
• It is impossible to get an overview of all outages for a single plant like on the
Nordpool REMIT UMM website. [14]
• UMM data are not always in the correct chronological order. [2] [14]
• It is unclear whether a message has been updated. [19]
• Old versions of outages are not available. [survey]
• Sometimes UMMs disappear from the GUI without an explanation. [19]
• From UMM data it is easy to get the impression that a plant is running when it is
not and vice versa. [2]
• The API allows downloading up to 200 UMMs at once, which at times is exceeded
even in an hourly period. [14]
• The API does not return “withdrawn” outages. [14]
• Outages of generation units (15.1.A&C) that are planned by the operating com-
pany within a time window (e.g. summer maintenance) may be known to the
operator for some time, but are only published once they are assigned a certain
date. [1]
• Outage data do not show the latest information available from TSOs. [survey]
• In the past, “Changes in Actual Availability in the Transmission Grid” (10.1.B) and
“Changes in Actual Availability of Generation Units” (15.1.B) did not always match
other data sources, such as RTE and EEX. [1]
• There is missing outage information compared to REMIT data from RTE. [survey]
• “Changes in Actual Availability in the Transmission Grid” (10.1.B) in the UK and
Belgium reported on other websites are not reported on the TP. [14] [survey,
twice]
• “Changes in Actual Availability in the Transmission Grid” (10.1.B) are reported for
a subset of inner-German lines, especially between Amprion and other German
TSOs. [1]
• “Countertrading” (13.1.B) is sometimes reported as “Changes in Actual Availabil-
ity in the Transmission Grid” (10.1.B), as in the case of the Baltic Cable. [14]
• Outage data are incomplete for Italy [14] and the Netherlands. [1]
• Sometimes the start- and endpoint of an outage incident are mixed up, resulting
in negative durations of some outages. [21]
• For some outages of generation and production units (15.1.A-D) the available ca-
pacity reported during an outage is the same or higher than the installed capacity.
[21]

48
Publication requirements for outages and other UMMs stem not only from the Transparency
Regulation but also from Regulation (EU) No. 1227/2011 (REMIT)34. As a consequence,
UMMs are reported not only on the TP, but also on so-called Inside Information Platforms35
(e.g. EEX Transparency or Nordpool REMIT UMM). Some market participants expressed
dissatisfaction that the TP is not intended to be an inside information platform.
4.3.2. Overwriting forecasts
Another issue mentioned by users is that data are overwritten by updates even though the
historical values also may be relevant for analysis. Users complained of historical data
being overwritten by updates without an indication of whether there was an update, when
it was made and where historical data would be available. Although historical data values
must be archived according to Article 3.1 of Regulation 543/2013, they are not accessible
on the TP for users. One example, as identified in a presentation entitled “Manual of Pro-
cedures Revision” given at an ETUG meeting, is “Day-ahead Generation Forecasts for Wind
and Solar” (14.1.D). As it exists now, day-ahead 18:00 forecast values are overwritten by
intraday 8:00 and then possibly more recent forecasts.
In its summary of user feedback to ETUG, ENTSO-E identified not only the overwriting as
an issue but also that no indication was given on the TP of such revisions, a comment
repeated by our interviewees. The most prevalent concern was that day-ahead “Scheduled
Commercial Exchanges” (12.1.F) are not reliably available as they are overwritten with
intraday scheduled flows instead of reporting day-ahead and intraday values separately as
had been the case prior to the introduction of the TP in 2015. This reportedly will be recti-
fied in the latest MoP update.
4.3.3. Delays in data availability
In our interviews, users reported examples of deadlines that were not adhered to:
• Hourly “Actual Generation per Generation Unit” (16.1.A) data are not updated as
soon as one would expect. [11]
• “Actual Generation per Generation Unit” (16.1.A) and some “Aggregated Genera-
tion per Type” (16.1.B&C) data are delayed. [survey]
• On August 10, 2017, Belgian generation data (16.1) were about 10 hours old.
[15]
• On August 10, 2017, Bulgarian generation data (16.1) were delayed more than a
day. [15]
• As of August 10, 2017, generation data (16.1) for Ireland had been missing for
about a week. [15]
• The Netherlands is always delayed in the first hour of the day. [3]
• A gap in Dutch generation data (16.1.B&C) reported on June 24, 2017 was not
fixed until July 13, with no generation data in the interim. [2]
• ENBW is not updating the “Week-ahead Total Load Forecast” (6.1.C). [survey]
4.4. User friendliness
User friendliness is different from completeness, accuracy and timeliness in two ways: first,
it concerns the platform itself, rather than the data contained in it. Second, it is more
subjective and its assessment cannot be accomplished by a statistical analysis of the data.
Nevertheless, through our own experience during this and previous research and consult-
ing projects, through reviewing assessments and through the online survey and the
34 http://data.europa.eu/eli/reg/2011/1227/oj 35 https://www.acer-remit.eu/portal/list-inside-platforms

49
interviews we conducted, we are confident that we are able to report a representative and
robust picture of which aspects of the TP users find satisfying and where they see the need
for improvements. We have categorized comments regarding user friendliness into six
broad categories:
• Website and GUI, including ease of finding data, data presentation and ease of ac-
cessing data for downloads;
• Automatic downloads, including useful documentation and reliable access;
• Data files;
• Displaying data availability, including why data is unavailable;
• Data documentation and
• User support.
Of these, data documentation received the largest number of critical comments.
4.4.1. Website and GUI
Navigating the website
According to the ETUG user survey, about 71% of TP users find navigating the website at
least moderately easy. Our own survey revealed similar results; as displayed in Figure 22,
users rated finding data on the TP an average of about 3.1 (1–5 scale; 5 intuitive). We find
the grouping of data items on the website to be not always intuitive for first-time users;
one example is “Day-ahead Prices” (12.1.D), which is categorized under “Transmission”.
Figure 22. Number of users rating intuitiveness of finding data on the TP.
Key point: Few users report finding data on the TP completely intuitive but on
average, users find it fairly intuitive.
Notes: Scale of 1-5.
Response time and download speed
Several users, both in interviews and via the online survey, reported slow server response
and frequent time out errors, an issue also reported by the ETUG user survey. This is not
only an issue of convenience, but can jeopardize functionality: if the TP is unstable, it is
not always possible to scrape data as soon as it is posted.

50
Figure 23. Number of users rating speed of server response times.
Key point: Users report server response to be slow.
Notes: Scale of 1-5.
Data selection and filtering
Users find it difficult to download the exact data they want. Several users would like more
and better implemented options to display and filter subsets of the data, an issue also
reported by the ETUG user survey. A related need is the possibility to download data from
multiple geographic entities at once rather than being restricted to one at a time—the lack
of this option is an obstacle for users who must rely on the GUI to download larger amounts
of data. We received the following comments:
• To filter for certain production types under “Aggregated Generation per Type”
(16.1.B&C), users must tick off all other options. [3] [14] [survey]
• Accessing the data the user wants requires too many clicks. [18] [19]
• Downloading “Aggregated Generation per Type” (16.1.B&C) by country requires
downloading separate files for each country containing all generation types. [5]
[survey]
• There is no filtering option for headers on the GUI. [4]
• It is difficult to download more than one day at a time. [5]
• It would be useful to have a specific webpage for each country. [19]
• It is unintuitive that the GUI always resets the view to be of the bidding zone, even
when the user was looking at data by country before. [19]
• For one-off analysis via the GUI the file formats and splits are quite often inconven-
ient without enough metadata. [1]
Other website issues
When navigating the website, users are often presented with tables not showing any val-
ues. The reason is not necessarily that data are missing: the GUI allows selecting all sorts
of combinations of data item, geographical entity, point in time and possibly other (data
item-specific) criteria for many of which data are not expected. This seems to be the case
for many of the default views shown upon first selecting a data item. Another issue stems
from the fact that users must log in before being able to download data from the GUI: if

51
they first navigate to the data they are interested in and then decide to log in, they are
returned to the homepage and must find the previously accessed data item once again.
Users also suggested making the website more visually appealing and graphically oriented;
one best-practice example cited in the survey was the Fraunhofer ISE website Energy
Charts36.
4.4.2. Automatic download
The web interface (GUI) is one out of six ways to download data. Expert users who have
implemented access via FTP or the Restful API expressed satisfaction with these two down-
load options—one interviewee said the Restful API “is what works best about the TP
website.” [2]
However, users with less experience or without an in-house IT department supporting
them often had trouble implementing automatic access. Maybe more problematically,
many users are not aware that these options exist, likely because automatic download
options are mentioned only in one of several FAQ collections on different subdomains of
the ENTSO-E website. In the case of the FTP, ENTSO-E does not publicize it as a download
method because it is in a test phase.
In our user survey, users rated the usefulness of the GUI on average about 3.3, the FTP
on average about 4.1 and the Restful API on average about 3.9 (1–5 scale; 5 very useful).
Figure 24 displays how users rated these three download options. FTP and API download
options were reported as very useful by nearly half of users. However, fewer users were
familiar with FTP and API options than GUI.
Figure 24. Percentage of users rating usefulness of download options.
Key point: FTP and API download options were reported as very useful by
nearly half of users.
Notes: Scale of 1–5. The asterisk indicates that fewer than 30 users responded to the question regarding the
API download option.
36 https://energy-charts.de/
52
The data websites Quandl37 and Kaggle38 were mentioned in the survey as best-practice
examples of platforms with a focus on data integration, automation and speedy processing.
RTE and Nordpool were also mentioned as positive examples. Overall, users were happy
with FTP and API download options, although there were issues including unreliable avail-
ability of all data items and an inconvenient process for downloading updated values via
API, overly technical API documentation and missing information via FTP. Here are the
comments we received:
Praise
• The technical side does not create issues, as there are a lot of possibilities for down-
load available. [4]
• The Restful API works properly and waiting response times are OK. [3]
• The Restful API is good. [2]
• The FTP solution is the best source of power system time series data available. [7]
Problems with the API and suggestions for improvements
• Some users have been unable to access certain data items via Restful API. [1] [19]
• To receive any updates via the API, one must re-download all files. [12] [14]
• The API does not include a timestamp of data delivery. [12]
• It would be nice to receive a code snippet after downloading data to easily access
the same parameters on the API. [17]
• The Restful API is inefficient, as it can be slow at times, not allowing market partic-
ipants to update their databases as often as required. [survey]
API documentation
• The API documentation could be improved. There is a high barrier of entry for those
who want data but do not have a deep technical knowledge and understanding of
the subject. [15]
• Documentation for the API is too long. [17]
Problems with FTP and suggestions for improvements
• CSV data downloaded via the FTP do not show EIC codes; without knowing the EIC,
it is impossible to perform requests through the Restful API. [7] [14]
• When downloading files via the FTP, updated data are included without being clearly
labelled as such, which is confusing. Since all files are recreated once a day, it is
not possible to filter for updated data. [12] [20] [survey]
• Allow XML files to be downloaded via FTP. [survey]
• “Changes in Actual Availability in the Transmission Grid” (10.1.B) are not available
via the FTP server.
4.4.3. Issues with data files
Users are split in their opinion on XML files; some find them useful while others find them
inconvenient. For all file types, file-naming conventions could be improved, which today
include “spaces and uppercase and lower-case letters all in the mix”, as one survey re-
spondent wrote. It was also suggested to allow CSV users to choose date format, field
separator and time period. When downloading CSV or XLSX data, data in 15-min, 30-min
and 60-min resolutions are provided in one single file, which can be burdensome to work
with. [11] [14]
37 https://www.quandl.com/ 38 https://www.kaggle.com/datasets

53
4.4.4. Displaying data availability and “master data”
Users noted in the ETUG survey, “as there is no ‘central area/data matrix’, [it takes] time
to click through to see whether a data item is available in a given area.” This might be the
most limiting shortcoming for first-time users: there is no easy way to have an overview
of what is available on the TP. In their February 2017 opinion on the first revision of the
MoP, ACER requested that a list of Data Providers per data item and geographical area be
provided. Figure 25 provides an example of such a data availability matrix from another
data platform, Open Power System Data.
Figure 25. Data availability overview table from data platform Open Power Sys-
tem Data39.
Notes: The TP is larger in size and dimensionality. In this example, all blue fields indicate existing data. These
fields can be clicked and lead directly to the data.
An independent but related issue is that the so-called Reference and Master Data are not
available to users. ACER mentions bidding zones, control areas and borders and a list of
generation units as examples of such data. In ACER’s opinion, making this information
available to users would complement download options. This was also brought up by in-
terviewees, who were interested in maps of bidding zones, control areas and borders (and
how these differ from one another) as well as lists of Data Providers and Primary Data
Owners.
4.4.5. Data documentation
Users mentioned unclear, insufficient and hard-to-find data. One user summarized that
“there are some stubs available on the website, but in general the documentation is…poor:
39 https://data.open-power-system-data.org/
54
what is ‘load’? Which power plants are counted in a specific fuel-type [16.1.B&C]?” This is
in line with user feedback reported in the ETUG survey: “more detailed data information
was consistently suggested (close to data items/centrally): improved data definitions,
methodologies, publication times, possible disclaimers, why a data item is not expected,
contact info for data providers, matrix of data by provider/data availability”.
Another issue is the difficulty of accessing data definitions. In our user survey, nearly 60%
of respondents had not heard of the Detailed Data Descriptions. Without investigation,
users also do not learn about the fact that the existence, content and governance of the
TP are due to Regulation 543/3013, as it is not mentioned on the website. Numerous TP
users said that documentation and metadata are difficult to find. A consensus among ex-
perts and other users was that documentation and metadata should be available from the
same place as the data items are. Users identified the following issues:
• Documentation and metadata should be available in the same location as the data.
[4] [11] [12] [18] [survey, five times]
• The ENTSO-E documentation and metadata are difficult to find. [5] [8]
• ENTSO-E does not accept responsibility for large differing values while TSOs do not
provide satisfactory explanations. [1] [3]
• ENTSO-E needs to document changes they make to data. [11] [20]
• Metadata should be available regarding data reliability status (just metered, veri-
fied, final check/consolidated...). [20]
• Contact information for Data Providers should be provided along with the data. [20]
Insufficiently accurate data definitions are a source of inaccurate data. We therefore dis-
cuss the matter above in Section 4.2.
4.4.6. User support and contacts
The TP does not publish contact details for or the identity of Data Providers or Primary
Data Owners. All requests are channelled through the TP service desk, which forwards
questions to Data Providers or Primary Data Owners. The service desk then responds by
email to the requestor. This procedure has several shortcomings:
• As noted above, other users are not warned about quality issues. This causes users
to be unaware of existing problems and could lead to multiple requests about the
same issue.
• If addressed through the service desk, TSOs are often hesitant to reply, because
on the grounds of non-discrimination they are not allowed to share information with
a market participant exclusively. However, they rarely make such information avail-
able to the public via their own websites, either. [1] [survey]
• While most requests are addressed within a few days, some remain unanswered for
several weeks without explanation.

55
5. SUGGESTIONS AND CONCLUSIONS
Based on the above assessment, we have developed conclusions and suggestions for im-
provements
5.1. Priorities
Missing, inaccurate or inconsistent data affect all types of users. Beyond this, different
users have different requirements and priorities. “Light users” have different requirements
and face different problems than “frequent users”. This section provides a list of issues by
user type.
5.1.1. Light users
Light users access the TP once or a couple of times per year. They are researchers or
analysts who do a one-time assessment for which they require TP data. They use the GUI
to download data manually. According to ENTSO-E, there are 8800 users registered for the
TP. Given this large number, it seems plausible that the majority of these are light users.
The main problems they encounter seem to be the following:
• Problems with the GUI, including unintuitive navigation, slow response times and
error messages, lack of filter options and lacking possibility to download multiple
countries at once;
• Hard-to-find data descriptions and documentation;
• Lack of a central area/data matrix that indicates data availability;
• Lack of information about automatic download options and
• Long historical time series are missing and pre-2015 values are not integrated.
5.1.2. Frequent users
Frequent users access the TP on a regular basis, sometimes multiple times per day, usually
through the Restful API. They are often large market participants who also are obliged to
provide data. Their companies often have IT departments that support their gaining auto-
matic access; often, TP data are retrieved automatically and integrated into an internal
database. Some market participants have dedicated staff or even teams working only on
transparency data. Such users also may be members of ETUG. Through ETUG meetings,
they are informed about the structure, problems and processes of the TP. The problems
that frequent users encounter include the following:
• Inconsistent interpretation of data definitions by different Data Providers;
• Confusing outage data and UMMs as well as cross-border transmission flows and
schedules;
• Data are often used for close-to-real-time decisions (trading, dispatch), so timeli-
ness in general and
• Users expect to be able to use the TP as their primary source of information for
outage data/UMMs but they cannot because the data do not satisfy the REMIT re-
quirements.
5.2. Suggestions for improvements
The individual issues outlined in the sections on completeness, accuracy and timeliness
should be improved upon. The objective should be to increase completeness of time series
data such as load, prices and generation to 100%. Inconsistencies with other data sources
should be resolved or explained. The provision of event-driven data, i.e. outage data
56
(7.1.A&B, 10.1A&B, 15.1.A–D) should be improved due to its importance for market ac-
tors: the messages should be displayed in a sensible order, duplicates are to be avoided
and older versions of UMMs should be retained and not overwritten. All this could be
achieved by implementing a versioning system or by including a timestamp indicating when
the message was published. Furthermore, it should be possible to display all outages for a
particular unit in one place as implemented e.g. at Nordpool REMIT UMM.40
In the following, we present further suggestions for improvements that do not pertain to
individual data items, but rather to cross-cutting issues related to usability, incentives and
governance.
5.2.1. Improve information and navigation
The issue. An issue for many users, especially those who are not among the large utilities
that participate in ETUG, is a lack of well-structured information on the TP. Information is
available, but it is scattered throughout the website, cannot be found through search en-
gines and is sometimes buried in PDF documents. Navigation on the website can be
unintuitive and makes sense only once one knows the legal background of the TP. Some
information is available only to ETUG.
Our proposal. The landing page of the TP should include an introductory text explaining
the purpose of the TP and the fact that its existence, content and governance are due to
Regulation 543/3013. We furthermore propose making information available where users
look for it; making all ETUG-only information available to the public, including ENTSO-E’s
continuous quality assessment and providing a well-maintained, easy-to-find and search-
able Q&A page that includes all data definitions. We recommend working with a specialist
in search engine optimization to make sure that web search engines can crawl and index
the Q&A page and rank it highly in search results. Detailed Data Descriptions should not
be more than one click away from the data they refer to and vice versa. In addition, we
propose introducing a public help forum to replace the bilateral service desk procedure, as
many online product providers have done (e.g. Google Product Forums41); see also follow-
ing subsection.
5.2.2. A crowd-sourced public data quality log
The issue. Users who believe they have identified inaccurate or missing data are supposed
to contact the TP service desk, which then checks and/or communicates with the Data
Provider. Other users are not made aware of the reported issue.
Our proposal. We propose establishing a public data error log. Registered users should
be able to post an item on the list if they encounter issues with completeness, accuracy or
timeliness of data or with the usability of the platform. The TP service desk, the Data
Provider and other users can respond and comment; all comments are public. Once the
issue is solved the service desk flags the item as “solved”. The posting and comments
remain online. Such a crowd-sourced public data log has multiple benefits:
• Users are warned about issues and can use data with additional care.
• Data providers are warned immediately about issues and have the chance to re-
spond quickly. They also can explain that there is not an issue if that is the case.
• Other users can post solutions or explanations.
• A log creates transparency about structural problems and hence provides an in-
centive for Data Providers to improve the quality of their data and processes.
• It is a great way to source users’ ideas for improvements.
40 https://umm.nordpoolgroup.com 41 https://productforums.google.com/forum/#!home

57
5.2.3. Automatic quality reporting
The issue. There is no public automatic reporting on completeness, accuracy and timeli-
ness.
Our proposal. We propose having ongoing, regular and public reporting on at least com-
pleteness and timeliness (and maybe some aspects of accuracy). It should be easy for
users to learn which data items are complete and whether recent additions have arrived
on time. The reports should be linked prominently on the TP landing page and be accessible
from each data item directly. Ideally, this table also would list the reason for the problem.
It is our understanding that automatic quality reporting is a capability the TP already has;
however, it is used only internally, possibly due to push-back from Data Providers. Such
reporting would be complementary to the user-generated data quality log suggested above
and share the same benefits.
The combination of a user-reported data quality log and automatic reports would not fix
all problems relating to data quality, but it would save users time and could work as a form
of accountability for those parties that fail to provide high-quality data.
5.2.4. Machine-readable metadata
The issue. Metadata are data (information) that provide information about other data.
Three types of metadata exist: descriptive metadata, structural metadata and administra-
tive metadata. It is our understanding that metadata, including sources, release dates and
licences, are not available in many cases (e.g. XLSX, CSV download via GUI or FTP) in a
machine-readable form.
Our proposal. We propose providing metadata in JSON format as a complement to XLSX
and CSV files for every data item and applicable geographic entity. Metadata should include
at least the following information: unit of measurement, data source (Primary Data
Owner), Data Provider, contact person, licence, link to Detailed Data Descriptions and—if
applicable—to further (data item and/or data source-specific) documentation. We recom-
mend considering whether the CSV files could be organized to comply with the Tabular
Data Package standard42 published by Open Knowledge.
5.2.5. Governance, ownership and incentives
The issue. To us, the governance structure of the TP seems to be the underlying cause of
many of the issues discussed above. Dispersed ownership and lack of incentives seem to
lead to little attention to users. To us, it seems that responsibility and accountability are
lacking:
• ENTSO-E points out that it maintains the technical database; all data quality is-
sues are a matter for Data Providers.
• Data Providers are hard to contact and, to our knowledge, face no material incen-
tives to improve quality.
• National Regulatory Authorities (NRAs) apparently lack the capacity or the incen-
tive to monitor data quality properly and to impose sanctions on non-complying
Data Providers.
• ACER lacks the mandate and the capacity to monitor data quality continuously; in
addition, ACER recommendations are not binding for ENTSO-E.
Several market participants said they would be “happy to pay a small fee” if the quality of
the TP could be improved.
42 http://frictionlessdata.io/

58
Our proposal. Building a useful power system data platform is a complex task. It can
never be a one-shot project, but rather requires intensive improvements over a long pe-
riod. It is burdensome and costly. We recommend improving incentives through
transparency and—ultimately—sanctions and adapting the governance structure to focus
more on users. We recommend that:
• ENTSO-E get a clear mandate to specify data definitions further to improve con-
sistency among Data Providers.
• Users be able to publicly report issues (see 5.2.2 above).
• Data quality be systematically monitored, with reporting by Data Providers and all
monitoring reports made public (see 5.2.3 above).
• NRAs receive yearly reports about compliance of all Data Providers of their juris-
diction. These reports should be public as well.
• At some point, Data Providers face monetary sanctions for non-compliance with
quality requirements and submission deadlines. If NRAs are responsible for impos-
ing such sanctions, the size of the penalties should be public.
• ETUG’s role be expanded and formalized.
• Users beyond market participants—in particular, civil society and academia—be
represented formally in ETUG, following the spirit of the Aarhus Convention43.
The objective of this study was to evaluate the quality of data published through the EN-
TSO-E Transparency Platform as well as the user friendliness of the platform itself. By
providing this analysis and suggesting the above improvements, we hope that we can
help the TP become even more useful for its users.
43 http://ec.europa.eu/environment/aarhus/