a. river hydrodynamics a.1.turbulent open-channel flow …7928/river06_2… · ·...
TRANSCRIPT

A. River hydrodynamics
A.1. Turbulent open-channel flow and transport phenomena

River Flow 2006 – Ferreira, Alves, Leal & Cardoso (eds)© 2006 Taylor & Francis Group, London, ISBN 0-415-40815-6
Unsteady turbulence characteristics in an undular bore
C. KochFormerly: Civil Engineering, The University of Queensland, Brisbane, Australia
H. ChansonCivil Engineering, The University of Queensland, Brisbane, Australia
ABSTRACT: When a river mouth has a flat converging shape with a tidal range exceeding 6 to 9 m, the rivermay experience a tidal bore. A tidal bore is a positive surge, and the aim of the study is to detail the turbu-lent field beneath an undular bore. New unsteady experiments were conducted in a large channel. Turbulencemeasurements were performed with high-temporal resolution using side-looking acoustic Doppler velocimetry.Detailed turbulent measurements were conducted along a vertical profile for a Froude number of 1.4. Instan-taneous velocity measurements showed a marked flow deceleration at all vertical elevations. Turbulent stresseswere deduced from high-pass filtered data. Maximum Reynolds stresses were observed beneath the whelps,under and just before each crest. The findings suggest that preferential bed erosion takes place beneath eachwave crest, and the eroded material is advected in the undular wave motion behind the bore front.
1 INTRODUCTION
In macro-tidal estuaries, a tidal bore may form duringspring tide conditions when the flood tide is confinedto a narrow channel. The bore is a series of wavespropagating upstream as the tidal flow turns to rising(Fig. 1). The occurrence of tidal bores has a significantimpact on river mouths and estuarine systems. Bed ero-sion and scour take place beneath the bore front whilesuspended matters are carried upwards in the ensuingwave motion. The process contributes to significantsediment transport with deposition in upstream inter-tidal areas. Tidal bores induce also strong mixing anddispersion in the river mouth, but classical mixing the-ories do not account for such type of discontinuities.The existence of tidal bores is based upon a fragilehydrodynamic balance which may be easily disturbedby changes in boundary conditions and freshwaterinflow (e.g. Chanson 2004a, 2005a).
There are numerous visual accounts of tidal bores.Most occurrences showed well-defined undulationsbehind the leading wave, that is an undular bore pro-cess. The other type of bore is the breaking bore that israrely seen, but for a few exceptions. Field measure-ments in tidal bores are very limited and most studiesrecorded a limited number of parameters with rela-tively coarse resolutions in terms of time scales, spatialresolutions and velocity magnitudes. All field stud-ies were fixed-point measurements, but a tidal boreis a very dynamic process which extends over several
kilometres, sometimes tens of kilometres, and the boreshape and characteristics evolve rapidly with time inresponse to change in bathymetry. Figure 1B illustratesa tidal bore event in the Baie du Mont Saint Michel,France. The bore front travelled with an average celer-ity of about 2.7 m/s, but its shape changed constantlywith time, sometime disappearing in the deep waterchannel, while a breaking front was observed in theshallower waters near the banks (Chanson 2005b).
The aim of the study is to detail the turbulence fieldin an undular tidal bore under controlled flow con-ditions. New experiments were conducted in a largechannel (L = 12 m, W = 0.5 m). Detailed free-surfaceand turbulence measurements were performed withhigh-temporal resolution (50 Hz) using side-lookingacoustic Doppler velocimetry and non-intrusive free-surface measurement devices. It is the purpose of thispaper to present new compelling evidences on thehydrodynamics of undular bore front.
1.1 Bibliographic review
Positive surges and bores were studied by hydrauli-cians and applied mathematicians. Major contri-butions included Barré de Saint Venant (1871),Boussinesq (1877), Lemoine (1948), Serre (1953) andBenjamin and Lighthill (1954). Classical experimen-tal investigations of undular bores included Bazin(1865), Favre (1935), Sandover and Holmes (1962),Benet and Cunge (1971) and Treske (1994). Ponsy and
79
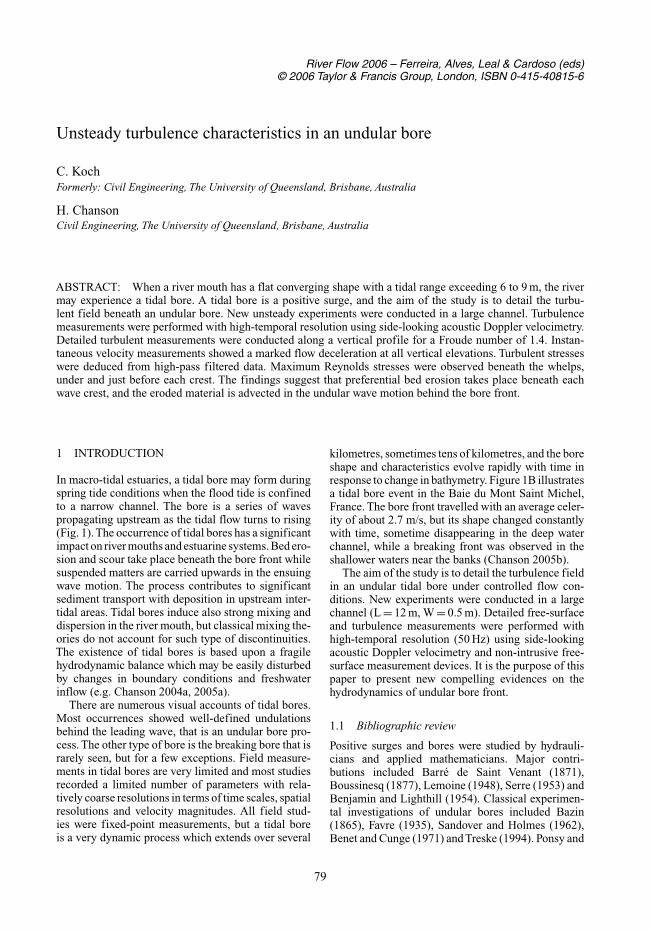
(A) Undular tidal bore of the Dordogne river (France) at StPardon on 6 Aug. 2004 (Courtesy of Pierre-Yves Lagrée) -View from left bank with bore propagating from left to right
(B) Tidal bore of the Sélune river (France) on 7 April 2004 atRoche-Torin (Photograph by Hubert Chanson) - The bore frontdisappeared briefly in the deep channel section while an undu-lar bore was seen besides, with breaking bores in shallowerwaters and the bore front advancing over dry bed in foreground
Figure 1. Photographs of undular tidal bores.
Carbonnell (1966) presented superb, detailed three-dimensional free-surface profile measurements inprototype trapezoidal channels. However most experi-mental studies were limited to visual observations andsometimes free-surface measurements. These rarelyencompassed turbulence but a few limited studies (e.g.Hornung et al. 1995).
Field measurements in tidal bores are few: e.g.,Lewis (1972) and Huntley (2003) in the Dee river(UK), Wolanski et al. (2004) in the Daly river (Aus-tralia), Kjerfve and Ferreira (1993) in Rio Mearim(Brazil). All these studies were limited to a very smallnumber of occurrences.
2 EXPERIMENTAL FACILITIES
2.1 Channel and instrumentation
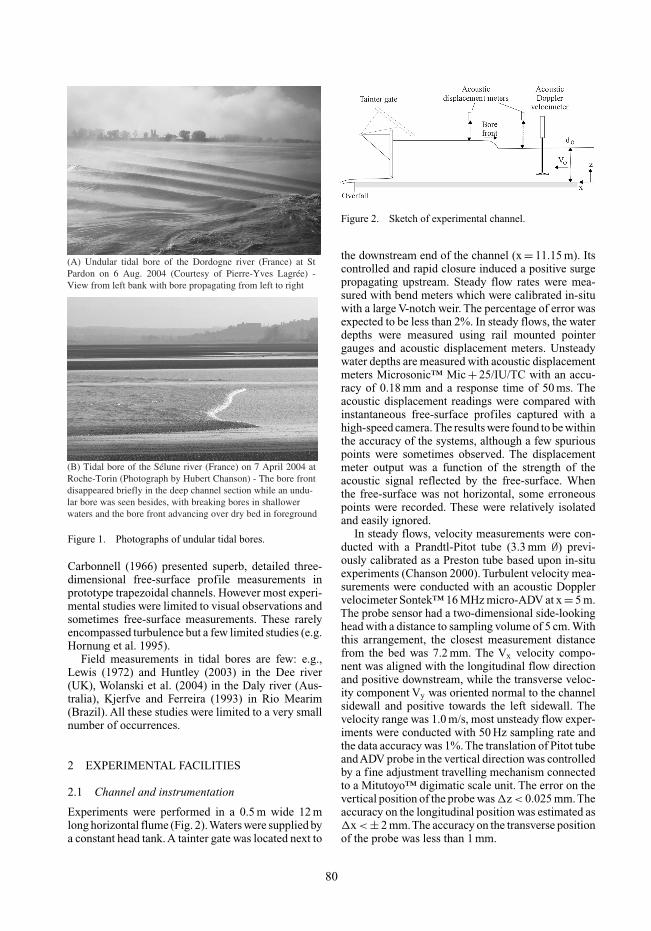
Experiments were performed in a 0.5 m wide 12 mlong horizontal flume (Fig. 2).Waters were supplied bya constant head tank. A tainter gate was located next to
Figure 2. Sketch of experimental channel.
the downstream end of the channel (x = 11.15 m). Itscontrolled and rapid closure induced a positive surgepropagating upstream. Steady flow rates were mea-sured with bend meters which were calibrated in-situwith a large V-notch weir. The percentage of error wasexpected to be less than 2%. In steady flows, the waterdepths were measured using rail mounted pointergauges and acoustic displacement meters. Unsteadywater depths are measured with acoustic displacementmeters Microsonic™ Mic + 25/IU/TC with an accu-racy of 0.18 mm and a response time of 50 ms. Theacoustic displacement readings were compared withinstantaneous free-surface profiles captured with ahigh-speed camera.The results were found to be withinthe accuracy of the systems, although a few spuriouspoints were sometimes observed. The displacementmeter output was a function of the strength of theacoustic signal reflected by the free-surface. Whenthe free-surface was not horizontal, some erroneouspoints were recorded. These were relatively isolatedand easily ignored.
In steady flows, velocity measurements were con-ducted with a Prandtl-Pitot tube (3.3 mm ∅) previ-ously calibrated as a Preston tube based upon in-situexperiments (Chanson 2000). Turbulent velocity mea-surements were conducted with an acoustic Dopplervelocimeter Sontek™ 16 MHz micro-ADV at x = 5 m.The probe sensor had a two-dimensional side-lookinghead with a distance to sampling volume of 5 cm. Withthis arrangement, the closest measurement distancefrom the bed was 7.2 mm. The Vx velocity compo-nent was aligned with the longitudinal flow directionand positive downstream, while the transverse veloc-ity component Vy was oriented normal to the channelsidewall and positive towards the left sidewall. Thevelocity range was 1.0 m/s, most unsteady flow exper-iments were conducted with 50 Hz sampling rate andthe data accuracy was 1%. The translation of Pitot tubeandADV probe in the vertical direction was controlledby a fine adjustment travelling mechanism connectedto a Mitutoyo™ digimatic scale unit. The error on thevertical position of the probe was �z < 0.025 mm.Theaccuracy on the longitudinal position was estimated as�x < ± 2 mm.The accuracy on the transverse positionof the probe was less than 1 mm.
80

Table 1. Experimental flow conditions.
Q do U dconj
m3/s m m/s m Fr Remarks
0.0403 0.0795 0.140 0.0957 1.31 Undularbores
0.0403 0.0795 0.235 0.103 1.41 ADV measure-ments.
0.0403 0.0785 0.238 0.109 1.440.0406 0.0790 0.286 0.117 1.490.0403 0.0785 0.315 0.120 1.530.04015 0.0790 0.456 0.135 1.67 Some breaking
at 1st wave crest
0.0406 0.0795 0.549 0.145 1.77 Breaking bore.
* do: initial flow depth dconj: measured conjugate flow depth;Q: steady discharge; U: bore celerity.
Additional informations were obtained with digi-tal cameras Panasonic™ Limux DMC-FZ20GN andCanon™ A85, and a digital video-camera Sony™DV-CCD DCR-TRV900. Further details on the exper-imental facility were reported by Koch and Chanson(2005).
2.2 Tidal bore generation
For each experiment, the initial steady flow was uncon-trolled and gradually-varied. It was established forat least 10 minutes prior to measurements. A borewas generated by the rapid partial closure of thedownstream gate. The gate closure occurred in lessthan 0.1 sec. Flow measurements and data acquisitionwere started for 2 minutes prior to gate closure. Aftergate closure, the travelling bore propagated upstreamagainst the gradually-varied flow over the full channellength. Each experiment was stopped when the borefront reached the intake structure. Tests were repeatedsystematically for different gate closures (Table 1).
Detailed velocity and free-surface elevation mea-surements were performed with the acoustic Dopplervelocimeter (ADV) located at x = 5 m from thechannel intake and at several transverse positionsy/W = 0.5, 0.75, 0.90 and 0.95, where x is the distancefrom the upstream channel end, y is the transversedistance measured from the right sidewall and W isthe channel width (W = 0.5 m). The acoustic displace-ment meters were located at x = 10.95 m, 7.25 m, 6 m,5.1 m and 5 m. The latter displacement meter sampledthe free-surface elevation immediately above the ADVsampling volume, while the other sensors were placedon the channel centreline.
2.3 Initial steady flow conditions
The initial steady flow was partially-developed withδ/do = 0.6 to 0.8 at the sampling location (x = 5 m).
Both ADV and Prandtl-Pitot tube data comparedfavourably with a 1/7th power law in the bound-ary layer. The shear velocity was estimated usingthe Preston-Prandtl-Pitot tube and a match betweenvelocity data and logarithmic velocity law in theinner flow layer. The results were close and yielded:V∗ = 0.044 m/s. Importantly, the data, including thevertical distributions of Reynolds stresses, showedgood qualitative and quantitative agreement with thedetailed experiments of Xie (1988) and Tachie (2001)in smooth open channel flows. Further details on theinitial flow properties were described in Koch andChanson (2005, pp. 21–37).
2.4 Acoustic Doppler velocity metrology
Acoustic Doppler velocimetry (ADV) is designed torecord instantaneous velocity components at a single-point with relatively high frequency. Past and presentexperiences demonstrated many problems. In steadyturbulent flows, the ADV velocity fluctuations char-acterise the combined effects of the Doppler noise,signal aliasing, velocity fluctuations, turbulent shearand other disturbances (Lemmin and Lhermitte 1999,McLelland and Nicholas 2000, Chanson et al. 2005).For all experiments, present experience demonstratedrecurrent problems with the velocity data, includinglow correlations and low signal to noise ratios. Thesituation improved by mixing some vegetable dye(Dytex Dye™ Ocean Blue) in the entire water recircu-lation system. Other problems were experienced withboundary proximity.
In steady flows, detailed comparisons betweenADV and Prandtl-Pitot tube data were conducted aty = 0.473, 0.450, and 0.375 m (or 27, 50 and 125 mmfrom the left sidewall) with the micro ADV sensorsfacing the left sidewall, where y is the transverse dis-tance from the right wall. Experimental data indicatedthat the streamwise velocity data were not affectedby the presence of the channel bed at y = 0.450 and0.375 m as observed at y = 0.250 m. But the ADVdata underestimated the velocity in the vicinity of asidewall (y > 0.455 mm). This was associated with adrastic decrease in average signal correlations, aver-age signal-to-noise ratios and amplitudes next to thewall (Koch and Chanson 2005).
While several ADV post-processing techniqueswere devised for steady flows (e.g. Goring and Nikora2002, Wahl 2003), these post-processing techniquesare not applicable to unsteady flows (e.g. Nikora 2004,Person. Comm., Chanson et al. 2005). In the presentstudy, unsteady flow post-processing was limited toa removal of communication errors and a replace-ment by interpolation. Beneath the undular surge, theADV probe outputs showed systematically a lower pro-portion of errors and “spikes” while the bore frontpassage was associated with some increase in average
81

signal-to-noise ratios, average signal correlations andto a lesser extent signal amplitudes. Although theseobservations were not “true” validation, they tendedto support the use of Acoustic Doppler devices in sucha highly unsteady flow situation.
2.5 Reynolds stress calculation in rapidly-variedflow motion
In turbulence studies, the measured statistics are basedupon the analysis of instantaneous turbulent velocitydata : v =V - V̄, where V̄ is a time-average velocity.If the flow is “gradually time-variable”, V̄ must bea low-pass filtered velocity component, or variable-interval time average VITA (Piquet 1999). The cutofffrequency must be selected such that the averagingtime is greater than the characteristic period of fluc-tuations, and small with respect to the characteristicperiod for the time-evolution of the mean properties.
In undular surge flow, the Eulerian flow proper-ties showed an oscillating pattern with a period ofabout 2.4 s that corresponded to the period of the free-surface undulations. The unsteady data were thereforefiltered with a low/high-pass filter threshold greaterthan 0.4 Hz (i.e. 1/2.4 s) and smaller than the Nyquistfrequency (herein 25 Hz). The cutoff frequency wasselected as 1 Hz based upon a sensitivity analysis(Koch and Chanson 2005, pp. A51-A55). The samefiltering technique was applied to both streamwise andtransverse velocity components, and Reynolds stresseswere calculated from the high-pass filtered signals.
3 UNDULAR BORE FREE-SURFACEPROFILES
3.1 Presentation
Undular bores were observed for surges Froude num-bers less than 1.7, where the surge Froude number isdefined as:
with Vo is the initial flow velocity, U is the bore frontcelerity for an observer fixed on the bank, g is thegravity acceleration and do is the initial water depth(Henderson 1966, Chanson 2004a,b). Measured initialdepths and surge celerities are listed in Table 1.
The undular bores propagated upstream relativelyslowly and the bore front was followed by a train ofwell-formed undulations. For low surge Froude num-bers (1 ≤ Fr < 1.4 to 1.5), the free-surface undulationshad a “smooth” appearance and no wave breakingwave observed. Some cross-waves were seen devel-oping upstream of the first wave crest and intersectingnext to the first crest (Fig. 3A). For intermediate surge
(A) Photograph of advancing undular bore, looking down- stream with cross-waves intersecting on the first wave crest
0.951
1.051.1
1.15
1.21.251.3
1.35
-20 -10 0 2010
y/W=0.5 CL y/W=0.75 y/W=0.90 y/W=0.95
t.sqrt(g/do)
d/do
(B) First wave crest free-surface profiles at x = 5 m and 4transverse locations
Figure 3. Undular bore free-surface profile (Fr = 1.4,do = 0.079 m).
Froude numbers (i.e. 1.4 to 1.5 < Fr < 1.7), some slightwave breaking was observed at the first crest, andthe ensuing free-surface undulations were flatter. Forlarger Froude numbers (i.e. Fr ≥ 1.7), a breaking surgewas seen.
Typical instantaneous free-surface profiles are pre-sented in Figure 3B. Each curve shows the instanta-neous dimensionless flow depth d/do as a function ofa dimensionless time t
√g/do for the first wave crest.
Figure 3B shows data collected at x = 5 m for fourtransverse locations, illustrating the three-dimensionalnature of the flow. At the first wave crest, the waterlevels were higher next to the centreline (y/W = 0.5 &0.75) than next to the sidewall (y/W = 0.95 & 0.90)(Fig. 3B).
The data showed a gradual evolution of the undularbore shape as it propagated upstream. It is conceiv-able that the bore was not fully-developed. Howeverthe data tended to suggest a gradual reduction ofthe bore height with increasing distance from thedownstream gate. Such a trend was consistent with afully-developed bore propagating against a gradually-varied flow with a S2 backwater profiles. In thepresent study, longitudinal free-surface measurementsin steady flows suggested indeed a S2 profile betweenx = 5 and 7 m.
82

1
1.2
1.4
1.6
1.8
2
1 1.2 1.4 1.6 1.8
Present Study
Momentum Eq.
FAVRE (1935)
BENET &CUNGE (Model)
BENET &CUNGE(Prototype)TRESKE (1994)
Fr
dconj/doUndular bores
(A) Conjugate depth ratio dconj/do across undular bore front – Comparison between momentum principle and experiments
0
0.05
0.1
0.15
0.2
0.25
0.3
0.35
1 1.2 1.4 1.6 1.8
aw/doANDERSEN
aw/doLEMOINE
aw/do Presentdata
BENET &CUNGE(Prototype)Dee river(LEWIS)
Fr
amplitude/do
(B) Dimensionless free-surface undulation amplitude (firstwavelength) – Comparison between Lemoine's (1948) theory,Andersen's (1978) theory, laboratory data (Present study), pro-totype data (Benet and Cunge 1971) and tidal bore field obser-vations (Lewis 1972)
Figure 4. Dimensionless properties of undular bores.
3.2 Undular bore properties
In a fully-developed bore, the ratio of conjugate depths(dconj/do) must satisfy the continuity and momentumequations :
where dconj is the depth immediately behind the bore.Experimental results are presented in Figure 4A, wherethe ratio dconj/do is plotted as a function of the Froudenumber. Present data are compared with Equation (2)and with past experiments. The data showed slightlylower conjugate depth ratios for 1.1 < Fr < 1.7. Inundular bores, the estimate of the conjugate depthdconj is somewhat arbitrary. For all data the conjugatedepth dconj was estimated as the average of wave crestand trough depths. The averaging process assumed a
symmetrical wave pattern that was not supported byexperimental data.
Undulation amplitude and wave length data werealso compared with previous studies and with the theo-ries of Lemoine (1948) andAndersen (1978). Lemoine(1948) assumed that the energy dissipation takes placeby radiation of sinusoidal wave train, while Ander-sen (1978) developed a solution of the Boussinesqequation. Present data showed a good agreement withearlier studies. Interestingly, the data agreed reason-ably well with Lemoine’s theory although the latterwas based upon a sinusoidal wave assumption. Presentresults do not support claims that cnoidal wave theoryyields better agreement with experimental data (e.g.Benjamin and Lighthill 1954).
Figure 4B compares undular wave amplitudes withundular tidal bore observations in the Dee river(Lewis 1972). Note that the wave amplitude (Fig.4B) decreased sharply immediately before the disap-pearance of free-surface undulations. Treske (1994)reported a similar trend. It is believed that the flowconditions associated with maximum wave amplitudeoccurred immediately before the appearance of somewave breaking at the first wave crest: i.e. for Fr ∼1.4to 1.5 in the present study.
4 TURBULENT VELOCITIES BENEATHUNDULAR BORE
4.1 Instantaneous velocity measurements
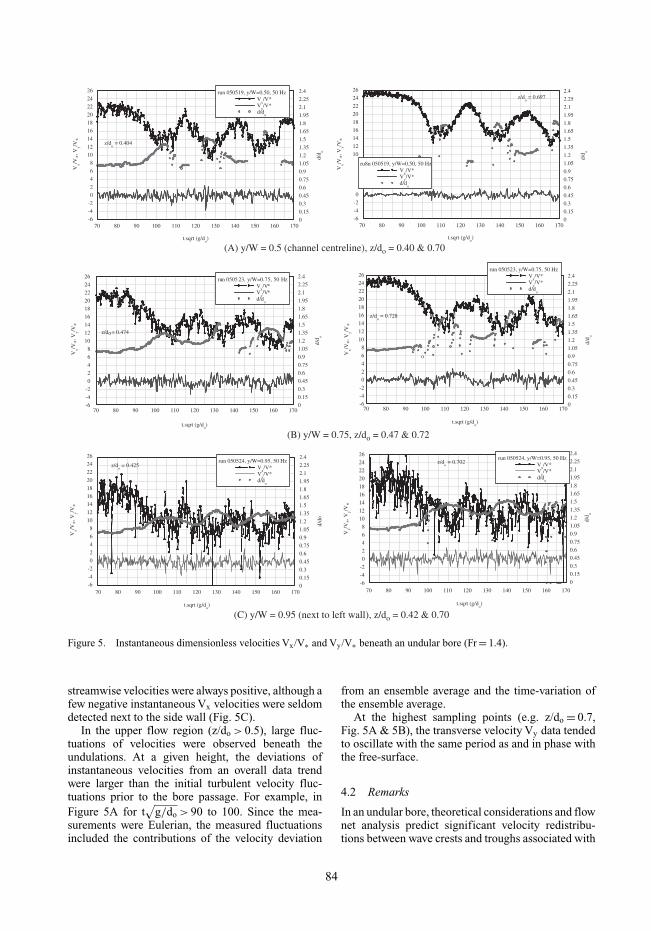
Unsteady velocity measurements were performedbeneath an undular bore for a surge Froude numberof Fr = 1.4 (Table 1). The acoustic Doppler velocime-try (ADV) system was positioned at x = 5 m and eachexperiment was conducted at several vertical eleva-tions z and transverse locations y. Figure 5 illustratethe effects of undular bore passage on the turbulentvelocity field at a fixed point. Each graph presents thedimensionless velocities Vx/V∗ and Vy/V∗, and waterdepth d/do, where do is the initial water depth and V∗ isthe shear velocity measured on the channel centrelinein steady flows (V∗ = 0.044 m/s). The time t is zeroat 10 s prior to the first wave crest passage. Figure 5Ashows centreline data while Figures 5B and 5C presentdata at other transverse locations (y/W = 0.75 & 0.95).Figure 6 presents details of the flow field next to thefirst wave crest.
Experimental results indicated some basic features.The streamwise velocity component decreased rapidlywith the passage of the first wave crest and oscillatedwith time with the same period as and out of phase withthe surface undulations (Fig. 5). Maximum velocitieswere observed beneath the wave troughs and mini-mum velocities below the wave crests. The trend wasseen at all vertical and transverse locations, and it wasconsistent with irrotational flow theory. Note that the
83
-6
-4
-2
0
2
4
6
8
10
12
14
16
18
20
22
24
26
z/do = 0.474
run 0505 23, y/W=0.75, 50 HzV
x/V*
Vy/V*
d/do
-6
-4
-2
0
2
4
6
8
10
12
14
16
18
20
22
24
26
z/do = 0.728
run 050523, y/W=0.75, 50 HzV
x/V*
Vy/V*
d/do
(B) y/W = 0.75, z/do = 0.47 & 0.72
o
t.sqrt (g/do)
Vx/V
*, Vy/V
*V
x/V*, V
y/V*
Vx/V
*, Vy/V
*
Vx/V
*, Vy/V
*V
x/V*, V
y/V*
d/d o
70 80 90 100 110 120 130 140 150 160 170
t.sqrt (g/do)
70 80 90 100 110 120 130 140 150 160 170
-6 0
-4 0.15
-2 0.3
0 0.45
2 0.6
4 0.75
6 0.9
8 1.05
10 1.2
12 1.35
14 1.5
16 1.65
18 1.8
20 1.95
22 2.1
24 2.25
26 2.4
d/d o
0
0.15
0.3
0.45
0.6
0.75
0.9
1.05
1.2
1.35
1.5
1.65
1.8
1.95
2.1
2.25
2.4
d/d o
0
0.15
0.3
0.45
0.6
0.75
0.9
1.05
1.2
1.35
1.5
1.65
1.8
1.95
2.1
2.25
2.4
0
0.15
0.3
0.45
0.6
0.75
0.9
1.05
1.2
1.35
1.5
1.65
1.8
1.95
2.1
2.25
2.4
d/d o
0
0.15
0.3
0.45
0.6
0.75
0.9
1.05
1.2
1.35
1.5
1.65
1.8
1.95
2.1
2.25
2.4
d/d o
0
0.15
0.3
0.45
0.6
0.75
0.9
1.05
1.2
1.35
1.5
1.65
1.8
1.95
2.1
2.25
2.4
z/do = 0.404
run 050519, y/W=0.50, 50 HzV
x/V*
Vy/V*
d/do
t.sqrt (g/do)
Vx/V
*, Vy/V
*
70 80 90 100 110 120 130 140 150 160 170
t.sqrt (g/do)
70 80 90 100 110 120 130 140 150 160 170
t.sqrt (g/do)
70 80 90 100 110 120 130 140 150 160 170
t.sqrt (g/do)
70 80 90 100 110 120 130 140 150 160 170
-6
-4
-2
02
4
6
10
12
14
16
18
20
22
24
26z/d
o = 0.697
ru8n 050519, y/W=0.50, 50 HzV
x/V*
Vy/V*
d/do
(A) y/W = 0.5 (channel centreline), z/do = 0.40 & 0.70
-6
-4
-2
0
2
4
6
8
10
12
14
16
18
20
22
24
26z/d
o = 0.702
run 050524, y/W=0.95, 50 HzV
x/V*
Vy/V*
d/do
(C) y/W = 0.95 (next to left wall), z/do = 0.42 & 0.70
d/do
-6
-4
-2
0
2
4
6
8
10
12
14
16
18
20
22
24
26
z/do = 0.425
run 050524, y/W=0.95, 50 HzV
x/V*
Vy/V*
d/do
Figure 5. Instantaneous dimensionless velocities Vx/V∗ and Vy/V∗ beneath an undular bore (Fr = 1.4).
streamwise velocities were always positive, although afew negative instantaneous Vx velocities were seldomdetected next to the side wall (Fig. 5C).
In the upper flow region (z/do > 0.5), large fluc-tuations of velocities were observed beneath theundulations. At a given height, the deviations ofinstantaneous velocities from an overall data trendwere larger than the initial turbulent velocity fluc-tuations prior to the bore passage. For example, inFigure 5A for t
√g/do > 90 to 100. Since the mea-
surements were Eulerian, the measured fluctuationsincluded the contributions of the velocity deviation
from an ensemble average and the time-variation ofthe ensemble average.
At the highest sampling points (e.g. z/do = 0.7,Fig. 5A & 5B), the transverse velocity Vy data tendedto oscillate with the same period as and in phase withthe free-surface.
4.2 Remarks
In an undular bore, theoretical considerations and flownet analysis predict significant velocity redistribu-tions between wave crests and troughs associated with
84

0
0.2
0.4
0.6
0.8
1
1.2
1.4
0 5 10 15 20 25Vx/V*
z/d o
Vx/V* 1st wave crest
Vx/V* 1st wave trough
Vx/V* Initial flow
Vx/V* T1C - 1 sec
Vx/V* T1C - 0.5 sec
_________________________________________________ Initialflow
T1C -1 sec.
T1C -0.5 sec.
1st wave crest
1st wave trough_________________________________________________
t(s) = 0 9.0 9.5 10.0 11.05d/do = 1.14 1.24 1.80 1.05
_________________________________________________ 1
Figure 6. Redistributions of dimensionless vertical velocityprofiles (Vx/V∗) beneath the first wave crest of an undularsurge (Fr = 1.4, centreline data) – At each vertical elevation,5 instantaneous, consecutive data samples are shown.
pressure gradients greater than hydrostatic beneathwave trough and less than hydrostatic beneath crest(e.g. Rouse 1938, Montes and Chanson 1998). Fig-ure 6 illustrates the redistribution of vertical velocityprofiles with time during the propagation of the firstfree-surface undulation. At each vertical elevation,five instantaneous, consecutive velocity samples areplotted as functions of the vertical elevation. Simi-larly, five consecutive data samples at each elevationare shown for 1 s before the passage of the first wavecrest (T1C–1 sec.), 0.5 s prior to the first crest (T1C –0.5 sec.), and at the following wave trough. The ini-tial velocity profile is shown in thick dashed line forcomparison. Trend lines are shown for (T1C-1 s) and(T1C-0.5 s) also (thin dashed lines).
Present data showed experimental trends that werein agreement with irrotational flow motion theory. Butthe ideal fluid flow theory is based upon the assump-tion of frictionless fluid. It does not account for bedand sidewall friction, nor for the initial turbulence flowconditions and turbulence structure. The presence ofboundary shear contributes to some energy dissipationas well as the generation of vorticity.When a bore prop-agates upstream against a current, the average vorticityis positive.
Note also that the velocity redistributions presenteda different pattern to that observed beneath undu-lar hydraulic jumps (e.g. Chanson 1995). Severalresearchers argued that there are indeed fundamentaldifferences between the two types of flows (Montes1979, Montes and Chanson 1998).
5 TURBULENT REYNOLDS STRESSESBENEATH UNDULAR BORE
5.1 Instantaneous Reynolds stresses
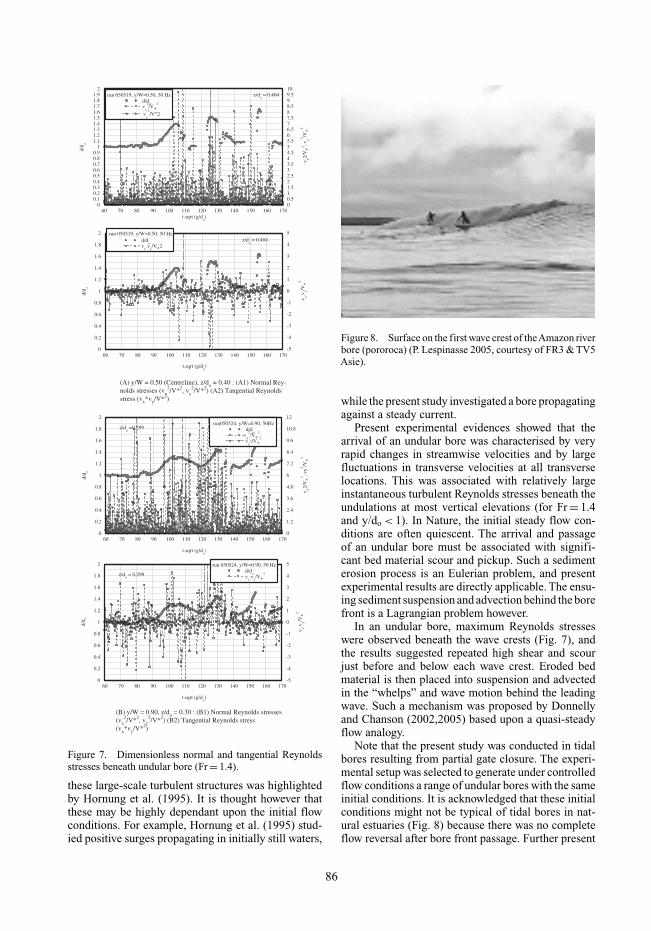
Reynolds stress data showed large turbulent stressesbelow the surge front and ensuing undulations (Fig. 7).This is seen in Figure 7 for t
√g/do > 90. Figure 7
presents both normal and tangential instantaneous tur-bulent stresses. Reynolds stresses were significantlylarger than in the initial steady flow. In particular,intense normal and tangential stresses were consis-tently seen beneath wave crests and just before eachcrest.These turbulent stresses were larger than beneaththe adjacent wave troughs (Fig. 7). The data showedalso larger Reynolds stresses at the lower samplinglocations including next to the bed. Comparativelysmaller Reynolds stresses were measured at highersampling locations, although the Reynolds stress lev-els were always larger beneath the undulations than inthe initial steady flow.
5.2 Turbulent dissipation and mixing
In a river, the passage of an undular bore is alwaysassociated with very significant turbulence and mix-ing as demonstrated by field observations. Evidencesincluded repeated impact and damage to field mea-surement equipments: e.g., in Rio Mearim (Kjerfveand Ferreira 1993), in the Daly river (Wolanski et al.2004), in the Dee river (Lewis 1972). Further demon-strations covered major damage to river banks, ship-ping and navigation. Other tragic evidences includednumerous drownings in tidal bores and “whelps”(Malandain 1988).
At a point fixed in space, the passage of the borefront and ensuing undulations is associated with rapidfluctuations of vertical pressure and velocity distribu-tions between adjacent wave crests and troughs (e.g.Figs. 5 & 6).This type of mixing is supported by strongturbulence measured in undular bores and sedimentadvection observations behind bore front.
Second, large volumes of sediments are advectedupstream behind tidal bores as observed by numerousresearchers (Chen et al. 1990, Tessier and Terwindt1994). In the Rio Mearim, Kjerfve and Ferreira (1993)reported: “in shallow areas, the water boiled violentlyafter the passage of the bore and became brownish-black”.All studies showed that the arrival of an undularbore was associated with intense bed material mixing.Chanson (2001, 2005a,b) argued that sediment sus-pension beneath the “whelps” is sustained by strongwave motion for relatively long periods. In the Dor-dogne river, he observed some intense wave motionlasting more than 20 minutes after the bore passage.
Third some turbulent energy is dissipated in vorticalstructures advected behind the surge front. The role of
85
t.sqrt (g/do)
d/d o
v x2/V
*2 , vy2 /V
*2
60 70 80 90 100 110 120 130 140 150 160 1700 0
0.1 0.50.2 10.3 1.50.4 20.5 2.50.6 30.7 3.50.8 40.9 4.5
1 51.1 5.51.2 61.3 6.51.4 71.5 7.51.6 81.7 8.51.8 91.9 9.5
2 10z/d
o = 0.404run 050519, y/W=0.50, 50 Hz
d/do
vx
2/V*
2
vy
2/V*2
t.sqrt (g/do)
d/d o
v x.vy/V
*2
60 70 80 90 100 110 120 130 140 150 160 1700 -5
0.2 -4
0.4 -3
0.6 -2
0.8 -1
1 0
1.2 1
1.4 2
1.6 3
1.8 4
2 5z/d
o = 0.404
run 050519, y/W=0.50, 50 Hzd/d
ov
x.v
y/V*2
(A) y/W = 0.50 (Centreline), z/do = 0.40 : (A1) Normal Rey-nolds stresses (vx
2/V*2, vy2/V*2) (A2) Tangential Reynolds
stress (vx*vy/V*2)
t.sqrt (g/do)
d/d o
v x.vy/V
*2
60 70 80 90 100 110 120 130 140 150 160 1700 -5
0.2 -4
0.4 -3
0.6 -2
0.8 -1
1 0
1.2 1
1.4 2
1.6 3
1.8 4
2 5
z/do = 0.299
run 050524, y/W=0.90, 50 Hzd/d
ov
x.v
y/V*
2
(B) y/W = 0.90, z/do = 0.30 : (B1) Normal Reynolds stresses(vx
2/V*2, vy2/V*2) (B2) Tangential Reynolds stress
(vx*vy/V*2)
t.sqrt (g/do)
d/d o
v x2/V
*2 , vy2 /V
*2
60 70 80 90 100 110 120 130 140 150 160 1700 0
0.2 1.2
0.4 2.4
0.6 3.6
0.8 4.8
1 6
1.2 7.2
1.4 8.4
1.6 9.6
1.8 10.8
2 12
z/do =0.299
run050524, y/W=0.90, 50Hz d/d
ov
x
2/V*
2
vy2/V*
2
Figure 7. Dimensionless normal and tangential Reynoldsstresses beneath undular bore (Fr = 1.4).
these large-scale turbulent structures was highlightedby Hornung et al. (1995). It is thought however thatthese may be highly dependant upon the initial flowconditions. For example, Hornung et al. (1995) stud-ied positive surges propagating in initially still waters,
Figure 8. Surface on the first wave crest of theAmazon riverbore (pororoca) (P. Lespinasse 2005, courtesy of FR3 & TV5Asie).
while the present study investigated a bore propagatingagainst a steady current.
Present experimental evidences showed that thearrival of an undular bore was characterised by veryrapid changes in streamwise velocities and by largefluctuations in transverse velocities at all transverselocations. This was associated with relatively largeinstantaneous turbulent Reynolds stresses beneath theundulations at most vertical elevations (for Fr = 1.4and y/do < 1). In Nature, the initial steady flow con-ditions are often quiescent. The arrival and passageof an undular bore must be associated with signifi-cant bed material scour and pickup. Such a sedimenterosion process is an Eulerian problem, and presentexperimental results are directly applicable. The ensu-ing sediment suspension and advection behind the borefront is a Lagrangian problem however.
In an undular bore, maximum Reynolds stresseswere observed beneath the wave crests (Fig. 7), andthe results suggested repeated high shear and scourjust before and below each wave crest. Eroded bedmaterial is then placed into suspension and advectedin the “whelps” and wave motion behind the leadingwave. Such a mechanism was proposed by Donnellyand Chanson (2002,2005) based upon a quasi-steadyflow analogy.
Note that the present study was conducted in tidalbores resulting from partial gate closure. The experi-mental setup was selected to generate under controlledflow conditions a range of undular bores with the sameinitial conditions. It is acknowledged that these initialconditions might not be typical of tidal bores in nat-ural estuaries (Fig. 8) because there was no completeflow reversal after bore front passage. Further present
86
results focused on the bore front and the short periodimmediately after bore passage.
6 CONCLUSION
Limited quantitative information is available to date onthe turbulence induced by undular tidal bores becausethe hydrodynamics and turbulence field were notstudied with fine instrumentation under well-definedconditions. In the present study, new experimentswere conducted under controlled flow conditions in alarge channel. Detailed turbulence measurements wereperformed with a high-temporal resolution (50 Hz)using side-looking acoustic Doppler velocimetry andnon-intrusive free-surface measurement devices. Theexperiments were designed to study a range of undularbores with a minimum number of dependant variables.Using one set of initial flow conditions, experimentswere performed in undular surges resulting from arapid gate closure at the downstream end of the flumeand propagating upstream against the initial flow. Theonly dependant variable was the downstream gateopening after closure.
Undular bores were observed for surges Froudenumbers less than 1.7 although some breaking wasobserved at the first crest for 1.4 to 1.5 < Fr < 1.7.Free-surface profiles compared favourably with pastmeasurements in positive surge and tidal bores.The present study demonstrated unique features oftidal bore fronts. Velocity measurements with high-temporal resolution showed a marked effect of the borepassage. Longitudinal velocities were characterisedby rapid flow deceleration at all vertical elevations,while large fluctuations of transverse velocities wererecorded beneath the front. Turbulent Reynolds stressdata highlighted high levels in the lower flow regionincluding next to the bed, and maximum normaland tangential stresses were observed immediatelyupstream of and at wave crests. Hence bed erosionmay take place beneath each wave crest, and the erodedmaterial and other scalars are advected in the “whelps”and wave motion behind the first wave crest. Thesewould be consistent with very-strong turbulence levelsobserved behind tidal bores in the field (Fig. 8).
While the present study allowed a detailed com-parison of the effects of undular bores, it was limitedto one set of initial flow conditions. Further worksshould encompass a wider range of inflow conditionsand surge generation, including positive surges propa-gating downstream and tidal bore flows with completeflow reversal.
ACKNOWLEDGEMENTS
The writers thank Professor Michele Mossa(Politecnico di Bari, Italy) for his valuable input. They
thank also Graham Illidge (The University of Queens-land) for his technical assistance. Hubert Chansonthanks all the people who provided him with rele-vant information, in particular Dr Eric Jones (Proud-man Oceanographic Laboratory) and Professor DavidHuntley (University of Plymouth, UK).
REFERENCES
Barré de Saint Venant, A.J.C. (1871). “Théorie et Equa-tions Générales du Mouvement Non Permanent des EauxCourantes.” Comptes Rendus des séances de l’Académiedes Sciences, Paris, France, Séance 17 July 1871, Vol. 73,pp. 147–154 (in French).
Bazin, H. (1865b). “Recherches Expérimentales sur la Propa-gation des Ondes.” Mémoires présentés par divers savantsà l’Académie des Sciences, Paris, France, Vol. 19, pp.495–644 (in French).
Benet, F., and Cunge, J.A. (1971). “Analysis of Experimentson Secondary Undulations caused by Surge Waves inTrapezoidal Channels.” Jl of Hyd. Res., IAHR, Vol. 9, No.1, pp. 11–33.
Benjamin, T.B., and Lighthill, M.J. (1954). “On CnoidalWaves and Bores.” Proc. Royal Soc. of London, SeriesA, Math. & Phys. Sc., Vol. 224, No. 1159, pp. 448–460.
Boussinesq, J.V. (1877). “Essai sur la Théorie des EauxCourantes.” Mémoires présentés par divers savants àl’Académie des Sciences, Paris, France, Vol. 23, Série 3,No. 1, supplément 24, pp. 1–680 (in French).
Chanson, H. (1995). “Flow Characteristics of UndularHydraulic Jumps. Comparison with Near-Critical Flows.”Report CH45/95, Dept. of Civil Engineering, Universityof Queensland, Australia, June, 202 pages.
Chanson, H. (2000). “Boundary Shear Stress Measurementsin Undular Flows: Application to Standing Wave BedForms.” Water Res. Res., Vol. 36, No. 10, pp. 3063–3076.
Chanson, H. (2001). “Flow Field in a Tidal Bore : a Physi-cal Model.” Proc. 29th IAHR Congress, Beijing, China,Theme E, Tsinghua University Press, Beijing, G. LI Ed.,pp. 365–373.
Chanson, H. (2004a). “The Hydraulics of Open Chan-nel Flows : An Introduction.” Butterworth-Heinemann,Oxford, UK, 2nd edition, 630 pages.
Chanson, H. (2004b). “Environmental Hydraulics ofOpen Channel Flows.” Elsevier Butterworth-Heinemann,Oxford, UK, 483 pages.
Chanson, H. (2005a). “Physical Modelling of the Flow Fieldin an Undular Tidal Bore.” Jl of Hyd. Res., IAHR, Vol. 43,No. 3, pp. 234–244.
Chanson, H. (2005b). “Tidal Bore Processes in the Baiedu Mont Saint Michel (France): Field Observations andDiscussion.” Proc. 31th Biennial IAHR Congress, Seoul,Korea, B.H. JUN, S.I. LEE, I.W. SEO and G.W. CHOIEditors, Theme E.4, Paper 0062, pp. 4037–4046.
Chanson, H., Trevethan, M., and Aoki, S. (2005). “AcousticDoppler Velocimetry (ADV) in a Small Estuarine System.Field Experience and “Despiking”.” Proc. 31th BiennialIAHR Congress, Seoul, Korea, B.H. JUN, S.I. LEE, I.W.SEO and G.W. CHOI Editors, Theme E2, Paper 0161, pp.3954–3966.
Chen, Jiyu, LIU, Cangzi, Zhang, Chongle, and Walker,H.J. (1990). “Geomorphological Development and
87
Sedimentation in Qiantang Estuary and Hangzhou Bay.”Jl of Coastal Res., Vol. 6, No. 3, pp. 559–572.
Donnelly, C., and Chanson, H. (2002). “Environmentalimpact of a Tidal Bore on Tropical Rivers.” Proc. 5thIntl River Management Symp., Brisbane, Australia, Sept.,3–6, 9 pages (PDF: www.uq.edu.au/∼e2hchans/reprints/riv02_1.pdf).
Donnelly, C., and Chanson, H. (2005). “EnvironmentalImpact of Undular Tidal Bores in Tropical Rivers.” Envi-ronmental Fluid Mechanics, Vol. 5, No. 5, pp. 481–494.
Favre, H. (1935). “Etude Théorique et Expérimentale desOndes de Translation dans les Canaux Découverts.”Dunod, Paris, France (in French).
Goring, D.G., and Nikora, V.I. (2002). “Despiking AcousticDoppler Velocimeter Data.” Jl of Hyd. Engrg.,ASCE, Vol.128, No. 1, pp. 117–126. Discussion: Vol. 129, No. 6, pp.484–489.
Henderson, F.M. (1966). “Open Channel Flow.” MacMillanCompany, New York, USA.
Hornung, H.G., Willert, C., and Turner, S. (1995). “The FlowField Downsteam of a Hydraulic Jump.” Jl of Fluid Mech.,Vol. 287, pp. 299–316.
Huntley, D.A. (2003), Person. Comm..Kjerfve, B., and Ferreira, H.O. (1993). “Tidal Bores: First
Ever Measurements.” Ciência e Cultura (Jl of the Brazil-ian Assoc. for the Advancement of Science), Vol. 45, No.2, March/April, pp. 135–138.
Koch, C., and Chanson, H. (2005). “An Experimental Studyof Tidal Bores and Positive Surges: Hydrodynamics andTurbulence of the Bore Front.” Report No. CH56/05,Dept. of Civil Engineering,The University of Queensland,Brisbane, Australia, July, 170 pages.
Lemmin, U., and Lhermitte, R. (1999). “ADV Measurementsof Turbulence: can we Improve their Interpretation ? Dis-cussion” Jl of Hyd. Engrg., ASCE, Vol. 125, No. 6, pp.987–988.
Lemoine, R. (1948). “Sur les Ondes Positives de Translationdans les Canaux et sur le Ressaut Ondulé de Faible Ampli-tude.” Jl La Houille Blanche, Mar-Apr., pp. 183–185 (inFrench).
Lespinasse, P. (2005). “Sons of the Moon / Les Fils de laLune.” Grand Angle Production, France, 50 min..
Lewis, A.W. (1972). “Field Studies of a Tidal Bore in theRiver Dee.” M.Sc. thesis, Marine Science Laboratories,University College of North Wales, Bangor, UK.
McLelland, S.J., and Nicholas, A.P. (2000). “A New Methodfor Evaluating Errors in High-Frequency ADV Measure-ments.” Hydrological Processes, Vol. 14, pp. 351–366.
Malandain, J.J. (1988). “La Seine au Temps du Mascaret.” LeChasse-Marée, No. 34, pp. 30–45 (in French).
Montes, J.S. (1979). “Undular Hydraulic Jump - Discussion.”Jl of Hyd. Div.,ASCE,Vol. 105, No. HY9, pp. 1208–1211.
Montes, J.S., and Chanson, H. (1998). “Characteristics ofUndular Hydraulic Jumps. Results and Calculations.” Jlof Hyd. Engrg., ASCE, Vol. 124, No. 2, pp. 192–205.
Piquet, J. (1999). “Turbulent Flows. Models and Physics.”Springer, Berlin, Germany, 761 pages.
Ponsy, J., and Carbonnell, M. (1966). “Etude Photogram-métrique d’Intumescences dans le Canal de l’Usined’Oraison (Basses-Alpes).” Jl Soc. Française de Pho-togram., Vol. 22, pp. 18–28.
Rouse, H. (1938). “Fluid Mechanics for Hydraulic Engi-neers.” McGraw-Hill Publ., New York, USA (also DoverPubl., New York, USA, 1961, 422 pages)
Sandover, J.A., and Holmes, P. (1962). “The Hydraulic Jumpin Trapezoidal Channels.” Water Power, Vol. 14, Nov., pp.445–449.
Serre, F. (1953). “Contribution à l’Etude des EcoulementsPermanents et Variables dans les Canaux.” Jl La HouilleBlanche, Dec., pp. 830–872 (in French).
Tachie, M.F. (2001). “Open Channel Turbulent BoundaryLayers and Wall Jets on Rough Surfaces.” Ph.D. thesis,Dept. of Mech. Eng., Univers. of Saskatchewan, Canada,238 pages.
Tessier, B., and Terwindt, J.H.J. (1994). “An Example of Soft-Sediment Deformations in an Intertidal Environment -TheEffect of a Tidal Bore”. Comptes-Rendus de l’Académiedes Sciences, Série II,Vol. 319, No. 2, Part 2, pp. 217–233.
Treske, A. (1994). “Undular Bores (Favre-Waves) in OpenChannels - Experimental Studies.” Jl of Hyd. Res., IAHR,Vol. 32, No. 3, pp. 355-370. Discussion : Vol. 33, No. 3,pp. 274–278.
Wahl, T.L. (2003). “Despiking Acoustic Doppler VelocimeterData. Discussion.” Jl of Hyd. Engrg.,ASCE, Vol. 129, No.6, pp. 484–487.
Wolanski, E., Williams, D., Spagnol, S., and Chanson, H.(2004). “Undular Tidal Bore Dynamics in the Daly Estu-ary, Northern Australia.” Estuarine, Coastal and ShelfScience, Vol. 60, No. 4, pp. 629–636.
Xie, Q. (1998). “Turbulent flows in non-uniform open chan-nels: experimental measurements and numerical mod-elling.” Ph.D. thesis, Dept. of Civil Eng., University ofQueensland, Australia, 339 pages.
88