a robust design of an innovative shaped rebar system using...
TRANSCRIPT

RESEARCH PAPER
A robust design of an innovative shaped rebar system using a noveluncertainty model
Nada Aldoumani1 & Hamed Haddad Khodaparast1 & Cinzia Giannetti1 & Zakaria Abdallah1& Ian M. Cameron1
&
Michael I. Friswell1 & Johann Sienz1
Received: 6 April 2018 /Revised: 9 July 2018 /Accepted: 10 July 2018 /Published online: 17 August 2018# The Author(s) 2018
AbstractThe current paper has investigated a newly developed re-bar system by implementing uncertainty models to optimise itsgeometry. The study of the design parameters of this re-bar system has been carried out utilising a novel uncertainty model thathas been developed at Swansea University. The importance of this invention comes from the fact that the whole process ofoptimisation has been automated by linking ANSYSWorkbench toMATLAB via the in-house written code, Despite the fact thatin the past, ANSYS APDL was linked to MATLAB, however, the APDL was very limited to only simple geometries andboundary conditions unlike the Workbench which can simulate complex features. These shortfalls have been overcome byautomating the process of optimisation, identifying the key influential parameters and the possibility to carry out a huge numberof trials. Moreover, the tools that have been developed can pave the way for robust optimisation of this proposed structure. Theuncertainty in the design parameters of this re-bar system is of a paramount importance in order to optimise the bond strengthbetween the newly developed rebar and the concrete matrix as well as to fully understand the behaviour of the proposed systemunder pull-out conditions. The interface between the rebar and the concrete matrix was considered as a ‘cohesive zone’ wherebythe interfacial area is studied as a function of the bonding strength.
Keywords Robust design . Rebar systems . Bond strength . Concrete . Uncertainty . ANSYS .MATLAB
1 Introduction
For an optimal design of reinforced concrete structures, effi-cient and reliable transfer of stresses between the reinforcementand the concrete is required. The transfer of such stresses fromthe reinforcement to the surrounding concrete takes place oncethe reinforcement deforms. In other words, after the initial slipof the bar, the stresses are transferred by bearing friction, asshown in Fig. 1. The transfer of the axial force from the rein-forcing steel bars to the surroundings matrix is facilitated by thedevelopment of tangential stresses along the interfacial area andthese are the necessary bond stress to hold the components
together. This means that the bond strength is dependent onthe interaction between the steel bar and the surrounding ma-trix. Moreover, it depends on the mechanical properties of theconcrete, volume of concrete around the bars, the surface con-dition of the bar alongside the geometry of the bar. Moreover, itrelies on the diameter of the bars alongside the loading age(ACI Committee 2016). The design of conventional bar sys-tems includes ‘ribs’ of certain size and shape. These ribs play akey role in the transfer of stresses between the reinforcementand the surrounding matrix. For instance, for plain bars, thefailure occurs due to the loss of adhesion between the barsand the cement paste. This means that the failure stress is pro-portional to the interface area between the two constituents. Onthe other hand, when ribs are used, strength in the slipping isdue, mainly, to the strength that the concrete offers to the pres-sures exercised on it by the ribs. This means that the chemicaladhesion has a less importance in this case when compared tothe mechanical interaction between the ribs and the surround-ing matrix (Barbosa et al. 2008).
Overall, the plain systems rely on the adhesion as well asfriction whereas those are of less importance in deformed bars
Responsible Editor: W. H. Zhang
* Zakaria [email protected]
1 The Advanced Sustainable Manufacturing Technologies (ASTUTE)Project, College of Engineering, Swansea University, Fabian Way,Swansea SA1 8EN, UK
Structural and Multidisciplinary Optimization (2018) 58:1351–1365https://doi.org/10.1007/s00158-018-2050-z

with ribs wherein the effect of mechanical interlocking andshear along the interfacial area are of utmost importance.The surface roughness and the closely spaced ribs producegreat interlocking with good bearing effects. In the same con-text, the stress parallel to the bar is termed as the ‘bond stress’whereas that perpendicular to the contact surface is called the‘radial stress’. There has been an extensive research on theeffect of the resultant stress of the combined bond stress andthe radial stress in such structures. It has been revealed thatchanging the stresses in the parallel and transverse directionshas resulted in the formation of primary and secondary cracksin the concrete adjacent to the bar, Fig. 2, (Kabir and Islam2014).
It is possible to increase the bond between the bar and theconcrete by increasing the surface area of the bar whereby alarger bonding strength is obtained. This requires re-shapingthe currently employed standard bars in such a way that pro-vides increased bond strength. Many research studies haveconcentrated on the shape of the rebar system as well as theaspect ratio of the steel with respect to the cross sectionaldimension. The addition of some features such as the dovetail
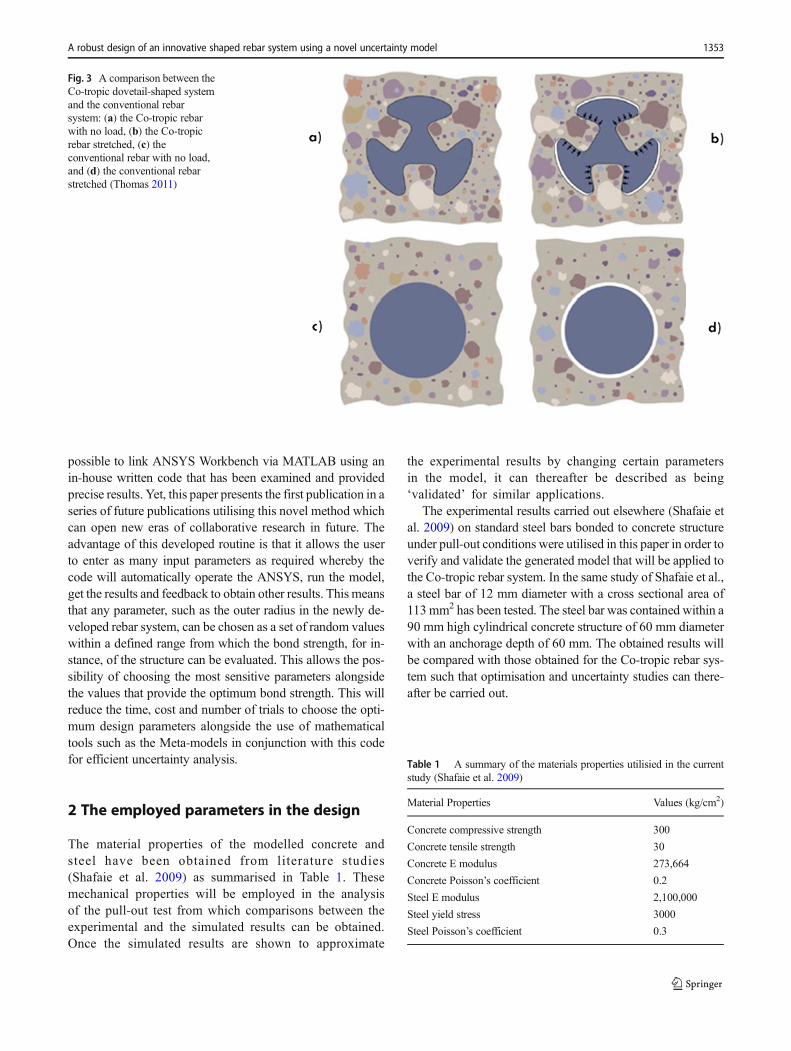
design that provides an increased lateral surface area is themain scope of the Co-tropic rebar systems. This dovetail de-sign is not a material dependent. In other words, it can beapplied to other materials that can be extruded and drawn tosize. The shape of this rebar system contains multiple re-entrant dovetail-shaped grooves in which the open end ofthe groove is narrower than the closed end of the groove.This modification of the shape has increased the surface areaby 1.9 times the conventional solid round rebars of an equiv-alent diameter (Thomas 2011). This modern design of the Co-tropic rebar system provides an ‘interlocking’ feature thatmakes use of the positive Poisson’s ratio contraction whenthe rebar is subjected to tensile loading. When the rebar isunder tensile loads, only the tops of ridges or surface of thefibres will debond while the sides of the dovetail groovescontract inwards and squeeze the concrete within the groove,as shown in Fig. 3a) and Fig. 3b). This action provides animproved bonding strength in contrast to the conventionalsystems whereby the stretching of the solid round bar canresult in an interfacial separation from the matrix Fig. 3c)and Fig. 3d), (Thomas 2011).
The main scope of the current paper is to explore the sen-sitivity of the various parameters in the newly developed rebarsystem. That is, the performance of the bonding strength be-tween the rebar system and the surrounding matrix is influ-enced bymany parameters such as the outer radius of the rebarsystem, the groove radius, the distance between the centre ofthe rebar shape to the centre of the cutout shape, the radius ofthe edges alongside the angle from one edge to the successiveedge within the same groove. This exercise will employ un-certainty studies using an innovative model that has been de-veloped at Swansea University. In this regard, it has become
Fig. 1 A deformed bar during the transfer of forces from thereinforcement to the surrounding concrete (ACI Committee 2016)
Fig. 2 (a) Force componentsparallel and perpendicular to thesteel concrete interface (b) Shearstress distribution in XYplane ofconcrete (Kabir & Islam 2014)
1352 Aldoumani et al.
possible to link ANSYS Workbench via MATLAB using anin-house written code that has been examined and providedprecise results. Yet, this paper presents the first publication in aseries of future publications utilising this novel method whichcan open new eras of collaborative research in future. Theadvantage of this developed routine is that it allows the userto enter as many input parameters as required whereby thecode will automatically operate the ANSYS, run the model,get the results and feedback to obtain other results. This meansthat any parameter, such as the outer radius in the newly de-veloped rebar system, can be chosen as a set of random valueswithin a defined range from which the bond strength, for in-stance, of the structure can be evaluated. This allows the pos-sibility of choosing the most sensitive parameters alongsidethe values that provide the optimum bond strength. This willreduce the time, cost and number of trials to choose the opti-mum design parameters alongside the use of mathematicaltools such as the Meta-models in conjunction with this codefor efficient uncertainty analysis.
2 The employed parameters in the design
The material properties of the modelled concrete andsteel have been obtained from literature studies(Shafaie et al. 2009) as summarised in Table 1. Thesemechanical properties will be employed in the analysisof the pull-out test from which comparisons between theexperimental and the simulated results can be obtained.Once the simulated results are shown to approximate
the experimental results by changing certain parametersin the model, it can thereafter be described as being‘validated’ for similar applications.
The experimental results carried out elsewhere (Shafaie etal. 2009) on standard steel bars bonded to concrete structureunder pull-out conditions were utilised in this paper in order toverify and validate the generated model that will be applied tothe Co-tropic rebar system. In the same study of Shafaie et al.,a steel bar of 12 mm diameter with a cross sectional area of113mm2 has been tested. The steel bar was contained within a90 mm high cylindrical concrete structure of 60 mm diameterwith an anchorage depth of 60 mm. The obtained results willbe compared with those obtained for the Co-tropic rebar sys-tem such that optimisation and uncertainty studies can there-after be carried out.
Fig. 3 A comparison between theCo-tropic dovetail-shaped systemand the conventional rebarsystem: (a) the Co-tropic rebarwith no load, (b) the Co-tropicrebar stretched, (c) theconventional rebar with no load,and (d) the conventional rebarstretched (Thomas 2011)
Table 1 A summary of the materials properties utilisied in the currentstudy (Shafaie et al. 2009)
Material Properties Values (kg/cm2)
Concrete compressive strength 300
Concrete tensile strength 30
Concrete E modulus 273,664
Concrete Poisson’s coefficient 0.2
Steel E modulus 2,100,000
Steel yield stress 3000
Steel Poisson’s coefficient 0.3
A robust design of an innovative shaped rebar system using a novel uncertainty model 1353
3 The ANSYS model
The ANSYS 16.2 Workbench finite element (FE) packagewas used to carry out the modeling. The applied load wasiterated step by step using the Newton-Raphson method. Inthis paper, SOLID185 has been used for the modeling ofthe steel bar and concrete. It has been defined by eightnodes having three degrees of freedom at each node andtranslations in the nodal x, y, and z directions. The elementhas plasticity, hyperelasticity, stress stiffening, creep, largedeflection and large strain capabilities. It also has mixedformulation capability for simulating deformations of nearlyincompressible elastoplastic materials and fully incompress-ible hyperelastic materials (Mahmoud 2016). At the inter-face of the steel rebar and the concrete, interface elementshave been employed whereby the steel rebar surface istreated as the “target” surface and simulated using elementTARGE170 while the concrete surface is treated as the“contact” surface and simulated by element CONTA174.The target elements and contact elements must be set to
the same real constant number. These elements are able tosimulate the existence of pressure between them when thereis either a contact or separation between them. The twomaterial contacts also take into account the cohesion be-tween the involved parameters (ANSYS Inc. 2012). Suchelements allow the separation of the bonded contact tosimulate the delamination of the interface. Moreover, theyare considered higher order elements that are able to pro-vide more accurate results for quadrilateral mesh and cantolerate irregular shapes without much loss of accuracy.The Pure Penalty Method (penetration and no sliding)(Doyle 2012; ANSYS 2010; You 2013) has been used inthe tangential direction while using the conditions of theLagrange Multiplier method which involves sliding withno penetration according to (ANSYS 2010):
Ftangential ¼ K tangential : X sliding
Where Ftangential is the tangential force between the sur-faces, Ktangential is the tangential stiffness between the
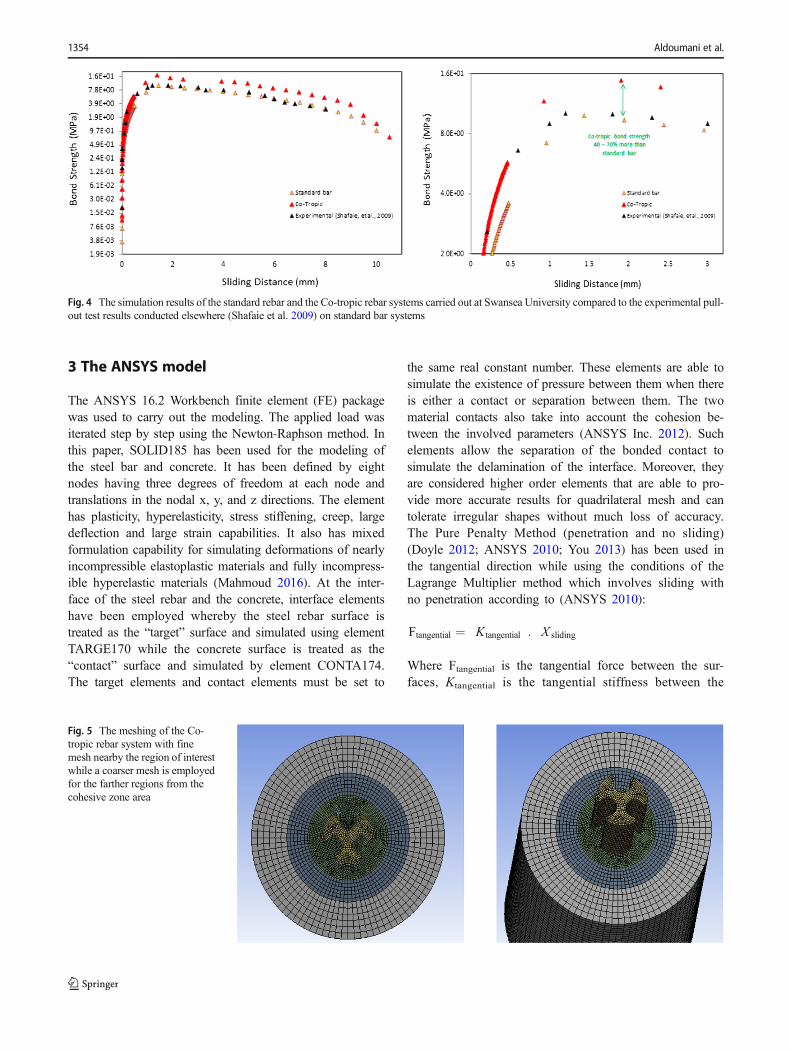
Fig. 4 The simulation results of the standard rebar and the Co-tropic rebar systems carried out at Swansea University compared to the experimental pull-out test results conducted elsewhere (Shafaie et al. 2009) on standard bar systems
Fig. 5 The meshing of the Co-tropic rebar system with finemesh nearby the region of interestwhile a coarser mesh is employedfor the farther regions from thecohesive zone area
1354 Aldoumani et al.

surfaces and Χsliding is the sliding distance as a result of theapplied force. The value of Χsliding is ideally zero for stick-ing conditions, however, some slip is allowed in our case.This will require chattering control parameters as well as amaximum allowable elastic slip (ELSI) parameter (i.e.Ktangential), (Doan 2013). In addition to the above boundaryconditions, the ‘cohesive zone material’ model has beenused to model the delamination process of the interface(i.e. debonding). The adhesion properties of the utilisedadhesive were entered via the ‘cohesive zone material mod-el’ with ‘bi-linear’ behaviour mode and these were allocat-ed for the contact elements of the model. To define a bi-linear material’s behaviour of adhesion, the separation dis-tance and the constant properties of the adhesive material,the TBDATA command in ANSYS was used. In this case,the properties of the concrete have been defined by the user(ANSYS 2009; ANSYS 2012).
4 The robust design and uncertainty analsyis
Research studies by Bryne and Taguchi and colleagues repre-sent the first efforts in developing robust designs. They haveintroduced methods to minimise the effect of uncontrollableparameters during the design stage (Bryne 1987; Taguchi1989). Further studies by Ross and colleagues employed theTaguchi loss function to make the design more tolerable tomodel variations (Ross 1995). Other researchers proposed
methods to reduce the variations in input parameters to obtaindesigns with lower sensitivities to design parameters(Ramakrishnan 1991). They have suggested a method for ro-bust design with the Taguchi loss function as the object that issubjected to the model constraints. This allows the constantand variable sensitivities from controllable and uncontrollableparameters to be reduced using non-linear analysis. On theother hand, Padulo has investigated two main approaches forrobust optimization in which the parameters are stochastic.The purpose of uncertainty in this case was to identify theuncertainties in input and output of a system or simulation tool(Padulo 2008). In structural analysis, it has become essentialto determine the relationship between the various parameterswith respect to the component geometry, the applied load, thematerial properties, and the contour conditions. In general, themain sources of uncertainty are associated with the propertiesof the adhesive, the geometry, material, load direction along-side many other factors (Neto and Rosa 2008). Other scholarshave extended the use of uncertainty models on various ma-terials and structures which has facilitated the design and op-timisation exercise of structures (Wang and Al 2018a), (Wangand Al 2018b), (Wang and Al 2017a), (Wang and Al 2017b).
In this paper, the shape of the bar has been explored for theanalysis. Various parameters have been investigated afterwhich the most sensitive ones have been considered. In thiscontext, 1000 random runs of the chosen parameters havebeen carried out from the space of input parameters. The
Fig. 6 The parameters of interestin the Co-tropic rebar system thathave been investigated
Fig. 7 The process of adding constraints to the geometry of the Co-tropicdesign while changing the design parameters Fig. 8 The definition of R1 in the Co-tropic rebar system
A robust design of an innovative shaped rebar system using a novel uncertainty model 1355
utilisation of 1000 trials was based on the fact that beyond thisnumber the results would make no significant improvement asthey have already converged at around the 1000th trial. TheMonte Carlo simulation approach has been employed to ob-tain the corresponding 1000 outputs which represent the bond-ing strength of the structure. Afterwards, the Kernel probabil-ity distribution function has been estimated from the sampledata using the Kernel Smoothing density function inMATLAB (R2013b). Regions of the acceptable output bond-ing strength were defined such that the bonding strength inthose regions is desired for the design. The new advancementin the current paper is the creation of an automated script filethat allows the designer to modify the parameters of complexgeometries without the need to work with the ANSYS envi-ronment. That is to say, the MATLAB and ANSYS work-bench interact with each other and the parameters are modifiedfollowing this approach. This allows more flexibility to dealwith complex geometries since this was, in the past, onlyrestricted to simple designs.The framework for robust designproposed and employed by the same authors on carbon fibrecomposite materials bonded to aluminium connectors has re-cently been published elsewhere (Aldoumani et al. 2016). Thecode can be used for any future collaborative work on anyengineering application that involves uncertainties in the de-sign, manufacturing and operating conditions.
5 Results and discussion
5.1 The validity of the employed model
The model has first been validated under pull-out conditionsusing experimental data from literature studies (Shafaie et al.2009). In the study of Shafaie et al., the numerical investiga-tions were conducted using the finite element softwareANSYS and have used a detailed model in 3D mode withand without the bond-slip effects. A cohesive layer was
employed to simulate the bond behaviour. Since the ribs weresimulated, the mesh size close to the rib in the steel bar, con-crete and cohesion layer was small enough to accurately de-scribe the deformation and stress gradients. However, the re-maining parts of the geometry contained a coarser mesh sizein order to reduce the computational costs. The obtained re-sults in their study have shown a significant consistency be-tween the experimental data and the analytical simulations interms of the trend of the bond behaviour. However, there was aslight reduction of about 10% in the bond strength in thecalculated results when compared to the actual measurements.Even though, the simulation results were quite promising de-spite the small variation in the bond strength. On the otherhand, when the standard rebar system, i.e. with ribs, was sim-ulated at Swansea University using the same parametersemployed elsewhere (Shafaie et al. 2009) under pull-out con-ditions, the results were extremely identical to those obtainedexperimentally by Shafaie et al., Fig. 4, with less than 2%error between the experimental data and the model developedduring this study. This means that the employed model in thepresent study proved to be more precise than those employedin the other research studies. This has provided more
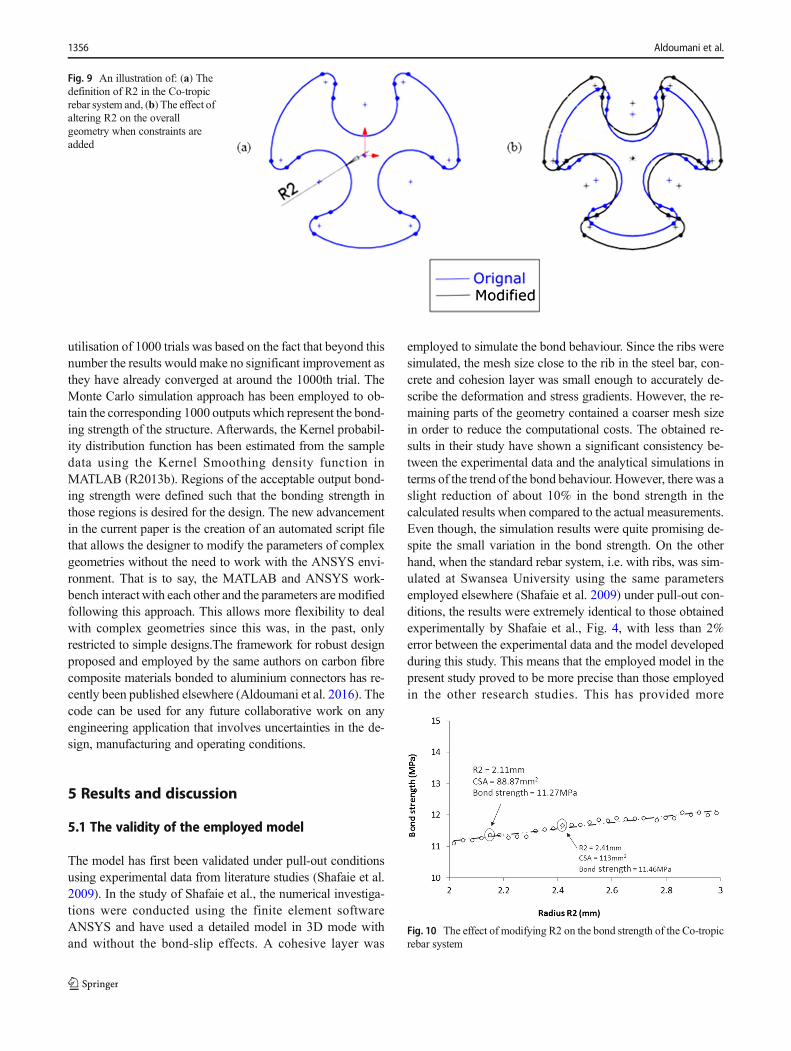
Fig. 9 An illustration of: (a) Thedefinition of R2 in the Co-tropicrebar system and, (b) The effect ofaltering R2 on the overallgeometry when constraints areadded
Fig. 10 The effect of modifying R2 on the bond strength of the Co-tropicrebar system
1356 Aldoumani et al.
confidence in the model that will be applied to the Co-tropicrebar system. The results of the simulation using this model onthe Co-tropic rebar have revealed that this novel system pro-vides a higher strength in excess of 40–70% when comparedto the conventional rebar system. In other words, the newgeometry provided by the Co-tropic system has a direct influ-ence on the bond strength to the concrete and hence the overallperformance of the reinforced concrete.
5.2 The investigated parameters in the co-troipc rebarsystem
In order to obtain precise results from the simulation, the meshsize varied from the interface area to the outer regions of thestructures. In other words, a very fine mesh was created for theCo-tropic rebar, interfacial area and the surrounding matrixnearby the rebar region. Away from this region, the mesh sizewas increased in order to reduce the time required to completethe analysis. The fine mesh will ensure that the cohesive zoneregion which is of utmost interest will provide very preciseresults when such a fine mesh is employed. At the outer re-gions, the deformation and analysis is of less importancehence the mesh has been coarser, Fig. 5.
A parameterisation process has been employed such thateach parameter in the geometry is studied separately in orderto determine the most significant parameters that affect thebonding strength of the rebar and the concrete. The parametersthat were studied in the current project are R1, R2, R3, R4 andα as shown in Fig. 6. This method also allows the shape to beoptimised in order to obtain the highest bond strength at theinterface between the rebar and the surrounding concrete ma-trix. The definition of each parameter will shortly be coveredin the current paper.
In order to obtain consistent results under all simulationconditions, the geometry has been constrained such that underany variation in any of the parameters, the shape of the rebarremains the same. This was possible using the CAD softwarein order to maintain a similar geometry for all simulations
while the parameters are altered. The reason for the use of thisconstraint is that when the parameters were altered at the ini-tial trials, the shape of the rebar has completely beenmodified,i.e. becomes completely different from the dovetail design.This would have been unacceptable since it does not help withthe scope of the current paper as well as will not provide anoptimisation of the parameters under investigation. The axesof constrains for the dovetail rebar system are shown in Fig. 7.
5.3 The sensitivity study of the parameters
The outer radius R1, shown in Fig. 8, is the distance from thecentre of the rebar to the tangent of the outer surface. Thisparameter has a direct influence on the cross sectional areaof the bar in addition to having an effect on the outer interfa-cial surface area which represents the boundary between therebar and the concrete. The larger the outer surface area thebetter the bonding strength between the rebar and the sur-rounding matrix. For instance, when R1 was taken as8.0 mm, the cross sectional area of the rebar was 113.0 mm2
in comparison to 312.0 mm2 when R1 was taken as 12.0 mm.In other words, it is clear that any increase in R1 will alwaysincrease the bonding strength due to the increased outer
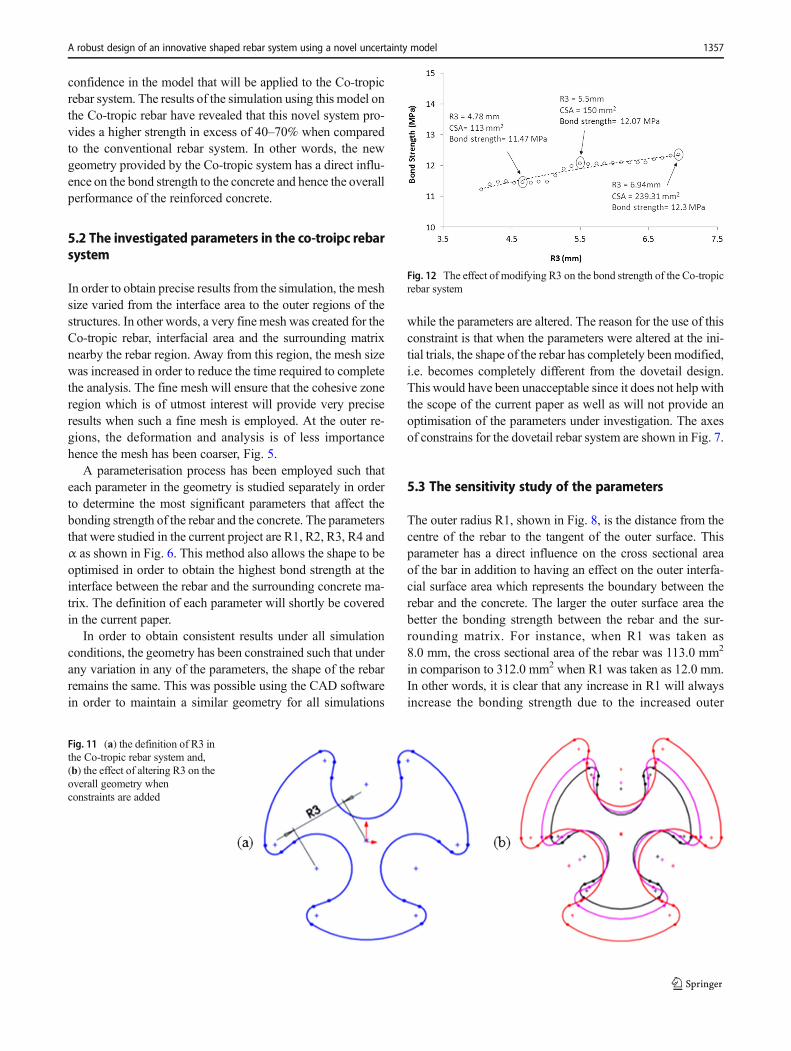
Fig. 11 (a) the definition of R3 inthe Co-tropic rebar system and,(b) the effect of altering R3 on theoverall geometry whenconstraints are added
Fig. 12 The effect of modifying R3 on the bond strength of the Co-tropicrebar system
A robust design of an innovative shaped rebar system using a novel uncertainty model 1357
surface area and hence the interfacial bond. For this reason,the variation of R1 was not considered in the analysis since itonly provides basic information that can be easily drawn with-out the need for any further simulation.
On the other hand, the parameter R2 is the groove radiuswhich represents the radius of the cut-out groove, Fig. 9a). InFig. 9b), the effect of adding constraints to the geometry of therebar system can be more clearly seen. In this figure, it can beseen even though the value of R2 has been altered, the geom-etry of the rebar system is maintained which is a great advan-tage in the current optimisation exercise.
The range of R2 within which the study was carriedout was between 2.0–3.0 mm in order to not significantlyincrease the cross sectional area of the rebar system. Theinfluence of changing R2 can be seen in Fig. 10, whereinthe light-blue coloured text presents information aboutthe point which represents the original shape of a crosssectional area of 113.0 mm2 whereas the black colouredtext is related to that calculated when R2 was taken as2.11 mm with a cross sectional area of 88.87 mm2. Interms of bond strength, the reduction of R2 has resultedin a reduction in the interfacial bond strength which isundesirable. This means that the gripping effect continu-ously decreases when R2 is decreased. Overall, whenlooking at the whole graph, it can be seen that the effectof reducing R2 has a minimal effect on the bondstrength. In other words, the value of the bond strengthis not significantly sensitive to the change in R2 whichmakes this parameter of less interest in the current anal-ysis. The chosen range between 2.0–3.0 mm ensures thatthe ‘butterfly’ shape of the rebar remains the same asbeyond this range the geometry will be modified whichis undesirable.
On the other hand, the distance R3 is defined in Fig. 11 (a)as the distance between the centre of the rebar to the centre ofthe cut-out groove. The effect of constraints is shown inFig. 11 (b) wherein the alteration of R3 affects the variousparameters; however, the overall shape of the Co-tropic rebaris maintained.
The influence of R3 on the overall bond strength issummarised in Fig. 12. It is evident that any decrease in R3results in a significant decrease in the cross sectional area witha minimal decrease in the bond strength, i.e. the grippingeffect. This means that the reduction of R3 leads to a reductionin the interfacial area between the rebar and the surroundingmatrix and therefore provides a reduced bonding strength ofthe structure.This makes this parameter of less interest as itdoes not significantly affect the overall bond strength of therebar system. It is worthwhile mentioning that the originalshape in Fig. 12 is that with an area of 113.0 mm2 (i.e. theblack coloured measurement).
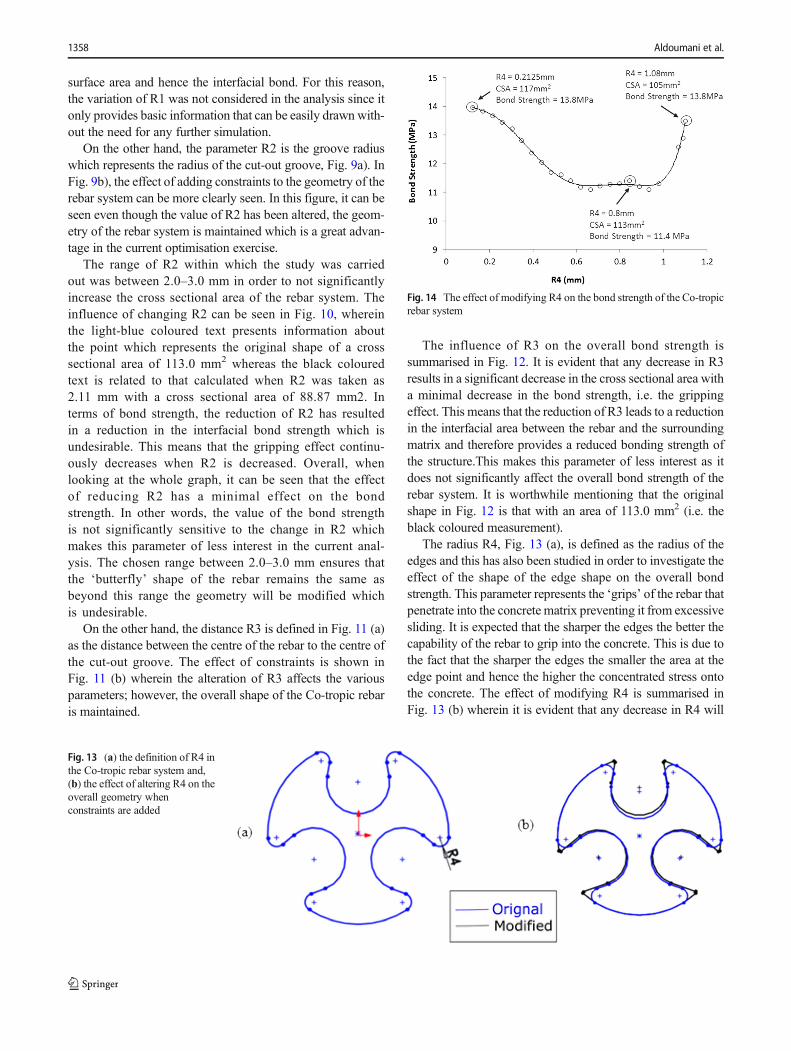
The radius R4, Fig. 13 (a), is defined as the radius of theedges and this has also been studied in order to investigate theeffect of the shape of the edge shape on the overall bondstrength. This parameter represents the ‘grips’ of the rebar thatpenetrate into the concrete matrix preventing it from excessivesliding. It is expected that the sharper the edges the better thecapability of the rebar to grip into the concrete. This is due tothe fact that the sharper the edges the smaller the area at theedge point and hence the higher the concentrated stress ontothe concrete. The effect of modifying R4 is summarised inFig. 13 (b) wherein it is evident that any decrease in R4 will
Fig. 13 (a) the definition of R4 inthe Co-tropic rebar system and,(b) the effect of altering R4 on theoverall geometry whenconstraints are added
Fig. 14 The effect of modifying R4 on the bond strength of the Co-tropicrebar system
1358 Aldoumani et al.
result in sharper edges. In this figure, the original shape is thelight blue coloured dovetail of a cross sectional area of113.0 mm2 whereas that which has been modified with sharp-er edges, i.e. smaller R4, is plotted in black. The modificationof R4 has caused a slight modification to the overall rebardesign; however, the basic geometry of the dovetail is main-tained due to the applied constraints.
The relation between R4 and the bond strength issummarised in Fig. 14. The bond strength is significantly in-fluenced by the change in R4 when looking at the initial ge-ometry of 113.0 mm2. It can be seen that the decrease in R4leads to a significant improvement in terms of the bondstrength reaching a value of 13.8 MPa. Similarly, the increasein R4 starting from the initial geometry has also resulted in anincrease of the bond strength reaching a value of 13.5 MPa.This means that this parameter can improve the bond strengthwithout causing an excessive increase/decrease in the crosssectional area as can be seen in the three circled trials inFig. 14. This makes this parameter worth investigating interms of uncertainty and robust design as will be shown laterin the current study.
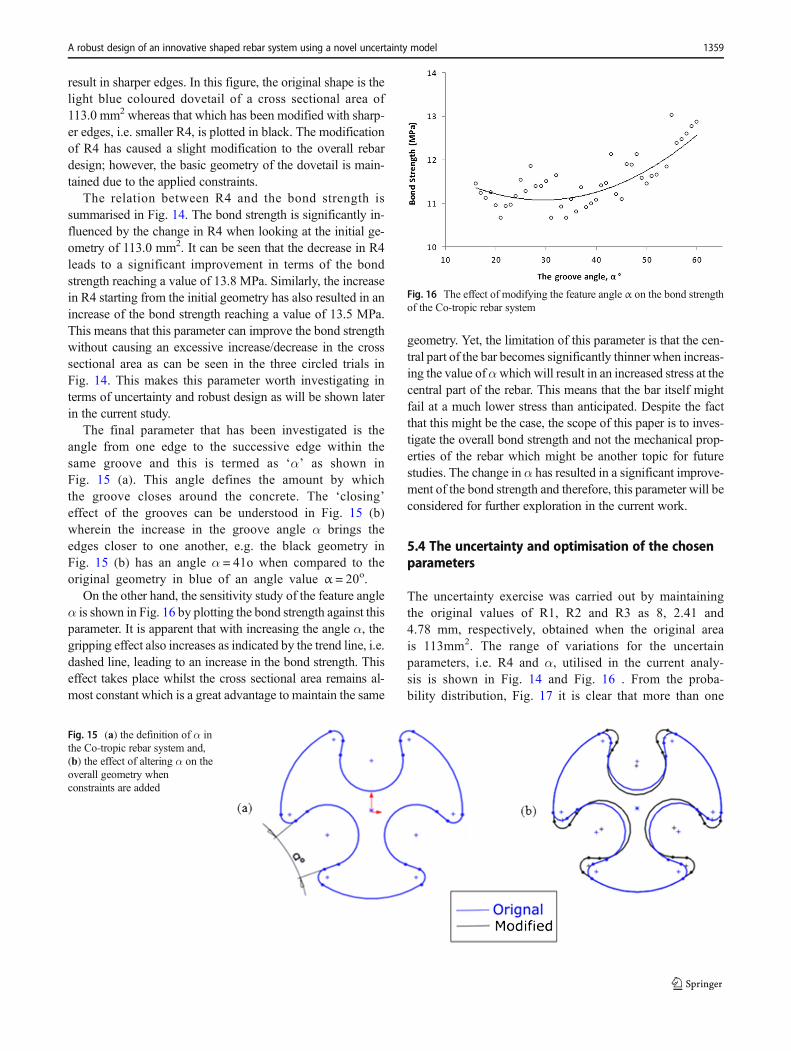
The final parameter that has been investigated is theangle from one edge to the successive edge within thesame groove and this is termed as ‘α’ as shown inFig. 15 (a). This angle defines the amount by whichthe groove closes around the concrete. The ‘closing’effect of the grooves can be understood in Fig. 15 (b)wherein the increase in the groove angle α brings theedges closer to one another, e.g. the black geometry inFig. 15 (b) has an angle α = 41o when compared to theoriginal geometry in blue of an angle value α = 20o.
On the other hand, the sensitivity study of the feature angleα is shown in Fig. 16 by plotting the bond strength against thisparameter. It is apparent that with increasing the angle α, thegripping effect also increases as indicated by the trend line, i.e.dashed line, leading to an increase in the bond strength. Thiseffect takes place whilst the cross sectional area remains al-most constant which is a great advantage to maintain the same
geometry. Yet, the limitation of this parameter is that the cen-tral part of the bar becomes significantly thinner when increas-ing the value ofαwhich will result in an increased stress at thecentral part of the rebar. This means that the bar itself mightfail at a much lower stress than anticipated. Despite the factthat this might be the case, the scope of this paper is to inves-tigate the overall bond strength and not the mechanical prop-erties of the rebar which might be another topic for futurestudies. The change in α has resulted in a significant improve-ment of the bond strength and therefore, this parameter will beconsidered for further exploration in the current work.
5.4 The uncertainty and optimisation of the chosenparameters
The uncertainty exercise was carried out by maintainingthe original values of R1, R2 and R3 as 8, 2.41 and4.78 mm, respectively, obtained when the original areais 113mm2. The range of variations for the uncertainparameters, i.e. R4 and α, utilised in the current analy-sis is shown in Fig. 14 and Fig. 16 . From the proba-bility distribution, Fig. 17 it is clear that more than one
Fig. 15 (a) the definition of α inthe Co-tropic rebar system and,(b) the effect of altering α on theoverall geometry whenconstraints are added
Fig. 16 The effect of modifying the feature angle α on the bond strengthof the Co-tropic rebar system
A robust design of an innovative shaped rebar system using a novel uncertainty model 1359

third of the examined samples have shown a bondingstrength of about 12 MPa exceeding that found in theliterature for the conventional rebar systems of 10 MPa(Shafaie et al. 2009). This means that the employedmodel in this report agrees well with that of the con-ventional systems and provides satisfactory results. Onthe other hand, the change in R4 and α have also pro-vided very strong bond strength reaching a value ofaround 15 MPa which is very desirable. For the purposeof uncertainty and optimization, the acceptable level inthe current investigation was taken above 15 MPa. Thiswill reduce the number of samples that provide an ac-ceptable level of bonding strength as well as providethe best bond performance which is higher than thatobtained by standard rebar systems.
When plotting R4 against the bonding strength, Fig. 18, itcan be seen that the highest bonding strength is observed at R4
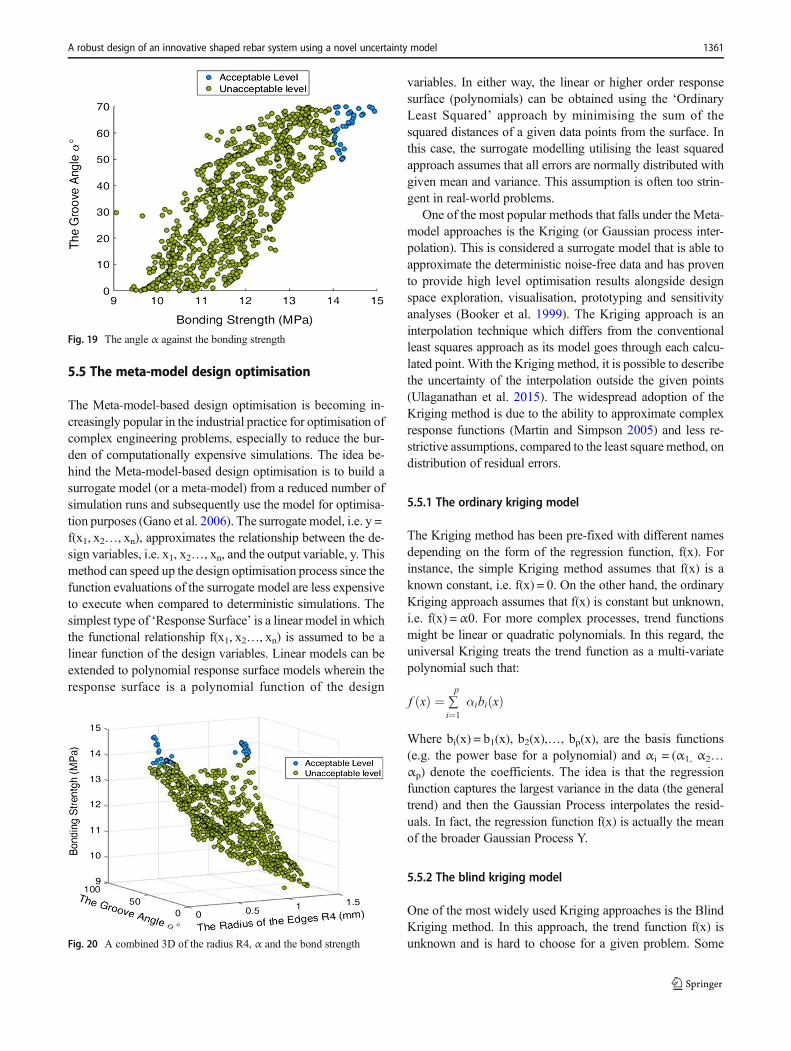
values of 0.1–0.4 and 1.0–1.2 mm (circled). Moreover, whenplotting the angle α against the bonding strength, Fig. 19, itcan clearly be seen that the optimum strength is attained atangles between 50 – 70o.
In order to obtain a clear understanding of these re-sults, a combined 3D plot was created as shown inFig. 20. It has been observed that the best bondingstrength was obtained at an angle of 60o. From a mate-rials point of view in terms of cost saving, the value ofR4 between 1.0–1.2 mm has resulted in a reduced crosssectional area of 105.15 mm2 when compared to theoriginal area of 113mm2 or to the area 123.54mm2
when R4 was 0.1–0.4 mm. This means that the valuesof R4 that will be considered will be those between1.0–1.2 mm. This reduces the problem of optimisationand makes it simple to run the robust analysis as it willbe discussed later.
Fig. 17 The probabilitydistribution of the samples
Fig. 18 The radius R4 against thebonding strength (C.A. means theCross-sectional Area)
1360 Aldoumani et al.
5.5 The meta-model design optimisation
The Meta-model-based design optimisation is becoming in-creasingly popular in the industrial practice for optimisation ofcomplex engineering problems, especially to reduce the bur-den of computationally expensive simulations. The idea be-hind the Meta-model-based design optimisation is to build asurrogate model (or a meta-model) from a reduced number ofsimulation runs and subsequently use the model for optimisa-tion purposes (Gano et al. 2006). The surrogate model, i.e. y =f(x1, x2…, xn), approximates the relationship between the de-sign variables, i.e. x1, x2…, xn, and the output variable, y. Thismethod can speed up the design optimisation process since thefunction evaluations of the surrogate model are less expensiveto execute when compared to deterministic simulations. Thesimplest type of ‘Response Surface’ is a linear model in whichthe functional relationship f(x1, x2…, xn) is assumed to be alinear function of the design variables. Linear models can beextended to polynomial response surface models wherein theresponse surface is a polynomial function of the design
variables. In either way, the linear or higher order responsesurface (polynomials) can be obtained using the ‘OrdinaryLeast Squared’ approach by minimising the sum of thesquared distances of a given data points from the surface. Inthis case, the surrogate modelling utilising the least squaredapproach assumes that all errors are normally distributed withgiven mean and variance. This assumption is often too strin-gent in real-world problems.
One of the most popular methods that falls under the Meta-model approaches is the Kriging (or Gaussian process inter-polation). This is considered a surrogate model that is able toapproximate the deterministic noise-free data and has provento provide high level optimisation results alongside designspace exploration, visualisation, prototyping and sensitivityanalyses (Booker et al. 1999). The Kriging approach is aninterpolation technique which differs from the conventionalleast squares approach as its model goes through each calcu-lated point. With the Kriging method, it is possible to describethe uncertainty of the interpolation outside the given points(Ulaganathan et al. 2015). The widespread adoption of theKriging method is due to the ability to approximate complexresponse functions (Martin and Simpson 2005) and less re-strictive assumptions, compared to the least square method, ondistribution of residual errors.
5.5.1 The ordinary kriging model
The Kriging method has been pre-fixed with different namesdepending on the form of the regression function, f(x). Forinstance, the simple Kriging method assumes that f(x) is aknown constant, i.e. f(x) = 0. On the other hand, the ordinaryKriging approach assumes that f(x) is constant but unknown,i.e. f(x) =α0. For more complex processes, trend functionsmight be linear or quadratic polynomials. In this regard, theuniversal Kriging treats the trend function as a multi-variatepolynomial such that:
f xð Þ ¼ ∑i¼1
pαibi xð Þ
Where bi(x) = b1(x), b2(x),…, bp(x), are the basis functions(e.g. the power base for a polynomial) and αi = (α1, α2…αp) denote the coefficients. The idea is that the regressionfunction captures the largest variance in the data (the generaltrend) and then the Gaussian Process interpolates the resid-uals. In fact, the regression function f(x) is actually the meanof the broader Gaussian Process Y.
5.5.2 The blind kriging model
One of the most widely used Kriging approaches is the BlindKriging method. In this approach, the trend function f(x) isunknown and is hard to choose for a given problem. Some
Fig. 19 The angle α against the bonding strength
Fig. 20 A combined 3D of the radius R4, α and the bond strength
A robust design of an innovative shaped rebar system using a novel uncertainty model 1361
feature selectionmethods sometimes offer the possibility to iden-tify the most plausible interactions occurring in the data (Guyon& Elisseeff, 2003). The Blind Kriging is used to efficiently de-termine the basis functions, or features, that capture the mostvariance in the sample data. In this respect, a set of candidatefunctions is considered fromwhich to choose for the problem. Inthe ideal case the sample data is almost fully represented by thechosen trend function and the stochastic process Z(x) has little orno influence. The idea is to select new features to be incorporatedin the regression function of this Kriging model, taking intoaccount features that are already a part of the regression functionof the model. The whole set of candidate functions that is used tofit the data in a linear model are given by:
g xð Þ ¼ ∑i¼1
pαibi xð Þ þ ∑
i¼1
tβici xð Þ
where t is the number of candidate functions. The first part of thisequation is the regression function of Kriging and, hence, thecoefficients α have already been determined independently ofβ = (β1,…,βt). The estimation of β provides a relevance scoreof the candidate features. A frequentist estimation of β (e.g.,least-squares solution) would be a straightforward approach torank the features (e.g. the least-squares solution) would be astraightforward approach to rank the features.
5.5.3 The co-kriging model
The Co-Kriging, a special case of multi-task or multi-output Gaussian Processes, exploits the correlation be-tween fine and coarse model data to enhance the predic-tive accuracy (Kennedy & O’Hagan, 2000). Generally,creating a Co-Kriging model can be interpreted as con-structing two Kriging models in sequence: a first Krigingmodel of 100 samples (the coarse data) followed by asecond Kriging model constructed on the residuals ofthe 1000 samples (fine and coarse data). This is a usefultechnique since it uses a small set of samples to predictthe long-term properties. This will be useful to save timeand cost in relation to the required data since it is able topredict the overall behaviour within and outside the givenrange of properties.
These methods, i.e. the Ordinary, Blind and Co- Krigingwill be employed in the current study to provide a comparativestudy of all techniques so as to capture the optimum regions ofbond strength in the given case study. The purpose is to val-idate the obtained data as well as to provide the optimum androbust design of the parameters. These methods can be used tofind the surrogate model that approximates the solution to theproblem since it employs less stringent assumptions about the
Fig. 21 (a) The Blind Kriging response surface, (b) The contour plot of the bonding strength, (c) The variance plot
Fig. 22 (a) The Ordinary Kriging response surface, (b) The contour plot of the bonding strength, (c) The variance plot
1362 Aldoumani et al.
residual errors and they are able to model complex systems.These models were built using the Design and Analysis ofComputer Experiments (DACE) software toolbox (Couckuytet al., 2013). The model DACE software package is a freelyavailable toolbox which preforms both calculations of theKriging function and parameters optimisation. The Meta-model found using the various Kriging methods can then beused to identify the optimal regions of the bond strength.Subsequently, a global optimum zone can be found by apply-ing the same methodology to the optimal regions.
5.6 The results of the various kriging appliedto the re-bar system
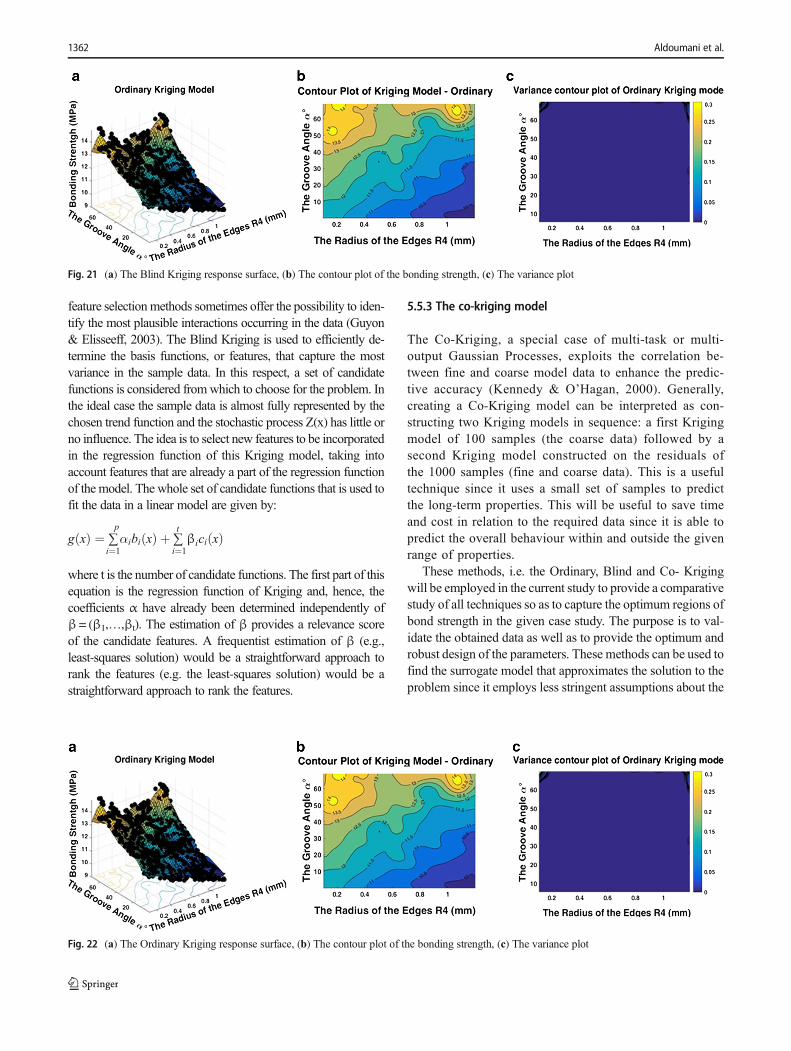
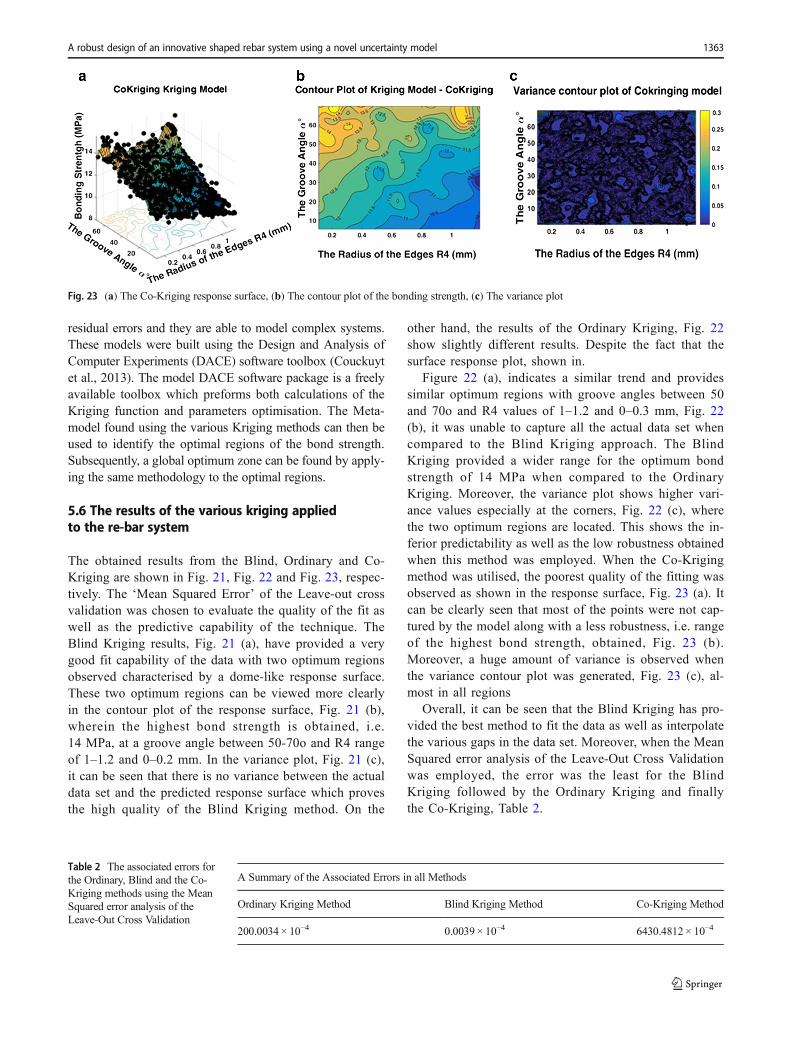
The obtained results from the Blind, Ordinary and Co-Kriging are shown in Fig. 21, Fig. 22 and Fig. 23, respec-tively. The ‘Mean Squared Error’ of the Leave-out crossvalidation was chosen to evaluate the quality of the fit aswell as the predictive capability of the technique. TheBlind Kriging results, Fig. 21 (a), have provided a verygood fit capability of the data with two optimum regionsobserved characterised by a dome-like response surface.These two optimum regions can be viewed more clearlyin the contour plot of the response surface, Fig. 21 (b),wherein the highest bond strength is obtained, i.e.14 MPa, at a groove angle between 50-70o and R4 rangeof 1–1.2 and 0–0.2 mm. In the variance plot, Fig. 21 (c),it can be seen that there is no variance between the actualdata set and the predicted response surface which provesthe high quality of the Blind Kriging method. On the
other hand, the results of the Ordinary Kriging, Fig. 22show slightly different results. Despite the fact that thesurface response plot, shown in.
Figure 22 (a), indicates a similar trend and providessimilar optimum regions with groove angles between 50and 70o and R4 values of 1–1.2 and 0–0.3 mm, Fig. 22(b), it was unable to capture all the actual data set whencompared to the Blind Kriging approach. The BlindKriging provided a wider range for the optimum bondstrength of 14 MPa when compared to the OrdinaryKriging. Moreover, the variance plot shows higher vari-ance values especially at the corners, Fig. 22 (c), wherethe two optimum regions are located. This shows the in-ferior predictability as well as the low robustness obtainedwhen this method was employed. When the Co-Krigingmethod was utilised, the poorest quality of the fitting wasobserved as shown in the response surface, Fig. 23 (a). Itcan be clearly seen that most of the points were not cap-tured by the model along with a less robustness, i.e. rangeof the highest bond strength, obtained, Fig. 23 (b).Moreover, a huge amount of variance is observed whenthe variance contour plot was generated, Fig. 23 (c), al-most in all regions
Overall, it can be seen that the Blind Kriging has pro-vided the best method to fit the data as well as interpolatethe various gaps in the data set. Moreover, when the MeanSquared error analysis of the Leave-Out Cross Validationwas employed, the error was the least for the BlindKriging followed by the Ordinary Kriging and finallythe Co-Kriging, Table 2.
Fig. 23 (a) The Co-Kriging response surface, (b) The contour plot of the bonding strength, (c) The variance plot
Table 2 The associated errors forthe Ordinary, Blind and the Co-Kriging methods using the MeanSquared error analysis of theLeave-Out Cross Validation
A Summary of the Associated Errors in all Methods
Ordinary Kriging Method Blind Kriging Method Co-Kriging Method
200.0034 × 10⁻⁴ 0.0039 × 10⁻⁴ 6430.4812 × 10−4
A robust design of an innovative shaped rebar system using a novel uncertainty model 1363
5.7 The optimum and robust Design of the RebarSystem
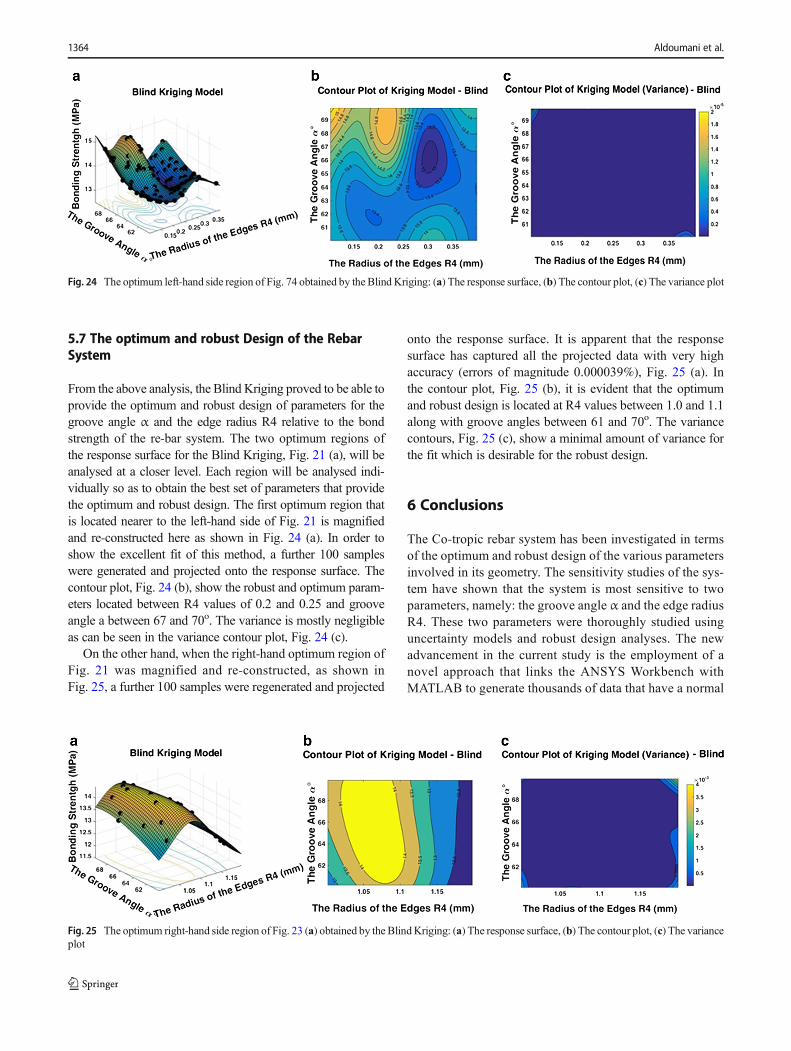
From the above analysis, the Blind Kriging proved to be able toprovide the optimum and robust design of parameters for thegroove angle α and the edge radius R4 relative to the bondstrength of the re-bar system. The two optimum regions ofthe response surface for the Blind Kriging, Fig. 21 (a), will beanalysed at a closer level. Each region will be analysed indi-vidually so as to obtain the best set of parameters that providethe optimum and robust design. The first optimum region thatis located nearer to the left-hand side of Fig. 21 is magnifiedand re-constructed here as shown in Fig. 24 (a). In order toshow the excellent fit of this method, a further 100 sampleswere generated and projected onto the response surface. Thecontour plot, Fig. 24 (b), show the robust and optimum param-eters located between R4 values of 0.2 and 0.25 and grooveangle a between 67 and 70o. The variance is mostly negligibleas can be seen in the variance contour plot, Fig. 24 (c).
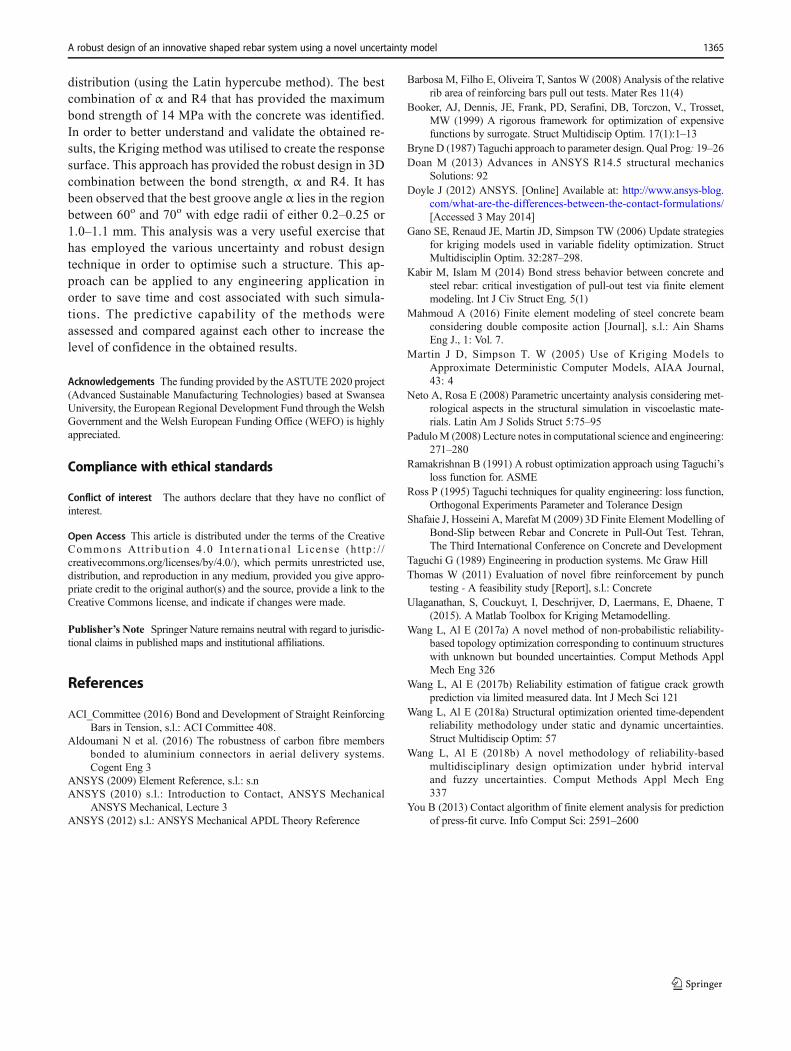
On the other hand, when the right-hand optimum region ofFig. 21 was magnified and re-constructed, as shown inFig. 25, a further 100 samples were regenerated and projected
onto the response surface. It is apparent that the responsesurface has captured all the projected data with very highaccuracy (errors of magnitude 0.000039%), Fig. 25 (a). Inthe contour plot, Fig. 25 (b), it is evident that the optimumand robust design is located at R4 values between 1.0 and 1.1along with groove angles between 61 and 70o. The variancecontours, Fig. 25 (c), show a minimal amount of variance forthe fit which is desirable for the robust design.
6 Conclusions
The Co-tropic rebar system has been investigated in termsof the optimum and robust design of the various parametersinvolved in its geometry. The sensitivity studies of the sys-tem have shown that the system is most sensitive to twoparameters, namely: the groove angle α and the edge radiusR4. These two parameters were thoroughly studied usinguncertainty models and robust design analyses. The newadvancement in the current study is the employment of anovel approach that links the ANSYS Workbench withMATLAB to generate thousands of data that have a normal
Fig. 24 The optimum left-hand side region of Fig. 74 obtained by the Blind Kriging: (a) The response surface, (b) The contour plot, (c) The variance plot
Fig. 25 The optimum right-hand side region of Fig. 23 (a) obtained by the BlindKriging: (a) The response surface, (b) The contour plot, (c) The varianceplot
1364 Aldoumani et al.
distribution (using the Latin hypercube method). The bestcombination of α and R4 that has provided the maximumbond strength of 14 MPa with the concrete was identified.In order to better understand and validate the obtained re-sults, the Kriging method was utilised to create the responsesurface. This approach has provided the robust design in 3Dcombination between the bond strength, α and R4. It hasbeen observed that the best groove angle α lies in the regionbetween 60o and 70o with edge radii of either 0.2–0.25 or1.0–1.1 mm. This analysis was a very useful exercise thathas employed the various uncertainty and robust designtechnique in order to optimise such a structure. This ap-proach can be applied to any engineering application inorder to save time and cost associated with such simula-tions. The predictive capability of the methods wereassessed and compared against each other to increase thelevel of confidence in the obtained results.
Publisher’s Note Springer Nature remains neutral with regard to jurisdic-tional claims in published maps and institutional affiliations.
Acknowledgements The funding provided by the ASTUTE 2020 project(Advanced Sustainable Manufacturing Technologies) based at SwanseaUniversity, the European Regional Development Fund through theWelshGovernment and the Welsh European Funding Office (WEFO) is highlyappreciated.
Compliance with ethical standards
Conflict of interest The authors declare that they have no conflict ofinterest.
Open Access This article is distributed under the terms of the CreativeCommons At t r ibut ion 4 .0 In te rna t ional License (h t tp : / /creativecommons.org/licenses/by/4.0/), which permits unrestricted use,distribution, and reproduction in any medium, provided you give appro-priate credit to the original author(s) and the source, provide a link to theCreative Commons license, and indicate if changes were made.
References
ACI_Committee (2016) Bond and Development of Straight ReinforcingBars in Tension, s.l.: ACI Committee 408.
Aldoumani N et al. (2016) The robustness of carbon fibre membersbonded to aluminium connectors in aerial delivery systems.Cogent Eng 3
ANSYS (2009) Element Reference, s.l.: s.nANSYS (2010) s.l.: Introduction to Contact, ANSYS Mechanical
ANSYS Mechanical, Lecture 3ANSYS (2012) s.l.: ANSYS Mechanical APDLTheory Reference
Barbosa M, Filho E, Oliveira T, Santos W (2008) Analysis of the relativerib area of reinforcing bars pull out tests. Mater Res 11(4)
Booker, AJ, Dennis, JE, Frank, PD, Serafini, DB, Torczon, V., Trosset,MW (1999) A rigorous framework for optimization of expensivefunctions by surrogate. Struct Multidiscip Optim. 17(1):1–13
Bryne D (1987) Taguchi approach to parameter design. Qual Prog: 19–26Doan M (2013) Advances in ANSYS R14.5 structural mechanics
Solutions: 92Doyle J (2012) ANSYS. [Online] Available at: http://www.ansys-blog.
com/what-are-the-differences-between-the-contact-formulations/[Accessed 3 May 2014]
Gano SE, Renaud JE, Martin JD, Simpson TW (2006) Update strategiesfor kriging models used in variable fidelity optimization. StructMultidisciplin Optim. 32:287–298.
Kabir M, Islam M (2014) Bond stress behavior between concrete andsteel rebar: critical investigation of pull-out test via finite elementmodeling. Int J Civ Struct Eng, 5(1)
Mahmoud A (2016) Finite element modeling of steel concrete beamconsidering double composite action [Journal], s.l.: Ain ShamsEng J., 1: Vol. 7.
Martin J D, Simpson T. W (2005) Use of Kriging Models toApproximate Deterministic Computer Models, AIAA Journal,43: 4
Neto A, Rosa E (2008) Parametric uncertainty analysis considering met-rological aspects in the structural simulation in viscoelastic mate-rials. Latin Am J Solids Struct 5:75–95
PaduloM (2008) Lecture notes in computational science and engineering:271–280
Ramakrishnan B (1991) A robust optimization approach using Taguchi’sloss function for. ASME
Ross P (1995) Taguchi techniques for quality engineering: loss function,Orthogonal Experiments Parameter and Tolerance Design
Shafaie J, Hosseini A,Marefat M (2009) 3D Finite Element Modelling ofBond-Slip between Rebar and Concrete in Pull-Out Test. Tehran,The Third International Conference on Concrete and Development
Taguchi G (1989) Engineering in production systems. Mc Graw HillThomas W (2011) Evaluation of novel fibre reinforcement by punch
testing - A feasibility study [Report], s.l.: ConcreteUlaganathan, S, Couckuyt, I, Deschrijver, D, Laermans, E, Dhaene, T
(2015). A Matlab Toolbox for Kriging Metamodelling.Wang L, Al E (2017a) A novel method of non-probabilistic reliability-
based topology optimization corresponding to continuum structureswith unknown but bounded uncertainties. Comput Methods ApplMech Eng 326
Wang L, Al E (2017b) Reliability estimation of fatigue crack growthprediction via limited measured data. Int J Mech Sci 121
Wang L, Al E (2018a) Structural optimization oriented time-dependentreliability methodology under static and dynamic uncertainties.Struct Multidiscip Optim: 57
Wang L, Al E (2018b) A novel methodology of reliability-basedmultidisciplinary design optimization under hybrid intervaland fuzzy uncertainties. Comput Methods Appl Mech Eng337
You B (2013) Contact algorithm of finite element analysis for predictionof press-fit curve. Info Comput Sci: 2591–2600
A robust design of an innovative shaped rebar system using a novel uncertainty model 1365