a sample survey to update rates and ratios of timber and...
TRANSCRIPT

A Sample Survey to Update Rates and Ratios of Timber and Non – Timber Forest Products of India.
Draft Project Completion Report
Division of Statistics Directorate of Extension
Indian Council of Forestry Research & Education P.O. New Forest
Dehradun

Contents
S. No. Page No.
1. Introduction 1
2. Objectives of the study 2
3. Methodology
3.1 Value of Non – Timber Forest Products
3.2 Value of Timber
3.3 General Mechanism for Data Collection
3.4 Sampling
3.5 Formulae
2
3
4 4
5
5
4. Data Collection from Each Zone for NTFP component
6
5. Results of estimates of Non – Timber Forest Products
9
6. Data Collection for Timber Component 11
7. Finalized estimates 13
8. Annexure I: Proceedings of the Orientation Programme for supervisors
14
9. Annexure – II: Working Manual 16
10. Annexure – III: Format for data collection for Non – timber Forest Products
23
11. Annexure – IV: Format for data collection for Timber
28
12. Annexure – V: Supervisors for the survey in ICFRE Institutes
32
13. Coordinating Team from ICFRE 33

1
Introduction
Forests and forest produce play an important role in the economy of a country, be it urban or rural. Of late, forests are looked not as a mere source of timber and non-timber forest produce, but also as assets, which will serve the long term interest of a society in terms of climate, environment and ecology. However, the revenue earned by a society through its forests still figures high on the list of uses a forest can be put to, and more so, if attained on a sustained basis.
The problem of estimating the revenue earned from forests persists from a large time. The value of timber and non-timber resources that lie within forests and that are taken out to the market may be gigantic but remain under represented in national figures due to lack of proper methods that can really estimate it. This assumes more difficulty as a large proportion of the forest produce is traded by the unorganized sector, which is not only difficult to estimate but is also very difficult to identify. A large part of the forest produce is kept for self-consumption by the dwellers in the forest area and what remains is traded in unofficial markets (mandis). The problem of non-response in the surveys conducted to estimate the revenue or value of the resources forests generate is also too cumbersome to handle.
Objectives of the Study
The study is aimed at providing a momentum to the ongoing efforts of ICFRE in collection and dissemination of data related to forestry in India. The aim is to develop a methodology that can be used in future for the purpose. The study is proposed with the following objectives:
1. to estimate the value of output and the value of input of timber in the country 2. to estimate the of output and the value of input of Non – timber forest products in
the country
2
Methodology
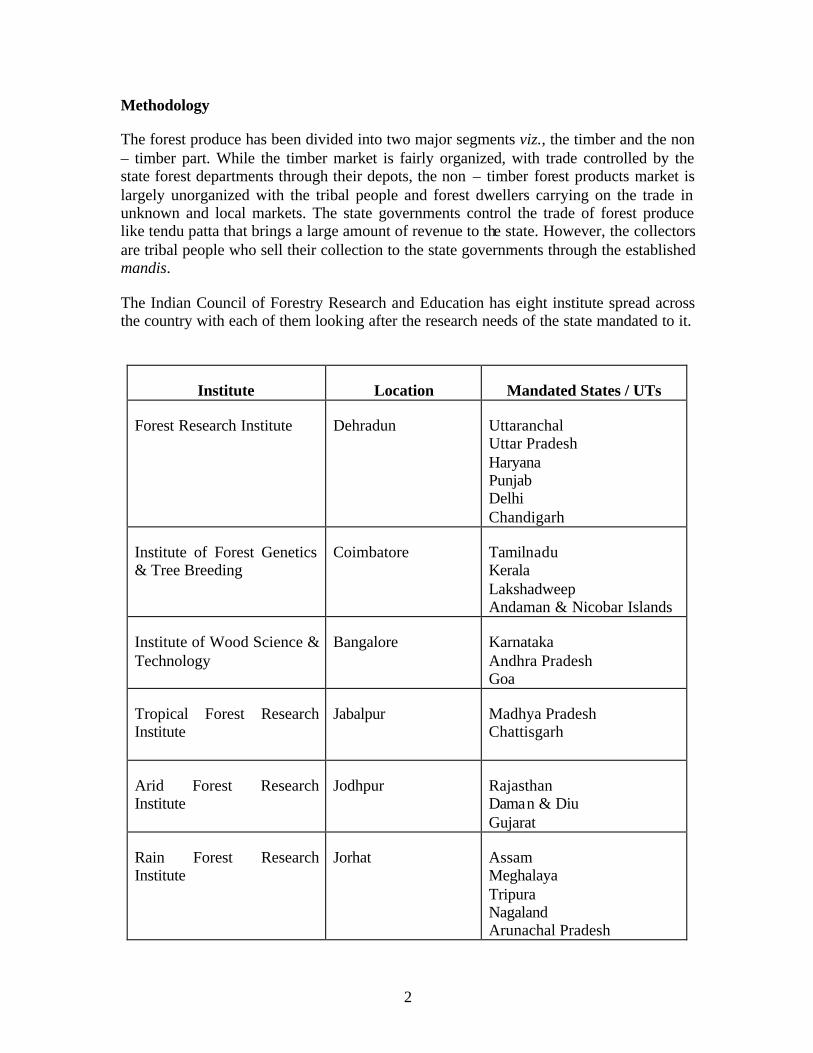
The forest produce has been divided into two major segments viz., the timber and the non – timber part. While the timber market is fairly organized, with trade controlled by the state forest departments through their depots, the non – timber forest products market is largely unorganized with the tribal people and forest dwellers carrying on the trade in unknown and local markets. The state governments control the trade of forest produce like tendu patta that brings a large amount of revenue to the state. However, the collectors are tribal people who sell their collection to the state governments through the established mandis.
The Indian Council of Forestry Research and Education has eight institute spread across the country with each of them looking after the research needs of the state mandated to it.
Institute Location Mandated States / UTs
Forest Research Institute Dehradun Uttaranchal Uttar Pradesh Haryana Punjab Delhi Chandigarh
Institute of Forest Genetics & Tree Breeding
Coimbatore Tamilnadu Kerala Lakshadweep Andaman & Nicobar Islands
Institute of Wood Science & Technology
Bangalore Karnataka Andhra Pradesh Goa
Tropical Forest Research Institute
Jabalpur Madhya Pradesh Chattisgarh
Arid Forest Research Institute
Jodhpur Rajasthan Daman & Diu Gujarat
Rain Forest Research Institute
Jorhat Assam Meghalaya Tripura Nagaland Arunachal Pradesh

3
Institute of Forest Productivity
Ranchi Jharkhand Bihar Orissa (confirm) Sikkim West Bengals
Himalayan Forest Research Institute
Shimla Himachal Pradesh Jammu & Kashmir
Supervisors were nominated by the Directors of each ICFRE institute along with four investigators for field level data collection from the mandated states as given above. A two-day orientation programme for the supervisors at Van Vigyan Bhawan, New Delhi to take into account their views and designing the data collection form. The finalized forms were then sent to the supervisors with necessary instructions to start the work. The proceedings of the orientation programme are given in Annexure – I.
Value of Non – Timber Forest Products
Initially it was decided to lay a 1-hectare sample plot in the different forest types and note down the details of NTFP being collected from the plot. However, this approach was not feasible as it is not practical to post a person continuously in each plot to accomplish the work. The best way was to select the forest villages and go through the interview method with validation built in through data collected from the different organized markets. Instead of the state wise stratification, the physiographic zones identified by the Forest Survey of India were taken as a basis for stratification. Forest Survey of India has identified fourteen physiographic zones in the country based on broad similarities in factors responsible for the growth of tree vegetation. A certain number of districts were selected in each physiographic zone, depending upon, again, on the cost function of the study. Three villages in each district were selected randomly and surveyed for the amount of produce collected and its value in the form of the revenue they earned from them.
The following table gives the fourteen physiographic zones along with the area in square kilometers:
Table 1: Distribution of Districts within Physiographic Zones (source: State of Forest Report 2003, Forest Survey of India, Dehradun)
S. No. Name of the zone Area in square kilometers
1. Western Himalayas 338556
2. Eastern Himalayas 65317
3. North East 133990

4
4. Northern Plains 295780
5. Eastern Plains 223339
6. Western Plains 319098
7. Central Highlands 373675
8. North Deccan 355988
9. East Deccan 336289
10. South Deccan 292416
11. Western Ghats 72381
12. Eastern Ghats 191698
13. West Coast 121242
14. East Coast 167494
Value of Timber
For estimating the value of timber, minimum three depots (more depending upon the costs incurred in data collection) of each state forest department were surveyed in each state and data on the species stocked, incoming and outgoing quantity, price and value were collected during each month. The purpose of monthly data collection was to ensure validity of the estimates and estimations in case data are not received due to any reason. In order to estimate the cost of input, data in respect of variables like electricity, cost of maintenance of depot, and other variables, excluding the salaries of employees were also incorporated into the data collection forms. The data collection forms are given in Annexure III. It was assumed, and quite rightly so, that the timber that is sold in the market comes from two sources, namely the state forest departments and the imports, the latter not being a part of the study.
For the purpose of timber, three classifications are adhered to, viz., Round Logs, Sawn Timber and Poles. Firewood has been kept out of the purview of the study. Thus, value of Round Logs, Sawn Timber and Poles has been included in preparation of final estimates.
General Mechanism for data collection
The income from NTFP was assessed using structured questionnaires, which were put to the collectors of the NTFP from the forest. The distance from the village where NTFP are collected was also assessed in the questionnaire. On an average, each village gets its share from around 6 kilometers radius. Thus, each village collects NTFP from 114 square kilometers.
5
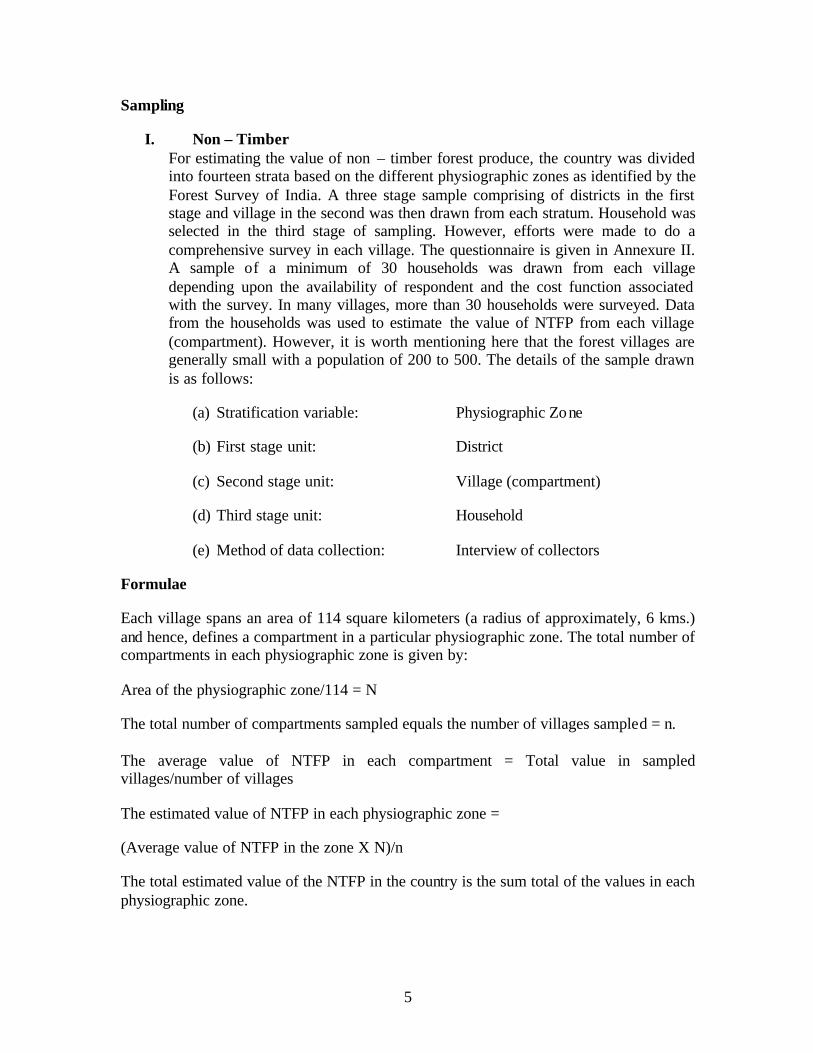
Sampling
I. Non – Timber For estimating the value of non – timber forest produce, the country was divided into fourteen strata based on the different physiographic zones as identified by the Forest Survey of India. A three stage sample comprising of districts in the first stage and village in the second was then drawn from each stratum. Household was selected in the third stage of sampling. However, efforts were made to do a comprehensive survey in each village. The questionnaire is given in Annexure II. A sample of a minimum of 30 households was drawn from each village depending upon the availability of respondent and the cost function associated with the survey. In many villages, more than 30 households were surveyed. Data from the households was used to estimate the value of NTFP from each village (compartment). However, it is worth mentioning here that the forest villages are generally small with a population of 200 to 500. The details of the sample drawn is as follows:
(a) Stratification variable: Physiographic Zone
(b) First stage unit: District
(c) Second stage unit: Village (compartment)
(d) Third stage unit: Household
(e) Method of data collection: Interview of collectors
Formulae
Each village spans an area of 114 square kilometers (a radius of approximately, 6 kms.) and hence, defines a compartment in a particular physiographic zone. The total number of compartments in each physiographic zone is given by:
Area of the physiographic zone/114 = N
The total number of compartments sampled equals the number of villages sampled = n. The average value of NTFP in each compartment = Total value in sampled villages/number of villages
The estimated value of NTFP in each physiographic zone =
(Average value of NTFP in the zone X N)/n
The total estimated value of the NTFP in the country is the sum total of the values in each physiographic zone.
6
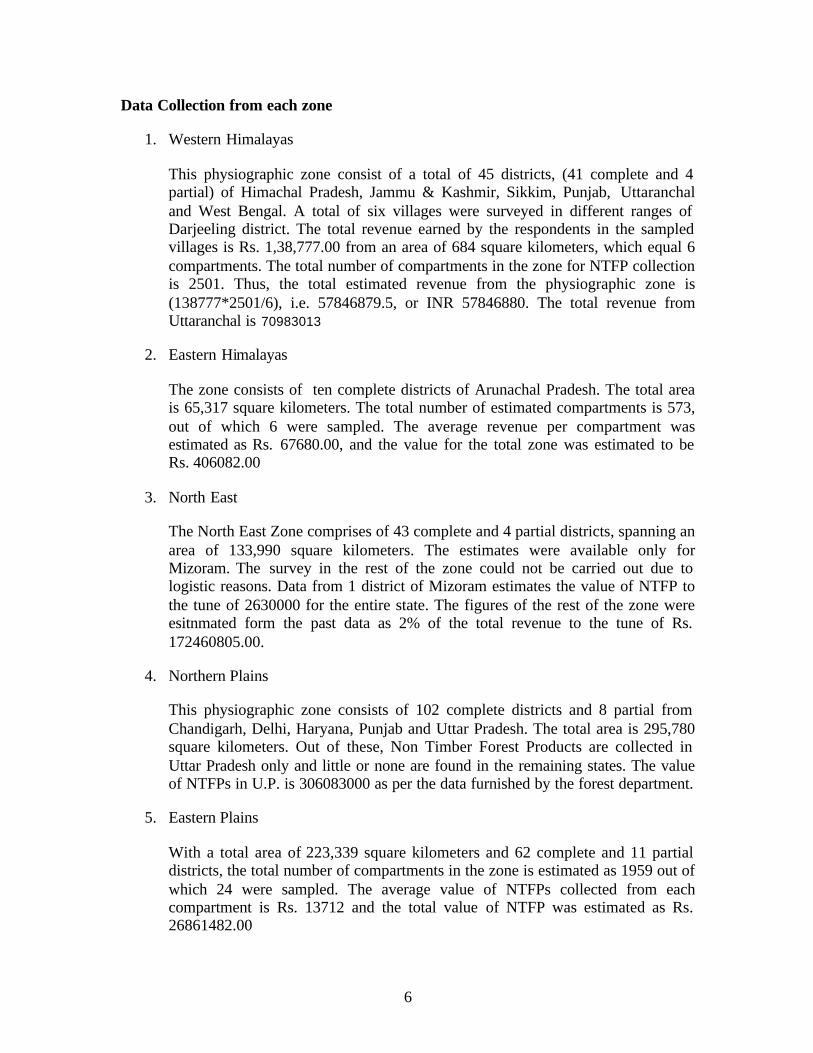
Data Collection from each zone
1. Western Himalayas
This physiographic zone consist of a total of 45 districts, (41 complete and 4 partial) of Himachal Pradesh, Jammu & Kashmir, Sikkim, Punjab, Uttaranchal and West Bengal. A total of six villages were surveyed in different ranges of Darjeeling district. The total revenue earned by the respondents in the sampled villages is Rs. 1,38,777.00 from an area of 684 square kilometers, which equal 6 compartments. The total number of compartments in the zone for NTFP collection is 2501. Thus, the total estimated revenue from the physiographic zone is (138777*2501/6), i.e. 57846879.5, or INR 57846880. The total revenue from Uttaranchal is 70983013
2. Eastern Himalayas
The zone consists of ten complete districts of Arunachal Pradesh. The total area is 65,317 square kilometers. The total number of estimated compartments is 573, out of which 6 were sampled. The average revenue per compartment was estimated as Rs. 67680.00, and the value for the total zone was estimated to be Rs. 406082.00
3. North East
The North East Zone comprises of 43 complete and 4 partial districts, spanning an area of 133,990 square kilometers. The estimates were available only for Mizoram. The survey in the rest of the zone could not be carried out due to logistic reasons. Data from 1 district of Mizoram estimates the value of NTFP to the tune of 2630000 for the entire state. The figures of the rest of the zone were esitnmated form the past data as 2% of the total revenue to the tune of Rs. 172460805.00.
4. Northern Plains
This physiographic zone consists of 102 complete districts and 8 partial from Chandigarh, Delhi, Haryana, Punjab and Uttar Pradesh. The total area is 295,780 square kilometers. Out of these, Non Timber Forest Products are collected in Uttar Pradesh only and little or none are found in the remaining states. The value of NTFPs in U.P. is 306083000 as per the data furnished by the forest department.
5. Eastern Plains
With a total area of 223,339 square kilometers and 62 complete and 11 partial districts, the total number of compartments in the zone is estimated as 1959 out of which 24 were sampled. The average value of NTFPs collected from each compartment is Rs. 13712 and the total value of NTFP was estimated as Rs. 26861482.00

7
6. Western Plains
The Western Plains physiographic zone comprises of 17 complkete and 8 partial districts of Daman & Diu, Gujarat and Rajasthan. Data for Gujarat from the Gujarat State Forest Development Corporation (GSFDC) are available and the total value of NTFPs traded is Rupees 565452.00. From the remaining area, 3 compartments were sampled out of 1080 compartments. The average value per compartment was estimated as Rs. 13243 while the total value of NTFPs traded was estimated as Rs. 14301900.00
7. Central Highlands
Central Highlands comprises of 52 complete and 19 partial districtsof Bihar, Gujarat, Haryana, Madhya Pradesh, Rajasthan and Uttar Pradesh with a total area of 373675 square kilometers. The total number of compartments in the zone was estimated to be 3278 out of which 12 were sampled. The total value of NTFPs in the sampled compartments was estimated to as Rs. 756330.00 with an average of Rs. 63027.00 per compartment. The total value for the entire physiographic zone is Rs. 206604008.00
8. North Deccan
Spread over an area of 355,988 square kilometers, this physiographic zone consist of 33 complete and 15 partial districts of Gujarat, Madhya Pradesh and Maharastra. The estimated number of compartments in the zone is 3123 out of which 30 were sampled. The average value per compartment is estimated as Rs. 57746.00 and the total value as Rs. 180341903.00
9. East Deccan
Spread over an area of 336,289 square kilometers, this physiographic zone consist of 48 complete and 15 partial districts of Bihar, Chattisgarh, Jharkhand, Madhya Pradesh, Orissa, Uttar Pradesh (one) and West Bengal (one). The toal number fo compartments estimated in this zone is 2950 out of which 27 were sampled. The total value of NTFPs from the sampled compartments is estimated to be Rs. 1630769, with an average of Rs. 60399 per compartment resulting in the estimated value of Rs. 178176613.00.
10. South Deccan
This zone consists of 26 complete and 11 partial districts of Andhra Pradesh and Karnataka. Consisting of an area of 292,416 square kilometers, the total number of compartments identified in the zone is 2565 and 27 were sampled. The total value in the sampled compartment is Rs. 35585594 with an average of Rs. 1317985.00 per compartment. The total estimated value of NTFPs collected from the zone is estimated to be Rs. 3380631430.00

8
11. Western Ghats
Consisting of an area of 72,381 square kilometers and 5 complete & 30 partial districts, the total number of compartments identified in the zone is 635 out of which 30 were sampled. The total estimated value of NTFPs colelcetd from this zone ios Rs. 3400532 which gives an average of Rs. 113351.00 per compartment. Thus, the total value of NTFPs from the zone is estimated to be Rs. 71977927.00
12. Eastern Ghats
The total area covered by this physiographic zone is 191,698 square kilometers with 12 complete and 28 partial districts of Andhra Pradesh, Orissa, Karnataka and Tamil Nadu. The total number of compartments in this zone was identified as 1682 out of which 24 were sampled. The total estimated value of NTFPs from the sampled compartments of this zone is Rs. 32801762.00 with an average of Rs. 1366740.00, bringing the total estimated value to Rs. 2298856820.00.
13. West Coast
The area of this physiographic zone is 121,242 square kilometers with 20 complete and 21 partial districts. The total number of compartments identified in this zone is 1064 with 12 sampled compartments. The total value of NTFPs in the sampled compartments is Rs. 566620.00 with an average of Rs. 47218.00. Thus, the total value estimated is Rs. 50240305.00
14. East Coast
This physiographic zone consists of 24 compete and 23 partial districts spread over 167,494 square kilometers. There is a total of 1469 compartments out of which 15 have been sampled. The total estimated value in the sampled compartments is Rs. 16146788.00 with an average of Rs. 1076453.00. The total value of NTFPs collected from this zone has been estimated to be Rs. 1581308771.00.
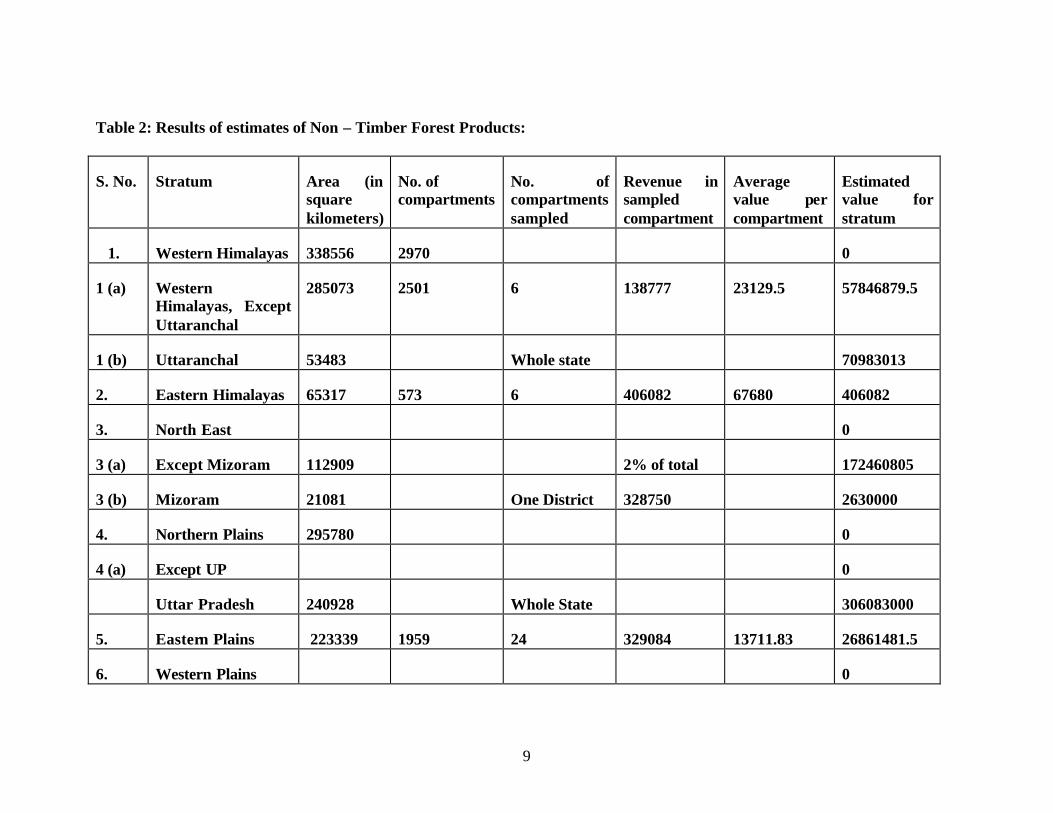
The results of total estimated and the estimated value for the country are summarized in the table given below:
9
Table 2: Results of estimates of Non – Timber Forest Products:
S. No. Stratum Area (in square kilometers)
No. of compartments
No. of compartments sampled
Revenue in sampled compartment
Average value per compartment
Estimated value for stratum
1. Western Himalayas 338556 2970 0
1 (a) Western Himalayas, Except Uttaranchal
285073 2501 6 138777 23129.5 57846879.5
1 (b) Uttaranchal 53483 Whole state 70983013
2. Eastern Himalayas 65317 573 6 406082 67680 406082
3. North East 0
3 (a) Except Mizoram 112909 2% of total 172460805
3 (b) Mizoram 21081 One District 328750 2630000
4. Northern Plains 295780 0
4 (a) Except UP 0
Uttar Pradesh 240928 Whole State 306083000
5. Eastern Plains 223339 1959 24 329084 13711.83 26861481.5
6. Western Plains 0

10
6 (a) Except Gujarat 123076 1080 3 39727.5 13242.5 14301900
6 (b) Gujarat 196022 Whole state 565442
7. Central Highlands 373675 3278 12 756329.5 63027.5 206604008
8. North Deccan 355988 3123 30 1732391 57746.4 180341903
9. East Deccan 336289 2950 27 1630769 60398.9 178176613
10. South Deccan 292416 2565 27 35585594 1317985 3380631430
11. Western Ghats 72381 635 30 3400532 113351 71977927
12. Eastern Ghats 191698 1682 24 32801762 1366740 2298856820
13. West Coast 121242 1064 12 56620 47218 50240307
14. East Coast 167494 1469 15 16146788 1076453 1581308771
Total 8600276382
Thus the total estimated value of NTFP from the country is Rs. 8600276382, or 86003 lakhs of rupees approximately

11
II. Timber
In order to estimate the value of timber, the State Forest Departments were taken as strata and the depots as the sampling unit. Three depots from each state were selected at random and a structured data collection form was used to collect data from the sampled depots. In case cost function allowed, more depots were sampled. Complete data for all the months were available for U.P. from the U.P. Forest Development Corporation. The format is given in Annexure – III.
For the purpose of estimating the total number of depots in each state, the number of ranges in each state was obtained. The number of depots almost equals the number of depots.
The cost of input is generally not available from the depots. The data for this were collected from three depots and the cost of input has been estimated as Rs. 500,000 per annum on an average.
The results of the survey are summarized in the table below:
Table 3: Estimates of Timber
state No. of depots Sampled Months Revenue from timber
Adjustment for Months
A & N 55 Andhra Pradesh 196 10 6 81997456 163994912Arunachal Pradesh 75 Assam 121 Bihar 33 6 3 3602550 14410200Chandigarh Chattisgarh D & N Haveli 3 Daman & Diu Delhi 9 Goa 11 Gujarat 140 4 6 80145897.8 160291795.6Gujarat 140 16 9 118443394.4 157924525.9Haryana HP 189 5 9 507211930.9 676282574.5J&K 123 1 6 331516038 663032076J&K 123 1 3 27872957 111491828Jharkhand 131 Karnataka 445 1 9 244935 326580Karnataka 445 1 4 275545 826635Karnataka 445 1 12 884905.33 884905.33Kerala 106 4 3 2502480 10009920MP 362 Maharashtra 309 Manipur Meghalaya 17
12
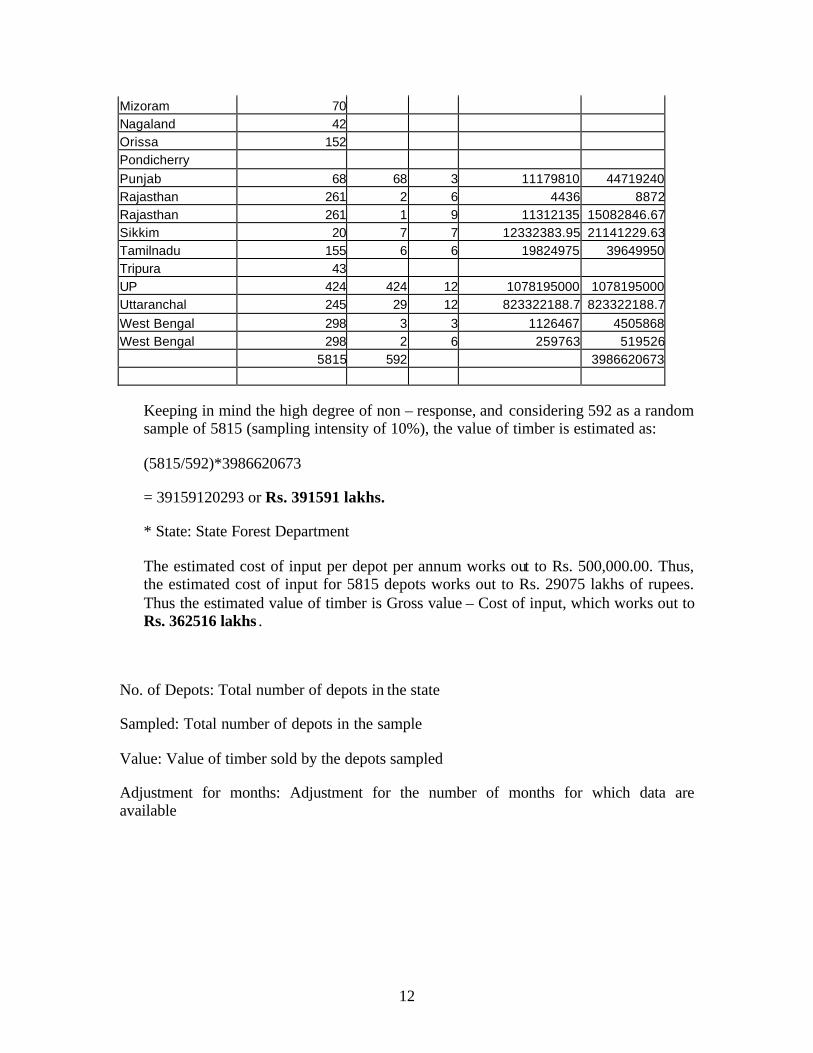
Mizoram 70 Nagaland 42 Orissa 152 Pondicherry Punjab 68 68 3 11179810 44719240Rajasthan 261 2 6 4436 8872Rajasthan 261 1 9 11312135 15082846.67Sikkim 20 7 7 12332383.95 21141229.63Tamilnadu 155 6 6 19824975 39649950Tripura 43 UP 424 424 12 1078195000 1078195000Uttaranchal 245 29 12 823322188.7 823322188.7West Bengal 298 3 3 1126467 4505868West Bengal 298 2 6 259763 519526 5815 592 3986620673
Keeping in mind the high degree of non – response, and considering 592 as a random sample of 5815 (sampling intensity of 10%), the value of timber is estimated as:
(5815/592)*3986620673
= 39159120293 or Rs. 391591 lakhs.
* State: State Forest Department
The estimated cost of input per depot per annum works out to Rs. 500,000.00. Thus, the estimated cost of input for 5815 depots works out to Rs. 29075 lakhs of rupees. Thus the estimated value of timber is Gross value – Cost of input, which works out to Rs. 362516 lakhs .
No. of Depots: Total number of depots in the state
Sampled: Total number of depots in the sample
Value: Value of timber sold by the depots sampled
Adjustment for months: Adjustment for the number of months for which data are available

13
Finalized estimates:
Component Total value estimated
(in lakhs of rupees)
Cost of input Net value estimated
(in lakhs of rupees)
Non – Timber Forest Products
86003 0 86003
Timber 391591 29075 362516
14
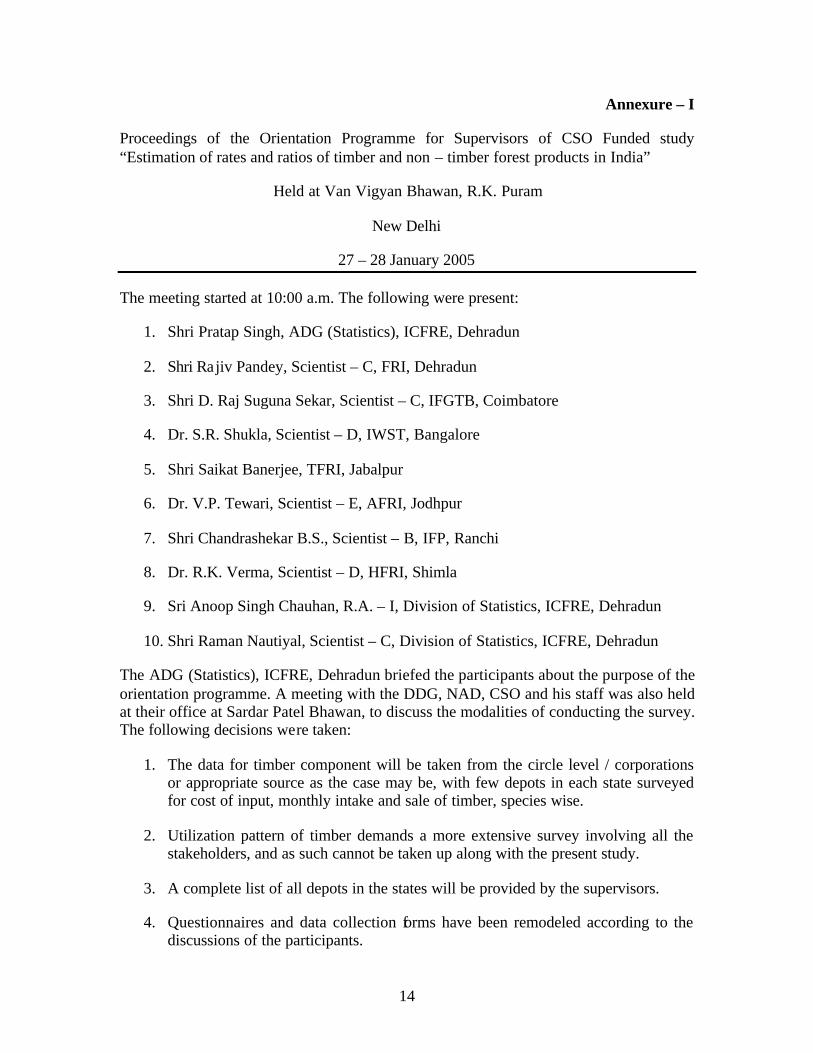
Annexure – I
Proceedings of the Orientation Programme for Supervisors of CSO Funded study “Estimation of rates and ratios of timber and non – timber forest products in India”
Held at Van Vigyan Bhawan, R.K. Puram
New Delhi
27 – 28 January 2005
The meeting started at 10:00 a.m. The following were present:
1. Shri Pratap Singh, ADG (Statistics), ICFRE, Dehradun
2. Shri Rajiv Pandey, Scientist – C, FRI, Dehradun
3. Shri D. Raj Suguna Sekar, Scientist – C, IFGTB, Coimbatore
4. Dr. S.R. Shukla, Scientist – D, IWST, Bangalore
5. Shri Saikat Banerjee, TFRI, Jabalpur
6. Dr. V.P. Tewari, Scientist – E, AFRI, Jodhpur
7. Shri Chandrashekar B.S., Scientist – B, IFP, Ranchi
8. Dr. R.K. Verma, Scientist – D, HFRI, Shimla
9. Sri Anoop Singh Chauhan, R.A. – I, Division of Statistics, ICFRE, Dehradun
10. Shri Raman Nautiyal, Scientist – C, Division of Statistics, ICFRE, Dehradun
The ADG (Statistics), ICFRE, Dehradun briefed the participants about the purpose of the orientation programme. A meeting with the DDG, NAD, CSO and his staff was also held at their office at Sardar Patel Bhawan, to discuss the modalities of conducting the survey. The following decisions were taken:
1. The data for timber component will be taken from the circle level / corporations or appropriate source as the case may be, with few depots in each state surveyed for cost of input, monthly intake and sale of timber, species wise.
2. Utilization pattern of timber demands a more extensive survey involving all the stakeholders, and as such cannot be taken up along with the present study.
3. A complete list of all depots in the states will be provided by the supervisors.
4. Questionnaires and data collection forms have been remodeled according to the discussions of the participants.

15
5. Data in respect of import / export of timber can be obtained from the DG, Commercial Intelligence and Statistics, Govt. of India.
6. Data in respect of minor forest products will be collected from state forest departments, local bodies involved in the trade, market where available and collectors.
7. Individual collectors will be interviewed and data collected after stratification by forest types. The samples will be selected by the DoS, ICFRE.
8. Data regarding MFPs / timber from SFDs will be on monthly basis. The frequency of collection may be as per the convenience of the supervisors.
9. Interim funds will be provided to the institutes soon. The supervisors will send physical and financial report regularly to ADG (Statistics) for compilation and onward submission to CSO.
Pratap Singh
Rajiv Pandey
D. Rajasuguna Sekar
Dr. V.P. Tewari
Chandrashekar B.S.
Dr. R.K. Verma
Dr. S.R. Shukla
Saikat Banerjee
Anoop Singh Chauhan
Raman Nautiyal

16
Annexure – II
WORKING MANUAL
A SAMPLE SURVEY TO ESTIMATE RATES AND RATIOS OF TIMBER AND
NON – TIMBER FOREST PRODUCTS IN INDIA
27 – 29 January 2005
held at
Van Vigyan Bhawan R.K. Puram
New Delhi
Division of Statistics
Directorate of Extension
Indian Council of Forestry Research and Education
Dehradun

17
Introduction
The Central Statistical Organization, Ministry of Statistics and Programme
Implementation, Govt. of India, has funded a study to collect data in respect of minor
forest produce and timber in order to update the rates and ratios for timber and non –
timber forest produce of India. Forests and forest produce play a major role in the society
and the life of a human being. They provide timber, fuel, fodder and a host of other goods
and services for immediate consumption or consumption after processing,
notwithstanding the intangible benefits that accrue from the protection of environment,
tourism and other elated activities. The contribution of forests and forest products to the
economy of our country is immense, but remains clouded with skepticism for want of
data and precise estimation of the value of inputs and the outputs associated with it.
The products for which we depend upon the forests can broadly be classified into two
categories – Timber and Non – Timber forest products. The latter category includes a
wide spectrum of products that vary with the geographical regions of our country.
The collection of data pertaining to NTFPs becomes difficult, as the collection of NTFPs
is unorganized to quite some extent. The collection agencies vary from the well-
organized State Forest Department to the unorganized villagers and tribal people who
don’t keep any records of the value of the forests they are collecting. The timber market,
on the other hand is quite organized and the sale is through the SFD depots or well
established timber markets (mandis).
Objectives
The study is aimed at providing a momentum to the ongoing efforts of ICFRE in
collection and dissemination of data related to forestry in India. The aim is to develop a
methodology that can be used in future for the purpose. The study is proposed with the
following objectives:
3. To estimate the value of output and the value of input of timber in the country

18
4. To estimate the of output and the value of input of Non – timber forest products in
the country
Cost of inputs and outputs regarding the timber and non – timber forest produce needs to
be estimated to arrive at the rates and ratios of these two components.
Methodology For data regarding timber component
The data regarding timber component will be collected from two sources, namely, the
timber depots of state forest departments and the timber markets. The markets from
which data are proposed to be taken are the same as for the Timber / Bamboo Trade
Bulletin published by ICFRE.
1. Ahmedabad
2. Bangalore
3. Kolkata
4. Calicut
5. Dehra Dun
6. Delhi
7. Gorakhpur
8. Guwahati
9. Hyderabad
10. Jabalpur
11. Jaipur
12. Jammu
13. Chennai
14. Nagpur
15. Pathankot
16. Raipur
17. Ranchi
18. Siliguri
19. Yamuna Nagar

19
Out of the list of state forest depots in the various circles, a sample of 20% will be drawn
subject to a minimum of two from each state and data collected from the selected depots
on a monthly basis.

20
For data regarding the MFP component
Data for minor forest produce has to be collected from three sources monthly.
1. Government and other agencies dealing in MFP/NTFP
Secondary data from governmental / institutional (NGOs / societies) sources to be
collected in the format prescribed on a monthly basis.
2. Markets
Data from the markets to be collected on a monthly basis in the formats prescribed.
3. Source
Primary data from a sample plot of 1 Ha to be laid in the forest types to estimate the
quantity collected per unit Ha of forest area.

21
Reporting the data to ADG (Statistics)
Data collection forms will be provided. The data from the depots, markets, and sources
should be recorded in a data register and transferred to the forms after proper scrutiny and
validation. Four registers will be provided to each institute, one for each investigator. The
data records in the register should be signed and verified by the investigators and
countersigned by the supervisor for ensuring accuracy and precision of data. The aim
here is not to find faults but to ensure the figures are properly recorded, leaving almost no
room for any doubt, whatsoever. Care should be taken to maintain homogeneity in units
of measurements. Where there are differences, the conversion factor should be recorded
and mentioned separately for the purpose of conversion.
Once validated and scrutinized, the data should be entered in the relevant form given in
the booklet by hand and verified and signed. Under no circumstances, the data should be
printed or computer printouts taken. Booklets of formats will be provided to each
institute, one for each month and state. The booklets, complete in all respects, should be
returned to the4 ADG (Statistics). Abnormal figures should be well explained in
annexure citing the page number wherein the figure appears. In case some data is not
available, reasons for such non – availability should be clearly spelled out. However, care
should be taken to complete the booklets and the aim should be to fill in all the details,
taking into account the non – response, if any. Reasons for non – response should be
mentioned.
The data sheets should be submitted to the ADG (Statistics), ICFRE, Dehradun, as per
the time schedule. Each page of the booklet should be signed by the supervisor.

22
Time Schedule
There will be a total of 12 visits for MFP and 8 for timber component of the sample
survey.

23
Annexure – III
MINOR FOREST PRODUCTS
DATA FOR THE MONTH OF
NAME OF THE INSTITUTE
NAME OF THE STATE
This booklet should be completed in all respects and submitted to ADG (Statistics), ICFRE, Dehradun, according to the time schedule
24
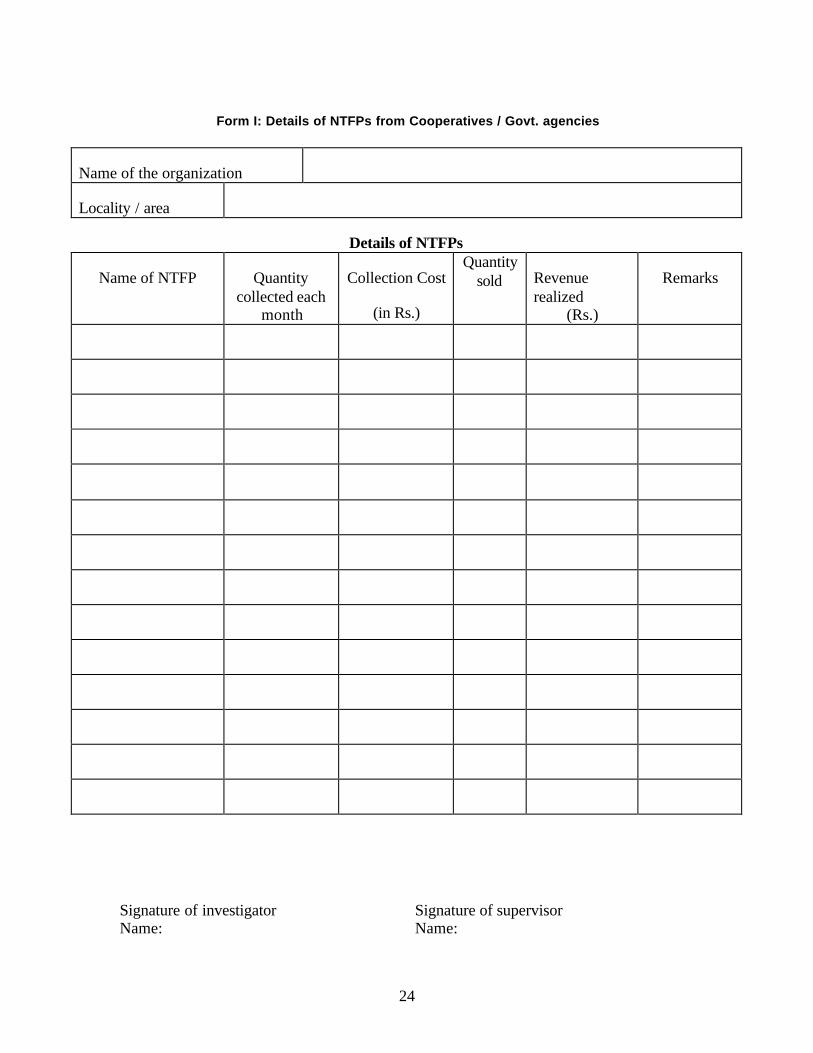
Form I: Details of NTFPs from Cooperatives / Govt. agencies
Name of the organization
Locality / area
Details of NTFPs
Name of NTFP Quantity collected each
month
Collection Cost
(in Rs.)
Quantity sold Revenue
realized (Rs.)
Remarks
Signature of investigator Name:
Signature of supervisor Name:

25
26
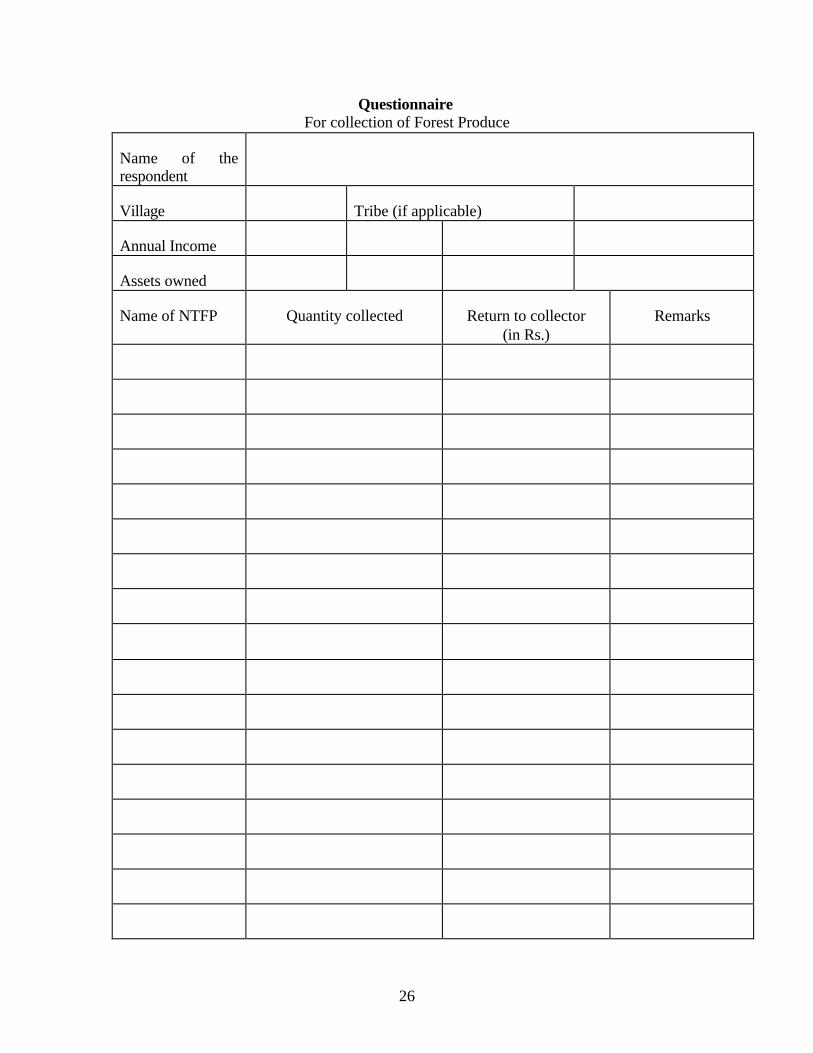
Questionnaire For collection of Forest Produce
Name of the respondent
Village Tribe (if applicable)
Annual Income
Assets owned
Name of NTFP Quantity collected Return to collector (in Rs.)
Remarks

27
Extent of area covered (Km)
Time spent in collection (in days)
Method of selling Cooperative Direct Market To Govt. Agencies
Any other
Estimated quantity of each Forest Products (timber and Non – timber) kept for self use, if any
Name of the produce Quantity kept for self use Purpose
Other Socio – economic details
Number of family members
Male Female Male – children Female – children
Number of family members engaged in collection of forest produce
Male Female Male – children Female – children
Other observations worth reporting

28
Annexure – IV TIMBER
DATA FOR THE MONTH OF
NAME OF THE INSTITUTE
NAME OF THE STATE
This booklet should be completed in all respects and submitted to ADG (Statistics), ICFRE, Dehradun, according to the time schedule

29
Questionnaire for Timber component (traders)
Depot / Market
Staff Position
Category Number of personnel
Salary (p.m.) Remarks
Supervisors
Laborers
Middle level managers
Others
Investment details
Item Value Depreciation Time of installation
Remarks

Form I: Data for Timber in the SFD depots / Plantation Corporations
Name of depot Input Cost
Details of Timber
Incoming quantity (monthly) Outgoing Quantity (Monthly) Species
Round Logs Sawn Poles Firewood
Remarks
Round Logs
Sawn Poles Firewood
Qty Price Qty Price Qty Price Qty Price

31
Signature of investigator:
Name:
Date:
Signature of Supervisor:
Name:
Date:

32
Annexure – IV Supervisors for the survey in ICFRE Institutes
S. No. Institute Supervisor
1. Forest Research Institute, Dehradun
Shri Rajiv Pandey Scientist – D
2. Institute of Forest Genetics & Tree Breeding, Coimbatore
Shri D.R.S. Sekar Scientist – C
3. Institute of Wood Science & Technology, Bangalore
Dr. S.R. Shukla Scientist – D
4. Tropical Forest Research Institute, Jabalpur
Shri Saikat Banerjee,
5. Arid Forest Research Institute, Jodhpur
Dr. V.P. Tewari, Scientist – E
6. Rain Forest Research Institute, Jorhat
Shri A.K. Sarkar
7. Institute of Forest Productivity, Ranchi
Chandrashekar B.S. Scientist – B
8. Himalayan Forest Research Institute, Shimla
Dr. R.K. Verma, Scientist – D

33
Annexure – V
Coordinating team from ICFRE
1. Mr. Pratap Singh, ADG (Statistics), up to 10.06.2005
2. Mr. Ajay Kumar Lal, ADG (Statistics), from 14.06.2005 to 21.04.2006
3. Mr. H.S. Sohal, ADG (Statistics), from 21.04.2006 till date
4. Mr. Raman Nautiyal, Scientist – D (Statistics)
5. Mr. S.K. Sheel, R.A. – I
6. Mr. A.S. Chauhan, R.A. – I
7. Mr. S.S. Aswal, R.A. – I

Acknowledgements