a scalable mixed-level approach to dynamic analysis of c
TRANSCRIPT

A Scalable Mixed-Level Approach to Dynamic
Analysis of C and C++ Programs
by
Philip Jia Guo
Submitted to the Department of Electrical Engineering and ComputerScience
in partial fulfillment of the requirements for the degree of
Master of Engineering in Electrical Engineering and Computer Science
at the
MASSACHUSETTS INSTITUTE OF TECHNOLOGY
May 2006
c© Philip Jia Guo, MMVI. All rights reserved.
The author hereby grants to MIT permission to reproduce anddistribute publicly paper and electronic copies of this thesis document
in whole or in part.
Author . . . . . . . . . . . . . . . . . . . . . . . . . . . . . . . . . . . . . . . . . . . . . . . . . . . . . . . . . . . . . .Department of Electrical Engineering and Computer Science
May 5, 2006
Certified by. . . . . . . . . . . . . . . . . . . . . . . . . . . . . . . . . . . . . . . . . . . . . . . . . . . . . . . . . .Michael D. Ernst
Associate ProfessorThesis Supervisor
Accepted by . . . . . . . . . . . . . . . . . . . . . . . . . . . . . . . . . . . . . . . . . . . . . . . . . . . . . . . . .Arthur C. Smith
Chairman, Department Committee on Graduate Students

2

A Scalable Mixed-Level Approach to Dynamic Analysis of C
and C++ Programs
by
Philip Jia Guo
Submitted to the Department of Electrical Engineering and Computer Scienceon May 5, 2006, in partial fulfillment of the
requirements for the degree ofMaster of Engineering in Electrical Engineering and Computer Science
Abstract
This thesis addresses the difficult task of constructing robust and scalable dynamicprogram analysis tools for programs written in memory-unsafe languages such asC and C++, especially those that are interested in observing the contents of datastructures at run time. In this thesis, I first introduce my novel mixed-level approachto dynamic analysis, which combines the advantages of both source- and binary-based approaches. Second, I present a tool framework that embodies the mixed-levelapproach. This framework provides memory safety guarantees, allows tools builtupon it to access rich source- and binary-level information simultaneously at runtime, and enables tools to scale to large, real-world C and C++ programs on theorder of millions of lines of code. Third, I present two dynamic analysis tools builtupon my framework — one for performing value profiling and the other for performingdynamic inference of abstract types — and describe how they far surpass previousanalyses in terms of scalability, robustness, and applicability. Lastly, I present severalcase studies demonstrating how these tools aid both humans and automated tools inseveral program analysis tasks: improving human understanding of unfamiliar code,invariant detection, and data structure repair.
Thesis Supervisor: Michael D. ErnstTitle: Associate Professor
3

4

Acknowledgments
First and foremost, I would like to thank my mother, Min Zhou, and my father, Sam
Nan Guo, without whom I would have never been blessed with the opportunities that
I have been given in my life thus far.
Thanks to Michael Ernst for inspiring me to find my passion for research, for
giving me the knowledge and foundations to begin graduate-level work, for helping
me to edit and improve the writing in this thesis, and for always demanding nothing
but the best.
Thanks to Stephen McCamant for bringing me into the Program Analysis Group in
January 2004, for teaching me vast amounts of technical knowledge, for his boundless
patience when debugging seemingly insurmountable problems, and for always being
there when I needed help with just about anything while at work.
Thanks to Jeff Perkins for his contributions to the idea of dynamic inference of
abstract types and for providing assistance in understanding and using Daikon.
Thanks to Brian Demsky for being the first serious user of the tools described
in this thesis and for providing bug reports and feature requests that have led to
numerous improvements.
Thanks to my co-authors for their work on the following two papers that I have
incorporated into my thesis: The contents of Chapter 4 are adapted from Dynamic
Inference of Abstract Types [23]. The contents of the data structure repair case study
(Section 3.4.2) in Chapter 3 are adapted from Automatic Inference and Enforcement
of Data Structure Consistency Specifications [12].
5

6

Contents
1 Introduction 15
1.1 Motivation . . . . . . . . . . . . . . . . . . . . . . . . . . . . . . . . . 15
1.2 Source- and Binary-Based Dynamic Analysis . . . . . . . . . . . . . . 18
1.2.1 Source-based instrumentation . . . . . . . . . . . . . . . . . . 19
1.2.2 Binary-based instrumentation . . . . . . . . . . . . . . . . . . 20
1.3 Mixed-Level Approach to Dynamic Analysis . . . . . . . . . . . . . . 21
1.3.1 Example: Dynamic alias analysis . . . . . . . . . . . . . . . . 22
1.4 Thesis Outline . . . . . . . . . . . . . . . . . . . . . . . . . . . . . . . 23
2 The Fjalar Framework 25
2.1 Overview . . . . . . . . . . . . . . . . . . . . . . . . . . . . . . . . . . 25
2.2 Services Provided by the Fjalar API . . . . . . . . . . . . . . . . . . . 27
2.2.1 Dynamic binary instrumentation . . . . . . . . . . . . . . . . 27
2.2.2 Memory safety . . . . . . . . . . . . . . . . . . . . . . . . . . 28
2.2.3 Compile-time language-level information . . . . . . . . . . . . 28
2.2.4 Data structure traversal . . . . . . . . . . . . . . . . . . . . . 30
2.3 Implementation . . . . . . . . . . . . . . . . . . . . . . . . . . . . . . 33
2.3.1 Dynamic binary instrumentation . . . . . . . . . . . . . . . . 34
2.3.2 Memory safety . . . . . . . . . . . . . . . . . . . . . . . . . . 34
2.3.3 Compile-time language-level information . . . . . . . . . . . . 35
2.3.4 Data structure traversal . . . . . . . . . . . . . . . . . . . . . 36
2.4 Building and Executing a Basic Fjalar Tool . . . . . . . . . . . . . . 36
2.4.1 A basic Fjalar tool: basic-tool.c . . . . . . . . . . . . . . . . 37
7

2.4.2 Invoking basic-tool.c on a target program . . . . . . . . . . 40
2.5 Related Work . . . . . . . . . . . . . . . . . . . . . . . . . . . . . . . 41
2.6 Conclusion . . . . . . . . . . . . . . . . . . . . . . . . . . . . . . . . . 42
3 Kvasir: A Tool for Recording Runtime Values of Data Structures 45
3.1 Motivation . . . . . . . . . . . . . . . . . . . . . . . . . . . . . . . . . 45
3.1.1 The Daikon dynamic invariant detection tool . . . . . . . . . . 46
3.1.2 Requirements for a Daikon front-end . . . . . . . . . . . . . . 47
3.1.3 Dfec: A source-based Daikon front-end for C . . . . . . . . . . 49
3.2 Kvasir: A C and C++ Front-End for Daikon . . . . . . . . . . . . . . 52
3.3 Implementation . . . . . . . . . . . . . . . . . . . . . . . . . . . . . . 55
3.4 Evaluation . . . . . . . . . . . . . . . . . . . . . . . . . . . . . . . . . 56
3.4.1 Experiments . . . . . . . . . . . . . . . . . . . . . . . . . . . . 56
3.4.2 Application: Data structure repair . . . . . . . . . . . . . . . 61
3.5 Related Work . . . . . . . . . . . . . . . . . . . . . . . . . . . . . . . 65
3.6 Conclusion . . . . . . . . . . . . . . . . . . . . . . . . . . . . . . . . . 65
4 DynComp: A Tool for Dynamic Inference of Abstract Types 67
4.1 Motivation . . . . . . . . . . . . . . . . . . . . . . . . . . . . . . . . . 68
4.2 Dynamic Inference of Abstract Types . . . . . . . . . . . . . . . . . . 70
4.2.1 Tracking dataflow and value interactions . . . . . . . . . . . . 72
4.2.2 Inferring abstract types for variables . . . . . . . . . . . . . . 74
4.2.3 Example . . . . . . . . . . . . . . . . . . . . . . . . . . . . . . 77
4.3 Implementation . . . . . . . . . . . . . . . . . . . . . . . . . . . . . . 82
4.3.1 Tracking dataflow and value interactions . . . . . . . . . . . . 82
4.3.2 Inferring abstract types for variables . . . . . . . . . . . . . . 83
4.3.3 Optimizations . . . . . . . . . . . . . . . . . . . . . . . . . . . 84
4.4 Evaluation . . . . . . . . . . . . . . . . . . . . . . . . . . . . . . . . . 85
4.4.1 Accuracy . . . . . . . . . . . . . . . . . . . . . . . . . . . . . 86
4.4.2 User studies . . . . . . . . . . . . . . . . . . . . . . . . . . . . 89
4.4.3 Dynamic invariant detection . . . . . . . . . . . . . . . . . . . 91
8

4.4.4 Comparison to static analysis . . . . . . . . . . . . . . . . . . 94
4.5 Related Work . . . . . . . . . . . . . . . . . . . . . . . . . . . . . . . 96
4.5.1 Static abstract type inference . . . . . . . . . . . . . . . . . . 97
4.5.2 Other type inference . . . . . . . . . . . . . . . . . . . . . . . 99
4.5.3 Units analysis . . . . . . . . . . . . . . . . . . . . . . . . . . . 99
4.5.4 Points-to analysis . . . . . . . . . . . . . . . . . . . . . . . . . 100
4.5.5 Slicing . . . . . . . . . . . . . . . . . . . . . . . . . . . . . . . 102
4.6 Conclusion . . . . . . . . . . . . . . . . . . . . . . . . . . . . . . . . . 102
5 Conclusion 103
5.1 Future Work . . . . . . . . . . . . . . . . . . . . . . . . . . . . . . . . 103
5.1.1 The Fjalar Framework . . . . . . . . . . . . . . . . . . . . . . 103
5.1.2 Kvasir: A C and C++ Front-End for Daikon . . . . . . . . . . 104
5.1.3 DynComp: Dynamic Inference of Abstract Types . . . . . . . 104
5.2 Contributions . . . . . . . . . . . . . . . . . . . . . . . . . . . . . . . 105
9

10

List of Figures
1-1 A C program with memory-unsafe constructs . . . . . . . . . . . . . . 16
2-1 Overview of the operation of a tool built upon Fjalar . . . . . . . . . 26
2-2 A C program that contains structs, arrays, and pointers . . . . . . . . 31
3-1 The Daikon dynamic invariant detection system . . . . . . . . . . . . 47
3-2 Source code before and after instrumentation by Dfec . . . . . . . . . 49
3-3 Kvasir as a Fjalar tool that produces trace files for Daikon . . . . . . 52
4-1 Pseudocode for the propagation occurring at each site execution that
translates from value interaction sets to abstract types for variables . 75
4-2 An example C program that uses int as the declared type for variables
of several different abstract types . . . . . . . . . . . . . . . . . . . . 78
4-3 The program of Figure 4-2 after running our dynamic abstract type
inference algorithm . . . . . . . . . . . . . . . . . . . . . . . . . . . . 81
11

12

List of Tables
3.1 Dfec and Kvasir scalability tests for C and C++ Linux programs . . . 57
3.2 Slowdown for programs successfully processed by Dfec and Kvasir. . . 59
4.1 Average number of variables in a type for each site . . . . . . . . . . 86
4.2 Abstract types inferred by DynComp for all global variables within
wordplay . . . . . . . . . . . . . . . . . . . . . . . . . . . . . . . . . . 87
4.3 Effect of types on a follow-on analysis, dynamic invariant detection . 92
4.4 Average number of elements in an abstract type, as computed by the
static tool Lackwit and the dynamic tool DynComp. . . . . . . . . . . 94
13

14

Chapter 1
Introduction
1.1 Motivation
Dynamic analysis is a type of program analysis that operates on information gath-
ered from the program at run time. Dynamic analysis can be used for tasks such
as optimization (profiling, tracing), error detection (testing, assertion checking, type
checking, memory safety, leak detection), error correction (runtime data structure re-
pair, protections against security attacks), and program understanding (coverage, call
graph construction, invariant detection); these categories are not mutually exclusive.
The development of scalable and robust dynamic analysis tools for C and C++
programs is important because programs written in these languages are pervasive
across all categories of software, including in large safety-critical systems (e.g., oper-
ating systems, Internet servers, air traffic control systems). These complex programs
stand to benefit greatly from analysis results in terms of improving robustness, secu-
rity, and performance.
Many kinds of analyses, especially those for software engineering applications,
are interested in observing the contents of data structures at run time. Although
there exist plenty of highly-scalable C and C++ dynamic analysis tools for tasks
such as binary-level profiling and memory leak detection, there is a lack of scalable
and robust automated tools for observing data structure contents. It is challenging in
practice to make such analysis tools work on large C and C++ programs due to the
15

1. int globalInt = 42;
2. int main() {3. int localArray[10]; // contents uninitialized4. int *a, *b, *c, i, j; // c and j uninitialized, *c is meaningless5. a = &globalInt;6. b = (int*)malloc(15*sizeof(int));
// Heap buffer overflow after i = 147. for (i = 1; i < 100; i+=2) {8. b[i] = i; // Initialize only odd-indexed elements of b9. }10. return 0;11. }
Figure 1-1: A C program that demonstrates the memory-unsafe nature of the language
lack of memory safety and source-level complexities inherent in these languages. A
useful dynamic analysis tool that deals with data structures must be able to meet the
following requirements. This thesis describes a novel approach to dynamic analysis
that allows tools built using this approach to meet these requirements better than
tools built using existing approaches.
• Provide memory safety guarantees
When C and C++ programs are executed, there is no indication of whether
regions of memory have been allocated or initialized to valid values, of the sizes
of dynamically-allocated arrays, or of whether there are memory corruption
errors. The code in Figure 1-1 shows some examples of how a C program may
be memory-unsafe. For instance, variables and pointers may be uninitialized;
the analysis must suppress or flag junk values, so as not to corrupt the results.
At the point in execution just prior to line 10, the contents of the local variables
localArray, c, and j are uninitialized and hold junk values of whatever was on
the stack prior to the call of main(). Memory may be unallocated or deallocated,
making a pointer invalid; dereferences of such a pointer (e.g., int *c) yield either
junk values or a segmentation fault. Pointer types are ambiguous; a pointer of
type int* may point to a single integer (e.g., int *a), or to an array of integers
(e.g., int *b). Array lengths are implicit; even if an int* pointer is known to
16

be an array, the run-time system provides no indication of its size. Related
to an earlier point, even if the array’s size is known, it is not known which of
its elements have been initialized (e.g., the even-indexed elements of the array
that b refers to are all uninitialized). Furthermore, if the target program has
memory-related bugs (e.g., the buffer overflow on line 8 when i > 14), it is
important that the analysis tool not crash, even if the target program attempts
an illegal operation. Programs may have latent memory-related bugs which do
not disrupt normal execution, but do appear when running under an analysis
tool, possibly corrupting the data structures of the analysis tool. In order for an
analysis tool to provide accurate information and to be robust against crashes,
it must provide these aforementioned memory safety guarantees that are lacking
during normal program execution.
• Handle complexities of C and C++ source code
C and especially C++ provide ample opportunities for programmers to write
complex and abstruse code that can be difficult to parse (e.g., pointer opera-
tions, casts, C++ templates, preprocessor macros). Larger programs are likely
to contain more complicated source-level constructs. A useful and scalable anal-
ysis tool needs to be able to extract relevant information present in the source
code at the right level of detail for the task it attempts to perform.
• Provide rich language-level information throughout the analysis
The execution of a compiled C or C++ program is actually a sequence of simple
machine instructions on bytes in memory, but humans perceive the execution in
terms of language-level constructs such as statements and functions operating on
variables and data structures. An analysis tool, especially one focused on data
structures for software engineering tasks, needs to provide results in terms of the
language level. Humans (and many follow-on analysis tools) often find language-
level information far easier to comprehend and much more useful than data
about the compiled binary. This mapping between the machine and language
levels must occur throughout the duration of the analysis, because decisions in
17

the algorithms of many analyses must often be made throughout execution with
language-level information taken into consideration.
• Observe complex nested data structures
C and C++ data structures often contain fields that are pointers to other data
structures. An analysis tool must be able to recursively traverse within these
data structures in a safe manner (so as to not report invalid values or crash the
program by dereferencing pointers to unallocated regions of memory) and be
able to reach fields deeply nested within several layers of indirection. Only being
able to observe top-level variables and arrays of primitive types is not nearly as
useful for large programs that make heavy use of complex data structures.
1.2 Source- and Binary-Based Dynamic Analysis
A frequently-used first step for building a dynamic analysis is to augment (instrument)
the target program so that, in addition to executing normally, it also outputs the
proper information that the analysis desires at run time. The two most common
instrumentation techniques are modifying a program’s source code and modifying a
compiled binary representation of a program; each has its own benefits and drawbacks.
Commonly, source-based analyses have been used when language-level information
is required, while binary-based analyses are more common when only machine-level
results are needed. There are also trade-offs of implementation work between source
and binary-based analysis: often a source analysis requires less initial effort, but a
binary analysis is easier to scale to complex target programs.
The mixed-level approach I developed for this thesis combines the best aspects
of both source- and binary-based approaches. Before introducing my mixed-level
approach, I will first examine the pros and cons of these two previous approaches
with regard to meeting the requirements of Section 1.1.
18

1.2.1 Source-based instrumentation
A source-based instrumentation approach modifies the source code of the target pro-
gram by adding extra statements that collect data or perform analysis. Code instru-
mentation by source-code rewriting is the most direct route to constructing a tool
that produces language-level output, and it also makes some aspects of tool imple-
mentation relatively easy.
An analysis that operates by rewriting a target program’s source code can take
advantage of the same level of abstraction that the language provides to program-
mers. It can report results using language-level terms such as functions and variables
because it integrates directly into the target program’s source code. It can also in-
herit the portability of the underlying program: as long as the added code has no
system dependencies, the instrumented code can be compiled and run on any system
where the original program can. More generally, a source-based analysis permits the
developer to consider only one level of abstraction, that of the instrumented language.
Standard programming tools suffice to examine and debug the output of a source-to-
source rewriting tool. Additionally, compiler optimizations automatically reduce the
overhead of instrumentation.
The main disadvantage of source-based instrumentation is that it is extremely
difficult to provide memory safety guarantees by simply rewriting source code. In or-
der to perform many kinds of dynamic analyses on C and C++ programs, metadata
must be kept for pointers to indicate whether they point to an allocated region of
memory, how many elements they point to, etc... Without this metadata, an anal-
ysis must either sacrifice precision (by not dereferencing pointers) or robustness (by
risking crashes from untimely dereferences). Existing work used ‘smart pointers’ im-
plemented as a wrapper class for ordinary pointers supplemented with metadata [57],
but there are scalability limitations due to the complexities of transforming source
code that deals with pointers. For instance, the implementor needs to create adapter
stubs or summaries for all library code that the target program interfaces with, be-
cause their source code is often not available. The difficulty of providing memory
19

safety guarantees also makes it difficult to add code to traverse complex data struc-
tures, which often contain pointers to dynamically-allocated memory.
1.2.2 Binary-based instrumentation
A binary-based approach modifies a compiled executable to add instrumentation code.
Some analyses can be most directly expressed at a binary level, and binary-based tools
are usually easier to use once written.
The most important advantage of a binary-level analysis is that many analysis
problems can be expressed more simply at a lower level of abstraction. At the syn-
tactic level, a binary is a flat list of instructions rather than a nested expression that
requires (potentially complex) parsing. At the semantic level, there are fewer machine
operations than language-level abstractions, and the machine operations are much
simpler. For instance, the language-level description of data has a complex structure
in terms of pointers, arrays, and recursive structures. By contrast, the machine-level
representation of data is as a flat memory with load and store operations. If the prop-
erty to be analyzed can be expressed in terms of the simpler machine representation,
then the language-level complexities can be ignored. For instance, ensuring memory
safety on the binary level is a much easier task than doing so on the source level.
There are also three ways in which binary-based analysis tools can be easier to use.
First, a binary tool need not be limited to programs written in a particular language:
Language-level differences between programs are irrelevant as long as the programs
are compiled to a common machine representation. Second, a binary tool need not
make any distinction between a main program and the libraries it uses: execution in a
library is analyzed in just the same way as the rest of the program’s execution. There
is no need to recompile libraries or to create hand-written simulations or summaries
of their behavior as is often required for source-based analyses. Third, a binary-based
tool requires fewer extra steps to be taken by a user (none, if the instrumentation
occurs at run time). A source-based analysis at least requires that a program be
processed and then recompiled before running; this can be cumbersome, because
compiling a large system is often a complicated process due, in part, to the presence
20

of conditional compilation and other C preprocessor macros.
One major disadvantage of a binary-based approach to dynamic analysis is that
most analyses need some sort of language-level information (e.g., variable names),
and that is often impossible to obtain by only looking at the binary code of a tar-
get program. For instance, it is very difficult for a binary-only analysis to provide
information about the shapes and contents of data structures.
Many existing binary-based dynamic analysis tools incorporate language-level in-
formation as a post-processing step in order to produce human-readable output. For
instance, a binary-based tool may discover a bug (say, an illegal memory operation)
at a particular instruction. After the execution terminates, the tool translates the
address, which would not in itself be helpful to a user who is trying to fix the error, to
a line number in the program source code. Most uses of source information by binary
analyses are limited to this sort of incidental post-processing. However, recall from
Section 1.1 that it is often useful to integrate language-level information throughout
the duration of the analysis, a feature that is lacking in existing binary-based tools.
1.3 Mixed-Level Approach to Dynamic Analysis
Users often desire the output of an analysis to be in terms of source-level constructs,
but a binary analysis can be more natural to implement. Thus, to permit a dynamic
analysis to obtain the key benefits of both source and binary analysis, I propose a
mixed-level approach that performs a binary analysis supplemented with a mapping to
the source level used throughout the analysis (and not just as a post-processing step)
to interpret machine-level data and operations in terms of language-level constructs
such as variables, types, and functions. This approach has the following benefits of
a binary-based analysis: ease of ensuring memory safety, reduced dependence on the
target program’s language and dialect, and ease of use. It has the following benefits of
a source-based analysis: full knowledge of variables, types, and data structures, and
the ability to report results in a format that a human can reasonably comprehend.
A tool that implements the mixed-level approach performs most of the tracking of
21

a program’s run-time behavior at the instruction level, obtaining the key benefits of
a binary-based approach (e.g., ease of ensuring memory safety, simplicity of machine
instructions and memory model, ease of use). When it is necessary to use source-level
abstractions as the analysis is running, the low-level binary information can be trans-
lated into a language-level representation. This translation requires a limited form
of source information (obtained, for instance, from debugging information inserted
by the compiler), but need not consider all of a language’s source-level complexities,
thus simplifying implementation and improving robustness.
The mixed-level approach provides many of the benefits of a source-based ap-
proach without the drawbacks of dealing with the complexities of parsing C and C++
source code. It is also an improvement over many existing binary-based dynamic anal-
yses that incorporate a small amount of source-level information as a post-processing
step in order to produce human-readable output. For many analyses (such as the
alias analysis of Section 1.3.1, the value profiling of Chapter 3, and the type inference
of Chapter 4), only using source-level information as a post-processing step causes a
loss of accuracy, because the results depend upon updating information about source
constructs (such as functions and variables) while the analysis is running.
1.3.1 Example: Dynamic alias analysis
As an example of where a mixed-level approach is superior to a purely source-based,
purely binary-based, and to a binary-based approach with source information incor-
porated as a post-processing step, consider an alias analysis, which reports whether
two pointer variables might simultaneously refer to the same object. A dynamic alias
analysis can detect whether two pointers were ever aliased during a set of executions.
The alias results are useful for a profile-directed optimization that transforms the
code to check whether the pointers were different, and if so, to use a code path that
allocates the pointed-to values in registers [8]. A dynamic alias analysis could be
performed naturally using the mixed-level approach: The analysis tool could observe
at the machine level each instruction operating on an address, and then record its
effect in terms of the corresponding language-level pointers.
22

By contrast, other commonly used approaches would be much more cumbersome:
• A source-to-source translation tool could track each pointer modification by
inserting recording routines for each operator at the source level, but such a
strategy is difficult to implement robustly.
• A technique that recorded information in a purely binary form, and then post-
processed it to print using source terminology, would not be workable because
the mapping between machine locations and language-level pointer expressions
is needed to interpret each operation; such an approach would essentially have
to store a complete trace.
This pattern of trade-offs applies to many dynamic analyses and demonstrates the
applicability of the mixed-level approach: output is desired in terms of source con-
structs, but a binary analysis would be more natural to implement.
1.4 Thesis Outline
The rest of this thesis is structured as follows.
Chapter 2 describes the Fjalar framework that I have implemented using the
mixed-level approach. Fjalar allows for whole- or partial-program instrumentation of
binaries and takes advantage of limited language-level information provided by the
debugging information compiled into the binary files. Fjalar’s API allows tools built
upon it to traverse through data structures at run time and safely observe and modify
memory values at arbitrary points in execution without risk of crashing or reading
uninitialized values. Fjalar is built upon the Valgrind [39] binary translation tool
for rewriting x86 executables and currently supports any C or C++ dialect that is
compilable by gcc.
In addition to building the Fjalar framework, I have used Fjalar to create two
dynamic analysis tools, evaluated them in controlled experiments, and applied them
to perform several program analysis tasks on real-world C and C++ programs of up
to one million of lines of code such as a scientific research tool (RNA-fold), a multi-
23

player game (Freeciv), an Internet DNS server (BIND), and an air traffic control
system (CTAS).
Chapter 3 describes a value profiling tool named Kvasir. Kvasir performs a kind
of value profiling for software engineering applications which consists of recording
a detailed trace of data structure contents during a target program’s execution. It
serves as the C/C++ front-end for the Daikon dynamic invariant detection tool,
enabling Daikon to find invariants in C and C++ programs. I contrast Kvasir with
its predecessor, a source-based tool, and show how a mixed-level approach is superior
to a source-based one for this particular application. I also present a case study where
I applied Kvasir as part of a data structure repair system.
Chapter 4 describes a novel technique and tool for performing dynamic inference
of abstract types. The analysis attempts to partition a target program’s variables into
sets representing their abstract types, a finer notion of types than the few primitive
declared types (e.g., int, float) that C and C++ provide. The algorithm requires
both binary- and source-level information integrated throughout the duration of ex-
ecution, so it is very suitable for implementation using the mixed-level approach. I
built a tool named DynComp to implement this technique. In this chapter, I present
the technique, the DynComp tool, the applications of DynComp to program under-
standing and invariant detection tasks, and contrast it with a previous static approach
to abstract type inference.
Chapter 5 lists possibilities for future work and summarizes the contributions of
this thesis.
24
Chapter 2
The Fjalar Framework
I have developed a tool framework named Fjalar that embodies the mixed-level ap-
proach of Section 1.3. This chapter provides an overview of Fjalar (Section 2.1) and
describes services that its API provides to tools (Section 2.2), how it is implemented
(Section 2.3), and a brief tutorial on how to build a basic tool upon it (Section 2.4).
2.1 Overview
I have developed a framework named Fjalar to enable people to construct scalable and
robust dynamic analysis tools using the mixed-level approach. Fjalar provides an API
that allows tools built upon it to access rich language- and machine-level information
at run time, providing services useful for many types of dynamic analyses: binary
rewriting, memory allocation and initialization tracking, mapping between memory
addresses and language-level terms such as variables and functions, and recursive
traversals of data structures during run time. These services make Fjalar particularly
well-suited for building dynamic analyses for software engineering applications that
are interested in observing data structures.
Figure 2-1 provides an overview of the process of running a Fjalar tool on a target
program. To prepare the target program for analysis, a user must first compile its
source code with gcc with DWARF2 debugging information and with no optimizations
to produce a binary executable. The user then runs the Fjalar tool with the binary
25

Fjalar
Fjalar API
AnalysisResults
InstrumentDynamicallyExecute &
gcc001010101101
CodeSource
*.c *.cpp*.h
Compile
Fjalar ToolBinary
Figure 2-1: Overview of the operation of a tool built upon Fjalar
as input, and the tool dynamically instruments the program to perform the intended
analysis (Section 2.4 shows a more detailed example of how to build and run a Fjalar
tool). The tool interfaces with Fjalar through an API whose services are described
in Section 2.2.
There is little burden on the user of a Fjalar tool; the requirements of DWARF2
debugging information and no optimizations are gcc flags (-g -O0) that can be easily
added as one line to a Makefile or equivalent compilation script. After compilation,
the user can invoke a Fjalar tool using a one-line command (such as fjalar-tool
<program-binary>) to run the analysis.
The primary limitation of Fjalar is that it only works on the x86/Linux platform.
Future work (Section 5.1) includes porting Fjalar to additional hardware platforms
(e.g., AMD64, PowerPC) and operating systems (e.g., BSD, Mac OS X) as well as to
additional languages supported by gcc (e.g., Objective-C, Fortran, Java, Ada).
Fjalar is publicly available on the web as a stand-alone source code release (along
with documentation and a Programmer’s Manual) at http://pag.csail.mit.edu/
fjalar/ and is also integrated into two tools (see Chapters 3 and 4) within the
source code distribution of the Daikon dynamic invariant detector (see Section 3.1.1)
at http://pag.csail.mit.edu/daikon/.
(Fjalar is the name of a dwarf in Norse mythology. Two components of the
26

framework inspired this name: the DWARF debugging information format and the
Valgrind tool. Valgrind is the name of a legendary gate in Norse mythology.)
2.2 Services Provided by the Fjalar API
Fjalar’s API provides the following services to tools:
1. Dynamic binary instrumentation
2. Memory safety guarantees, including reporting dynamic array sizes and indi-
cating which regions of memory are allocated and/or initialized
3. Rich compile-time information about data structures, variables, and functions
4. Customizable memory-safe traversals within data structures and arrays
2.2.1 Dynamic binary instrumentation
A dynamic analysis often requires a means to instrument the target program so that it
can provide the desired information at run time. Fjalar uses Valgrind [39], a program
supervision framework based on dynamic binary rewriting, to insert instrumentation
operations in the target program. Because it operates on machine code, Valgrind is
naturally language-independent and makes no distinction between user-written and
library code, so analyses built upon it can easily track whole program executions.
However, Valgrind is limited to only certain hardware platforms and operating sys-
tems, and Fjalar’s particular use of Valgrind only allows it to work on x86/Linux.
During the target program’s execution, Valgrind translates the x86 instruction
stream into a typed assembly language called IR (which is simpler than x86 assembly,
thus reducing implementation effort) and allows the tool writer to instrument the
IR with tracing or analysis code. The instrumented IR is then just-in-time (JIT)
compiled back into x86 code and executed natively. Thus, a tool can insert IR code in
the target program that accesses machine-level information about registers, memory,
and instructions, giving it the full power of a binary-level analysis.
27

Fjalar performs one default type of IR instrumentation: inserting hooks at certain
points in the target program’s execution to call out to execute the tool’s code. This
feature is useful because tools (such as the ones described in Chapters 3 and 4) need to
periodically collect and analyze data gathered at certain points in execution. I have
currently implemented support for calling out to the tool’s code during the target
program’s function entrance and exit points. There is an option to make calls to
the tool’s code only during the entrance and exit points of selected functions, thus
enabling partial program analysis.
2.2.2 Memory safety
Fjalar’s API allows tools to query any byte of memory anytime during the target
program’s execution and tell whether that byte has been explicitly allocated by the
program and whether it has been initialized to a valid value. It also allows tools
to determine array sizes at run time by combining memory allocation information
with compile-time information (Section 2.2.3). Given a pointer, Fjalar can determine
at any time in execution whether that pointer refers to one element or to an array
of elements, and if it is an array, the size of the array at that time. It can then
use memory initialization information to tell exactly which elements of that array
have been initialized to valid values. This memory-related information is crucial for
building accurate and robust dynamic analyses but is not available on the machine-
code runtime environment that C and C++ programs execute under (unlike, for
example, a Java Virtual Machine runtime environment for Java), thus creating the
need for these Fjalar services.
2.2.3 Compile-time language-level information
The services described thus far are for a binary-level analysis, but many dynamic anal-
yses need access to language-level constructs such as variables and functions during
execution. Fjalar embodies the mixed-level approach by providing rich compile-time
language-level information to tools and integrating it tightly with run-time memory
28

allocation and initialization information. Given a C or C++ expression that repre-
sents a storage location (i.e., an lvalue), Fjalar’s API allows a tool to find the address
and size of that object at a particular moment in the target program’s execution. This
language-level information, coupled with Fjalar’s memory safety services, allows tools
to not only be able to safely access valid regions of memory, but more importantly, to
associate semantic meanings with observed memory contents, thus mapping between
binary- and language-level information. For example, without language-level infor-
mation during the analysis, a tool can only tell that a certain block of bytes contains
some binary value, but with such information, it can interpret that binary value as
an integer, floating-point number, string, data structure, etc...
Fjalar extracts rich language-level information from the debugging information
compiled into the target program’s binary. It provides tools with direct access to
data structures representing compile-time information about functions, variables, and
types as well as iterators for these data structures, enabling these services:
• Provides access to function names, addresses, and visibility, and associates pa-
rameters and return values with their types
• Provides access to variable names, types, addresses, sizes for static arrays, and
visibility (e.g., private, protected, or public member variable, file-static variable)
• Associates struct/class types with their member variables to enable traversals
within nested and recursively-defined data structures
• Supports C++ features such as overloaded functions, reference parameters,
classes, member variables and functions, and multiple class inheritance
• Creates unique names for global variables and functions to eliminate ambiguity
for tools that perform whole-program analysis
• Simplifies typedefs by finding their referred-to types, creates names for unnamed
structs/classes, and performs other misc. tasks to disambiguate obscure usage
of C and C++ syntax
29

Fjalar can also export the compile-time structure of a target program to an XML
file which hierarchically organizes global variables, functions, formal parameters, local
variables, and user-defined types such as typedefs, enums, structs, and classes. This
information is useful for debugging or to supplement an analysis.
2.2.4 Data structure traversal
Fjalar gives tools the ability to observe the contents of language-level variables, ar-
rays, and data structures at runtime while maintaining the robustness, coverage, and
language-independence of a binary-level analysis. Most non-trivial programs use data
structures such as arrays, linked lists, trees, and aggregate types (e.g., structs and
classes). Often times, structs and classes contain member variables which are them-
selves structs and classes (or pointers to such), thus resulting in complex linked and
nested data structures. Many kinds of dynamic analyses can benefit from run-time
observation of the contents of these data structures, even at times when the target
program did not directly manipulate these structures. A tool that only observes data
at times when the target program observes or manipulates that data is easier to build
and safer (it will not crash if the target program does not crash) but produces limited
information. Fjalar enables the construction of more powerful tools that can traverse
any data structure in scope and even those not in scope, as long as they contain
initialized data. For example, in Figure 2-2, foo’s argument rec is a structure that
contains two pointers and a static array. To observe all of its contents, a tool must be
able to follow pointers and recursively traverse inside of structures and arrays, observ-
ing the values of the pointers rec.a, rec.b, rec.c, and the arrays referred to by those
pointers: rec.a[] (an array of 100 integers on the stack), rec.b[] (1 allocated but
uninitialized integer on the heap), rec.c[] (array of 10 uninitialized integers within
the struct).
A purely binary-based analysis cannot accomplish such detailed observation ab-
sent some indication of how to interpret raw binary values as data structures. It is
possible but extremely complicated to accomplish such observation with a source-
based analysis, because it must parse and generate complex source syntax which deal
30

struct record {int *a, *b;int c[10];
};
void foo(struct record rec) {}
int main() {int localArray[100];... initialize the 100 ints within localArray ...struct record r;r.a = localArray;r.b = (int*)malloc(sizeof(int));foo(r);
}
Figure 2-2: A C program that contains structs, arrays, and pointers
with data structures and, more significantly, maintain metadata such as pointer valid-
ity, memory initialization, and array sizes. Thus, a mixed-level approach implemented
by Fjalar is preferred for robustness and ease of implementation.
Fjalar’s API provides recursive data structure traversal functionality, allowing
tools to observe the contents of arrays, follow pointers to observe structures such as
linked lists and trees, and recursively traverse inside of struct fields, all while ensuring
memory safety so that the analysis does not crash the target program.
Here is the general traversal procedure along with features that allow tools to
precisely control which data structures to observe and how to traverse through them:
• At every point in the traversal process, Fjalar provides tools with pointers to
every variable, every member variable of a struct/class, and to every element
of an array, along with corresponding type information. These pointers are
guaranteed to point to allocated and initialized memory locations. The tool
can pass callback functions (called action functions) into the Fjalar traversal
functions to allow it to record, analyze, or modify values as the target program
executes.
• If the current variable is a pointer, then Fjalar follows the pointer (if it points to
an allocated and initialized region of memory) to visit the subsequent variable
31

resulting from the pointer dereference.
• If the current variable is an array, then Fjalar visits all elements of the array
‘simultaneously’ by providing an array of pointers to the tool’s action function,
where each element points to an element in the array.
• If the current variable is a struct, union, or class, then Fjalar traverses inside
of it by visiting all of the fields. This process is recursive (the depth can be
controlled by command-line options).
• Fjalar generates unique names for variables derived from traversing inside of
structures and arrays. These names can be parsed more or less as valid C
expressions (e.g., foo->bar.baz[1] is the name given to the variable derived as
a result of dereferencing a struct pointer foo, observing its member variable bar,
which is itself a struct with an array member variable named baz, and finally
observing the value of the 2nd element of baz).
• Fjalar provides numerical parameters for determining how many levels of struct
or class objects to traverse. For a linked list, binary tree, or other data structure
that contains member variables of its same type, a bound on the traversal depth
is required to prevent infinite recursion. For other data structures, an adjustable
bound provides a performance versus detail tradeoff.
• Fjalar provides options for selectively tracing only certain variables, such as
ignoring global variables, limiting the output of file-static variables, and allowing
the user to specify which variables are of interest to the tool, enabling precise
partial-program analysis by zooming in on certain interesting data structures
within a large program (the case studies in Chapters 3 and 4 often make heavy
use of this selection mechanism).
• Fjalar allows the user to specify whether a pointer variable refers to one element
or to an array of elements; the traversal can be more precise when the user knows
a priori that a particular pointer will always refer to one element.
32

• Fjalar allows the user to specify what type a pointer variable should be cast to
before dereferencing it, which is especially useful for C programs. By default,
a pointer is dereferenced as its declared type, but in some C programs, a void*
pointer is used to emulate runtime polymorphism, so it must be cast to another
pointer type before it can be dereferenced to reveal member variables. Also,
often times a char* pointer is used to refer to a generic memory buffer which
contains data of various types, so those pointers must be cast to other types
before dereferencing them to observe the buffer contents in a useful form.
All of the aforementioned options related to data structure traversal are more
thoroughly documented in the Fjalar Programmer’s Manual (http://pag.csail.
mit.edu/fjalar/fjalar_manual.htm).
The recursive data structure traversal services of Fjalar exemplify the mixed-level
approach because, in order to safely and efficiently traverse through arbitrary data
structures at any point in execution, both binary- and language-level information
is required simultaneously. The mixed-level approach allows for the construction of
powerful tools that can trace, analyze, and modify both binary-level components such
as instructions, memory, and registers as well as language-level components such as
functions, variables, and data structures.
2.3 Implementation
Fjalar is implemented as a C program on top of three existing open-source tools: the
Valgrind binary rewriting tool [39], the Valgrind Memcheck memory leak detection
tool [46], and the Readelf ELF binary file parser tool from the GNU Binutils pack-
age [19]. Fjalar provides a C language API, so a Fjalar tool must be written either
in C or in another language (e.g., Python, Java) that provides a C wrapper. This
section describes how Fjalar uses code from these tools along with its own code to
provide the services described in Section 2.2.
33

2.3.1 Dynamic binary instrumentation
Valgrind operates by executing a target program under its supervision, translating the
x86 instruction stream into its own typed assembly language called IR, dynamically
instrumenting the IR, and JIT-compiling the original and instrumentation code back
to x86 code to execute natively. I have implemented Fjalar as a Valgrind tool, so any
tools built upon Fjalar can directly use the Valgrind API to write code that performs
IR instrumentation at run time.
2.3.2 Memory safety
Fjalar utilizes a modified version of the Valgrind Memcheck tool [46] to provide the
requisite memory safety guarantees described in Section 1.1. Memcheck is typically
used to detect memory errors such as memory leaks, reading/writing unallocated
areas of memory, and the use of uninitialized values. It has been successfully used
to detect memory errors in large C and C++ programs such as Mozilla, OpenOffice,
KDE, GNOME, and MySQL, so it is an extremely practical and scalable tool. Similar
to Purify [24], Memcheck tracks whether each byte of memory has been allocated (by
assigning an A-bit to every byte which is set only when that byte is allocated) and
whether each bit of memory has been initialized (by analogously assigning a V-bit to
every bit). Thus, Memcheck operates by keeping track of 8 V-bits and 1 A-bit for each
byte of memory in the target program’s address space. If a particular byte of memory
has been allocated for use and is safe to access, then the A-bit for that byte is set. If
a particular byte contains a value that has been explicitly initialized by the program,
the 8 V-bits for that byte are set (each V-bit corresponds to one bit in memory, so
it is possible for only some of the V-bits of a byte to be set; this might happen with
bit fields of structs, for instance). Memcheck inserts redzones of memory with unset
A-bits between malloc’ed regions to detect array bounds overflow errors, which are
also useful for clearly marking array boundaries in the heap. Because Memcheck is
built as a Valgrind tool, it uses the Valgrind API to rewrite the target program’s
binary to copy and maintain A- and V-bits throughout memory and registers.
34

Fjalar leverages Memcheck’s functionality and scalability by including a modified
version of the Memcheck source code into its own code base. Fjalar’s API allows tool
builders to query the A- and V-bits in order to ensure that memory accesses do not
result in segmentation faults or invalid data, respectively. In order to determine the
sizes of dynamically-allocated arrays on the heap, the Fjalar API provides a function
which takes in a memory address, and if it is a heap address, scans forward and
backward until it finds addresses with unset A-bits (guaranteed to be present by
the redzones that Memcheck inserts). The number of contiguous bytes of allocated
memory divided by the number of bytes per element of the type of the pointer equals
the size of the array. To find the sizes of static arrays, Fjalar can rely on compile-time
language-level information (Section 2.3.3).
2.3.3 Compile-time language-level information
Fjalar obtains compile-time language-level information about functions, variables,
and types by parsing the DWARF2 debugging information that is compiled into the
target program’s binary. I built a debugging information parser on top of a modified
version of Readelf (from the GNU Binutils package), a tool that takes as input an ELF
binary file (the standard format on Linux systems) and outputs information such as
its symbol table and debugging information. Readelf provides a mode that outputs
the debugging information as a human-readable text file. I built infrastructure around
that code to have it populate Fjalar’s data structures instead of outputting text.
The traditional (and intuitively obvious) method of obtaining language-level in-
formation is to simply parse the source code of the target program. After all, the
relevant information must be present in the source code. Previous researchers in my
group used the EDG compiler front end [13] for parsing C and C++ source code. The
CIL framework from Berkeley attempts to transform arbitrary C code into a tamer
subset of C that is semantically cleaner, and is often used as the front-end for many
source-based analyses [37].
However, source code for C and especially for C++ programs is notoriously dif-
ficult to parse. Also, a source parser must be modified for different dialects of these
35

languages. In contrast, debugging information is fairly robust to changes in language
dialect and even languages because the format is supposedly language-independent
(many languages that gcc supports produce similar debugging information). The
only thing that it does not contain which is present in the source is control-flow in-
formation, but Fjalar only requires information about data, not about control flow.
I have found that debugging information provides just the right level of abstraction
for obtaining what I need for Fjalar without excessive implementation effort.
The bulk of my implementation effort in this module was to simplify what is
found in the debugging information in order to place it in Fjalar data structures
for three main kinds of objects: functions, variables, and types. Thus, Fjalar tool
builders can ignore all the complexities of source code and of debugging information
and easily retrieve relevant compile-time information about data such as the types of
the parameters of all functions, the names and types of the member variables of those
parameters (if they are structs or classes), the addresses of global variables, etc...
2.3.4 Data structure traversal
This module combines the memory safety features of the Fjalar API with the data
structures holding compile-time information to provide functionality for traversing
through the target program’s data structures at run time. I have implemented various
file formats to allow the user to specify which variables to trace, whether certain
pointers should be considered as pointing to one element or to an array, and whether
pointers should be coerced into a different type during traversal (useful for void*
pointers, for instance). The details of these file formats are described in the Fjalar
Programmer’s Manual (http://pag.csail.mit.edu/fjalar/fjalar_manual.htm).
2.4 Building and Executing a Basic Fjalar Tool
This section briefly describes how to use Fjalar to build a tool and how to invoke that
tool on a target program.
36

2.4.1 A basic Fjalar tool: basic-tool.c
I will now describe basic-tool.c, a demonstration Fjalar tool that is bundled with
the Fjalar source code distribution. It performs a standard data structure traversal
described in Section 2.2.4 at all function entrance and exit points, prints out the names
of all variables it encounters, and if a particular variable is the dereferenced contents
of a pointer, prints out how many elements are in the array. This tool implements
the minimum number of functions required of any Fjalar tool. I have included all of
the code of basic-tool.c in this section, but I will intermix code snippets with their
descriptions for greater clarity.
The code below shows fairly standard setup and teardown functions that run
when the tool begins and finishes execution, respectively. This tool simply prints
out various text messages during those times (using VG (printf)() instead of the
standard C library printf() because Valgrind requires all tools to use its own version
of C library functions). Most non-trivial tools will perform their own initialization,
command-line option processing, and clean-up routines using these functions.
// Runs before processing command-line options:void fjalar_tool_pre_clo_init() {VG_(printf)("\nBefore option processing\n\n");}
// Runs after processing command-line options:void fjalar_tool_post_clo_init() {VG_(printf)("\nAfter option processing\n\n");}
// Prints instructions when the --help option is invoked:void fjalar_tool_print_usage() {VG_(printf)("\nPrinting usage\n\n");}
// Processes command-line options:Bool fjalar_tool_process_cmd_line_option(Char* arg) {// Return false because we have no options to processreturn False;
}
// Runs after the tool exits:void fjalar_tool_finish() {VG_(printf)("\nTool is finished!\n");}
The basicAction function shown below is an action function which defines the
action that this tool takes for every step of a traversal. The tool passes this as a call-
back function into Fjalar’s data structure traversal routines. When Fjalar performs
37

traversals, it calls this function at every variable it reaches, populating this function’s
parameters with the appropriate contents. For instance, var contains information
about the current variable active at this step of the traversal, varName is the name
that Fjalar provides for it (e.g., foo->bar.baz[1]), and varFuncInfo is the function
of the target program that is currently executing while this traversal is occurring.
Most importantly for a tool, pValue is a pointer to the contents of this variable if
it is a single element (isSequence is false) and pValueArray is an array of pointers
to the contents of this variable if it is an array of elements (isSequence is true) and
numElts is the number of elements in the array. Notice that these pointers are of type
void*, but the VariableEntry* var parameter contains enough type information to
disambiguate the pointers at run time.
TraversalResult basicAction(VariableEntry* var,char* varName,VariableOrigin varOrigin,UInt numDereferences,UInt layersBeforeBase,Bool overrideIsInit,DisambigOverride disambigOverride,Bool isSequence,// pValue only valid if isSequence is falsevoid* pValue,// pValueArray and numElts only valid if// isSequence is truevoid** pValueArray,UInt numElts,FunctionEntry* varFuncInfo,Bool isEnter) {
if (isSequence) {VG_(printf)(" %s - %d elements\n", varName, numElts);}else {VG_(printf)(" %s\n", varName);}
// We want to deref. more pointers so that we can find out array// sizes for derived variables:return DEREF_MORE_POINTERS;
}
In basicAction, this basic tool simply prints out varName and, if it is a sequence,
the number of elements in the sequence. It does not actually do anything with the
38

observed values of the variables during traversal. However, most non-trivial tools
would actually use pValue and pValueArray to observe or even modify the values
of variables at run time. Fjalar guarantees that the memory addresses referred to
by these pointers are always allocated and their values are initialized as long as the
pointers are non-null.
The code below shows two functions that are called whenever the target program
enters or exits any functions during execution, respectively (the user can selectively
trace only the entrances and exits of particular functions by specifying their names in
a file). The basic tool prints out the function name along with “- ENTER” or “- EXIT”,
then traverses through all global variables, function parameters, and the return value
(only on exit). Notice that the tool passes the address of the basicAction function
as a function pointer parameter (a callback) to Fjalar’s traversal functions in order
to specify what happens during each step of the traversal.
void fjalar_tool_handle_function_entrance(FunctionExecutionState* f_state) {VG_(printf)("[%s - ENTER]\n",f_state->func->fjalar_name);
VG_(printf)(" Global variables:\n");visitVariableGroup(GLOBAL_VAR, 0, 1, 0, &basicAction);
VG_(printf)(" Function formal parameters:\n");visitVariableGroup(FUNCTION_FORMAL_PARAM, f_state->func, 1,
f_state->virtualStack, &basicAction);}
void fjalar_tool_handle_function_exit(FunctionExecutionState* f_state) {VG_(printf)("[%s - EXIT]\n", f_state->func->fjalar_name);
VG_(printf)(" Global variables:\n");visitVariableGroup(GLOBAL_VAR, 0, 0, 0, &basicAction);
VG_(printf)(" Function formal parameters:\n");visitVariableGroup(FUNCTION_FORMAL_PARAM, f_state->func, 0,
f_state->virtualStack, &basicAction);
VG_(printf)(" Return value:\n");visitReturnValue(f_state, &basicAction);
}
39

The code below shows the constructors and destructors for the 3 ‘classes’ in
Fjalar’s API – VariableEntry, TypeEntry, and FunctionEntry – that can be sub-
classed. Because Fjalar is implemented in C, there is of course no language support
for object-oriented programming, so I implemented class inheritance via structural
subtyping where, for example, a subclass of VariableEntry contains an instance of
VariableEntry as its first member variable and then adds additional members after it.
Then constructVariableEntry() needs to be modified to allocate enough space for
the extra members of the subclass. Subclassing is very useful for these classes because
many Fjalar API functions take objects of these classes as parameters. The basic tool
performs no subclassing and thus implements trivial versions of these functions.
// Constructors and destructors for classes that can be sub-classed:
// We do not implement any sub-classing so just implement the ’default’// constructor/destructor by calling VG_(calloc) and VG_(free), respectivelyVariableEntry* constructVariableEntry() {
return (VariableEntry*)(VG_(calloc)(1, sizeof(VariableEntry)));}
TypeEntry* constructTypeEntry() {return (TypeEntry*)(VG_(calloc)(1, sizeof(TypeEntry)));
}
FunctionEntry* constructFunctionEntry() {return (FunctionEntry*)(VG_(calloc)(1, sizeof(FunctionEntry)));
}
void destroyVariableEntry(VariableEntry* v) {VG_(free)(v);}void destroyTypeEntry(TypeEntry* t) {VG_(free)(t);}void destroyFunctionEntry(FunctionEntry* f) {VG_(free)(f);}
2.4.2 Invoking basic-tool.c on a target program
These steps allow the tool implemented by basic-tool.c to run on a target program:
1. Compile Fjalar along with basic-tool.c by setting the appropriate Makefile pa-
rameters and running make on an x86/Linux machine. (see the Fjalar Program-
40

mer’s manual, http://pag.csail.mit.edu/fjalar/fjalar_manual.htm, for
more details.)
2. Compile the target program normally with gcc (or g++ for a C++ program),
making sure to use the -g and -O0 command-line options to insert DWARF2
debugging information and to disable all optimizations, respectively. Let’s say
that this generates a binary executable file named target-prog. (I have tested
Fjalar on various gcc versions from 3.0 to 4.0)
3. Execute “valgrind --tool=fjalar target-prog” to run the tool on the target
program. (The actual invoked executable is Valgrind because Fjalar is actually
a Valgrind tool, but it is recommended to create an alias called basic-tool to
refer to “valgrind --tool=fjalar”. Then executing “basic-tool target-prog”
will suffice.)
Because a Fjalar tool operates directly on the binary of a target program, it is
extremely easy to use. I have purposely not included a separate evaluation section for
Fjalar (i.e., experiments to test its functionality, robustness, scalability, performance,
etc...) because the real evaluation of a tool framework is the tools that can be built
on top of it. Chapters 3 and 4 describe two tools that I have built, and each chapter
contains its own respective evaluation section for those tools and their applications
to real-world program analysis tasks.
2.5 Related Work
Much of the Fjalar infrastructure is devoted to tracking uses of memory; this is a key
requirement for a rich dynamic analysis of non-memory-safe programs. Most memory
tracking analyses aim to detect memory errors in C programs.
Representative recent source-based work is by Xu et al. [57], who rewrite C pro-
grams to maintain ‘smart pointers’ with metadata. Although their approach scales
41

up to programs as large as 29 KLOC, it suffers from the problems inherent in all
source-based approaches: development challenges with parsing C source code, diffi-
culty in supporting additional languages such as C++, and the inability to handle
complex language constructs such as integer-to-pointer casts, certain types of struct
pointer casts, and the use of custom memory allocation functions. Earlier work in-
cludes Safe-C [5] and CCured [38], which analyzes C programs to reduce the cost of
dynamic checking.
The best-known binary-based dynamic memory analysis is Purify [24], which per-
forms ahead-of-time binary instrumentation so that the program maintains bits indi-
cating whether each byte of memory is allocated and initialized, and checking them
before uses. Memcheck [46], which I use in Fjalar, is similar but is accurate to the
bit level and employs a just-in-time compiler. Many similar tools exist with some or
all of the capabilities of these tools; for example, another popular approach is using
special system libraries (e.g., malloc and free).
Binary analysis and editing frameworks include ATOM [48], EEL [31], Etch [45],
DynamoRIO [7], and Valgrind [39]. These are low-level tools intended for use in
binary transformations that improve performance or security, so they make no ac-
commodation for communicating information to a software engineer, much less in
terms of source level constructs. Fjalar augments Valgrind’s binary-only analysis
with language-level information.
2.6 Conclusion
Fjalar is a framework for building dynamic program analysis tools for C and C++
programs, especially those that deal extensively with data structures. By adopting
a mixed-level approach, it can be more scalable and useful than pure source- or
binary-based analyses for many software engineering applications. Fjalar provides
42
tools built upon it with memory safety guarantees, rich compile-time information
about variables, types, and functions, and the ability to traverse data structures at
run time. Its source code is publicly available on the web along with documentation
at http://pag.csail.mit.edu/fjalar/.
43

44
Chapter 3
Kvasir: A Tool for Recording
Runtime Values of Data Structures
Kvasir is a value profiling tool that records runtime values of data structures. It
serves as the C/C++ front-end for the Daikon dynamic invariant detection tool. I
implemented Kvasir using the Fjalar framework because the mixed-level approach
allows it to overcome many of the limitations of its source-based predecessor, Dfec
(Section 3.1.3). Experiments comparing Kvasir and Dfec confirm the advantages
of the mixed-level approach over a source-based approach (Section 3.4.1). I have
used Kvasir to analyze real-world C and C++ programs on the order of hundreds of
thousands to millions of lines of code and applied it as part of a data structure repair
system developed in another research group at MIT (Section 3.4.2) .
3.1 Motivation
This section describes the Daikon tool, requirements for a Daikon front-end, and
a previous attempt at building a C/C++ front-end, whose shortcomings were the
motivation for Kvasir’s inception.
45

3.1.1 The Daikon dynamic invariant detection tool
The Daikon dynamic invariant detection tool [15] reports likely program invariants
by performing machine learning over the values of variables (and other expressions)
during a program execution. The result of the analysis is a set of properties, similar
to those found in formal specifications or assert statements, that held during the
observed executions. For instance, in a program that uses an integer ind to index
into an array and an integer arr size to represent the size of that array, here is
a typical value trace for those variables in the form of (ind, arr size): (0, 6),
(1, 6), (2, 6), (3, 6), (4, 6), (5, 6). This trace can perhaps result from the
program executing a loop through a 6-element array. Given the names and types of
these variables along with this trace, Daikon could infer invariants like ind >= 0 and
ind < arr size. These are useful statements about variables and their relations that
can aid in writing specifications and assertions, generating test cases, refactoring,
among many other tasks. Several dozen papers have described over a dozen distinct
applications of dynamic invariant detection [42].
Daikon itself is language-independent; its input is a trace of variable names and
values. At each program point for which likely invariants are desired (by convention,
function entrances and exits), the trace indicates the value of each variable that is
in scope. At function entrances, these are global variables and formal parameters,
and at function exits, they are global variables, formal parameters, and return values.
These variables, as well as those that result from traversing inside of data structures
held by these variables, are called relevant variables, and they permit Daikon to infer
procedure preconditions and postconditions. C++ member functions are treated like
normal functions with an extra this parameter, and generalization over preconditions
and postconditions yields object invariants (representation invariants).
Daikon must be coupled with a language-specific front-end that instruments a
target program to produce a value trace during execution. Daikon front-ends exist
46

{1,0.5,"foo"}
{2,1.0,"bar"}
{3,1.5,"baz"}
.dtrace
char* cfloat bint a
.decls
c is non−nulla == 2*b
c in {"foo","bar","baz"}
Invariants
Execute &Record Values
Daikon(e.g., C/C++, Java, Perl)
Front−End
Language−dependent Language−independent
DetectionInvariantPerform
001010101101
ProgramTarget
Figure 3-1: The Daikon dynamic invariant detection system
for C/C++, Java, Perl, and several other languages and data formats. Figure 3-
1 shows the operation of the invariant detection system. The language-dependent
portion of the process on the left side of the dotted line depicts running a target
program through a front-end; the front-end must match the language of the target
program. The trace generated by the front-end consists of two parts: a decls file
that contains declarations of variables (their names and types) and program points
(their names and parameters), and a dtrace file that contains the value trace of
the variables, which is formatted to correspond to the declarations in the decls file.
The trace is language-independent, so in essence, the front-end’s job is to translate
concrete values in the execution of a program written in a specific language into a
language-independent format. Daikon takes as inputs the decls and dtrace files and
performs invariant detection in a language-independent manner.
3.1.2 Requirements for a Daikon front-end
A Daikon front-end is a value profiling tool for software engineering applications.
Value profiling [8] is a technique that observes the run-time values of variables, ex-
pressions, registers, memory locations, etc. It is a general technique that is incorpo-
rated in any dynamic analysis that is concerned with what the program computes.
47

(Purely control-flow-based dynamic analyses, such as coverage tools, need not incor-
porate value profiling.) A form of value profiling is even implemented in hardware,
in order to support speculation, branch prediction, and other optimizations.
Specifically, a value profiling tool for software engineering applications should
provide accurate and rich information about the run-time values of arbitrary data
structure accesses. The desire for accurate information requires fine-grained tracking
of pointer and memory use, to determine when a particular expression’s value is
meaningless (e.g., uninitialized). The desire for rich information means that it is
not enough to merely observe values that the program is directly manipulating at
a moment in time; other values may be of interest, even if their uses appear before
and/or after that moment. Value profiling for software engineering can be viewed
as having the characteristics of three other analyses: traditional value profiling, data
structure traversal, and memory error detection. This problem fits into the class
of applications that need to bridge the gap between source-based and binary-based
analyses. Its output should be in terms of source variables and expressions, and it
appears to be an easy source analysis at first glance (just print the values of those
expressions), but tracking of memory allocation, initialization, and other low-level
details is best done at the binary level.
A profiler observes program behavior (such as performance, control flow, or values)
but strives not to change that behavior. When it is acceptable to produce only
limited information, one way to avoid changes in program behavior is to observe only
values that the program directly manipulates. For instance, a value profiler could
record the value of a given expression only at instructions that read or write that
expression. This ensures that the value is valid, and that the access to it does not
cause a segmentation fault or other behavioral change. Software engineers may be
helped in some tasks by such limited information, but additional information can be
very valuable, for instance for Daikon to generate more useful invariants. A value
48

Original: Instrumented by Dfec:
bool g; // global variable bool g; // global variable
int foo(int x) { int foo(int x) {trace_output("foo():::ENTER");trace_output_int("x", x);trace_output_bool("g", g);
... ...return g ? x++ : -x; int return_val = g ? x++ : -x;
trace_output("foo():::EXIT");trace_output_int("x", x);trace_output_int("return", return_val);trace_output_bool("g", g);return return_val;
} }
Figure 3-2: Source code before and after instrumentation by Dfec
profiling tool for software engineering, such as a Daikon front-end, should be able to,
without causing the program to crash, examine the values of arbitrary data structure
elements at arbitrary times, even elements that the target program did not observe
or manipulate at those times.
In light of the aforementioned requirements, it is much easier to write a scalable
and robust Daikon front-end for a memory-safe language like Java than for C or C++.
The problems of unallocated and uninitialized memory, unknown array sizes, and
memory corruption are non-existent in a Java Virtual Machine runtime environment.
It is actually the challenges of writing a C and C++ Daikon front-end that motivated
the initial development of the mixed-level approach and Fjalar framework.
3.1.3 Dfec: A source-based Daikon front-end for C
Before I began development on the Kvasir front-end in January 2004, there already
existed a source-based front-end named Dfec (an acronym for “Daikon Front End for
C”) [36]. Dfec works by rewriting the source code of the target program to insert
code that outputs the values of relevant variables during execution.
49

A user runs Dfec to instrument the target program’s source code, compiles the
instrumented source, then runs the resulting executable. As the program executes,
it outputs the names and values of relevant variables at each execution of a program
point. Figure 3-2 shows a function before and after instrumentation. Notice that the
global variable g is a relevant variable, and also there must be an extra return val
variable created to capture the return value of foo().
Dfec uses the EDG C/C++ front end [13] to parse, instrument, and unparse source
code. This source code rewriting works well for outputting values, but information
about initialized and valid variables and memory must be maintained dynamically.
Dfec includes a sophisticated and complex run-time system that associates metadata
with each pointer and chunk of memory using ‘smart pointer’ objects. It inserts code
that checks and updates the smart pointer metadata at allocations, assignments, uses,
and deallocations of memory.
Dfec suffers from many shortcomings due to the fact that it takes a source-based
approach to dynamic analysis (Section 1.2.1), so unfortunately it is not robust or
scalable enough to run on programs of even moderate complexity.
The central limitation of Dfec’s source-based technique is the difficulty of reliably
inserting code at the right places to maintain the memory safety guarantees required
of a Daikon front-end (e.g., keeping track of pointer operations to record which data
are valid and to ensure that the instrumented program does not dereference an invalid
pointer). Smart pointers with metadata is Dfec’s attempt to overcome this challenge,
but the rewriting of code to use smart pointers is cumbersome and not scalable. For
instance, changing a function parameter’s type from a regular pointer to a smart
pointer creates the need to change it for all calls and declarations, but if it is a library
function, then it is often impossible or infeasible to translate library source code,
which is either unavailable or much more complex than the target program’s code.
In order to circumvent the problem of function prototype incompatibilities caused
50

by the transformation of regular pointers to smart pointers, Dfec converts smart
pointers back into regular pointers before passing them into library functions which
take pointers as parameters. Doing so allows the instrumented source code to compile
normally. However, the memory tracking and safety benefits of smart pointers are
lost when the execution enters library code. The implementor of Dfec manually wrote
wrapper functions for a subset of libc (e.g., string.h) which perform the proper
smart pointer bookkeeping operations before delegating to the libc versions of the
functions. All non-trivial C programs interface with libraries, and it is prohibitive to
manually write wrappers for every library function which deals with pointers.
Source code complexity was also a major obstacle in the efforts to extend Dfec to
support C++ target programs. Even discounting the difficulties of parsing, C++ is
a much more complex language than C at the source level. Though C++ support
was originally a goal for Dfec, and the last months of Dfec’s development focused on
that goal, it was very challenging to make it work robustly. For instance, one source
of problems was interactions between the templates used to represent smart pointers,
and other uses of templates in the original program.
Dfec also suffers from two other problems that tend to affect source-based analyses.
First, though Dfec re-uses an existing source parser, the AST interface alone is rather
complex, making maintenance difficult. Second, because Dfec works by processing
source code that must then be compiled, it is cumbersome to use, especially for large
programs with complex Makefile and configure files that control their build process.
The experiments in Section 3.4.1 and my anecdotal experience confirm that Dfec
does not work “out of the box” on C or C++ programs of reasonable size, and even a
complete source-based re-implementation would not resolve many of its most debili-
tating limitations. For the limited number of C programs which Dfec successfully in-
strumented, many often crashed during execution while trying to dereference pointers
to unallocated regions of memory. In theory, the smart pointer objects were supposed
51

Fjalar
Fjalar API
char* cfloat bint a
.decls
{1,0.5,"foo"}
{2,1.0,"bar"}
{3,1.5,"baz"}
.dtrace
001010101101
Binary
InstrumentDynamicallyExecute &
Kvasirgcc
CodeSource
*.c *.cpp*.h
Compile
Figure 3-3: Kvasir as a Fjalar tool that produces trace files for Daikon
to provide memory safety and prevent segmentation faults during dereferences, but
in practice, C language constructs such as nested pointers to structs, arrays within
structs, multiple layers of pointers, and integer-to-pointer casts often misguided the
Dfec runtime system into dereferencing an invalid pointer. This experience motivated
the development of Kvasir, a new Daikon front-end based on a mixed-level approach.
3.2 Kvasir: A C and C++ Front-End for Daikon
Kvasir (named after the Norse god of knowledge and beet juice) is a C and C++
front-end for Daikon that I implemented based on the mixed-level approach. Kvasir
instruments and executes the target program’s binary in one step without using the
source code. Unlike Dfec, its predecessor, Kvasir works “out of the box” on programs
of significant size (see Section 3.4.1), and its scalability and performance surpass those
of the Daikon invariant detector itself.
As shown in Figure 3-3, Kvasir is a Fjalar tool that takes a target program’s
binary as input and produces decls and dtrace files for Daikon as output. The
operation of Kvasir is fairly straightforward for the most part. To generate the decls
file, Kvasir uses the compile-time information about functions, variables, and types
52

and the variable traversal features of the Fjalar API (Section 2.2) to output all of
the relevant declarations to a file. To generate the dtrace file, Kvasir uses the Fjalar
API to instrument the target program’s binary to pause execution at program points
and then to traverse through all relevant variables and output their values to a file,
making sure not to dereference pointers to unallocated regions or output uninitialized
values.
Kvasir has many options to give the user fine control over what parts of the pro-
gram to trace. There are file formats in which users can designate which program
points and variables to trace, whether to output variable values as scalars or arrays,
and whether to coerce a pointer to a certain type before dereferencing it to output its
value. There are also command-line options to control how deep to recurse inside of
nested data structures and whether to ignore certain classes of variables (e.g., global
variables, file-static variables). The Fjalar API provides all of the aforementioned
functionality. These features are often very useful when tracing a small portion of
a large or long-running program like the data structure repair application of Sec-
tion 3.4.2 does. When using Daikon to find invariants within a large software system,
the user often only cares about certain core modules with interesting data structures,
not the majority of the program, which consists of boilerplate code, error handling, file
I/O, user interface, etc... Thus, Kvasir’s selective tracing options have been very use-
ful in practice; without them, Daikon would not be able to process the vast amounts
of collected trace data, but even if it could, it would find lots of invariants that are
not interesting to the user.
Kvasir has one additional interesting feature: it can write the dtrace trace infor-
mation to a pipe instead of to a file. Daikon can be connected to the read end of
the pipe and detect invariants ‘on-the-fly’ as the program is executing. This is use-
ful for detecting invariants over a long-running program or an execution that would
otherwise produce very large dtrace files.
53

The main advantages of Kvasir over Dfec derive from the fact that C and C++ al-
low programmers to work directly on the memory level via pointers, so thus, given the
appropriate tools, it is much easier and more accurate to take a mixed-level approach
by analyzing these programs on the binary level and using source-level constructs only
when necessary rather than solely performing a transformation of the source code.
Kvasir’s use of binary analysis has three interrelated advantages. First, it is precise
to the bit level; for instance, Kvasir can print the initialized bits but not the unini-
tialized ones in a bit vector. Second, the precision is not diminished when libraries
are used, since code is treated uniformly regardless of its origins. Contrast this with
the hand-written annotations required by a source-based tool such as Dfec. Third,
and most importantly, the binary memory tracking is conceptually simple, allowing a
simple and robust implementation. Because Kvasir instruments the program binary,
it provides full memory tracking coverage unlike Dfec, which only provides such cov-
erage for parts of the program where the source code was available to instrument.
Since Kvasir is able to safely examine memory to read values, it does not need any
specialized data structures to keep track of pointer variable metadata, thus simplify-
ing its implementation with respect to Dfec. For example, in Figure 2-2, Dfec needs to
keep track of several smart pointers to maintain information about the initialization
states and number of elements referenced by each pointer within rec, but Kvasir can
simply follow the pointers, determine the array sizes at runtime, and directly extract
the initialized values from memory to report to the dtrace file.
Kvasir avoids many of the complexities that stunted Dfec’s scalability by not de-
pending on details of the target program’s source language. Kvasir’s memory tracking
is designed with respect to a simple machine model, rather than a complex language
semantics. When Kvasir does require language-level information, though, it still
saves complexity by using debugging information rather than source code. While the
sophisticated structure of debugging information accounts for much of Kvasir’s com-
54

plexity, it is still much simpler than the original source from which it is derived (the
compiler abstracts away many source-level details) and the debugging information
parsing functionality is well-encapsulated within the Fjalar framework.
The best example of this reduced dependence on source complexities was my
experience in adding C++ support to Fjalar and Kvasir (at first, the implementation
only supported C). This primarily required additional debugging information parsing
code to handle object-oriented features such as member functions and static member
variables, and in all required only 4 days of work to get rudimentary functionality and
another 2 weeks to add more advanced features and improve robustness. Binaries for
C++ programs follow virtually the same calling conventions as those for C programs,
so the actual memory, variable, and program point tracking code required almost no
modifications. It would likely be just as easy to support other gcc-compiled languages
such as Ada, Fortran, Objective-C, and Java.
A final advantage of Kvasir is that it is easy to use. Running a program under
Kvasir’s supervision is a single step that involves just prepending a command to the
normal program invocation. For a program that is normally run as
./program -option input.file
a user would instead use the command
kvasir-dtrace ./program -option input.file
It is rarely necessary to modify a program in order for Kvasir to run on it, even for
large programs that use many language and system features (see Section 3.4.1).
3.3 Implementation
Kvasir is implemented as a Fjalar tool, much in the same spirit as basic-tool.c
described in Section 2.4. It adds several command-line options in addition to the
ones that Fjalar provides, mostly dealing with how and where to output the decls
55

and dtrace files. The bulk of the Kvasir code deals with interfacing with Fjalar and
formatting trace output so that it conforms to Daikon’s file format. It contains two
action functions (analogous to basicAction() in basic-tool.c) which are passed as
callback parameters to the Fjalar traversal functions: one for querying compile-time
declarations to output to the decls file, and the other for querying memory allocation
and initialization and array size information and directly reading values from memory
to output to the dtrace file. Kvasir piggybacks off of Fjalar for all of the hard work
of ensuring memory safety and traversing through data structures.
3.4 Evaluation
I evaluated the Kvasir tool in two ways: performing experiments comparing it to Dfec
(Section 3.4.1) and applying it as part of a data structure repair system (Section 3.4.2).
Both evaluations confirm that Kvasir is a robust and scalable tool that is able to
reliably produce trace files for executions of real-world C and C++ programs.
3.4.1 Experiments
This section compares Dfec and Kvasir in terms of scalability and performance. Scal-
ability was measured by the sizes of programs that Dfec and Kvasir could successfully
process and the amount of human effort, if any, required to do so. Performance was
measured by the slowdown factors relative to the runtime of the uninstrumented
programs.
Scalability
Table 3.1 shows a variety of C and C++ Linux programs. For this experiment, I
tried to find widely-used, real-world programs spanning many different domains, as
evidenced by the program descriptions. ‘Runs to completion’ (denoted by a ‘Y’ in the
56

Program Lang. Description LOC Dfec Kvasir
md5 C Cryptographic hash function 312 Y Yrijndael C Cryptographic algorithm 1,208 Y* Ybzip2 1.0.2 C File compression tool 5,123 Y* Yflex 2.5.4 C Fast lexical analyzer generator 11,977 Y** Ymake 3.80 C Software build automation tool 20,074 N Yxtide 2.6.4 C++ Graphical tide calculator/visualizer 23,768 - Ygroff 1.18 C++ UNIX document formatting system 25,712 - Ycivserver 1.13.0 C Server for multi-player game 49,657 - Yctas C++ Air traffic controller (one module) >52,329 - Ypovray 3.5.0c C++ 3D renderer 81,667 - Yperl 5.8.6 C Programming language interpreter 110,809 - Yapache 2.0.54 C Ubiquitous web server 152,435 - Ybind 9.3.1 C Domain Name System server 152,885 - Yxemacs 21.4.17 C Text editor and work environment 204,808 - Y*gcc 3.4.3 C C preprocessor and compiler 301,846 - Y*
Y = runs to completion N = failed to run - = did not attempt∗ = requires minor modifications reasonable for users to make∗∗ = requires major modifications that would deter most users
(LOC is non-comment non-blank lines of code.)
Table 3.1: Dfec and Kvasir scalability tests for C and C++ Linux programs
57

table) means that a tool can successfully generate decls and dtrace files for Daikon
for a non-trivial target program execution.
Dfec only ran on the four smallest programs, only one of which, md5, worked “out
of the box” without any hand modifications to the source code. Any program that
uses non-trivial language features (especially those related to pointers) or calls library
routines had to be ‘massaged’ by hand either so that Dfec will accept them as valid
input or, more often, so that Dfec’s output is a legal program that can still compile.
Examples of modifications required for these programs include: For bzip2, Dfec’s
special treatment of the void* type failed to be triggered by a type BZFILE* when
BZFILE was a typedef for void. I resolved this by directly replacing BZFILE with void.
For flex, my colleagues and I made major modifications, including replacing string
literals in ternary ?: operators by variables initialized to those literals in order to
resolve an ambiguity related to operator overloading in Dfec’s output due to its use of
smart pointers. For make, a colleague spent several hours trying to bypass Dfec’s usual
pointer transformations to match the memory layout required by UNIX environment
variables, without success. The need to manually edit the target program’s source
code makes the effort to use Dfec scale up with the target program’s size, and that
effort was prohibitive for programs larger than ∼10 KLOC.
In contrast, Kvasir runs on both C and C++ programs of up to 300 KLOC,
requiring only rare target program modifications for unusual constructs. For xemacs,
a colleague renamed one of two sets of functions generated by two compilations of a
single C source file to avoid having two otherwise indistinguishable functions. For gcc,
a colleague supplied an extra --with-gc=simple configuration parameter to specify a
garbage collector that works with the standard malloc.
I feel that the user experience in running Kvasir was much better than in running
Dfec. All of these programs had Makefiles, so all I needed to do was to add the -g and
-O0 options for gcc to include debugging information and to disable optimizations,
58

Program Base Time Dfec Kvasir Daikon Valgrind Memcheck Kvasir main()md5 0.14 310 240 500 2.3 15 18
rijndael 0.19 690 5000 2200 7.6 38 86bzip2 0.18 1100 3500 12000 5.2 28 46
flex 0.41 780 1800 2400 14 49 99Average 720 2600 4300 7.3 33 62
Table 3.2: Slowdown for programs that were successfully processed by both Dfec andKvasir. All numbers are slowdown ratios, except that the base run times are given inseconds. All tests were run on a 3GHz Pentium-4 with 2GB of RAM.
respectively, run make, and then run Kvasir on the resulting binary. Because all of
these programs, regardless of size, compile into one binary with a make command, the
effort of getting Kvasir to run does not scale with the program’s size.
The majority of the scalability problems of Dfec come from limitations of a source-
based approach. In general, larger programs are more likely to contain complex source
code constructs and interactions with libraries and system interfaces, which are more
difficult to properly handle at the source level than at the binary level (especially
operations on pointers, which are ubiquitous in C and C++ programs). In contrast,
Kvasir’s use of dynamic binary instrumentation bypasses all of these limitations and
makes it a much more robust and scalable tool. In theory, a perfect source-based
analysis could be extremely robust and scalable, but the complexities of transforming
source code makes it difficult for real implementations to approach this ideal.
Performance
Both Dfec and Kvasir ran on the order of 1000 times slower than the uninstrumented
target programs (see Table 3.2), but most of the overhead was due to writing data
traces to dtrace files at every program point execution. The dtrace files ranged from
several hundred megabytes to several gigabytes. For the larger programs of Table 3.2,
bzip2 and flex, I configured both Kvasir and Dfec to skip global variables and to
print only the first 100 elements of large arrays.
59

Dfec was somewhat faster than Kvasir because Dfec produces instrumented source
code that can be compiled with optimizations to machine code, while Kvasir performs
binary instrumentation with Valgrind, which both consumes run time and also yields
less-optimized code (x86 code must be translated to Valgrind IR, instrumented, then
translated back to x86).
The three rightmost columns of Table 3.2 show the components of Kvasir’s slow-
down caused by its implementation as a Valgrind tool built on top of Memcheck
(both tools are encompassed within the Fjalar framework). The “Valgrind” column
shows the ∼10× slowdown of Valgrind running on the target program without any
custom instrumentation. The “Memcheck” column shows the ∼30× slowdown of the
Memcheck tool, which is required to provide memory safety guarantees for Kvasir.
The “Kvasir main()” column shows the ∼60× slowdown of Kvasir when running on
the target program but only outputting the trace data for one function, main(). This
measures the overhead of bookkeeping related to tracing, including the overhead of
Fjalar, without the data output slowdown. The rest of Kvasir’s slowdown above this
factor is caused by the output of trace data for Daikon and is approximately linear
in the size of the dtrace file. Both Dfec and Kvasir share this unavoidable output
slowdown.
I believe that the value profiling overhead could be reduced. However, I have
not spent any significant effort on optimizing Dfec or Kvasir, because they usually
produce trace output faster than Daikon can process it, so neither is the performance
bottleneck in the entire invariant detection system. (Recall that Kvasir can output
dtrace data to a pipe, and Daikon can detect invariants ‘on-the-fly’ as the target
program is executing; in that case, Kvasir always writes data to the pipe faster than
Daikon can read from it.) Kvasir’s performance is directly related to the number of
program point executions and variables being traced at those program points. Thus,
it is completely feasible to trace only selected small portions of an extremely large or
60

long-running program without a significant slowdown. In fact, this is frequently done
for large programs because the user is often interested in certain key functions or
data structures (see Section 3.4.2), and also Daikon is currently not scalable enough
to produce invariants over all program points and variables in programs larger than
∼10 KLOC. Given its other advantages, Kvasir’s performance overhead is completely
acceptable for its role as a Daikon front-end for C and C++.
3.4.2 Application: Data structure repair
I have applied Kvasir as part of a runtime data structure repair system. Data structure
repair is a technique that repairs corrupt data structures at runtime to conform to
certain consistency constraints. For instance, a possible constraint for a doubly-linked
list is that for every node this (except for the last node), this->next->prev == this.
The goal of data structure repair is to be able to run an instrumented target program
and have that program be more resilient to both bugs and malicious attacks that
corrupt data structures. These consistency constraints can be arduous to write by
hand, so the system uses Daikon to automatically generate them; after all, they are
simply the invariants for data structures and their fields (member variables). The
role of Kvasir in this system is to instrument the target program and generate trace
files for selected data structures during execution so that Daikon can find consistency
constraints for them.
This paper that I co-authored [12] describes three case studies on large C and
C++ programs. Although I did not perform the actual data structure repair work, I
collaborated closely with those who did by making numerous improvements to Kvasir
over the span of a year so that it could run successfully on these programs. This
experience helped me to identify inefficiencies, bugs, and limitations in Kvasir and
Fjalar and made my tools stronger by giving me concrete incentives for improving
them. Here is a summary of the case studies.
61

Freeciv
Freeciv is a popular open-source multi-player client-server strategy game. The assess-
ment of Freeciv focused on a portion of the server, civserver. One key data structure
represents the map of the game world. Each tile in this map has a terrain type and
cities (with its own nested data structures) may be placed in these tiles as well. I used
Kvasir to trace the map data structure (and data structures nested within it) through
several regular executions so that Daikon could generate reasonable consistency con-
straints. Then my colleagues evaluated Freeciv by using a fault injection API to
corrupt selected blocks of memory. They first performed randomized fault injections
and noted program behavior: When 50 memory locations were simultaneously cor-
rupted, the original Freeciv crashed 92% of the time, but the version augmented with
the repair tool only crashed 12% of the time. More significantly, the funders of this
project hired an external ‘Red Team’ to spend one day at MIT to use this API to
strategically formulate corruption attacks with full knowledge of the workings of the
Freeciv game. The repair system detected 80% of the corruptions and took successful
corrective action in 75% of those cases.
The main challenge of this application for Kvasir was to precisely and accurately
traverse into deeply-nested data structures and arrays of structures. The map consists
of thousands of tiles, each tile may contain a city, each city has certain properties, and
those sometimes have interesting fields, etc... Much of the selective program point
and variable tracing code owes its refinement to my work on this case study.
BIND
The Domain Name System (DNS) is an Internet service responsible most notably for
translating human-readable computer names (such as www.mit.edu) into numeric IP
addresses (such as 18.7.22.83). BIND is an open-source software suite that includes
the most commonly-used DNS server on the Internet. Because of BIND’s ubiquity on
62

the Internet, it is a frequent target of security attacks, and a number of serious flaws
have been found in it over its decades of use. The BIND developers maintain a list
of security-critical bugs. In order to assess the effectiveness of data structure repair
in protecting BIND from these attacks, we have selected two previously-discovered
problems and ‘reverse-patched’ the latest version of BIND (where these problems
have been corrected) so that it exhibits these problems. Both are denial-of-service
vulnerabilities: a malicious user interacting with BIND could prevent the server from
handling legitimate requests. We were able to apply data structure repair to prevent
the denial-of-service attacks (the details of both experiments are in our paper [12]).
I applied Kvasir to trace the data structures that were vulnerable to these two
attacks. In performing this case study, I had to implement a pointer-type coercion
feature for Fjalar, which allows the user to specify the runtime type of an arbitrary
pointer so that Fjalar can traverse inside of its contents. BIND uses various generic
pointers to emulate object inheritance in C. Thus, it was necessary to specify the run-
time instead of the compile-time types in order to traverse into these data structures
to record values of fields that were important for building the consistency constraints.
CTAS
CTAS (Center-TRACON Automation System) is a set of air traffic control tools
developed at the NASA Ames Research Center [10]. Versions of this system are
deployed at air traffic control centers throughout the United States and are in daily
operational use. One interesting data structure is a flight plan that contains 38 fields.
This data structure is responsible for keeping track of types of flights, their origins,
and their destinations. I ran Kvasir on an execution of CTAS with legal inputs,
directing it to only focus on that one data structure. My colleagues processed the
resulting trace files through Daikon, found constraints, and re-ran CTAS again, this
time using a fault injection system to corrupt flight information within this data
63

structure. Without the repair tool, many of these faults crash the entire system,
which is unacceptable when CTAS is deployed in the real world because an air traffic
control system should not shut down simply from bad information about one flight.
With the repair tool in place, though, CTAS continues executing normally in the
presence of many faults, albeit with some flights having incorrect information. For
instance, if a set of legal destinations were {Boston, Los Angeles, San Francisco,
...} (the consistency constraint) and the correct destination was Boston, then when
that field is corrupted to some illegal string, the best that the tool can do is to set
the field back to one of the many legal values (e.g., Los Angeles), but it is not likely
to be the correct one. The important thing, though, is that the program continues
to execute correctly, albeit with possibly incorrect values. A simple alert in the user
interface could warn operators when a value is potentially incorrect.
CTAS was by far the largest program I attempted to run Kvasir on (over 1 mil-
lion lines of C++ code), although I only instrumented a much smaller module (∼50
KLOC) that contained the flight plan data structure. In the process of getting Kvasir
to run on a program of this size and complexity, I had to make some optimizations
to Fjalar in order to speed up the debugging information parsing that occurs as soon
as the binary is loaded. Because the binary contains a huge amount of debugging
information (for all 1 million lines, not just my 50 KLOC module), it was the first
time that I noticed the inefficiencies of this portion of Fjalar. Fortunately, the fix was
easy – adding an extra hash table to convert a linear-time lookup into a constant-
time one. I also had to make some enhancements to Kvasir’s C++ support. Overall,
though, I was extremely grateful for the fact that Kvasir operates on one compiled
binary because the CTAS project consisted of thousands of source files spread out
across many directories, linked together with complex Makefiles and configure scripts.
It would have been very difficult to process all of these files with a source-based tool
and still have the result compile and run properly.
64

3.5 Related Work
The closest related work to Kvasir is its predecessor, Dfec [36], a source-based C front-
end for Daikon. The limitations of Dfec described throughout this chapter directly
motivated the creation of Fjalar and Kvasir.
A debugger designed for interactive use provides some of the same value profiling
capabilities as Kvasir, and using some of the same information such as the debugging
information. A debugger can stop execution at arbitrary points in the execution, and
print the values of arbitrary source-level expressions. Invalid pointer accesses cause
a debugger warning, not a segmentation fault. Some software engineering tools have
been built on top of the GDB [49] debugger (for example, [2, 20, 6, 9]). However,
GDB is not an automated dynamic analysis, nor is it designed for extensibility, and it
imposes unacceptably high run-time overheads. Furthermore, it provides no memory
validity tracking, a key requirement for a software engineering tool.
3.6 Conclusion
Kvasir is a value profiling tool that serves as a C and C++ front-end for the Daikon
dynamic invariant detection tool. It is scalable up to programs of millions of lines of
code. Its predecessor, Dfec, could only process C programs up to around 10,000 lines
and often required some amount of user effort to work on non-trivial programs. Until
the creation of Kvasir, Daikon was only able to run on small C programs and on almost
no C++ programs. Kvasir has enabled Daikon to find invariants in large C and C++
programs and thereby broaden its applicability. For instance, Kvasir enabled the data
structure repair system to use Daikon to automatically infer consistency properties
for data structures within complex, real-world C and C++ programs, a task which
would have been impossible with Dfec. Kvasir is publicly available on the web in the
source code distribution of Daikon: http://pag.csail.mit.edu/daikon/
65

66

Chapter 4
DynComp: A Tool for Dynamic
Inference of Abstract Types
This chapter presents a novel kind of dynamic analysis that my colleagues and I
developed — dynamic inference of abstract types — and describes its implementation,
a tool named DynComp that I built using the Fjalar framework. The contents of this
chapter are mostly adapted from our paper, Dynamic Inference of Abstract Types [23].
An abstract type groups variables that are used for a related purpose in a program.
Initially, each run-time value gets a unique abstract type. A run-time interaction
among values indicates that they have the same abstract type, so their abstract types
are unified. Also at run time, abstract types for variables are accumulated from
abstract types for values. The notion of interaction may be customized, permitting
the analysis to compute finer or coarser abstract types. Section 4.2 describes our
abstract type inference algorithm.
We have produced two implementations of this technique: one operates on com-
piled binaries of x86/Linux programs written in languages such as C and C++, and
the other works on compiled Java programs (bytecodes). The implementation section
of this chapter (Section 4.3) will only describe DynComp, the version for compiled
67

x86/Linux binaries which I built using the Fjalar framework. As will be evident in
Section 4.3.2, the nature of our algorithm lends itself well for implementation using
a mixed-level approach. Our experiments (Section 4.4) indicate that the analysis is
precise, that its results aid humans in program understanding, and that its results
improve the precision of a follow-on client analysis.
4.1 Motivation
Even in explicitly-typed languages, the declared types capture only a portion of the
programmer’s intent and knowledge about variable values. For example, a program-
mer may use the int type to represent array indices, sensor measurements, the current
time, file descriptors, counts, memory addresses, and a host of other unrelated quan-
tities. The type Pair<int,int> can represent coordinate points, a Celsius/Fahrenheit
conversion, a quotient and remainder returned from a division procedure, etc. Dif-
ferent strings or files can represent distinct concepts. Regular expressions can be
applicable to different contents. Variables declared with the same generic type, such
as Object or Comparable, need not hold related values.
Use of a single programming language type obscures the differences among con-
ceptually distinct values. This can hinder programmers in understanding, using, and
modifying the code, and can hinder tools in performing analyses on the code. There-
fore, it is desirable to recover finer-grained type information than is expressed in
the declared types. We call these finer types abstract types ; this chapter presents a
dynamic analysis for inferring abstract types.
The abstract type information is useful for program understanding [41].
• It can identify ADTs (abstract data types) by indicating which instances of a
declared type are related and which are independent.
• It can reveal abstraction violations, when the inferred types merge values that
68

should be separate, as indicated by either the declared types or by a program-
mer’s expectations.
• It can indicate where a value may be referenced (only at expressions that are
abstract-type-compatible with the value).
• It can be integrated into the program, effectively giving the program a richer
type system that can be checked at compile-time. For instance, this could be
done using typedef declarations in C or ADTs in an object-oriented language.
The finer-grained abstract type information can also be supplied to a subsequent
analysis to improve the run time or the results of that analysis. Since our abstract
type inference is dynamic, its results are most applicable to a follow-on analysis that
does not require sound information (for example, using it as optimization hints), that
is itself unsound (such as a dynamic analysis, or many machine learning algorithms),
that verifies its input, or that produces results for human examination (since people
are resilient to minor inaccuracies). Here are a few examples of such analyses.
• Dynamic invariant detection [15, 32, 25] is a machine learning technique that
infers relationships among variable values. Abstract types indicate which vari-
ables may be sensibly compared to one another. Directing the detection tool to
avoid meaningless comparisons eliminates unnecessary computation and avoids
overfitting [16].
• Principal components analysis (PCA) approximates a high-dimensional dataset
with a lower-dimensional one, by finding correlations among variables. Such
correlations permit a variable to be approximated by a combination of other
variables; the reduced dataset is generally easier for humans to understand.
Abstract types can indicate variables that are not related and thus whose cor-
relations would be coincidental. For example, this could be applied to work
that uses PCA over program traces to group program constructs [29].
69

• Dynamic analysis has been used to detect features (or errors) in programs, by
finding correlated parts of the program [55, 44, 56, 14, 21, 22]. Abstract types
could refine this information, making it even more useful.
• Abstract types can partition the heap, providing useful information to memory
hierarchy optimizations. For example, a group of objects that are likely to
be connected in the heap can be allocated on the same page or in the same
arena. This can reduce paging when accessing the data structure. A related
optimization is to allocate related elements to locations that will not contend
for cache lines, reducing thrashing for elements likely to be accessed together.
• Abstract types are related to slices [53, 51], so they can be used for many of
the same purposes, such as debugging, testing, parallelization, and program
comprehension.
• Abstract types chosen to match the operators used in a later analysis can im-
prove efficiency by allowing the analysis to consider only pairs of variables of
the same abstract type, or consider all variables of an abstract type together.
4.2 Dynamic Inference of Abstract Types
We present a unification-based dynamic analysis for partitioning variables into ab-
stract types based on the interactions of the values they held during execution.
Abstract types provide a division of program variables or values into sets of related
quantities. For a given program, there are many ways to make this distinction, and
different partitions are useful for different purposes. No analysis is guaranteed to
produce exactly what the programmer would intend for a given purpose (that is
unknowable and inherently subjective, and the program may not perfectly express
the programmer’s intent), but our goal is to produce information about the program
that is sufficiently accurate to be used by people and by follow-on tools.
70

The key idea of our analysis is to recover information that is implicit in the
program. The operations in the program encode the programmer’s intent: values
that interact in the program must be intended to have the same abstract type (or
else the interaction indicates a bug), and values that never interact may be unrelated.
More concretely, an operation such as x+y indicates that the values of x and y have
the same abstract type. The notion of “interaction” is parameterizable and is further
described in Section 4.2.1. Our analysis ignores the underlying type system, including
all casts, and unifies the abstract types of two values when they interact.
A value is a concrete instance of an entity that a program operates on, such as a
particular dynamic instance of the number 42 or the string "foobar". New values can
be created via literals, program inputs, memory allocation, or other operations. For
example, every time 3 + 5 is executed, a new value is created for 3, a new value is
created for 5, and the addition operator creates a new value. By contrast, x=y creates
no new values— it merely copies one.
An abstract type can be inferred either for variables or for values. Variables
are merely containers for values, so a variable can hold many distinct values during
its lifetime. For example, in “x=3; y=3; x=y;” there are two values (both of which
represent the same number), and at the end of execution both variables hold one of
them. However, x has held two distinct values during its lifetime. This is similar to the
way objects in Java work— compare “x=new Object(); y=new Object(); x=y;”—
but we extend the notion to primitives. Unlike objects, for primitives there is no way
to tell by looking at the program state whether two instances of 3 are the same value,
but a dynamic analysis can track this information.
Our dynamic abstract type inference works by observing dataflow and value inter-
actions, unifying the sets that represent the abstract types of values that interacted
(Section 4.2.1), and then constructing abstract types for variables based on the ab-
stract types of the values they held (Section 4.2.2). It operates dynamically on values
71

rather than statically on variables (as in [41, 40]), permitting it to produce precise
results. We have not observed overfitting to be a problem in practice. If desired,
the information can be checked by a type system or similar static analysis, and the
combined dynamic–static system is sound, so its results can be used wherever a static
abstract type inference’s could be.
4.2.1 Tracking dataflow and value interactions
Our algorithm tracks the flow and interactions of values throughout execution, par-
titioning values into disjoint sets called interaction sets. To accomplish this, it main-
tains a tag along with each value, which represents the value’s abstract type. A
global union-find data structure called value uf groups the tags into disjoint interac-
tion sets, each of which contains values that belong to the same abstract type (values
that have interacted). Only values of primitive types receive tags; arrays and in-
stances of structs and classes are treated as collections of primitive types. One tag in
each set is a canonical representative, called the leader, and is used to represent the
set when performing operations in value uf.
Tags are created and propagated to reflect the dynamic dataflow that occurs
during execution. Every new value created during execution receives a unique tag,
which is initially placed in a new singleton set within value uf to denote that it
represents a unique abstract type. New values include dynamic instances of literals,
inputs such as program arguments and values read from a file, and results of operations
such as + or memory allocation.
As a value propagates (is copied) during execution, its tag always accompanies it,
thus tracking dataflow. For instance, in an assignment x = y, when the value stored
in y is copied into x, the tag associated with the value is copied as well. Procedure
arguments and return values are treated in exactly the same way. This propagation of
tags is somewhat similar to the propagation of abstract identifiers in a static dataflow
72

analysis, but a key feature is that it occurs only when dataflow actually occurs during
execution. In the terminology of static analysis, our technique is completely context-,
flow-, and path-sensitive.
Definitions of interaction
In addition to recording dataflow, our analysis classifies values as having the same
abstract type (by unifying the sets of their tags in value uf) if they are used together
(“interact”) in certain operations. The notion of what operations qualify as inter-
actions is parameterizable, and we present 4 useful definitions of interaction among
primitive and reference values that we have implemented:
Dataflow - No binary operations are interactions. Thus, every value belongs to
a singleton set, which represents a unique abstract type. This tracks dataflow
because two variables have the same abstract type if one value transitively flowed
from one variable to the other (i.e., via assignment or parameter passing).
Dataflow and comparisons - Under this definition, two values that are operands
to a comparison operator (e.g., < and ==) interact, so their tags are unified
together in one interaction set within value uf. The result of the comparison
is conceptually a boolean value that is unrelated to the operands, so it receives
a fresh tag representing a unique abstract type.
Units - This definition ensures that all variables with the same abstract type could
be assigned the same units under the usual scientific rules that values may only
be added, subtracted, or compared if they have the same units. Thus, these op-
erations are considered interactions, but other operations, such as multiplication
and division, are not.
Arithmetic - This is the most inclusive definition of interaction, yielding the fewest
abstract types (with the most members). This is the default mode for our
73

implementations, as we believe it is easier for users to split up sets that are too
large than to combine sets that were not recognized as related.
• Comparisons are interactions between operands.
• All arithmetic (+, -, *, /, %, etc.) and bitwise (&, |, etc.) operations are
interactions between the two operands and the result, so all 3 values have
the same abstract type after the operation.
• Shift operations (<<, >>, etc.) are interactions between the quantity being
shifted (left operand) and the result. In practice, we have noticed that the
shift amount (right operand) is usually not closely related to the quantity
being shifted, so this setting yields more precise interaction sets.
Note that logical operators such as &&, ||, and the ternary ?: operator do not
produce interactions, because no close relationship need exist between the operands,
especially in C when operands are often numbers or pointers instead of booleans.
4.2.2 Inferring abstract types for variables
Our analysis infers abstract types for variables based on the interaction sets of val-
ues: roughly speaking, variables will be in the same abstract type if they held values
from the same interaction set. This section describes two algorithms for construct-
ing abstract types, which give somewhat different results when the interaction sets
themselves change over time: the first algorithm is relatively simple, while the second
algorithm is more complex, but corresponds to a somewhat more consistent definition
of abstract types. In either case, our approach is to compute abstract types separately
for variables at certain static points in a program; we call each such location a site.
For the first variable type inference algorithm, each site has an associated union-
find data structure representing a partition of the variables at the site: before exe-
cution, each variable is in its own singleton set. Now, suppose that x and y are two
74

1. for each variable v:2. Tag leader = value_uf.find(var_tags[v])
# If var_tags[v] is no longer the leader of its interaction set,# then its set has been merged with another set in value_uf
3. if leader != var_tags[v]:# Merge corresponding sets in type_uf and# maintain that var_tags[v] is the leader
4. var_tags[v] = type_uf.union(leader, var_tags[v])
# If needed, create entry for new value in type_uf5. Tag new_leader = value_uf.find(new_tags[v])6. if new_leader not in type_uf:7. type_uf.make_singleton(new_leader)
# Merge new tag with existing tags in type_uf8. var_tags[v] = type_uf.union(var_tags[v], new_leader)
Figure 4-1: Pseudocode for the propagation occurring at each site execution thattranslates from value interaction sets to abstract types for variables
variables at a particular site, and that on a particular execution they have the values
vx and vy. The simple algorithm checks whether vx and vy are in the same interaction
set at that moment of execution, and if so, merges the variable sets containing x and
y. After execution, the abstract types are simply the sets in the union-find structure.
A potentially unsatisfying aspect of this algorithm is that while value interactions
that occur before the execution of a site affect the abstract types, those that occur
afterwards may not, if the variable never again has values from that interaction set.
To avoid the asymmetry in the simple algorithm just described, we developed
a more complex algorithm whose definition of abstract type does not depend on
the order in which value interactions occur. I have implemented this more complex
algorithm in DynComp. The key difference in the second algorithm is that rather
than creating abstract types grouping variables directly, it constructs abstract types
by first grouping value interaction sets, and then using these groups to define sets
of variables. The effect of this choice on the algorithm’s results is that its abstract
types always correspond to unions of whole value interaction sets, rather than parts
75
of interaction sets. In other words, if a variable x had a value vx at one execution of a
site, the variable y had a value vy at a different execution, and vx and vy interacted,
then x and y will be in the same abstract type, even if there was no single execution
of the site at which the values of x and y had interacted or would interact in the
future. To implement this approach, the second algorithm does not use a union-find
structure representing a partition of variables at each site; instead, it uses a union-find
structure representing a partition of value interaction sets.
To be precise, the union-find structure maintains a partition of tag values which
at some point were leaders (canonical representatives) of value interaction sets. Such
tags are grouped together either as the value interaction sets grow (if an interaction
set merged to create a larger one, the old and new leaders are grouped), or as variables
take values from different interaction sets on subsequent site executions (the leaders of
the previous and current sets are grouped). To maintain the connection between value
interaction sets and variables, the algorithm also keeps track, for each variable, of the
leader of the interaction set of the most recently observed value of the variable. A
pseudocode representation of the steps performed by the algorithm at each execution
of a site is shown in Figure 4-1. At each execution of a site, the tool collects the
tags for the values of all the variables at the site into an array named new tags;
new tags[v] is the tag for the value of the variable v. The algorithm first updates the
representative tag for each variable value seen on the previous execution, to account
for interaction set merges that have occurred between site executions (lines 2–4 of
Figure 4-1), and then merges the sets containing the representatives of the previous
and current value interaction sets (line 8), creating a new set for the current value if it
does not yet exist (lines 5–7). The algorithm’s results should also reflect interactions
that occur even after the final execution of a site, so it performs a final iteration of
propagating merges of interaction sets (as in lines 2–4) for each site at the very end
of execution.
76

At every site at the end of program execution, for every variable v, var tags[v]
holds the tag for that variable. type uf is the union-find structure that groups tags
together into sets which represent the abstract types. All variables at a site with the
same tag or with tags in the same set in type uf belong to the same abstract type.
The efficient union-find data structure allows this algorithm to run in almost
linear time, O(n), where n is the number of variables. One reason for the algorithm’s
apparent complexity is to achieve the almost O(n) running time, which is important
for scalability. A much more straightforward alternative algorithm works by making
a boolean table at each site where each row and column corresponds to a variable.
At every site execution, if two variables v1 and v2 are holding values that are in the
same interaction set, then put a ‘check mark’ in the table entry for (v1, v2). Then
at the end of execution, merge pairs of variables with ‘check marks’ in the table into
sets which represent the abstract types. This is O(n2) in both time and memory, but
potentially provides more precision over the O(n) algorithm of Figure 4-1. I have
implemented this alternative but have not done much testing to determine whether
the precision versus performance tradeoff is worthwhile.
4.2.3 Example
I will use the program in Figure 4-2 to illustrate the operation of the dynamic abstract
type inference algorithm. This program performs a simple cost calculation, adding
in an extra shipping fee if the distance is greater than 1000 and the year is after
2000. All of the variables are of type int, but there are really three abstract types:
Distance, Money, and Time. The analysis will be able to find these three types, but
of course it will not be able to assign names to those types; that is the user’s job. I
will now run through the algorithm at a very high level using a series of diagrams.
77

1. int main() {2. int dist = 3000;3. int itemPrice = 50;4. int taxPrice = 3;5. int total = totalCost(dist, itemPrice, taxPrice);6. }
7. int totalCost(int d, int base, int tax) {8. int year = 2006;9. if ((d > 1000) && (year > 2000)) {10. int shippingFee = 10;11. return base + tax + shippingFee;12. }13. else {14. return base + tax;15. }16. }
Figure 4-2: An example C program that uses int as the declared type for variablesof several different abstract types
3
taxPrice total
??50
itemPrice
3000
dist
main()
The figure above shows the state of variables and their abstract types while the
program is in the middle of executing line 5 in Figure 4-2, just prior to the call to
totalCost(). 4 local variables have been declared in main(). Each receives a fresh
tag and is placed in a singleton set, denoted by the circles around each variable/value
pair.
78

3000
dist total
??50 3
itemPrice taxPrice
3000
d base tax
50 3
totalCost()
main()
Upon entrance to totalCost() in line 7, the values of the 3 arguments from main()
are copied into the parameters, as shown by the arrows in the figure above. Thus,
the 3 argument-parameter pairs belong to the same set because they now hold the
same values.
3000
dist
tax
3
total
??50 3
itemPrice taxPrice
3000
d base
50
totalCost()
main()
200610
shippingFee year
The figure above shows the state after executing line 10. 2 new local variables,
shippingFee and year, are created and placed into singleton sets. Notice that no
merging of sets occurs in line 9 because both variables are compared to fresh numeric
literals and the && operator does not qualify as an interaction.
79
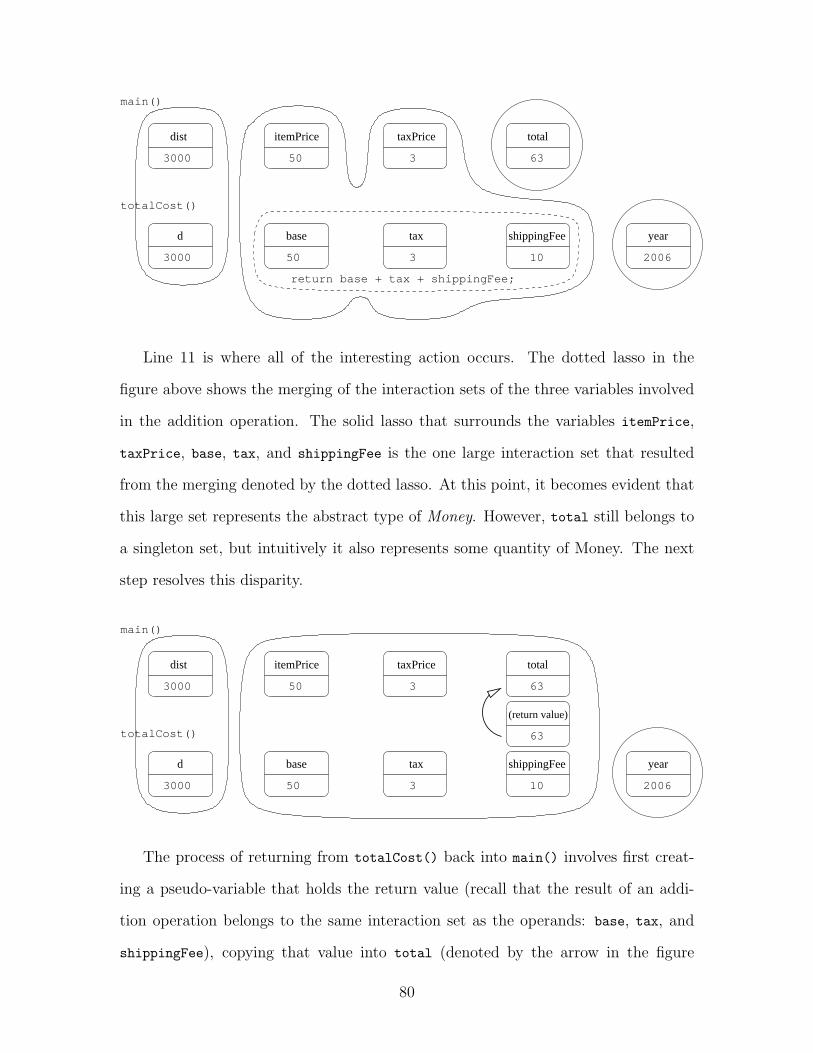
3000
dist
tax
3
50 3
itemPrice taxPrice
3000
d base
50
totalCost()
main()
200610
shippingFee year
total
return base + tax + shippingFee;
63
Line 11 is where all of the interesting action occurs. The dotted lasso in the
figure above shows the merging of the interaction sets of the three variables involved
in the addition operation. The solid lasso that surrounds the variables itemPrice,
taxPrice, base, tax, and shippingFee is the one large interaction set that resulted
from the merging denoted by the dotted lasso. At this point, it becomes evident that
this large set represents the abstract type of Money. However, total still belongs to
a singleton set, but intuitively it also represents some quantity of Money. The next
step resolves this disparity.
3000
dist
tax
3
50 3
itemPrice taxPrice
3000
d base
50
totalCost()
main()
200610
shippingFee year
total
63
(return value)
63
The process of returning from totalCost() back into main() involves first creat-
ing a pseudo-variable that holds the return value (recall that the result of an addi-
tion operation belongs to the same interaction set as the operands: base, tax, and
shippingFee), copying that value into total (denoted by the arrow in the figure
80

1. int main() {2. Distance dist = 3000;3. Money itemPrice = 50;4. Money taxPrice = 3;5. Money total = totalCost(dist, itemPrice, taxPrice);6. }
7. Money totalCost(Distance d, Money base, Money tax) {8. Time year = 2006;9. if ((d > 1000) && (year > 2000)) {10. Money shippingFee = 10;11. return base + tax + shippingFee;12. }13. else {14. return base + tax;15. }16. }
Figure 4-3: The program of Figure 4-2 after running our dynamic abstract typeinference algorithm
above), and as a result, merging the singleton interaction set of total with the large
5-element set. Notice how the dynamic nature of this algorithm provides perfect
context-sensitivity via value flows. The analysis could recognize that total had the
same abstract type as itemPrice and taxPrice, even though the interaction occurred
within another function.
At this point, the target program finishes executing and the analysis terminates,
providing a partition of three abstract types for all of the variables. It presents the
results in the form of sets of variables belonging to the same abstract type, and the
user must use his/her intuition to provide names for these types. In this example, the
names could be Distance, Money, and Time for the leftmost, middle, and rightmost
sets, respectively. A follow-on tool could re-insert these named types back into the
program’s source code as typedefs or other annotations, as shown in Figure 4-3.
81

4.3 Implementation
I have implemented a tool named DynComp that performs the analysis described in
Section 4.2 on C and C++ target programs for x86/Linux. (A colleague implemented
a similar tool for Java programs.) DynComp is built on top of Fjalar, so it computes
abstract types for global variables and function parameters at every program point
(function entrance and exit) and return values at exit points (that is, the sites are
function entrance and exit points). Note that the analysis is much more general than
my particular implementation (limited by Fjalar’s features) and can compute abstract
types for any kind of variable either more or less frequently.
4.3.1 Tracking dataflow and value interactions
The value tracking algorithm (Section 4.2.1) is performed purely at the binary level,
and operates on all code, including libraries. It is implemented by directly using Val-
grind’s binary instrumentation API. Instrumentation code maintains a 32-bit integer
for every byte of memory and every register, to represent the tag of the value cur-
rently stored in that location. This is implemented as a sparse data structure which
only allocates tags for memory that is currently in use so that the overhead is only
proportional to the amount of memory used by the target program. For every ma-
chine instruction that copies values from or to memory or registers, DynComp adds
a corresponding instruction to copy the tags of the copied bytes. For every machine
instruction that qualifies as an interaction, DynComp adds instructions to merge the
sets of the operands’ tags in value uf. Values that interact with the stack pointer are
treated specially: unrelated pointer values (such as local variable addresses) are not
counted as related merely because they are calculated as offsets from ESP or EBP.
New tags are created in response to two events: dynamic occurrences of literals,
and program input. For example, each time the instructions corresponding to the
82

code y = 42 are executed, a new tag is assigned to the memory location where y is
located. Initialization of memory, such as the zero-filling performed by calloc(), is
another example of new tags created from literals. Valgrind notifies DynComp when
a system call such as read stores new data in the program’s address space; these bytes
also receive fresh tags.
To illustrate, consider the code z = x + y. This can be compiled roughly into four
instructions: a load of the value of x into the register EAX, a load of y into EBX, an
addition of EAX and EBX, and a store of EAX to wherever z is located in memory. For
this code, DynComp instruments the binary with instructions to first copy the tag of
the value of x in memory into the tag of EAX, then copy the tag of y into the tag of
EBX, unify (merge) the interaction sets of the tags of EAX and EBX (because addition is
an interaction in the default mode of operation), and finally store the tag of EAX (the
result) as the tag of the value of z in memory.
4.3.2 Inferring abstract types for variables
DynComp subclasses the FunctionEntry class from the Fjalar API to add in extra
fields to hold per-program-point data structures such as new tags, var tags, and
type uf shown in the pseudo-code of Figure 4-1. Then, the conversion between value
interactions and variable abstract types (Section 4.2.2) is implemented by creating
an action callback function (similar to the one in basic-tool.c in Section 2.4) that,
during variable traversal at each program point execution, reads the tags of the values
of variables from memory into new tags and executes the algorithm of Figure 4-1.
The options that DynComp passes into Fjalar to determine which program points
and variables to trace control the scope of the analysis. Because most variables hold
values that span more than one byte, when those values are read, the interaction
sets of tags for all the bytes are merged in value uf to denote that those bytes all
represent a single value.
83

The requirements of the dynamic abstract type inference algorithm demonstrates
the power and applicability of the mixed-level approach. This algorithm requires
accurate value tracking, which can be done more easily at the binary level, and also
a translation from value-based information to variable-based information at every
program point (Figure 4-1), which requires source-level information about variables
and functions throughout execution. It would be theoretically possible to perform
this analysis as a pure binary-only analysis, collecting a full trace of value flow and
interactions throughout execution and performing post-processing, but that would be
prohibitively inefficient. A pure source-only analysis would be even more impractical
because fine-grained value flows are very difficult to trace by instrumenting source
code alone. The mixed-level approach makes it possible to access binary- and source-
level information throughout the duration of the target program’s execution and thus
allows the analysis to run quite efficiently in both time and memory.
4.3.3 Optimizations
These optimizations are important to reduce memory overhead for maintaining tags.
Garbage collection of tags: To avoid unbounded memory overhead, I have im-
plemented a garbage collector which periodically scans the tags held in memory
and registers as well as in the type uf structures at each site. Unclaimed tags
are reused when new values are created.
Eager canonicalization: Tags are replaced by their leaders (the canonical mem-
bers of sets in value uf) whenever possible to reduce the total number of non-
garbage tags in use. For example, when several bytes are copied from one
memory location to another, instead of merely copying the tags, DynComp
finds the leaders of those tags in value uf and replaces the tags, at both the
source and destination locations, with their leaders.
84

4.4 Evaluation
I evaluated DynComp in several ways. First, I carefully analyzed a small program
by hand, to verify that the results were accurate (Section 4.4.1), meaning that they
matched up well with human intuition about abstract types. Second, I performed a
case study of two programmers who were trying to understand and modify unfamiliar
programs; I observed whether the analysis results assisted them in their tasks (Sec-
tion 4.4.2). Third, I measured how much the inferred types improved the results and
efficiency of a follow-on analysis (Section 4.4.3). Fourth, I compared the results of
static abstract type inference to our dynamic abstract type inference (Section 4.4.4).
My experiments use the following subject C programs. All line counts are non-
comment, non-blank. I ran each program once, on a single input that is also noted
below.
• wordplay (740 LOC): anagram generator, using a 38KB dictionary
• RNAfold (1804 LOC, of which 706 LOC are in fold.c): secondary structure
predictor, folding a length-100 RNA sequence, only tracing program points
within fold.c
• SVM-Light (5834 LOC): support vector machine learning tool, training an SVM
on a 474-line input
• bzip2 (5128 LOC): file compressor, running on a 32KB text file of gcc source
code
• flex (11,977 LOC): lexical analyzer generator, running on the lexical grammar
for C
• perl (110,809 LOC): scripting language implementation, interpreting a 672-line
sorting program from its test suite (our analysis ignored all global variables)
85

wordplay RNAfold SVM-Light bzip2 flex perl
Representation Type 23 42 12 38 190 53Declared Type 6.2 20 4.5 7.9 87 21Abstract Type (DynComp) 3.5 18 4.7 1.9 2.4 7.8
Table 4.1: Average number of variables in a type for each site. Section 4.4.1 describesthe varieties of type.
4.4.1 Accuracy
Table 4.1 shows the number of variables that share a type in our subject programs,
averaged over all function entrances and exits. These averages do not include pointer
variables, because abstract types of pointers (as opposed to their contents) are rarely
interesting. “Representation types” group all variables into four types based on their
machine representation: integer, floating-point, string, and addresses (pointers). “De-
clared types” group variables by their declared types in the program’s source code,
thus distinguishing between signed and unsigned integers, integers of different sizes
(e.g., int, short), and type aliases defined using typedef. “Abstract types” use the
output of DynComp. In general, the abstract types are significantly finer-grained
than the declared types, with the exception of SVM-Light, which contained many
interactions between variables of different declared types (i.e., ints interacting with
shorts); DynComp ignores declared types when performing its analysis, so it can be
possible for variables of different declared types to belong to the same abstract type,
as demonstrated by SVM-Light.
In order to assess the accuracy of DynComp, I compared its output to a careful
manual analysis of the wordplay anagram generator program. My hand analysis
involved surmising programmer intent by reading code comments and looking at
how variables are used throughout the program. It produced abstract types that
matched well with human intuition (I did not write this program, so I do not know
what abstract types the programmer truly intended to include, but my inferences
seem reasonable). The wordplay program is small (740 lines); an exhaustive hand
86

Global variables Declarations and comments from wordplay.cType 1 keymem char *keymem; /* Memory block for keys */
largestlet char largestlet;words2mem char *words2mem; /* Memory block
for candidate words */*words2 char **words2; /* Candidate word index
(pointers to the words) */*words2ptrs char **words2ptrs; /* For copying
the word indexes */*wordss char **wordss; /* Keys */
Type 2 ncount int ncount; /* Number of candidate words */*lindx1 int *lindx1;*lindx2 int *lindx2;*findx1 int findx1[26];*findx2 int findx2[26];
Type 3 longestlength int longestlength; /* Length of longestword in words2 array */
max depth int max depth;Type 4 *wordsn int *wordsn; /* Lengths of each word
in words2 */Type 5 *wordmasks int *wordmasks; /* Mask of which letters
are contained in each word */Type 6 rec anag count int rec anag count;/*For recursive algorithm,
keeps track of number of anagrams found */Type 7 adjacentdups int adjacentdups;Type 8 specfirstword int specfirstword;Type 9 maxdepthspec int maxdepthspec;Type 10 silent int silent;Type 11 vowelcheck int vowelcheck;
Table 4.2: Abstract types inferred by DynComp for all global variables withinwordplay. A variable with a star (*) preceding its name represents the contentsthat a pointer variable refers to.
87

examination is not feasible for larger programs. Indeed, the difficulty of such an
analysis is a motivation for the DynComp tool.
I ran wordplay with DynComp on an 18-letter string to anagram and a 38KB
dictionary, achieving 76% coverage of the executable lines. My evaluation considers
all 21 global variables. DynComp places them in 11 abstract types, each denoted by
a set in Table 4.2. My manual analysis finds 10 abstract types, merging types 3 and
4 in the table; otherwise, my manual analysis, and the code comments, are consistent
with DynComp’s results.
The declared types and comments indicate that Type 1 represents the abstract
type of “words” in the program. Variable largestlet represents the largest letter
found in some word, and although it is of type char instead of char*, code inspection
confirms that it interacts with characters within the wordss array, so thus it has the
same abstract type as the other variables in the set.
Type 2 contains variables related to indices into arrays of words. These code
comments reveal how the programmer intended to use these variables:
/* Create indexes into words2 array by word length.Words of length i will be in elements lindx1[i]through lindx2[i] of array words2.
.../* Create indexes into wordss array by first letter.
Words with first letter "A" will be will be inelements findx1[i] through findx2[i] of array wordss.
*lindx1 and *lindx2 are indices into the array words2, and *findx1 and *findx2 are
indices into the array wordss. Thus, all four indices belong to the same abstract type
since the contents of the words2 and wordss arrays both belong to the same abstract
type. ncount interacts with *lindx2 to produce these indices.
Type 3 contains variables that test whether the base case of a recursive function
has been reached, in this line of code:
88

if ((max_depth - *level) * longestlength < strlen(s))
Comments in the code indicate that longestlength and *wordsn should belong to the
same abstract type representing “length of word in words2 array”, but DynComp fails
to recognize this relationship because their values never actually interact. longest-
length is initialized with return values of independent calls to strlen(), not from
cached elements of wordsn. DynComp thus places *wordsn into its own singleton set
(Type 4). No analysis — static or dynamic — that infers abstract types via value
interactions could notice this relationship.
Type 5 contains the contents of the wordmasks array, which holds “mask[s] of which
letters are contained in each word”, according to the comments in the declaration.
DynComp correctly separates the contents of this integer array from the other integer
and integer array content variables in Types 2, 3, and 4.
DynComp correctly placed the remaining variables in singleton sets (Types 6–11)
because no interactions occurred among them and variables in other sets.
4.4.2 User studies
Two MIT researchers (who are not members of our research group) who were strug-
gling with reverse engineering problems volunteered to try using DynComp to assist
them with their C programming.
RNAfold
The first researcher is a computational biologist who had recently refactored RNAfold,
an 1804-line RNA folding program [26]. The refactoring converted 55 int variables
of the abstract type “energy” into type double. The program has hundreds of non-
energy-related int variables. His hand analysis statically emulated the operation of
DynComp, building up sets of related variables by tracing assignments, function calls,
and binary operators in the source code. It took him approximately 16 hours of work
89

to find all the energy variables. He described the process as tedious and error-prone;
two iterations were required before he found everything.
I ran DynComp on RNAfold with a test case of a single 100 base pair RNA se-
quence extracted from a public database (achieving 73% statement coverage of fold.c,
where the algorithm resides). I showed the inferred sets of abstract types to the re-
searcher and observed his reactions and comments. One 60-element set contained all
of the energy variables the researcher had found via manual code inspection. That set
also contained 5 index variables, which had interacted with energy variables during
complex initialization code. Although the researcher’s notion of abstract types did
not perfectly match the tool’s definition, this minor mismatch was no hindrance: the
researcher easily and quickly recognized and filtered out the few non-energy variables.
The DynComp results gave the researcher increased confidence in his refactoring.
He estimated that instead of spending approximately 16 hours of manual analysis,
he could have set up the test, run the tool, observed the results, and filtered out
inaccuracies in 1 or 2 hours.
SVM-Light
The second researcher was trying to understand SVM-Light, a 5834-line support vec-
tor machine implementation [27]. His goal was to create a hardware implementation.
He was familiar with SVM algorithms but unsure of how SVM-Light implemented a
particular algorithm.
I ran SVM-Light once to train the SVM to predict whether income exceeds
$50K/yr based on census data (achieving 37% statement coverage). The DynComp
output, the variable names, and the source code and comments confirmed his in-
tuitions about how the mathematical variables in the SVM algorithm mapped into
program variables in code. For example, at one particular site, there was a perfect
correspondence between his notion of abstract types and what DynComp inferred,
90

for variables that dealt with calculating error bounds to determine whether to shift
the SVM up to higher dimensions.
The researcher noted that the variable buffer appeared in large sets at many
sites, and he initially suspected imprecision in DynComp. After double-checking the
code, though, he saw that buffer was used pervasively to hold temporary calculation
results for many different operations. He had previously thought that buffer was
only confined to a few core operations, so he learned a new fact about the program
in addition to verifying what he already knew.
4.4.3 Dynamic invariant detection
Section 4.4.2 evaluated whether abstract types are useful to programmers. This sec-
tion evaluates whether abstract types can improve the results of a follow-on analysis.
As described in Section 4.1, abstract types are applicable to many analyses; for
concreteness, our evaluation uses the Daikon dynamic invariant detection system [15]
(described in greater detail in Section 3.1.1).
Finer types than those that appear in the program source can aid Daikon in two
ways. First, they can improve run-time performance, because there is no need to
hypothesize or check properties over variables of different abstract types. More im-
portantly, they can improve output quality by reducing irrelevant output: if fewer
properties are hypothesized, then fewer false positives will result. Daikon has been ap-
plied to dozens of problems in software engineering and other fields [42], so improving
its results is a practical and realistic problem.
Currently, one of the biggest usability limitations of Daikon is the fact that it gen-
erates many correct but uninteresting invariants. For instance, it might find for two
int variables arr index and cur year that arr index < cur year. This is probably
correct if arr index represents an index into a small array and cur year represents
a year, but this is an uninteresting invariant because those two variables have dif-
91

DaikonTreatment time (sec) memory (MB) # invariants
wordplayRepresentation types 7 24 34,146Declared types 6 24 25,593Lackwit 5 24 4,281Abstract types 5 24 2,915
RNAfoldRepresentation types 11 66 2,052Declared types 10 66 2,052Lackwit 10 66 1,016Abstract types 10 66 840
SVM-LightRepresentation types 35 30 8,900Declared types 39 30 8,900Lackwit 41 30 7,486Abstract types 35 30 7,758
bzip2Representation types 172 151 12,932,283Declared types 175 151 12,879,392Lackwit 162 155 549,555Abstract types 173 156 340,558
flexRepresentation types >12,384 >1,700 out of memoryDeclared types >10,573 >1,700 out of memoryLackwit 2285 537 437,608,949Abstract types 1980 371 8,144,916
Perl (ignoring all global variables)Representation types 266 220 1,371,184Declared types 275 215 1,366,463Abstract types 276 221 1,029,096
Table 4.3: Effect of types on a follow-on analysis, dynamic invariant detection. Alltests were run on a P4 3.6GHz PC with 3GB RAM.
ferent abstract types. DynComp’s output can direct Daikon to only find invariants
over variables with the same abstract type, thus improving the quality of generated
invariants by reducing the number of uninteresting ones.
I measured the effect of the type declarations on Daikon’s run time and maxi-
mum heap (memory) size, and also on the size of Daikon’s output (the number of
92

hypothesized invariants). For implementation simplicity, Daikon assumes that the
type information that it is given is transitive; that is, if variables a and b have the
same abstract type, and so do b and c, then variables a and c have the same abstract
type. This is not necessarily true in our dynamic context, but DynComp performed
this merging (which reduces precision) before presenting the information to Daikon.
DynComp’s run time was approximately the same as Daikon’s, so it is a reasonable
preprocessing step.
Table 4.3 shows the results (the rows labeled “Lackwit” are for a static analy-
sis that will be explained in Section 4.4.4). Unfortunately, Daikon’s run times and
memory usage remained about the same, probably because there is processing in-
volved in discarding irrelevant invariants (my colleagues have not had time to look
into optimizing Daikon to take advantage of abstract type information in detail).
However, Daikon produced fewer invariants for treatments with smaller average set
sizes. As with the results for average set sizes in Table 4.1, the effect tends to be
more pronounced on larger programs. For flex, abstract type information makes the
difference between being able and unable to run Daikon at all, and the more precise
dynamically-collected information yields a more than 50-fold decrease in the number
of hypothesized invariants. The two rows whose memory usage are labeled “>1,700”
indicate incomplete runs that exceeded the maximum memory available to a Java
process on this architecture.
In order to verify that the invariants eliminated by the abstract type information
produced by DynComp were in fact spurious, I exhaustively examined all the dif-
ferences between Daikon’s output using declared types and abstract types on several
smaller examples. For SVM-Light, I performed the hand-evaluation together with the
researcher in the user study. He confirmed that all but one eliminated invariant were
spurious, because they all falsely related variables of different abstract types. There
were several instances of Daikon falsely relating two integer variables, one of which
93

Abstract types wordplay RNAfold SVM-Light bzip2 flex perlLackwit (static) 9.1 29 5.6 2.1 14.6 n/aDynComp (dynamic) 3.5 18 4.7 1.9 2.4 7.8
Table 4.4: Average number of elements in an abstract type, as computed by the statictool Lackwit and the dynamic tool DynComp.
was used as an enumerated value but declared as an int and assigned small constant
symbolic values defined in #define statements. For the one invariant that he said
should not have been eliminated, the two variables had a control-flow-based (rather
than a dataflow-based) relationship, so our tool was not able to assign them to the
same abstract type. I also examined the differences in RNAfold and again saw that
almost all eliminated invariants were spurious. Less detailed examinations of other
test programs seem to confirm these conclusions.
4.4.4 Comparison to static analysis
Abstract type inference can be performed statically as well as dynamically, and the
two approaches have different tradeoffs. This section repeats the evaluation of Sec-
tions 4.4.1, 4.4.2, and 4.4.3, using a static abstract type inference tool, Lackwit (de-
scribed in detail in Section 4.5.1), whose goals and output format are the same as
those of DynComp.
Accuracy
Table 4.4 shows the average size of an abstract type as computed by the static tool
Lackwit, as compared to those computed by our dynamic tool DynComp. (Lackwit
was unable to process perl.) The average number of variables in an abstract type is an
approximate indication of the precision of each analysis. These numbers alone cannot
indicate correctness, so I performed a source code inspection on several programs to
determine whether two variables in the same set actually correspond to the same
programmer-intended abstract type.
94

My hand examination of bzip2 and flex focused on the differences in the Lackwit
and DynComp output, which I hoped would indicate the strengths and weaknesses
of the static and dynamic approaches. Typically the DynComp results were finer and
were correct, so far as I could tell.
As in Section 4.4.1, I carefully examined the wordplay results. Lackwit assigns
the last 6 variables of Table 4.2 to singleton sets (Types 6–11), just like DynComp
and my hand analysis. However, Lackwit assigns the first 15 global variables to a
single abstract type; in other words, Lackwit is unable to make any distinction among
them. By comparison, DynComp assigns them to five distinct abstract types (Types
1–5 in Table 4.2), and the hand analysis assigns them to four distinct abstract types.
Lackwit’s static analysis mistakenly groups 15 variables together into one abstract
type because of its conservative assumptions about runtime behavior. As one exam-
ple, consider why it merges types 1 and 3. wordplay is invoked from the command
line via:
wordplay -d<depth> <word> -f <word list file>
In C, command-line arguments are passed into the program within the argv string
array. The static analysis does not distinguish the elements of an array, but gives
them all the same abstract type. wordplay assigns the numeric value of the <depth>
argument to max depth (Type 3), and the <word> argument interacts with the word
variables in Type 1. Thus, Lackwit merges the sets representing types 1 and 3.
Other conservative approximations cause Lackwit to spuriously group other variables
together into one large set.
User studies
By inspecting the abstract types produced by DynComp for RNAfold, the researcher
saw that one particular set contained all the energy variables plus 5 variables of other
95
abstract types (see Section 4.4.2). Hand-inspection of the abstract types produced by
Lackwit revealed that it grouped 10 extraneous variables into that same set in addition
to the variables that DynComp placed there, thus making the results strictly worse.
Hand-inspection of the abstract types produced by Lackwit for SVM-Light re-
vealed no significant differences from the results of DynComp.
Dynamic invariant detection
The rows labeled “Lackwit” in Table 4.3 show that the number of invariants that
Daikon produced with abstract type information from Lackwit was greater than with
information from DynComp. DynComp can partition the variables into smaller and
finer abstract types, and this effect propagates to reduce the number of hypothesized
invariants.
I compared Daikon’s output using the types produced by Lackwit with the types
produced by DynComp for several examples. I exhaustively reviewed the differences
for RNAfold and SVM-Light and noted mixed results: there were cases where Dyn-
Comp produced sets of abstract types that more closely mimicked the researcher’s
notion, and those where Lackwit did. I believe that a more exhaustive or longer test
would have been able to improve the results of DynComp.
4.5 Related Work
This section gives additional details about the previous static approaches to abstract
type inference, and also compares the present work to more distantly-related research
in type inference (including of unit types), points-to analysis, and slicing.
96

4.5.1 Static abstract type inference
The most closely related project to DynComp is Lackwit [41], which performs a static
analysis on C programs with a similar purpose as our dynamic one. Though it can
be effective for small programs, and its algorithms are theoretically scalable to quite
large programs, Lackwit suffers from some limitations of precision that are almost
impossible to avoid in a static analysis.
Lackwit’s key implementation technique is to summarize each procedure with
a polymorphic type. A type system with parametric polymorphism allows types
to contain type variables (conventionally represented by Greek letters) that can be
consistently replaced with another type. For instance, a function that returns the
first element of a list might have a type “α list → α”, representing the fact that it
can be applied to a list of integers, returning an integer (when α is replaced by int),
or to a list of booleans to return a boolean, and so on. Lackwit effectively devises
a new type system for C that is distinct from the usual one: it reflects some of the
same structure of data (with mutable references and tuples analogous to pointers and
structures), but it allows general polymorphism as in ML, and type constructors can
be subscripted by tag variables. For instance, rather than having a single integer type
int, there is a family intα, intβ, . . . . The problem of inferring abstract types then
reduces to giving a type to each function; because the type is polymorphic, different
uses of the function need not use values of the same abstract type.
For instance, if a function uses two integer arguments together in an operation,
the parameters would both get the type intα (where α is a variable):
void f(int a, int b, int c) { a + b; }
// Type: (intα, intα, intβ) -> void
....
f(x, y, 5); // x, y both of type intµ....
f(z, w, 7); // z, w both of type intψ
97

At each site where the function is called, its argument types must have the same tags
(both x and y are of type intµ), but there is no constraint between different calls
(intµ and intψ can be distinct).
Lackwit constructs these types using the Hindley-Milner type inference algo-
rithm [33]. Its algorithm starts by assigning unique type variables to program vari-
ables, and then discovers additional constraints on the type variables by collecting
equality constraints from the program and matching the structure of types in a process
called “unification”. Though the theoretical worst-case running time of the algorithm
is superpolynomial, this worst case does not occur in practice: the algorithm’s running
time is close to linear in the program size. Unfortunately, the theoretical asymptotic
scalability of Lackwit does not suffice to make the tool applicable to large programs.
In our experience, Lackwit itself runs fairly quickly, but often crashes on attempts to
query its database, requiring a slow process of repeated queries. Therefore, we were
unable to fairly compare the performance of Lackwit to that of DynComp.
Lackwit’s use of polymorphic types improves precision because that provides a
limited but efficient form of context sensitivity: the arguments to and value returned
by a procedure need not have the same abstract type at every location where the pro-
cedure is called. A side effect of this approach is that the abstract types that Lackwit
computes for a given procedure are based on the implementation of that function, but
are independent of the way in which the procedure is used by its callers. By contrast,
the abstract types computed by our algorithm reflect all of the values passed to a pro-
cedure. Lackwit is flow-insensitive: its analysis presumes that a variable has a single
abstract type throughout its scope, even if it holds different values at different sites.
Because our algorithm tracks values individually, it does not have this limitation.
One might imagine using a flow-sensitive static analysis, or making other changes,
but many of the limitations of Lackwit observed in previous sections would be shared
by just about any static analysis. For instance, in the wordplay example discussed in
98

Section 4.4.4, global variables that should have different abstract types are merged
by Lackwit because they are both initialized using elements of the argument array
argv. It is rare for a static analysis to even give different treatment to elements of
an array based on their index; we know of no static analysis that would distinguish
between, say, “array elements for which the preceding element was the string "-d"”
and “array elements for which the preceding element was the string "-f"”.
4.5.2 Other type inference
Other kinds of type inference can also be performed either statically or dynamically.
Lackwit is based on techniques such as Hindley-Milner type inference [33] that have
been extensively studied in connection with statically-typed functional languages such
as ML [34]. Types can also be statically inferred for languages that have only dynamic
types, such as Scheme [18] and Smalltalk [1, 47]; the problem is practically much
more difficult in this case. Dynamic approaches to type inference have been tried less
frequently, but are relatively lightweight, and can be effective in contexts like reverse
engineering when the results are further modified by a developer [43].
4.5.3 Units analysis
Abstract types are intuitively similar to units of measurement. A unit, like an abstract
type, is an additional identity that can be associated with a number, and which gives
information about what other values can sensibly be operated on together with a
value. Also like abstract types, units are poorly supported by existing languages,
and can be inferred from a program’s operations. “Unit types” [28, 4] might be
considered a variant of abstract type, but they have an additional algebraic structure
not present in the abstract type systems considered so far. For instance, the unit
type of the product of two quantities does not have the unit type of either factor;
instead, it has a product unit type. Unit types can be inferred by extending abstract
99

type inference with algebraic constraint solving; this can be done either dynamically
or statically. The “units” mode of DynComp computes an approximation to physical
unit types: if DynComp in this mode puts two variables in the same abstract type,
they must have the same units, but several different abstract types might represent
variables with one set of units, if those variables do not interact directly.
Erwig and Burnett [17] perform an analysis on spreadsheets that they refer to
as “unit inference,” but like our analysis they do not model the algebraic properties
of units. Instead, they introduce a type system that appears to represent a multi-
dimensional hierarchical classification of entities (the precise interpretation of their
type system is unclear, inasmuch as the system’s type constructors do not have the
standard interpretation). Rather than simply requiring combined quantities to have
the same units, their system requires that values represent a complete level of the
hierarchy in each dimension: for instance, adding apples and oranges is appropriate
if they are the only kinds of fruit in the spreadsheet, but illegal if bananas also exist.
Erwig and Burnett give an algorithm to infer their unit types, but the main chal-
lenge is not to infer information from operations, because their spreadsheets already
have human-readable annotations in the form of row and column headings; rather
the challenge is to infer which combination of header cells describe which data cells,
based on the layout.
4.5.4 Points-to analysis
Abstract type inference is particularly important for variables of primitive types such
as integers, whose types in the original program rarely give information about their
meaning. Though abstract type inference also groups pointer (or reference) variables
according to the dataflow between them, and could easily be extended to group
pointers with their referents (treating the dereference operation as another kind of
interaction), it is usually more useful to distinguish pointers according to what they
100

point to. This extension gives the problem of points-to or aliasing analysis, which
answers questions of the form “what could p point to?” or “could p and q ever point
to the same location?”. Points-to analysis can be performed dynamically [35], and
this is in some ways easier than dynamic abstract type inference because no tags are
necessary: the numeric value of a pointer uniquely identifies what it is pointing at.
However, points-to analysis has been studied more extensively as a problem for
static analysis. Abstract type inference is one of many problems that are hard to
solve statically without accurate information about pointers, since some abstract
type must be given to the value produced by a pointer dereference. Lackwit’s as-
signment of polymorphic types to references effectively represents a kind of pointer
analysis. Pointer analysis has been studied extensively, but finding the best trade-off
between precision and performance for a particular problem is still an area of active
research [11, 54]. Many points-to analyses could be converted into abstract type in-
ference algorithms with similar performance and scalability characteristics by adding
special-case treatment of operators on primitive types.
The well known almost-linear-time points-to analysis of Steensgaard [50] has an
additional connection to our algorithm in its use of an efficient union-find data struc-
ture. Like our analysis, Steensgaard’s algorithm uses a union-find structure to repre-
sent a partition of program variables, but beyond that their uses are rather different.
In our algorithm, the goal is to compute an undirected (symmetric) and transitive
relation, and the union-find structure represents the equivalence classes of the rela-
tion. In Steensgaard’s algorithm, the goal is to compute a directed relation, points-to,
that is not transitive, and the union-find structure is used to partition the domain of
the relation so that an over-approximation to it can be represented in linear space.
Steensgaard’s algorithm is more closely related to the analysis that Lackwit performs:
both were inspired by unification-based type inference.
101

4.5.5 Slicing
Our dynamic abstract type inference relates variables that are connected by dataflow
and by co-occurrence in primitive operations. Those portions of a program that are
connected by dataflow and control dependence can be queried using the technique
of slicing; a backward slice of a particular statement or expression indicates all the
other statements or expressions whose computation can affect the given one. Static
slicing approximates this relation, and dynamic slicing [3, 30, 52] computes it exactly
for a given computation. In the general case, dynamic slicing amounts to maintaining
a full execution trace of a program, and much dynamic slicing research focuses on
how to collect and maintain this trace information efficiently. Our analysis considers
similar issues with respect to collection, but pre-computes the result for any abstract
type query in the compact form of disjoint variable sets. From a program slice, one
can construct an abstract type consisting of the variables mentioned in the slice,
and conversely the statements that use variables of a given abstract type form a slice.
Under this correspondence, our abstract types correspond to slices that ignore control
dependencies.
4.6 Conclusion
DynComp is an implementation of a novel technique for dynamic inference of abstract
types. Its algorithms for tracing value flows and interactions and then translating
into abstract types for variables are most easily implemented using the mixed-level
approach of Fjalar, which allows for close integration of source- and binary-level
information throughout execution. DynComp helps to improve human understanding
of unfamiliar code and also improves the results of invariant detection, a follow-on
dynamic analysis. It is publicly available on the web in the source code distribution
of Daikon: http://pag.csail.mit.edu/daikon/
102

Chapter 5
Conclusion
5.1 Future Work
One of the wonderful aspects of building a tool framework is that there are many
possibilities for both extending the framework and also for building novel tools on
top of it. Here is a list of possibilities for future work.
5.1.1 The Fjalar Framework
• Create a more general and flexible traversal mechanism, perhaps implemented
as some sort of query language where the user can more precisely specify how
to traverse inside of arrays and data structures (an extension of the mechanism
described in Section 2.2.4).
• Add support for observing local variables.
• Improve and fix bugs in Fjalar’s support for C++ by testing it on additional
large C++ programs (there has already been extensive testing on C programs).
• Extend Fjalar to work on additional platforms besides x86/Linux that Valgrind
supports, such as AMD64/Linux.
103

• Extend Fjalar to work on other languages that the gcc compiler suite supports,
such as Objective-C, Fortran, Java, and Ada.
• Extend Fjalar to support binaries compiled with some optimizations.
• Use Fjalar to build new dynamic analysis tools, such as a dynamic units in-
ference tool that can approximate unit relationships (e.g., physics units), much
like how DynComp can approximate abstract types.
5.1.2 Kvasir: A C and C++ Front-End for Daikon
• Generalize the value profiling that Kvasir performs so that it might be useful
for other tools besides Daikon, or even extend it to be able to create summaries
of data structure form and shapes so that it can present its results to a human
to help improve program understanding.
5.1.3 DynComp: Dynamic Inference of Abstract Types
• Perform binary-level basic-block optimizations on the Valgrind IR to improve
run time performance and to reduce memory overhead from maintaining tags.
• Improve the user interface beyond its current form, which simply presents sets
of variables at each program point, where all variables in a set have the same
abstract type.
• Add a query engine and mechanism whereby the user can enter in two variables
with the same abstract type and be shown the path of statements (dataflow
or interactions) that led to those two variables being grouped into the same
abstract type.
104

5.2 Contributions
This thesis presented a novel mixed-level approach to constructing dynamic analysis
tools for C and C++ programs (Chapter 1), a tool framework that implements this
approach (Chapter 2), and two dynamic analysis tools built on top of this framework
(Chapters 3 and 4). It provided a survey of existing source- and binary-based ap-
proaches to dynamic analysis (Sections 1.2 and 2.5) and argued for the advantages of
the mixed-level approach over both previous approaches in terms of scalability, robust-
ness, and applicability, especially for the kinds of analyses that deal with observing
data structures. Finally, it described several case studies of applying tools built using
the mixed-level approach to a variety of program analysis tasks: improving human
understanding of unfamiliar code (Section 4.4.2), invariant detection (Sections 3.4.1
and 4.4.3), and data structure repair (Section 3.4.2).
105

106

Bibliography
[1] Ole Agesen. The Cartesian product algorithm: Simple and precise type infer-ence of parametric polymorphism. In ECOOP ’95, the 9th European Conferenceon Object-Oriented Programming, pages 2–26, Aarhus, Denmark, August 7–11,1996.
[2] H. Agrawal. Towards automatic debugging of computer programs. TechnicalReport SERC-TR-103-P, Software Engineering Research Center, Purdue Uni-versity, September 1991.
[3] Hiralal Agrawal and Joseph R. Horgan. Dynamic program slicing. In Proceed-ings of the SIGPLAN ’90 Conference on Programming Language Design andImplementation, pages 246–256, White Plains, NY, June 20–22, 1990.
[4] Eric Allen, David Chase, Victor Luchangco, Jan-Willem Maessen, and Guy L.Steele Jr. Object-oriented units of measurement. In Object-Oriented Program-ming Systems, Languages, and Applications (OOPSLA 2004), pages 384–403,Vancouver, BC, Canada, October 26–28, 2004.
[5] Todd M. Austin, Scott E. Breach, and Gurindar S. Sohi. Efficient detection of allpointer and array access errors. In Proceedings of the SIGPLAN ’94 Conferenceon Programming Language Design and Implementation, pages 290–301, Orlando,FL, USA, June 1994.
[6] Robert Biddle, Stuart Marshall, John Miller-Williams, and Ewan Tempero.Reuse of debuggers for visualization of reuse. In ACM Symposium on SoftwareReusability (ACM SSR’99), pages 92–100, Los Angeles, CA, USA, May 21–23,1999.
[7] Derek Bruening, Evelyn Duesterwald, and Saman Amarasinghe. Design andimplementation of a dynamic optimization framework for Windows. In 4th ACMWorkshop on Feedback-Directed and Dynamic Optimization (FDDO), Austin,Texas, December 1, 2001.
[8] Brad Calder, Peter Feller, and Alan Eustace. Value profiling and optimization.Journal of Instruction Level Parallelism, 1, March 1999. http://www.jilp.org/
vol1/.
107

[9] Holger Cleve and Andreas Zeller. Locating causes of program failures. InICSE’05, Proceedings of the 27th International Conference on Software Engi-neering, St. Louis, MO, USA, May 2005.
[10] Center-TRACON automation system. http://www.ctas.arc.nasa.gov.
[11] Manuvir Das, Ben Liblit, Manuel Fahndrich, and Jakob Rehof. Estimating theimpact of scalable pointer analysis on optimization. In Proceedings of the EighthInternational Symposium on Static Analysis, SAS 2001, Paris, France, July 16–18, 2001.
[12] Brian Demsky, Michael D. Ernst, Philip J. Guo, Stephen McCamant, Jeff H.Perkins, and Martin Rinard. Automatic inference and enforcement of data struc-ture consistency specifications. In ISSTA 2006, Proceedings of the 2006 Inter-national Symposium on Software Testing and Analysis, Portland, ME, USA,July 18–20, 2006.
[13] Edison Design Group. C++ Front End Internal Documentation, version 2.28edition, March 1995. http://www.edg.com.
[14] T. Eisenbarth, R. Koschke, and D. Simon. Locating features in source code.IEEE Computer, 29(3):210–224, March 2003.
[15] Michael D. Ernst, Jake Cockrell, William G. Griswold, and David Notkin. Dy-namically discovering likely program invariants to support program evolution.IEEE Transactions on Software Engineering, 27(2):99–123, February 2001. Aprevious version appeared in ICSE ’99, Proceedings of the 21st InternationalConference on Software Engineering, pages 213–224, Los Angeles, CA, USA,May 19–21, 1999.
[16] Michael D. Ernst, Adam Czeisler, William G. Griswold, and David Notkin.Quickly detecting relevant program invariants. In ICSE 2000, Proceedings of the22nd International Conference on Software Engineering, pages 449–458, Limer-ick, Ireland, June 7–9, 2000.
[17] Martin Erwig and Margarett M. Burnett. Adding apples and oranges. In 4thInternation Symposium on Practical Aspects of Declarative Languages (PADL’02), pages 171–191, Portland, OR, USA, January 19-20 2002.
[18] Cormac Flanagan, Matthew Flatt, Shriram Krishnamurthi, Stephanie Weirich,and Matthias Felleisen. Catching bugs in the web of program invariants. InProceedings of the SIGPLAN ’96 Conference on Programming Language Designand Implementation, Philadelphia, PA, May 21–24, 1996.
[19] Free Software Foundation. GNU binary utilities. http://www.gnu.org/software/binutils/.
108

[20] Michael Golan and David R. Hanson. DUEL — a very high-level debugginglanguage. In Proceedings of the Winter 1993 USENIX Conference, pages 107–117, San Diego, California, January 5–29, 1993.
[21] Orla Greevy and Stephane Ducasse. Correlating features and code using acompact two-sided trace analysis approach. In Ninth European Conferenceon Software Maintenance and Reengineering, pages 314–323, Manchester, UK,March 23–25, 2005.
[22] Orla Greevy, Stephane Ducasse, and Tudor Gırba. Analyzing feature traces toincorporate the semantics of change in software evolution analysis. In ICSM2005, Proceedings of the International Conference on Software Maintenance,pages 347–356, Budapest, Hungary, September 27–29, 2005.
[23] Philip J. Guo, Jeff H. Perkins, Stephen McCamant, and Michael D. Ernst. Dy-namic inference of abstract types. In ISSTA 2006, Proceedings of the 2006 In-ternational Symposium on Software Testing and Analysis, Portland, ME, USA,July 18–20, 2006.
[24] Reed Hastings and Bob Joyce. Purify: A tool for detecting memory leaks and ac-cess errors in C and C++ programs. In Proceedings of the Winter 1992 USENIXConference, pages 125–138, San Francisco, California, January 20–24, 1992.
[25] Johannes Henkel and Amer Diwan. Discovering algebraic specifications fromJava classes. In ECOOP 2003 — Object-Oriented Programming, 17th EuropeanConference, pages 431–456, Darmstadt, Germany, July 23–25, 2003.
[26] Ivo Hofacker. Vienna RNA package. http://www.tbi.univie.ac.at/~ivo/RNA/.
[27] Thorsten Joachims. Making large-scale support vector machine learning practi-cal. In Advances in kernel methods: support vector learning, pages 169–184. MITPress, Cambridge, MA, USA, 1999.
[28] Andrew Kennedy. Programming Languages and Dimensions. PhD thesis, Uni-versity of Cambridge, April 1996.
[29] Adrian Kuhn, Orla Greevy, and Tudor Gırba. Applying semantic analysis tofeature execution traces. In 1st Workshop on Program Comprehension throughDynamic Analysis, pages 48–53, Pittsburgh, Pennsylvania, USA, November 10,2005.
[30] James R. Larus and Satish Chandra. Using tracing and dynamic slicing to tunecompilers. Technical Report 1174, University of Wisconsin – Madison, 1210 WestDayton Street, Madison, WI 53706, USA, August 26, 1993.
[31] James R. Larus and Eric Schnarr. EEL: Machine-independent executable edit-ing. In Proceedings of the SIGPLAN ’95 Conference on Programming LanguageDesign and Implementation, pages 291–300, La Jolla, CA, June 1995.
109

[32] Ben Liblit, Alex Aiken, Alice X. Zheng, and Michael I. Jordan. Bug isolationvia remote program sampling. In Proceedings of the ACM SIGPLAN 2003 Con-ference on Programming Language Design and Implementation, pages 141–154,San Diego, CA, USA, June 9–11, 2003.
[33] Robin Milner. A theory of type polymorphism in programming. Journal ofComputer and System Sciences, 17(3):348–375, 1978.
[34] Robin Milner, Mads Tofte, Robert Harper, and Dave MacQueen. The Definitionof Standard ML (Revised). MIT Press, 1997.
[35] Markus Mock, Manuvir Das, Craig Chambers, and Susan Eggers. Dynamicpoints-to sets: A comparison with static analyses and potential applicationsin program understanding and optimization. In ACM SIGPLAN/SIGSOFTWorkshop on Program Analysis for Software Tools and Engineering (PASTE’01),pages 66–72, Snowbird, Utah, USA, June 18–19, 2001.
[36] Benjamin Morse. A C/C++ front end for the Daikon dynamic invariant de-tection system. Master’s thesis, MIT Department of Electrical Engineering andComputer Science, Cambridge, MA, August 2002.
[37] George C. Necula, Scott McPeak, Shree Prakash Rahul, and Westley Weimer.CIL: Intermediate language and tools for analysis and transformation of C pro-grams. In CC ’02: Proceedings of the 11th International Conference on CompilerConstruction, pages 213–228, London, UK, 2002. Springer-Verlag.
[38] George C. Necula, Scott McPeak, and Westley Weimer. CCured: Type-saferetrofitting of legacy code. In Proceedings of the 29th Annual ACM SIGPLAN-SIGACT Symposium on Principles of Programming Languages, pages 128–139,Portland, Oregon, January 16–18, 2002.
[39] Nicholas Nethercote and Julian Seward. Valgrind: A program supervision frame-work. In Proceedings of the Third Workshop on Runtime Verification, Boulder,Colorado, USA, July 2003.
[40] Robert O’Callahan. Generalized Aliasing as a Basis for Program Analysis Tools.PhD thesis, Carnegie-Mellon University, Pittsburgh, PA, May 2001.
[41] Robert O’Callahan and Daniel Jackson. Lackwit: A program understanding toolbased on type inference. In Proceedings of the 19th International Conference onSoftware Engineering, pages 338–348, Boston, MA, May 1997.
[42] Jeff H. Perkins and Michael D. Ernst. Efficient incremental algorithms for dy-namic detection of likely invariants. In Proceedings of the ACM SIGSOFT 12thSymposium on the Foundations of Software Engineering (FSE 2004), pages 23–32, Newport Beach, CA, USA, November 2–4, 2004.
110

[43] Pascal Rapicault, Mireille Blay-Fornarino, Stphane Ducasse, and Anne-MarieDery. Dynamic type inference to support object-oriented reengineering inSmalltalk. In ECOOP ’98 Workshop on OO Reengineering, Brussels, Belgium,July 20-24, 1998.
[44] Thomas Reps, Thomas Ball, Manuvir Das, and James Larus. The use of pro-gram profiling for software maintenance with applications to the year 2000 prob-lem. In Proceedings of the Sixth European Software Engineering Conference andFifth ACM SIGSOFT Symposium on the Foundations of Software Engineering(ESEC/FSE 97), pages 432–449, Zurich, Switzerland, September 22–25, 1997.
[45] Ted Romer, Geoff Voelker, Dennis Lee, Alec Wolman, Wayne Wong, HankLevy, Brian Bershad, and Brad Chen. Instrumentation and optimization ofWin32/Intel executables using Etch. In USENIX Windows NT Workshop, Seat-tle, Washington, USA, August 11–13, 1997.
[46] Julian Seward and Nicholas Nethercote. Using Valgrind to detect undefined valueerrors with bit-precision. In USENIX 2005 Technical Conference, pages 17–30,Anaheim, CA, April 2005.
[47] S. Alexander Spoon and Olin Shivers. Demand-driven type inference with sub-goal pruning: Trading precision for scalability. In ECOOP 2004 — Object-Oriented Programming, 18th European Conference, Oslo, Norway, June 16–18,2004.
[48] Amitabh Srivastava and Alan Eustace. ATOM — a system for building cus-tomized program analysis tools. In Proceedings of the SIGPLAN ’94 Conferenceon Programming Language Design and Implementation, pages 196–205, Orlando,FL, USA, June 1994.
[49] Richard M. Stallman, Roland Pesch, and Stan Shebs. Debugging with GDB: TheGNU Source-Level Debugger. Free Software Foundation, 9th edition, 2002.
[50] Bjarne Steensgaard. Points-to analysis in almost linear time. In Proceedingsof the 23rd Annual ACM SIGPLAN-SIGACT Symposium on Principles of Pro-gramming Languages, pages 32–41, St. Petersburg Beach, FL, January 21–24,1996.
[51] Frank Tip. A survey of program slicing techniques. Report CS-R9438, Centrumvoor Wiskunde en Informatica (CWI), Amsterdam, 1994.
[52] G. A. Venkatesh. Experimental results from dynamic slicing of C programs. ACMTransactions on Programming Languages and Systems, 17(2):197–216, March1995.
[53] Mark Weiser. Program slicing. IEEE Transactions on Software Engineering,SE-10(4):352–357, July 1984.
111

[54] John Whaley and Monica S. Lam. Cloning-based context-sensitive pointer aliasanalysis using binary decision diagrams. In Proceedings of the ACM SIGPLAN2004 Conference on Programming Language Design and Implementation, Wash-ington, DC, USA, June 2005.
[55] Norman Wilde and Michael C. Scully. Software reconnaissance: mapping pro-gram features to code. Journal of Software Maintenance, 7(1):49–62, 1995.
[56] W. E. Wong, S. S. Gokhale, and J. R. Horgan. Quantifying the closeness betweenprogram components and features. Journal of Systems and Software, 54(2):87–98, October 2000.
[57] Wei Xu, Daniel C. DuVarney, and R. Sekar. An efficient and backwards-compatible transformation to ensure memory safety of C programs. In Pro-ceedings of the ACM SIGSOFT 12th Symposium on the Foundations of SoftwareEngineering (FSE 2004), pages 117–126, Newport Beach, CA, USA, Novem-ber 2–4, 2004.
112