a science-based approach to selecting air filters
DESCRIPTION
This article provides an overview of science-based factors to consider when selecting HEPA filters.TRANSCRIPT

CLEAN A IR SOLUT IONS
www.camfil.com 1
A SCIENCE-BASED APPROACH TO SELECTING AIR FILTERSBy Steve Devine, Sean O’Reilly, Andy Stillo, and Don Thornburg
This article provides an overview of science-based factors to consider when selecting HEPA filters.
Figure 1. Principles of air filtration
INTRODUCTION Understanding the Total Cost of Ownership (TCO) and the material compatibility of HEPA filters is essential for engi-neers and end users seeking to optimize filter selection for performance reliability and sustainability. In order to give the reader a basic understanding of how filters work, it is essential that the principles of filtration are clearly defined.
Air filters are physically simple, yet technically complicated devices. Whether particulate or gas phase filters, they rely on a complicated set of mechanisms to perform their function. In many cases, more than one of these mecha-nisms comes into play. Many new technologies have been employed in the effort to improve on the quality and perfor-mance of air filters, and in some cases to reduce their cost. The most notable areas where advancement has been pursued are reduction in pressure drop and elimination of biological contaminants in the filter media. It is important to consider whether applying new technologies to air filter products is necessary and functional. In many cases it is, in some cases, it isn’t. Certain technologies, like ionic air cleaners, may generate by-products that may be harm-ful to the environment. Air filters are physically simple, yet
technically complicated devices. Whether particulate or gas phase filters, they rely on a complicated set of mechanisms to perform their function. In many cases, more than one of these mechanisms comes into play. Many new technolo-gies have been employed in the effort to improve on the quality and performance of air filters, and in some cases to reduce their cost. The most notable areas where advance-ment has been pursued are reduction in pressure drop and elimination of biological contaminants in the filter media. It is important to consider whether applying new technologies to air filter products is necessary and functional. In many cases it is, in some cases, it isn’t. Certain technologies, like ionic air cleaners, may generate by-products that may be harmful to the environment.
Each mechanism is responsible for filtration of particles in a certain size range:
Impaction: larger particles are filtered due to the impac-tion mechanism. Larger particles have higher mass and are harder to turn than smaller particles due to inertia. Because of this inertial effect, the particles continue to travel in a somewhat straight line even though the airstream is turning to move past the fiber. Once the particle comes in contact with the fiber, it becomes attached and is “filtered” from the airstream.
Interception: in order to be intercepted, a particle must come within a distance from a fiber of one radius of it-self. Thus, the particle makes contact with the fiber and becomes attached. The interception mechanism can be contrasted with the impaction mechanism in that a particle which is intercepted is smaller and its inertia is not strong enough to cause the particle to continue in a straight line. Therefore, it follows the airstream until it comes in contact with a fiber.
Straining Inertia
Interception Diffusion
www.camfil.com 2
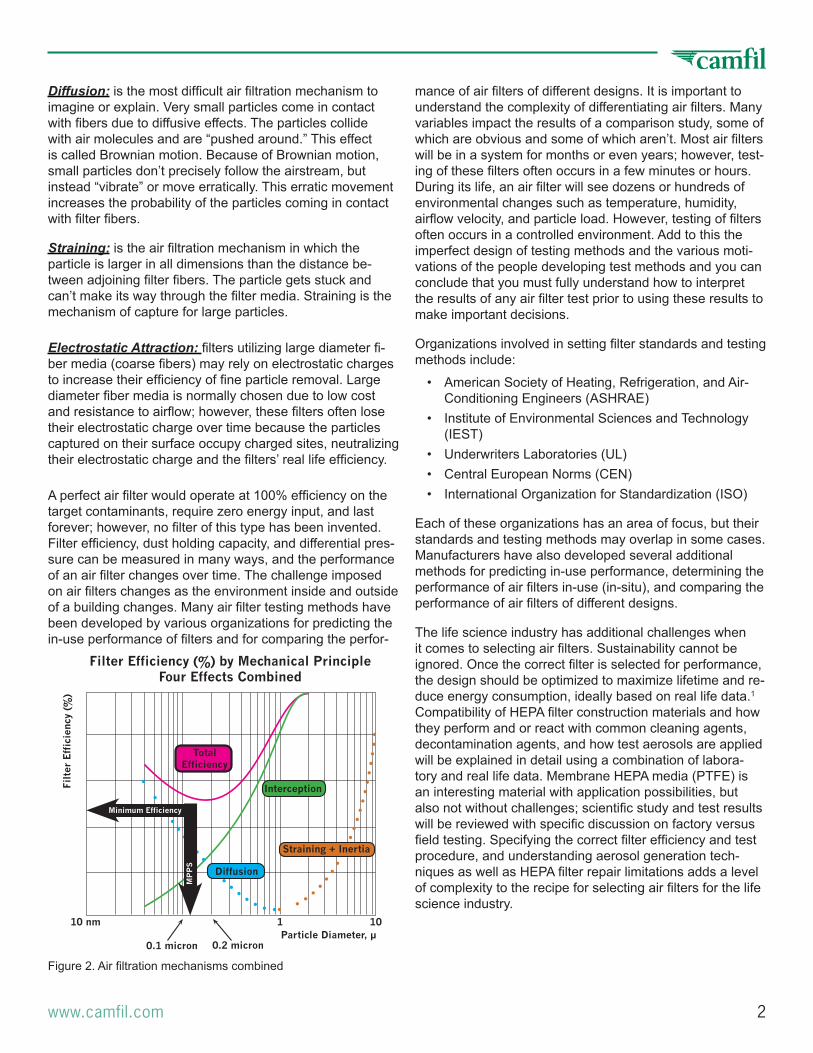
Figure 2. Air filtration mechanisms combined
Filter Efficiency (%) by Mechanical PrincipleFour Effects Combined
0.1 micron 0.2 micronParticle Diameter, µ
10110 nm
Diffusion
Straining + Inertia
Interception
TotalEfficiency
Minimum Efficiency
MP
PS
Filt
er E
ffic
ienc
y (%
)
Diffusion: is the most difficult air filtration mechanism to imagine or explain. Very small particles come in contact with fibers due to diffusive effects. The particles collide with air molecules and are “pushed around.” This effect is called Brownian motion. Because of Brownian motion, small particles don’t precisely follow the airstream, but instead “vibrate” or move erratically. This erratic movement increases the probability of the particles coming in contact with filter fibers.
Straining: is the air filtration mechanism in which the particle is larger in all dimensions than the distance be-tween adjoining filter fibers. The particle gets stuck and can’t make its way through the filter media. Straining is the mechanism of capture for large particles.
Electrostatic Attraction: filters utilizing large diameter fi-ber media (coarse fibers) may rely on electrostatic charges to increase their efficiency of fine particle removal. Large diameter fiber media is normally chosen due to low cost and resistance to airflow; however, these filters often lose their electrostatic charge over time because the particles captured on their surface occupy charged sites, neutralizing their electrostatic charge and the filters’ real life efficiency.
A perfect air filter would operate at 100% efficiency on the target contaminants, require zero energy input, and last forever; however, no filter of this type has been invented. Filter efficiency, dust holding capacity, and differential pres-sure can be measured in many ways, and the performance of an air filter changes over time. The challenge imposed on air filters changes as the environment inside and outside of a building changes. Many air filter testing methods have been developed by various organizations for predicting the in-use performance of filters and for comparing the perfor-
mance of air filters of different designs. It is important to understand the complexity of differentiating air filters. Many variables impact the results of a comparison study, some of which are obvious and some of which aren’t. Most air filters will be in a system for months or even years; however, test-ing of these filters often occurs in a few minutes or hours. During its life, an air filter will see dozens or hundreds of environmental changes such as temperature, humidity, airflow velocity, and particle load. However, testing of filters often occurs in a controlled environment. Add to this the imperfect design of testing methods and the various moti-vations of the people developing test methods and you can conclude that you must fully understand how to interpret the results of any air filter test prior to using these results to make important decisions.
Organizations involved in setting filter standards and testing methods include:
• American Society of Heating, Refrigeration, and Air-Conditioning Engineers (ASHRAE)
• Institute of Environmental Sciences and Technology (IEST)
• Underwriters Laboratories (UL)• Central European Norms (CEN)• International Organization for Standardization (ISO)
Each of these organizations has an area of focus, but their standards and testing methods may overlap in some cases. Manufacturers have also developed several additional methods for predicting in-use performance, determining the performance of air filters in-use (in-situ), and comparing the performance of air filters of different designs.
The life science industry has additional challenges when it comes to selecting air filters. Sustainability cannot be ignored. Once the correct filter is selected for performance, the design should be optimized to maximize lifetime and re-duce energy consumption, ideally based on real life data.1 Compatibility of HEPA filter construction materials and how they perform and or react with common cleaning agents, decontamination agents, and how test aerosols are applied will be explained in detail using a combination of labora-tory and real life data. Membrane HEPA media (PTFE) is an interesting material with application possibilities, but also not without challenges; scientific study and test results will be reviewed with specific discussion on factory versus field testing. Specifying the correct filter efficiency and test procedure, and understanding aerosol generation tech-niques as well as HEPA filter repair limitations adds a level of complexity to the recipe for selecting air filters for the life science industry.

www.camfil.com 3
Figure 3. SINTEF air filter performance study
USING LIFE CYCLE COST (LCC) ANALYSIS IN THE AIR FILTRATION INDUSTRYUsing Life Cycle Cost (LCC) analysis as a tool to calculate the Total Cost of Ownership (TCO) and then selecting the air filter with the lowest TCO is an excellent method for de-termining the most cost-effective filtration solution to meet user needs. The current industry “standard” for calculating LCC was published by Eurovent in 19991 and specifically addressed the role of air filtration based upon life cycle cost. It outlined the calculation methods and formulas used when computing the LCC of an air filtration system. A proper LCC calculation allows owners to identify filtration solutions to help minimize system cleaning, reduce filter disposal costs, reduce labor costs, count the savings as “cost avoidance” with extended filter life, and utilize person-nel for other activities.
There are different modeling software products available today. It’s imperative when modeling a given application that the data be based upon science and real life testing, not hypothetical data or artificial loading. The use of real life testing is a very time consuming and costly way of evaluat-ing filtration performance, but it provides the data needed to program modeling tools with the most accurate data and thus empowers end users with the confidence that the results are valid.
There are several key factors for selecting air filters to optimize energy consumption. The most important to remember is why was the air filter installed. The primary reason for the filter being installed was not to save money on energy. The air filter is there to remove particulate and contaminants from the air stream to protect the processes. If the filter can do that and use less energy, the air filter has added value.
We must always start with understanding what particle removal efficiency is required by the owner to protect the process, environment, or people. Unfortunately, there is
a paradoxical relationship between energy savings and a filter’s efficiency; generally, the higher the particle removal efficiency, the higher the energy consumption. Once the required particle removal efficiency requirement has been established, the filter selection can then be based upon ad-ditional criteria including:
1. Meeting this particle removal requirement throughout the service life.
2. Optimizing the resistance to airflow for the air filter to reduce energy consumption.
3. Minimizing the TCO of the air filter.
PARTICLE REMOVAL EFFICIENCYThe goal of LCC is to optimize the total cost of the filtration, while maintaining the minimum level of efficiency estab-lished by the owner or cognizant authorities. Unfortunately, a large number of commercially available filtration products use a filtration media that will show high particle removal ef-ficiency in laboratory testing, but will decrease in efficiency during actual service. If these products were promoted at the lower performance level where they perform for most of their service life, there would be no confusion; however, they are typically marketed at the higher “test report” ef-ficiency.
Field data from real-life filter installations reveals some interesting facts about the relative performance of elec-trostatically charged media filters vs. non-charged media filters. Numerous studies have documented the real-life losses in filtration efficiency commonly encountered with charged media. Figure 3 shows the field performance data from the SINTEF2 filter field test report showing the loss in efficiency over time for an ASHRAE 52.22 MERV 13 (F7 per EN-7793) filter. This study, in actual in-place testing exposed the drop in particle capture efficiency of synthetic or charged media. Table A shows the relative comparison of the industry laboratory test methods for air filters and their
efficiency nomenclature.
As shown in the data, the coarse fiber charged media of the MERV 13 (F7) filter really performs at a level below that of a MERV 11 (M6) filter. Thus, to properly run an LCC comparison on this charged filter, it should be compared to other MERV 11 (M6) filters. The MERV 13 (F7) non-charged filter performs according to expectations by maintaining a minimum efficiency very close to the initial efficiency throughout its life.
The point to be learned from this field data is that filters carrying the same laboratory test report designations may behave very differently in real life. To obtain an “apples to apples” LCC analy-sis, filters of the same true efficiency must be

www.camfil.com 4
TCO Elements Current AHU1 Proposed Filter Solution Comments Calculation
Component
Energy Cost $25,935 $17,574 The main component of air filter cost is the ENERGY required to move air through the filter, often many times of the cost of the filter itself. LCC
Filter Cost $6,372 $3,168 The cost of the initial filter and the replacement filters over the service time of the calculations. LCC
Labor Cost $792 $312 The labor cost to replace used filters. LCC
Waste Cost $312 $72 The disposal costs of the used filters. LCC
Mean Life Filter Efficiency (MLE) 71% 77% The average calculated particle removal efficiency at 0.4 um over the life of the
filter. TCO
Energy Cost Index (ECI) 7.65 USD/% 4.75 USD/%
The Energy Cost Index (ECI) is a method of relating the most important parameter of an air filter (particle removal efficiency) and the largest expense element; energy cost. The lower the ECI, the better the filter value.
TCO
CO2 Impact 343,117 pounds 232,494 pounds For this calculation the carbon footprint only considers energy usage. A more complete analysis would be required to get the full sustainability impact. TCO
Landfill Impact 15.81 cubic yards 5.49 cubic yardsLandfill impact is another part of the sustainability equation for filter consideration. Fewer filter changes and/or lower volume (smaller size) filters can help here.
TCO
Period of Evaluation 3.0 years 3.0 years Service time of this analysis. LCC
Total Cost of Ownership $33,411 $21,126 The New Filter solution will save this owner approximately $4,000 per
year in total cost. TCO
1 AHU - Air Handling Unit2 MLE - Filter efficiency at 0.4-micron, at the graph high point for number of particles in common airstreams, of a size that can enter the lungs and cause damage.
Table A. Sample output from air filtration total cost of ownership analysis.
compared. To better assist with this, ASHRAE 52.2-2007B has an optional Appendix J test method that gives the user the conditioned MERV-A value designed to simulate the efficiency loss experienced by some filters in actual ap-plication. Likewise, EN-779 requires that the manufacturer report the discharged efficiency at 0.4 µm.
RESISTANCE TO AIRFLOWOnce the actual particle removal efficiency is determined, the resistance to airflow for the product over the time in ser-vice must be evaluated. Some simple methods use initial pressure drop versus final pressure drop averaging, not a very scientific methodology and highly inaccurate. This laboratory testing is performed with synthetic dust of large particle size, not the much smaller sized contaminants typically found in the airstream. The purpose of that test is to expedite the filters’ loading process so two filters of the same relative construction may be compared under con-trolled laboratory conditions. The test was never designed to simulate real filter life. Filters of an engineered design have long loading curves with 80% of their average pres-sure drop well below this averaging. The proper way to establish filter life for product comparison is to take advan-tage of accumulated real life data performance.
USING LIFE CYCLE COST AND TOTAL COST OF OWNERSHIPFor accurate LCC filter performance data, the best ap-proach is to model current filter performance using typical operating conditions over a set time frame. Usually the owner has data relating to the filter change-out schedule, airflow rates, and airflow resistance values. When this in-formation is input into LCC modeling software, average par-ticle concentration loads may be determined. From there, how that specific system will perform if energy efficient filtration is utilized can be demonstrated. Once the owner accepts the proposed solution, the real fun begins. The new filters are installed and monitored for a period of time. Using standard energy measurement and verification prac-tices, the performance data can be monitored and recorded to determine the associated cost avoidance or energy savings. This can then be included in the LCC calculations to evaluate the TCO for the air filtration systems. The LCC calculations include the cost of the filters, the energy cost, maintenance cost, disposal cost, and any associated cost to clean parts of the system. The TCO can add the addi-tional costs to process orders, inventory materials, and any other costs associated with the purchase, installation, and operation of the system. The difference in TCO of replac-ing one filtration system with another system is the avoided cost for the owner and can be reported as a savings. Table A shows a typical LCC and TCO data set for comparing two
www.camfil.com 5
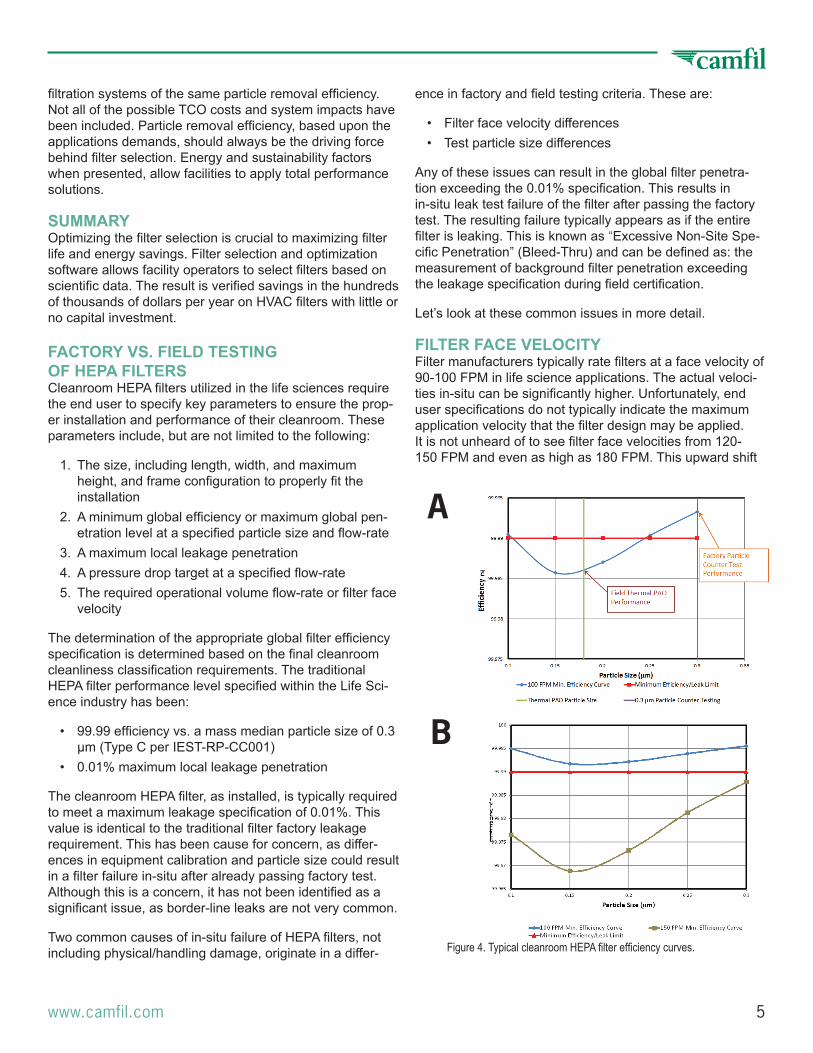
Figure 4. Typical cleanroom HEPA filter efficiency curves.
filtration systems of the same particle removal efficiency. Not all of the possible TCO costs and system impacts have been included. Particle removal efficiency, based upon the applications demands, should always be the driving force behind filter selection. Energy and sustainability factors when presented, allow facilities to apply total performance solutions.
SUMMARYOptimizing the filter selection is crucial to maximizing filter life and energy savings. Filter selection and optimization software allows facility operators to select filters based on scientific data. The result is verified savings in the hundreds of thousands of dollars per year on HVAC filters with little or no capital investment.
FACTORY VS. FIELD TESTING OF HEPA FILTERS Cleanroom HEPA filters utilized in the life sciences require the end user to specify key parameters to ensure the prop-er installation and performance of their cleanroom. These parameters include, but are not limited to the following:
1. The size, including length, width, and maximum height, and frame configuration to properly fit the installation
2. A minimum global efficiency or maximum global pen-etration level at a specified particle size and flow-rate
3. A maximum local leakage penetration4. A pressure drop target at a specified flow-rate5. The required operational volume flow-rate or filter face
velocity
The determination of the appropriate global filter efficiency specification is determined based on the final cleanroom cleanliness classification requirements. The traditional HEPA filter performance level specified within the Life Sci-ence industry has been:
• 99.99 efficiency vs. a mass median particle size of 0.3 µm (Type C per IEST-RP-CC001)
• 0.01% maximum local leakage penetration
The cleanroom HEPA filter, as installed, is typically required to meet a maximum leakage specification of 0.01%. This value is identical to the traditional filter factory leakage requirement. This has been cause for concern, as differ-ences in equipment calibration and particle size could result in a filter failure in-situ after already passing factory test. Although this is a concern, it has not been identified as a significant issue, as border-line leaks are not very common.
Two common causes of in-situ failure of HEPA filters, not including physical/handling damage, originate in a differ-
ence in factory and field testing criteria. These are:
• Filter face velocity differences• Test particle size differences
Any of these issues can result in the global filter penetra-tion exceeding the 0.01% specification. This results in in-situ leak test failure of the filter after passing the factory test. The resulting failure typically appears as if the entire filter is leaking. This is known as “Excessive Non-Site Spe-cific Penetration” (Bleed-Thru) and can be defined as: the measurement of background filter penetration exceeding the leakage specification during field certification.
Let’s look at these common issues in more detail.
FILTER FACE VELOCITY Filter manufacturers typically rate filters at a face velocity of 90-100 FPM in life science applications. The actual veloci-ties in-situ can be significantly higher. Unfortunately, end user specifications do not typically indicate the maximum application velocity that the filter design may be applied. It is not unheard of to see filter face velocities from 120-150 FPM and even as high as 180 FPM. This upward shift
A
B

www.camfil.com 6
Table B. EN 1822 classifications
Table C. ISO 29463 classifications
Filter Class(Group)
Particle Size for Testing
Global Values Local/Leak Values
Collection Efficiency (%)
Penetration (%)
Collection Efficiency (%)
Penetration (%)
Multiple of Global Efficiency (%)
ISO 15 E MPPS ≥ 95 ≤ 5 - - -
ISO 20 E MPPS ≥ 99 ≤ 1 - - -
ISO 25 E MPPS ≥ 99.5 ≤ 0.5 - - -
ISO 30 E MPPS ≥ 99.9 ≤ 0.1 - - -
ISO 35 E MPPS ≥ 99.95 ≤ 0.05 ≥ 99.75 ≤ 0.25 5
ISO 40 E MPPS ≥ 99.99 ≤ 0.01 ≥ 99.5 ≤ 0.5 5
ISO 45 E MPPS ≥ 99.995 ≤ 0.005 ≥ 99.975 ≤ 0.025 5
ISO 50 E MPPS ≥ 99.999 ≤ 0.001 ≥ 99.995 ≤ 0.005 5
ISO 55 E MPPS ≥ 99.9995 ≤ 0.0005 ≥ 99.9975 ≤ 0.0025 5
ISO 60 E MPPS ≥ 99.9999 ≤ 0.0001 ≥ 99.9995 ≤ 0.0005 5
ISO 65 E MPPS ≥ 99.99995 ≤ 0.00005 ≥ 99.99975 ≤ 0.00025 5
ISO 70 E MPPS ≥ 99.99999 ≤ 0.00001 ≥ 99.9999 ≤ 0.0001 10
ISO 75 E MPPS ≥ 99.999995 ≤ 0.000005 ≥ 99.9999 ≤ O.OOO1 20
ISO 29463-1:2011 establishes a classification of filters based on their performance, as determined in accordance with ISO 29463-3, ISO 29463-4 and ISO 29463-5. It also provides an overview of the test procedures, and specifies general requirements for assesing and making the filters, as well as for documenting the test results. It is intended for use in conjunction with ISO 29463-2, ISO 29463-3, ISO 29463-4 and ISO 29463-5.
Filter Class
Particle Sizefor Testing
Global Values Local/Leak Values
Collection Efficiency (%)
Penetration(%)
Collection Efficiency (%)
Penetration (%)
Multiple of Global Efficiency (%)
E10 ≥ 85 ≤ 15 - - -
E11 ≥ 95 ≤ 5 - - -
E12 ≥ 99.5 ≤ 0.5 - - -
H13 MPPSa ≥ 99.95 ≤ 0.05 ≥ 99.75 ≤ 0.25 5
H14 MPPSa ≥ 99.995 ≤ 0.005 ≥ 99.975 ≤ 0.025 5
U15 MPPSa ≥ 99.9995 ≤ 0.0005 ≥ 99.9975 ≤ 0.0025 5
U16 MPPSa ≥ 99.99995 ≤ 0.00005 ≥ 99.99975 ≤ 0.00025 5
U17 MPPSa ≥ 99.999995 ≤ 0.000005 ≥ 99.9999 ≤ 0.0001 20a MPPS = Most Penetrating Particle Size
This European standard is based on particle counting methods that actually cover most needs for different applications. EN 1822:2009 differs from its previous edition (EN: 1822; 1998) by including the following; an alternative method for leakage testing of Group H filters with shapes other than panels; an alternative test method for using a solid, instead of a liquid, test aerosol; a method for testing and classifying of filters made out of membrane-type medial and a method for testing and classifying filters made out of synthetic fiber media. The main difference is related to the classification for the filter classes H10 - H12, which has now been changes to E10 - E12.
in velocity has a dramatic negative impact on filter efficiency. Therefore, a filter that passes efficiency and leak testing at 100 fpm in the factory may fail in-situ leak testing at a higher ve-locity. Figure 4b below demonstrates this downward shift in efficiency, with increased velocity for a typical clean room HEPA filter.
TEST PARTICLE SIZE Historically, life science facilities typi-cally specified an IEST-RP-CC0011 “Type C” or performance indicative of a “Type C” filter. The “Type C” require-ments specify photometric efficiency testing using near mono-dispersed 0.3 micron diameter (mass median) ther-mal dioctly-phthalate (DOP) aerosol. Over the last 20 years, DOP testing has been discontinued in the field and by most filter manufactures due to potential health-related issues. It has been replaced with Poly Alpha Olefin (PAO). In this case, filter manufactur-ers are generating a polydispersed aerosol and using particle counters looking at 0.2-0.3 µm particles. In-situ, however, they are utilizing photom-eters. In Class A areas (fully filtered ceilings), field certifiers utilize portable thermal generators in order to achieve sufficient upstream concentrations. These generators produce an aero-sol in a size range at or very close to a typical cleanroom filter’s Most Penetrating Particle Size (MPPS). If a factory tested filter just meets the 99.99% @ 0.3 micron efficiency speci-fication and is then tested with thermal aerosol in the field, it will likely exhibit “Excessive Non-Site Specific Penetra-tion,” since the in-situ efficiency will be lower when tested at or near the filter’s MPPS. Figure 4a demonstrates this effect.
For those end users that utilize the tra-ditional HEPA filter specification identi-fied in the FDA sterile guide, the solu-tion is to properly specify the filter. This requires that the maximum velocity be specified for the particular filter design. The other option would be to have different filter models for high velocity
areas. This is typically frowned upon, as the end-user prefers to stock or specify one model. It also requires that the filters’ particle removal and leakage criteria be better specified. The end user will typically rely on using industry standards as a basis. The standards/practices utilized to specify cleanroom filters are IEST-RP-CC0011 (HEPA and ULPA Filters), EN-18223 (high efficiency air filters (EPA, HEPA and ULPA)) and newly published ISO 294634 (high efficiency filters and filter media for removing particles from air). Tables B to D show the filter classifications contained within each of these standards/practices.
www.camfil.com 7
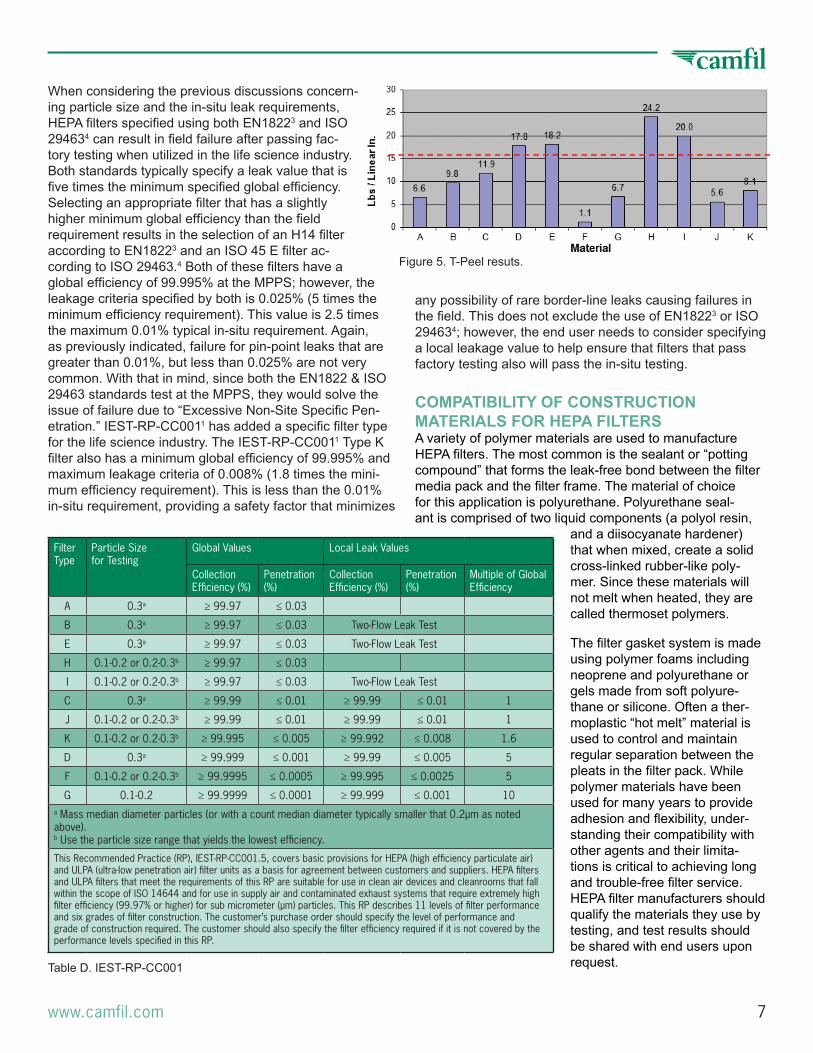
Figure 5. T-Peel resuts.
Filter Type
Particle Size for Testing
Global Values Local Leak Values
Collection Efficiency (%)
Penetration(%)
Collection Efficiency (%)
Penetration(%)
Multiple of Global Efficiency
A 0.3a ≥ 99.97 ≤ 0.03
B 0.3a ≥ 99.97 ≤ 0.03 Two-Flow Leak Test
E 0.3a ≥ 99.97 ≤ 0.03 Two-Flow Leak Test
H 0.1-0.2 or 0.2-0.3b ≥ 99.97 ≤ 0.03
I 0.1-0.2 or 0.2-0.3b ≥ 99.97 ≤ 0.03 Two-Flow Leak Test
C 0.3a ≥ 99.99 ≤ 0.01 ≥ 99.99 ≤ 0.01 1
J 0.1-0.2 or 0.2-0.3b ≥ 99.99 ≤ 0.01 ≥ 99.99 ≤ 0.01 1
K 0.1-0.2 or 0.2-0.3b ≥ 99.995 ≤ 0.005 ≥ 99.992 ≤ 0.008 1.6
D 0.3a ≥ 99.999 ≤ 0.001 ≥ 99.99 ≤ 0.005 5
F 0.1-0.2 or 0.2-0.3b ≥ 99.9995 ≤ 0.0005 ≥ 99.995 ≤ 0.0025 5
G 0.1-0.2 ≥ 99.9999 ≤ 0.0001 ≥ 99.999 ≤ 0.001 10a Mass median diameter particles (or with a count median diameter typically smaller that 0.2µm as noted above).b Use the particle size range that yields the lowest efficiency.
This Recommended Practice (RP), IEST-RP-CC001.5, covers basic provisions for HEPA (high efficiency particulate air) and ULPA (ultra-low penetration air) filter units as a basis for agreement between customers and suppliers. HEPA filters and ULPA filters that meet the requirements of this RP are suitable for use in clean air devices and cleanrooms that fall within the scope of ISO 14644 and for use in supply air and contaminated exhaust systems that require extremely high filter efficiency (99.97% or higher) for sub micrometer (µm) particles. This RP describes 11 levels of filter performance and six grades of filter construction. The customer’s purchase order should specify the level of performance and grade of construction required. The customer should also specify the filter efficiency required if it is not covered by the performance levels specified in this RP.
Table D. IEST-RP-CC001
When considering the previous discussions concern-ing particle size and the in-situ leak requirements, HEPA filters specified using both EN18223 and ISO 294634 can result in field failure after passing fac-tory testing when utilized in the life science industry. Both standards typically specify a leak value that is five times the minimum specified global efficiency. Selecting an appropriate filter that has a slightly higher minimum global efficiency than the field requirement results in the selection of an H14 filter according to EN18223 and an ISO 45 E filter ac-cording to ISO 29463.4 Both of these filters have a global efficiency of 99.995% at the MPPS; however, the leakage criteria specified by both is 0.025% (5 times the minimum efficiency requirement). This value is 2.5 times the maximum 0.01% typical in-situ requirement. Again, as previously indicated, failure for pin-point leaks that are greater than 0.01%, but less than 0.025% are not very common. With that in mind, since both the EN1822 & ISO 29463 standards test at the MPPS, they would solve the issue of failure due to “Excessive Non-Site Specific Pen-etration.” IEST-RP-CC0011 has added a specific filter type for the life science industry. The IEST-RP-CC0011 Type K filter also has a minimum global efficiency of 99.995% and maximum leakage criteria of 0.008% (1.8 times the mini-mum efficiency requirement). This is less than the 0.01% in-situ requirement, providing a safety factor that minimizes
any possibility of rare border-line leaks causing failures in the field. This does not exclude the use of EN18223 or ISO 294634; however, the end user needs to consider specifying a local leakage value to help ensure that filters that pass factory testing also will pass the in-situ testing.
COMPATIBILITY OF CONSTRUCTION MATERIALS FOR HEPA FILTERS A variety of polymer materials are used to manufacture HEPA filters. The most common is the sealant or “potting compound” that forms the leak-free bond between the filter media pack and the filter frame. The material of choice for this application is polyurethane. Polyurethane seal-ant is comprised of two liquid components (a polyol resin,
and a diisocyanate hardener) that when mixed, create a solid cross-linked rubber-like poly-mer. Since these materials will not melt when heated, they are called thermoset polymers.
The filter gasket system is made using polymer foams including neoprene and polyurethane or gels made from soft polyure-thane or silicone. Often a ther-moplastic “hot melt” material is used to control and maintain regular separation between the pleats in the filter pack. While polymer materials have been used for many years to provide adhesion and flexibility, under-standing their compatibility with other agents and their limita-tions is critical to achieving long and trouble-free filter service. HEPA filter manufacturers should qualify the materials they use by testing, and test results should be shared with end users upon request.
www.camfil.com 8
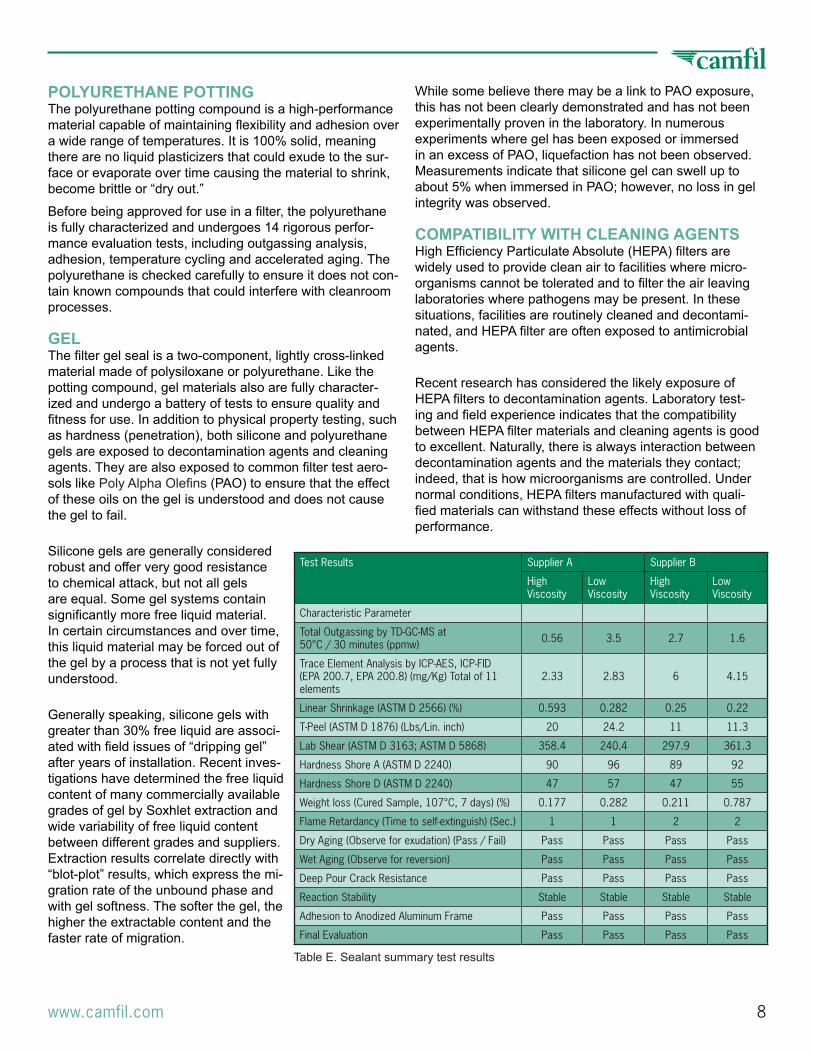
Test Results Supplier A Supplier B
High Viscosity
Low Viscosity
High Viscosity
Low Viscosity
Characteristic Parameter
Total Outgassing by TD-GC-MS at50°C / 30 minutes (ppmw) 0.56 3.5 2.7 1.6
Trace Element Analysis by ICP-AES, ICP-FID (EPA 200.7, EPA 200.8) (mg/Kg) Total of 11 elements
2.33 2.83 6 4.15
Linear Shrinkage (ASTM D 2566) (%) 0.593 0.282 0.25 0.22
T-Peel (ASTM D 1876) (Lbs/Lin. inch) 20 24.2 11 11.3
Lab Shear (ASTM D 3163; ASTM D 5868) 358.4 240.4 297.9 361.3
Hardness Shore A (ASTM D 2240) 90 96 89 92
Hardness Shore D (ASTM D 2240) 47 57 47 55
Weight loss (Cured Sample, 107°C, 7 days) (%) 0.177 0.282 0.211 0.787
Flame Retardancy (Time to self-extinguish) (Sec.) 1 1 2 2
Dry Aging (Observe for exudation) (Pass / Fail) Pass Pass Pass Pass
Wet Aging (Observe for reversion) Pass Pass Pass Pass
Deep Pour Crack Resistance Pass Pass Pass Pass
Reaction Stability Stable Stable Stable Stable
Adhesion to Anodized Aluminum Frame Pass Pass Pass Pass
Final Evaluation Pass Pass Pass Pass
Table E. Sealant summary test results
POLYURETHANE POTTING The polyurethane potting compound is a high-performance material capable of maintaining flexibility and adhesion over a wide range of temperatures. It is 100% solid, meaning there are no liquid plasticizers that could exude to the sur-face or evaporate over time causing the material to shrink, become brittle or “dry out.”
Before being approved for use in a filter, the polyurethane is fully characterized and undergoes 14 rigorous perfor-mance evaluation tests, including outgassing analysis, adhesion, temperature cycling and accelerated aging. The polyurethane is checked carefully to ensure it does not con-tain known compounds that could interfere with cleanroom processes.
GEL The filter gel seal is a two-component, lightly cross-linked material made of polysiloxane or polyurethane. Like the potting compound, gel materials also are fully character-ized and undergo a battery of tests to ensure quality and fitness for use. In addition to physical property testing, such as hardness (penetration), both silicone and polyurethane gels are exposed to decontamination agents and cleaning agents. They are also exposed to common filter test aero-sols like Poly Alpha Olefins (PAO) to ensure that the effect of these oils on the gel is understood and does not cause the gel to fail.
Silicone gels are generally considered robust and offer very good resistance to chemical attack, but not all gels are equal. Some gel systems contain significantly more free liquid material. In certain circumstances and over time, this liquid material may be forced out of the gel by a process that is not yet fully understood.
Generally speaking, silicone gels with greater than 30% free liquid are associ-ated with field issues of “dripping gel” after years of installation. Recent inves-tigations have determined the free liquid content of many commercially available grades of gel by Soxhlet extraction and wide variability of free liquid content between different grades and suppliers. Extraction results correlate directly with “blot-plot” results, which express the mi-gration rate of the unbound phase and with gel softness. The softer the gel, the higher the extractable content and the faster rate of migration.
While some believe there may be a link to PAO exposure, this has not been clearly demonstrated and has not been experimentally proven in the laboratory. In numerous experiments where gel has been exposed or immersed in an excess of PAO, liquefaction has not been observed. Measurements indicate that silicone gel can swell up to about 5% when immersed in PAO; however, no loss in gel integrity was observed.
COMPATIBILITY WITH CLEANING AGENTS High Efficiency Particulate Absolute (HEPA) filters are widely used to provide clean air to facilities where micro-organisms cannot be tolerated and to filter the air leaving laboratories where pathogens may be present. In these situations, facilities are routinely cleaned and decontami-nated, and HEPA filter are often exposed to antimicrobial agents.
Recent research has considered the likely exposure of HEPA filters to decontamination agents. Laboratory test-ing and field experience indicates that the compatibility between HEPA filter materials and cleaning agents is good to excellent. Naturally, there is always interaction between decontamination agents and the materials they contact; indeed, that is how microorganisms are controlled. Under normal conditions, HEPA filters manufactured with quali-fied materials can withstand these effects without loss of performance.

www.camfil.com 9
In a recent year-long study where silicone gels were exposed to concentrated vapors generated by a variety of cleaning agents, the results indicated that these agents did not cause failure or “liquefaction” of silicone gel materials tested. The tests were conducted at elevated temperature to promote accelerated aging. Silicone gel was exposed to common antimicrobial cleaning agents, including one containing quaternary ammonium compounds, one contain-ing sodium hypochlorite (bleach), and a third containing a blend of hydrogen peroxide and per acetic acid. There was no observed failure of the gel as defined by the formation of a liquid or oily substance on the surface; however, in cases following significant exposure, the blue pigment present in the gel sometimes faded and the gel became lighter in color or clear.
Exposure of silicone gel to very strong acids (like concen-trated hydrochloric acid solution) or bases (like concen-trated sodium hydroxide solution) should be avoided since these are strong enough to attack the partially ionic Si-O bonds in the polymer backbone.
Polyurethane gels are slightly less resistant to oxidative at-tack than silicone gels; however, polyurethane gels perform well to seal filter modules in clea room applications, and
there may be other reasons to choose a polyure-thane gel over a silicone gel.
Where silicone materials must be avoided due to their potential effect on a process or product downstream, polyurethane gels are often speci-fied. A classic example is microelectronics clean-rooms, where trace molecular contamination by silicone can interfere with wafer etching processes and final product quality. Sometimes, polyurethane gel is selected because it is slightly less expen-sive. Prior experience with a silicone gel issue or process incompatibility may also persuade the user to select polyurethane gel. Polyurethane gel
contains substantially more unbound liquid component in the form of plasticizer than silicone gel. Over a period of several years, a small amount of the plasticizer may evaporate from the gel surface, causing the formation of a light “skin.” Some cutting of the gel by the knife edge and some micro-cracks form normally on the surface of the gel adjacent to the knife edge due to the tensile forces present.
Although the initial assumption upon removal of a filter that has been installed for some time is that there is a problem with the gel, in reality these phenomena are normal. Since these small cracks do not threaten to extend down to or completely around the tip of the knife edge, bypass of air around the filter media pack is prevented. However, it is best not to re-install a gel seal filter that shows extensive skinning or splits unless the gel is removed and replaced. Often the most cost-effective solution is to simply replace an old filter with a new one. The expected life time of a gel filter that has been removed is about five years. When undisturbed, gel filters often provide leak-free service well beyond five years.
COMPATIBILITY WITH SPACE DECONTAMI-NATION AGENTS In addition to cleaning agents, HEPA filter materials, includ-
ing silicone gel, were exposed to com-mon space decontamination agents, including formaldehyde, hydrogen per-oxide vapor, and chlorine dioxide. The exposure routines simulated what would be expected during normal decontami-nation procedures during the 10 year service life of the filter.
Laboratory testing and field experience both indicate that when qualified materi-als are used to construct HEPA filters, they provide good to excellent chemical compatibility with formaldehyde, hy-drogen peroxide, and chlorine dioxide when used for typical decontamination processes.
Figure 6. Liquid content of gel
Figure 7. Gel plot blot at 30°C

www.camfil.com 10
HEPA filters show excellent chemical compatibility with hydrogen peroxide under typical decontamina-tion cycles. It is known that, over time, hydrogen peroxide adsorbs onto exposed surfaces; during aeration (or ventilation) it desorbs over time. Labo-ratory testing and field monitoring indicate that the presence of a HEPA filter in a system may delay the attainment of peak concentration levels downstream of the HEPA filter, due to the enormous surface area of the filtration media.
The HEPA filter also will capture droplets of aerosol in the air steam, if present. Hydrogen peroxide in the vapor phase will pass through the HEPA filter, and downstream concentrations will rise accordingly, approaching levels similar to upstream concentration levels once adsorption has occurred. After exposure, during the aeration phase, the opposite effect is observed. Down-stream hydrogen peroxide levels will momentarily peak at the start of aeration due to rapid desorption from the filter media. Reduction in downstream concentration levels will initially lag that of the upstream level.
The overall aeration time may or may not be extended due to the presence of the HEPA filter, depending upon the type and area of other surfaces present in the system. Studies have shown that the use of expanded Polytetrafluoroethyl-ene (PTFE) membrane filter media offered no advantages in terms of more rapid aeration compared to micro-fiber-glass filter media when the aeration endpoint was <1 ppm H2O2. More rapid aeration can be achieved by using warm dry air for aeration.
HEPA filters also exhibited good com-patibility with the chlorine dioxide pro-cess used for decontamination. It is rec-ommended that welded stainless steel filter housings be treated by pickling prior to exposure to chlorine dioxide. HEPA filter potting compound made of polyurethane will show a characteristic yellowing following exposure to chlorine dioxide; however tests indicate no mea-surable change to the bulk properties and no loss in performance of the ex-posed polyurethane. Fraction negative decontamination studies using biologi-cal indicators inoculated with 106 spores of a target organism demonstrate the effectiveness of all three agents in de-contamination of HEPA filters.
MEMBRANE HEPA FILTERS IN THE LIFE SCIENCE INDUSTRY In recent years, there has been a push by some media and filter manufacturers to promote PTFE media technology to the life science industry. The application of this technol-ogy has been difficult due to its limited loading capacity. Although air supplied to these final filters is typically very clean, annual/biannual testing can substantially increase the pressure drop of these filters. Figure 9 below demon-strates the substantial difference in loading characteristic between traditional micro-glass media and PTFE media filters. Both filters were loading with Laskin nozzle gener-ated PAO aerosol.
As you can see in Figure 9, even though the initial pres-sure drop of the e-PTFE filter is lower than the micro-glass
Figure 8. H2O2 desorption chart.
Figure 9. PTFE vs glass grades loading curves.

www.camfil.com 11
media filter, the rate of increase in pressure drop per unit mass of PAO loaded is substantially higher for the e-PTFE media.8
Over the last two years, there has been an attempt to implement e-PTFE filters in the life science industry. The basis of this implementation was testing these filters with very low concentrations of PAO aerosol along with the utilization of a discrete particle counter. This equates to a concentration < 0.1 µg/l as compared to > 10 µg/l when us-ing a photometer.3
The microelectronics industry has tested PTFE filters with low concentration aerosol for over a decade. In this case, the aerosol used is microspheres (PSL microspheres) and the technology to generate this aerosol is well-established. The technology to generate ultra-low concentrations of PAO aerosol is not. This is evident based on the issues experienced.3 In addition, in-situ testing of HEPA filters with discrete particle counters adds a substantial level of com-plexity compared to a photometer and PAO.
The “pros” are lower pressure drop and extreme durability. The “cons” are a cost approximately twice that of micro-glass fiber media (so even with lower pressure drop, the TCO is questionable), acceptable test methods, stable uniformity and airflow distribution, and readily available equipment to field test as outlined above. These obstacles, along with a reliable source of supply, remain a concern.
In summary, e-PTFE or membrane HEPA and ULPA filters have been manufactured since the 1990s. The industry needs to keep an open mind to applying this type of prod-uct. As technology continues to advance, discrete particle counter operation more closely simulates a photometer’s operation, and reliable ultra-low concentration PAO aerosol generation equipment becomes available, e-PTFE media filters may have a place for specific applications within the life science industry.
CONCLUSION There is a science to manufacturing, testing, supplying, and selecting air filters. Just like in the life science industry, raw material safety, material compatibility, longevity, reliability, consistency, and now more than ever, sustainability are absolute requirements if companies want to compete in this arena. Filters should be selected based on TCO for all applications, and buyers should ensure that air filter suppli-ers have the support, depth of knowledge, and experience necessary to deliver product consistently on a global basis.
REFERENCES
1. Institute of Environmental Sciences and Technol-ogy (IEST): IEST-RP-CC001, “HEPA and ULPA Filters.”
2. EUROVENT: “Recommendation Concerning Calcu-lating of Life Cycle Cost for Air Filters.” Paris, 1999.
3. European Committee for Standardization (CEN): EN-1822, “High efficiency air filters (EPA, HEPA and ULPA).”
4. International Standardization Organization (ISO): ISO 29463, “High-efficiency filters and filter media for removing particles from air.”
5. ASHRAE: “ANSI/ASHRAE Standard 52.2-2007B: Method of Testing General Ventilation Air-Cleaning Devices for Removal Efficiency by Particle Size,” ASHRAE, Atlanta, 2008.
6. CEN: EN-779: 2012 E, “Particulate Air Filters for General Ventilation, Determination of the Filtration Performance,” CEN, Brussels, Belgium, 2012.
7. SINTEF: “Long-term Tests of Filters in a Real Envi-ronment,” SINTEF Refrigeration and Air Condition-ing, STF11 A95052, Trondheim, Norway, 1995.
8. “The Effect of PAO Aerosol Challenge on the Dif-ferential Pressure of a PTFE media ULPA (Experi-mental) Filter,” IEST Journal.
©Copyright ISPE 2013First published in Pharmaceutical Engineering, January/February 2013, VOL 23, NO 1www.pharmaceuticalengineering.org

www.camfil.com 12
ABOUT THE AUTHORS
Steve Devine is the Vice President of Research and Development at Camfil Farr USA. He has more than 27 years of experience in material processing and filtration with core competencies polymer chemistry and filter applications. An industry expert in gels and adhesives, Devine is a
published author of Understanding HEPA Filter Gel Seal Materials. Additionally, he holds patents including “Method and apparatus for decontamination of tubing,” “Method and apparatus for V-bank filter bed scanning” and numer-ous patents pertaining to filter assembly and fabrication.
Sean O’Reilly is the Global Director Clean room and Life Sciences Seg-ment at Camfil Farr. 2013 will mark O’Reilly’s 30 year association with Camfil. He has global sales experi-ence having worked in EU, Asia, and the USA specializing in the cleanroom field of applications. He is both an
accomplished public speaker and published author of multiple industry papers and articles. O’Reilly is the holder of a number of patents for products in the microelectron-ics and pharmaceutical fields; he most recently led the design and development of CREO, a software program to optimize energy conservation for the cleanroom industry. He can be contacted by email: [email protected].
Andy Stillo is the HPP Research and Development Manager at Camfil Farr USA. Stillo has more than 20 years of experience in filtration with an emphasis in High Performance Products (HPP). Considered an in-dustry expert, he participates in sev-eral HEPA/ULPA standards writing
committees including ASME, IEST, and ISO. He is both published and has presented at filtration related confer-ences including IEST ESTECH conferences, Clean rooms West, and The Harvard School of Public Health “Filter In-Place Testing Workshop.”
Don Thornburg is the HVAC Re-search and Development Manager of Camfil Farr USA. He has more than 26 years of engineering experience designing HVAC systems and filtra-tion solutions. Thornburg is recog-nized for his diligence and dedication in leading multiple ASHRAE and ISO
standardization efforts to improve the quality of air filtra-tion for industry users. He is a published author of multiple papers/presentations on industry topics related to filter testing, IAQ control, life cycle costing, energy usage, and field testing data.
YEARSOF CLEAN AIR SOLUTIONS