a self-study guide for identifying and … · a self-study guide for identifying and implementing...
TRANSCRIPT

A SELF-STUDY GUIDE FOR IDENTIFYING AND IMPLEMENTING EVIDENCE-BASED PRACTICES FOR SCHOOL TURNAROUND/
IMPROVEMENT FOR STATE EDUCATION AGENCIES
Laurie LeeJohn HughesKevin Smith
Barbara Foorman
FLORIDA CENTER FOR READING RESEARCH, FLORIDA STATE UNIVERSITY
DRAFT
i
Acknowledgments
Funding Foundations:William T. Grant Foundation
Overdeck Family Foundation
Annie E. Casey Foundation
Thanks to:Florida Department of Education:
Sandra Dilger Holly Edenfield Jason Graham
Shannon Houston Eileen McDaniel
Sonya Morris Melissa Ramsey Michael Stowell
South Carolina Department of Education:
Jennifer Morrison Roy Stehle
Mississippi Department of Education:
Kim Benton Robin Lemonis Nathan Oakley
Sonja Robertson Tennette SmithDRAFT

ii
Table of ContentsIntroduction ..........................................................................................................................................................1
Purpose of the self-study guide ........................................................................................................................................1
Background ..............................................................................................................................................................................1
The Self-Study Process ........................................................................................................................................2
Context for Use of the Self-Study Guide ..........................................................................................................3
SEA Self-Study Guide Components ..................................................................................................................4
SEA Self-Study Guide Checklist .........................................................................................................................4
SEA Facilitator’s Checklist ....................................................................................................................................................4
SEA Team Member’s Checklist ...........................................................................................................................................4
SEA Scoring Template ...........................................................................................................................................................4
SEA Scoring Guide .................................................................................................................................................................5
SEA Voting and Consensus Rating Form ........................................................................................................................5
SEA Planning Form ................................................................................................................................................................5
Preparing for Self-Study ......................................................................................................................................7
Reviewing Research ...........................................................................................................................................................8
Evaluating Research ..........................................................................................................................................................8
Follow up, Monitoring, and Evaluation ......................................................................................................... 14
SEA Self-Study Guide Checklist ...................................................................................................................... 15
SEA Facilitator’s Checklist ................................................................................................................................ 19
SEA Team Member’s Checklist ......................................................................................................................... 21
SEA Scoring Template ....................................................................................................................................... 23
SEA Scoring Guide ............................................................................................................................................. 24
Area 1: Implementing Systemic Change ..................................................................................................................... 24
Area 2: Establishing Strong Leadership ....................................................................................................................... 28
Area 3: Improving Academic Instruction and Intervention ................................................................................. 32
Area 4: Developing and Retaining a High-Quality Staff ........................................................................................ 36
Area 5: Creating a Positive School Climate and Culture ........................................................................................ 40
SEA Voting and Consensus Rating Form ....................................................................................................... 43
SEA Planning Form ............................................................................................................................................ 46
Appendix A. Annotated Bibliography ........................................................................................................... 47
Scoring Guide Area 1: Implementing Systemic Change ....................................................................................... 47
Scoring Guide Area 2: Establishing Strong Leadership ......................................................................................... 49
Scoring Guide Area 3: Improving Academic Instruction and Intervention .................................................... 51
Scoring Guide Area 4: Developing and Retaining a High-Quality Staff ........................................................... 54
Scoring Guide Area 5: Creating a Positive School Climate and Culture ........................................................... 57
References........................................................................................................................................................... 58
DRAFT

1
Introduction Purpose of the self-study guideThis Self-Study Guide for Identifying and Implementing Evidence-Based Practices for School Turn-around/Improvement is intended to help State Education Agencies (SEAs) carefully consider the evi-dence supporting the turnaround strategies and intervention options to be include in the state plan for the Every Student Succeeds Act (ESSA). The purpose of the guide is to help (SEAs):
1. Evaluate the evidence base for turnaround strategies and interventions as they identify those to be included in the state plan for ESSA as options for schools in need of comprehensive or target-ed support.
2. Determine the strategies and interventions that have the strongest evidence and have yielded positive results in their states in the past.
3. Provide resources for Local Education Agencies (LEAs) to help them choose the best evi-dence-based option(s) for schools in need of comprehensive or targeted support to include in school improvement plans.
4. Evaluate the school improvement plans submitted for schools in need of comprehensive or tar-geted support.
5. Collect data regarding the implementation of evidence-based strategies, activities, and inter-ventions in schools in need of comprehensive or targeted support and provide feedback to LEAs and/or schools.
BackgroundSEAs and LEAs will soon be charged with the task of implementing ESSA, with states being asked to identify evidence-based strategies and interventions they will use to support LEAs with schools in need of significant improvement. In the past, school improvement strategies/interventions were very prescriptive, but ESSA provides states with the flexibility to delineate strategies/interventions that are allowable provided they are evidence-based.
ESSA requires that SEAs identify schools in need of comprehensive support and targeted support. Schools identified in need of comprehensive support include schools in the lowest-performing five percent of all Title I schools in the state, schools that graduate less than two-thirds of their students, and schools that contain a subgroup that is performing at a level equal to student performance at the lowest five percent of schools in the state and do not show progress in student achievement under a targeted support and improvement plan.
Schools in need of targeted support have at least one subgroup of students consistently underper-forming. SEAs must notify LEAs of any school the LEA serves that meets this criteria. These schools must, in partnership with stakeholders (including principals and other school leaders, teachers, and parents), develop and implement a school-level comprehensive or targeted support and improvement plan. The plans must include evidence-based interventions.
The LEAs must review and approve targeted support plans, and SEAs and LEAs must review and approve comprehensive support plans. LEAs must conduct a needs assessment for schools identified in need of comprehensive support. The evidence-based interventions selected for implementation should meet the needs of the school.
DRAFT

2
The Self-Study ProcessThe self-study process is designed to assist SEAs in using available evidence to identify turnaround strategies and interventions to include in their state plan for ESSA. The process may include school improvement specialists, content area specialists, exceptional student education (ESE) and English lan-guage learner (ELL) specialists, as well as those involved in professional development and leadership at the SEA knowledgeable in school improvement. This self-study guide includes a blank template for SEAs to use in identifying potential strategies/interventions and reviewing their evidence base. It also provides predetermined focus areas and specific strategies/interventions, a summary of research, the level of the evidence base as determined by ESSA, suggested sources of locally identified information, and guiding questions to collect, share, and discuss data. Engaging in self-study may help SEAs select the strongest evidence-based strategies and intervention options for inclusion in the state ESSA plan. Figure 1 outlines the general steps in conducting the self-study.
Figure 1. The Self-Study Process: Conducting the Self-Study
Present Overview& Review Guide Facilitator explains process to team Team reviews guide and asks questions
before proceeding to ratings
IndividualRating
Team reviews relevant data and sourcesof evidence to help determine ratings
Team independently rates strategiessubmitted by team members and those
provided in the SEA Scoring Guide
ReviewResearch
Team members identify an evidence-basedstrategy/intervention and complete
SEA Scoring Template
Facilitator distributes completedSEA Scoring Templates to team
ConsensusRating Facilitator guides the consensus rating process Record recommendation of strategy/
intervention as agreed upon by the team
DocumentingNext Steps
Team identi�es 2-3 areas where support/resources for LEAs should be developed
Complete a detailed plan for next stepsbased on urgency, feasibility
Step 1: Preparation
Step 2: Discussion
Step 3: Planning
Step 1 is preparation. During this step the facilitator will describe the process to the team and ensure that everyone has the same understanding of the process. Each team member will review the section of the self-study guide addressing reviewing research and the ESSA Levels of Evidence, identify one or more potential strategies and interventions, and evaluate the level of evidence for them. These strategies and interventions may fall into the areas that have been identified in the SEA Scoring Guide, or they may fall into an entirely different category altogether. This is a critical activity since this guide
DRAFT

3
is unable to address all of the potential strategies and interventions a state might consider, and more ideas for consideration will improve the results of the discussion step. In addition, the team members will complete the SEA Scoring Guide, considering the strategies and interventions provided, and upon reflecting upon whether or not they should be recommended for use in LEAs and schools.
During Step 2 team members discuss all of the various ideas for interventions that the SEA might permit, and the individual ratings that team members assigned on the SEA Scoring Template and the SEA Scoring Guide. It is during this step that the SEA will settle on the options that LEAs will be autho-rized to use if the state is providing a list of strategies and interventions from which LEAs must choose.Having a broad range of strategies and interventions is important, but it is equally important that they be based on the best available evidence. In addition, it is critical that strategies and interventions meet the needs that have been identified in the state.
During the final step, the SEA team members discuss priorities, potential resource development, and anticipated challenges in implementation of the strategies or interventions. Next steps may be de-termined with a timeline established and team members assigned to tasks. The facilitator leads the discussion and information is recorded on the SEA Planning Form.
Context for Use of the Self-Study GuideGuidance released by the U.S. Department of Education on September 16, 2016 and available at http://www2.ed.gov/policy/elsec/leg/essa/guidanceuseseinvestment.pdf provides a series of steps that can promote continuous improvement and support better outcomes for students. These steps include:
1. Identifying Local Needs
2. Selecting Relevant, Evidence-Based Interventions
3. Planning for Implementation
4. Implementing
5. Examining and Reflecting
The use of the self-study guide will be most helpful in addressing steps two and three above, and the guide may be revisited in step five to assist in the examining and reflecting process.
It is important that SEAs select evidence-based strategies and interventions (step two) that best meet the needs identified by the LEAs in their states. While the level of evidence should be as strong as possible, it is just as important that the strategies and interventions meet the needs identified in step one. In addition, the guidance encourages SEAs and LEAs to look at the overall body of relevant evidence rather than just one study when selecting strategies and interventions. Finally, the evidence base should reflect a preponderance of statistically significant, positive effects rather than statistically significant, negative effects.
The guiding questions included in the self-study guide may help team participants consider whether a strategy or intervention is appropriate and to begin planning for implementation (step three). The questions may provoke thinking about resources available as well as technical assistance and support that SEAs may need to offer to LEAs for successful implementation.
Finally, the self-study guide may be revisited in the future to evaluate whether or not implementation has been successful (step five) or if other strategies and interventions need to be considered for use in the state.
DRAFT

4
SEA Self-Study Guide ComponentsThe Self-Study Guide for Identifying and Implementing Evidence-Based Practices for School Turn-around/Improvement for State Education Agencies consists of seven parts: SEA Self-Study Guide Check-list, Facilitator’s Checklist, SEA Team Member’s Checklist, SEA Scoring Template, SEA Scoring Guide, and SEA Voting and Consensus Rating Form, and an SEA Planning Form. These are described below.
SEA Self-Study Guide ChecklistThis checklist delineates in chronological order the steps of the self-study process for facilitators and team members. The tool assists those involved in the self-study to ensure that all tasks are completed.
SEA Facilitator’s ChecklistThis checklist delineates the responsibilities of the facilitator throughout the self-study process includ-ing preparation, discussion, and planning for next steps. This tool assists facilitators in ensuring that all tasks are completed.
SEA Team Member’s Checklist This checklist delineates the responsibilities of the team member throughout the self-study process including preparation, discussion, and planning for next steps. This tool assists team members in en-suring that all tasks are completed.
SEA Scoring TemplateThis blank template includes fields to enter the following information:
• an overall area pertaining to the strategy or intervention which could be an area identified in the SEA Scoring Guide, or another area altogether,
• the specific strategy or intervention identified by research to be considered,
• the evidence level confirmed by research studies,
• a summary of the research,
• additional information identified locally that needs to be considered, and
• guiding questions that will facilitate a discussion among team members. Guiding questions may include any number of factors. Some common ones to consider include:
· the level of satisfaction among the group with the evidence-level of the strategy/intervention,
· the extent to which the strategy/intervention was conducted on a student population that is relevant to the state or district context,
· the types of schools where the strategy/intervention might work best, and
· the possible cost/benefit ratio of implementation.
A rating scale is also part of the template so that, after careful consideration, self-study team members can determine whether they (1) do not recommend, (2) recommend, or (3) strongly recommend a strategy or intervention.
DRAFT

5
SEA Scoring GuideThe SEA Scoring Guide includes already identified evidence-based strategies and interventions, along with a summary of the research base, the ESSA evidence-base level, state-level information that may be helpful to consider, and guiding questions for discussion. The content of the SEA Scoring Guide is organized into five areas: implementing systemic change; establishing strong leadership; improving academic instruction and intervention; developing and retaining a high-quality staff; and creating a positive school climate and culture. As the facilitator and self-study team members review the informa-tion in the scoring guide, work through the rating system individually, and then engage in discussion, they thoughtfully consider whether or not to recommend a strategy or intervention for their state. The strategies/interventions recommended may become a menu from which LEAs may choose based on the needs of the school. It may be that an LEA needs to select several strategies and interventions to use in tandem to elicit improvement. Also, team members should strongly consider what has already been done in the state, and the effectiveness of current strategies and interventions. It may be that an evidence-level may be strong for a strategy or intervention, but the state has not experienced much success in using that specific approach. Perhaps some strategies or interventions should replace others based on that experience. An annotated bibliography of the research supporting each scoring guide area is provided in Appendix A. Box 1 describes how to use the SEA Scoring Guide.
SEA Voting and Consensus Rating FormAfter the SEA Scoring Guide is completed, the facilitator guides the self-study team through a con-sensus rating process. The team uses the SEA Voting and Consensus Rating Form to reach agreement on whether the proposed strategy or intervention should be recommended as an option for schools requiring comprehensive or targeted support in the ESSA state plan. The most important part of this process is the discussion that goes into consensus rating. The scores on the SEA Voting and Consensus Rating Form should reflect this facilitated discussion. Box 1 lists the steps for completing the SEA Voting and Consensus Rating Form.
SEA Planning FormThis form is used to establish priorities, ideas regarding resource development for LEAs, and any an-ticipated challenges. The facilitator leads the discussion centered on these topics and uses the form to record ideas. Box 1 explains how to use the SEA Planning Form.DRAFT

6
Box 1. Steps to complete the SEA Scoring Template, SEA Scoring Guide, SEA Voting and Consensus Rating Form, and SEA Planning Form
1. Before the Consensus Meeting, team members review the self-study guide section addressing the review of research and the ESSA Levels of Evidence. Each team member then identifies one or more strategies or interventions, determines the strength of the associated evidence base, and records this information on the SEA Scoring Template. Any additional locally determined informa-tion that might be helpful for consideration is also entered. Guiding questions may be formulated to aid the team in discussing the strategy or intervention. Citations should be entered on the SEA Scoring Template as well.
2. Before the Consensus Meeting, the facilitator distributes completed SEA Scoring Templates and each team member reviews these strategies and rates them according to the scale on the tem-plate. In addition, the team members review the SEA Scoring Guide for each area as well as any information provided by the facilitator, and individually determines whether they recommend the strategy/intervention for use in the state. The guiding questions provided in the guide may help team members make their decisions.
3. Team members bring to the Consensus Meeting their completed SEA Scoring Guide along with the completed SEA Scoring Templates.
4. The team votes to reach consensus. There are several steps to consensus voting:
a. Vote. Ask each team member to provide a numerical ranking (1–3) for each of the areas.
b. Identify frequency. Identify the most frequent number (if three team members vote 3, five vote 2, and two vote 1, the most frequent number that team members voted is 2).
c. Discuss the rationale of the high frequency number. Ask a team member who selected the high frequency number to talk about what motivated that vote.
d. Discuss the rationale of lower frequency numbers. Ask other team members to talk about why they voted in a particular way.
e. Vote. Use numeric voting a second time. Team members may change their votes based on the discussion.
f. Record rating. If there is consensus (typically determined by majority vote), record the high fre-quency number on the SEA Consensus Rating Form. If consensus is not reached (there is no high frequency number), continue discussing and voting until consensus is reached.
g. Continue across all areas. Repeat this process for each area.
5. Discuss and record any team thoughts, comments, or concerns on the SEA Voting and Consensus Rating Form.
6. Discuss priorities, resource development for LEAs, and challenges that may be anticipated. The facilitator utilizes the SEA Planning Form to record information from the discussion, establish time-lines for next steps, and delineate any responsibilities for team members.
DRAFT
7
Preparing for Self-StudyThere are several important steps that need to be taken in preparation for the self-study process.
1. Recruit members for the self-study team and schedule times to meet.
2. Select a dedicated and knowledgeable facilitator such as the school improvement director or ESSA state plan project manager.
3. Read through the section on reviewing research.
4. Review the research literature to identify practices for consideration in the ESSA plan.
The team should be comprised of a wide range of individuals so as to include as much knowledge and as many skills as possible. Members typically include researchers, content area specialists, exceptional student education (ESE) and English language learner (ELL) specialists, those involved with profession-al development, and senior leadership at the SEA. The names of team members and facilitator may be recorded on the SEA Voting and Consensus Rating Form.
Once the team is established, the following steps should be followed:
1. The facilitator studies the materials provided to conduct the self-study process so that he/she can effectively guide team members through the process. The facilitator gathers all pertinent data and evidence pertaining to the strategies and interventions.
2. The facilitator distributes a blank SEA Scoring Template, the SEA Scoring Guide, Appendix A, as well as any other relevant data or evidence to each team member, and provides a timeline for team members to review the materials.
3. The facilitator schedules a short meeting after team members have reviewed the documents to discuss any questions.
4. The facilitator asks each member to re-read the section of the self-study guide addressing the review of research and the ESSA Levels of Evidence, and then research an area pertinent to school improvement in order to identify a specific evidence-based strategy/intervention for consid-eration by the team during the self-study process, and to complete the SEA Scoring Template. Research areas could include those addressed in this guide: implementing systemic change, establishing strong leadership, improving academic instruction and intervention, developing and retaining high-quality staff, and creating a positive school climate and culture. Alternatively, research could include other areas selected by the team member or SEA.
5. The facilitator establishes a deadline for completion and submission of the SEA Scoring Templates and communicates that to the team.
6. Each team member re-reads the section of the self-study guide addressing the review of research and the ESSA Levels of Evidence, reviews research, completes the SEA Scoring Template using the SEA Scoring Guide as an example, and sends the completed template electronically to the facilita-tor by the established deadline.
7. The facilitator distributes the completed templates to all team members and instructs members to rate these strategies and interventions according to the scale on the template and to complete the SEA Scoring Guide.
DRAFT

8
8. The facilitator informs team members of the timeline for their review and schedules a consensus meeting.
9. Team members review the completed SEA Scoring Templates they received from the facilitator. They use the SEA Scoring Guide to individually reflect their thoughts regarding the recommenda-tion of a strategy or intervention after reviewing the summary of research and any data or evi-dence provided by the facilitator. A team member who does not know how to rate a specific area may abstain from rating it.
Reviewing ResearchTo review the research necessary to identify evidence-based strategies and interventions, team mem-bers should search professional educational journals and websites of reputable organizations. Some databases and websites to consider include:
• ERIC: http://www.eric.ed.gov/
• JSTOR: http://www.jstor.org/action/showAdvancedSearch
• Google Scholar: www.google.com/scholar
• Institute of Education Sciences (IES) Resources: http://ies.ed.gov
• What Works Clearinghouse: http://ies.ed.gov/ncee/wwc/
The search process begins by identifying relevant keywords. The search should not focus on just a few search terms, such as “school turnaround” but should be broad so as to capture as many relevant stud-ies as possible. Examples of keywords include:
School turnaround Focus school Reading Intervention
School improvement Effective schools Professional development
Low-performing schools Randomized control trial Mathematics Intervention
Keywords can be combined to look for specific ideas, such as ‘best practices’ and ‘professional develop-ment’ and ‘principals’ to find ways to better train school leaders.
Evaluating ResearchOne of the most difficult steps for many SEAs will be evaluating the research to match it to the appro-priate levels of evidence. This section provides some general guidance on how to determine the level of evidence for a study; however, a number of resources exist that can help SEAs with this task. One is the What Works Clearinghouse (WWC)1, sponsored by the Institute for Education Sciences. The WWC rates re-search studies according to a set of standards2 and provides information about the rigor of those studies. Another resource is the Best Evidence Encyclopedia housed at Johns Hopkins University.3
1 http://ies.ed.gov/ncee/wwc/default.aspx 2 http://ies.ed.gov/ncee/wwc/DocumentSum.aspx?sid=19 3 http://www.bestevidence.org/
DRAFT

9
What are the ESSA levels of evidence?
ESSA recognizes four levels of evidence. This resource is designed to help SEA and LEA staff under-stand these different levels and apply them to research they may consider for school turn-around and related purposes. A summary of the four levels of evidence is shown in Figure 2:
Figure 2. ESSA Levels of Evidence
Source: Chiefs for Change, 2016.
For each of the first three levels, the research studies must demonstrate a “statistically significant effect on improving student outcomes or other relevant outcomes.” Statistically significant means that the difference observed in the study is not likely due to chance. However, a result can be statistically significant but not substantively important. That is, a program might have a small positive effect that is statistically significant but the effect may be so small as to be unimportant in practical terms. When reviewing research the size of the impact or effect should be considered along with the statistical significance.4
What is strong evidence?
Strong evidence is defined as “a well-designed and well-implemented experimental study.” What does that mean? Essential components of an experiment in educational research include:
• some kind of intervention or treatment designed to change outcomes,
• subjects who receive the intervention (typically called an experimental or treatment group),
• subjects who do not receive the intervention (typically called the control group), and
• random assignment of experimental and control groups to treatment.
4 Throughout this report a number of terms are used, such as statistically significant, substantively important and intervention. A good resource that defines many of these terms can be found at the What Works Clearing-house which provides an online glossary at: http://ies.ed.gov/ncee/wwc/Glossary.aspx.
DRAFT

10
To qualify as an experiment, there must be some factor that is manipulated. This is called the treatment and could be a curriculum, a teaching strategy, a school policy, or anything similar. For example, a school might implement a new math intervention. This would be provided to some students but not to others. Thus, an educational aspect is changed for some individuals and held constant for others.
The students (or teachers or schools) that receive the intervention or are part of the factor that is ma-nipulated are the experimental or treatment group (and possibly a comparison group). Those for whom instruction is unchanged are part of the control group, often called the “business-as-usual group.”
Note, however, that random assignment is particularly critical. Whenever two different groups receive dif-ferent treatments, changes in outcomes could be a result of the different treatment but also because of differences in the groups. For example, if a school wanted to test a new reading program it might decide to give one classroom the new program but let another classroom use the original reading program. This creates a treatment and control group. But if the students in the classes are different (for example, maybe one group is more advanced than the other), any differences in outcomes might be due to differences in the students and not the new program. The best way to overcome this risk is to randomly assign students (or teachers or schools) to either the treatment or control group. True random assignment helps ensure that the two groups are likely to be similar to each other and that any differences in outcomes are due to the treatment and not to differences between the subjects in the two groups.
Whether or not an experiment is well-designed and well-executed is not simple to determine. There are numerous factors that could weaken confidence in an experiment’s results, more than can be described here. Readers should look at resources such as the What Works Clearinghouse (WWC), which has developed standards to help judge the level of rigor for many educational studies.
For this guide there are two factors that are worth focusing on that can help identify studies that were not well designed or well executed. The first limitation is attrition. Attrition is the loss of subjects from the experiment. Even if the subjects are randomly assigned at the beginning, if enough members of either group leave the experiment, it can effectively undo the randomization process. The individuals who leave are likely to differ from those who stay and thus, if enough leave, the results could be biased. There is no easy way for a general reader to determine whether or not attrition is too high but it is something that should at least be considered. The WWC provides guidance on appropriate levels of attrition and can be used as a guide.
The second limitation is any kind of confound. A confound occurs when some aspect of the experi-ment is correlated directly with some external factor. A confound can be thought of as an “extra” factor that was not taken into account that could explain the observed differences between the two groups. The most common confound occurs when there is only one unit (that is, teacher, classroom, school, or district) assigned to each group. For example, consider two classrooms each taught by a different teacher. One classroom comprises the intervention group and the other comprises the control group. If the study found that the intervention classroom performed better than the control classroom, an alternative explanation for the observed difference could be related to differences between the classroom teachers and not the intervention. The presence of a confound makes it impossible for the observed differences between the groups to be attributed solely to the intervention provided.
Summary of key things to look for:
• experimental or treatment group (and the possible addition of a comparison group),
• control group,
• random assignment,
• low attrition, and
• presence or absence of a confound.
DRAFT

11
What is moderate evidence?
Moderate evidence is based on at least one quasi-experimental design (QED). What is the difference between an experiment and a quasi-experiment? The major difference is that a QED lacks random assignment of subjects to groups. QED studies are common because many educational policies and practices are implemented across the board or with a small pilot group that was not randomly as-signed. For example, a school principal might volunteer her school to participate in a new initiative. Results from that school might then be compared to schools that did not volunteer. This creates a treatment and control group but it lacks the random assignment. As noted above, when subjects are not randomly assigned it increases the risk that any observed differences in outcomes are due to other factors. In this example one might wonder if the principal who volunteered was especially excited or interested in the intervention or perhaps a more creative leader and that it was her leadership and interest that drove changes in outcomes.
There are many ways a QED can be conducted but the most common QED is an analysis of changes between pre-test and post-test scores for students in a treatment and control group. This looks like an experiment except that the two groups were not randomly assigned. The researchers would try to select groups that are similar on key criteria, such as English learner status, or economic status so that the groups could be compared. A related approach is to statistically match students. One way this is done is by taking each student who received an intervention and finding a statistical “twin” who did not receive the intervention and then comparing results.
As with experiments, deciding whether or not a QED is well-designed and well-executed is not simple to determine. Again, readers should look at resources such as the What Works Clearinghouse (WWC), which provides information about the level of rigor for many educational studies.
Beyond that, perhaps the single most critical factor to consider is whether or not the study was able to establish baseline equivalence between the two groups. As noted above, experiments use random assignment to try to ensure that the two groups studied are as equal as possible. Without random assignment researchers use other ways to select groups that are similar. Researchers will check how similar the groups are by comparing them on key variables like race, economic status, and test scores. Having two groups that are comparable on pre-test scores is an excellent way to establish baseline equivalence.
Still, without randomized assignment there will remain a concern about unobservable group differ-ences that weaken our confidence in the results. For example, two students with the same pre-test scores could have very different levels of motivation, which could in turn result in one improving more than another. Concerns about unobserved differences are why even a well-executed QED is rated as only having moderate evidence.
Summary of key things to look for:
• experimental or treatment group (and the possible addition of a comparison group),
• control group,
• establishing or failing to establish baseline equivalence,
• no random assignment.
What is promising evidence?
Promising evidence comes from correlational studies. The first and possibly most important feature of a correlational study is that there is only one group being studied. There are no treatment and control
DRAFT

12
groups. A correlational study will have one large group of individuals and will then use predictors or in-dependent variables to look for a relationship between some factor and the outcome of interest within that group. For example, suppose a school enacted a program to encourage students to read more books during the school year by offering prizes. At the end of the year a researcher might see if the number of books read is a good predictor of changes in student test scores. All students would be in the analysis so there is just one study group. The number of books serves as the independent variable or predictor of interest while other factors such as prior test scores might be used as control variables or covariates.
The phrase “statistical controls for selection bias” refers to some of these control variables or covari-ates. Selection bias refers to the possibility that the process of choosing the study sample introduces some kind of systematic error that could invalidate the results. For example, a researcher contacts each school in a district and asks them to provide certain data for analysis. Only some schools agree to provide the data. It is possible, even likely, that the schools (and their students) who provided the data are distinct from those that did not. Thus, conclusions from the available data are limited. Researchers often try to overcome selection bias by checking that key factors, such as test scores and demograph-ics, are similar between those included in the sample and those that were not. Putting these variables into a model allows researchers to statistically control for those factors. To meet the standard of prom-ising evidence, a correlational study must have those kinds of statistical controls. Note, however, that there are always unobserved factors that cannot be included as part of the controls and thus cannot be measured or taken into account.
Correlational studies are considered promising evidence because there is no way to assign causality to the results. Mathematically, all correlations can demonstrate is that two variables are related to each other. Logic might indicate a causal path, such as reading more books leads to higher tests scores. But without random assignment there are other competing explanations for the correlation. In this ex-ample, reading more books might lead to higher test scores. But it is also plausible that children with more engaged parents read more books which led to higher test scores. Another plausible explana-tion is that more active readers had a better teacher who created more excitement and interest about reading. A correlational analysis can only show an association, it cannot explain a causal relationship. That is why such studies are only rated promising.5
Key things to look for to identify a correlational study:
• only one study group (no separate treatment and control groups),
• terms such as “relationship”, “covariate,” and “predictor,”
• presence of statistical controls.
What qualifies as under evaluation?
The final level of evidence provides flexibility to work with interventions that have not been studied much or at all. Part of the goal for this flexibility is that allowing schools and districts to test new inter-ventions may add to our knowledge of what works. Note that ESSA limits the use of funds for practices in this category. For example, the 7% of Title I, Part A funds set aside for school improvement efforts must use interventions supported by research in the top three tiers.
5 Compare that study design to an experimental one. In an experiment researchers might randomly select some children to participate in the program and others who would not. Since the children were randomly chosen the influence of parents and teachers would even out, assuming the children had different teachers. Then the researcher could check first to see if children in the program showed larger gains than those students not in the program and also whether those in the program who read more books showed larger gains than those who read fewer books.
DRAFT

13
For the purposes of this guide, two aspects are notable. First, a theory of change provides a basis for expecting an intervention to result in an improvement. The theory of change can be well-constructed and well-established (sometimes called a strong theory) or can be something that is logical based on expert opinion. Regardless, there should be some kind of logic that explains why a given intervention is expected to produce a positive change. Readers are encouraged to develop logic models for these interventions to ensure that they have established a solid rationale.
Second, it is expected that SEAs and LEAs will carefully monitor progress under these kinds of practic-es. Ideally they should be evaluated through well-designed experiments but an LEA or SEA should at least set up an evaluation before applying the intervention. This would require, minimally, identifying the expected outcomes, tracking implementation, collecting follow up data, and conducting the anal-yses. Implementing an intervention with no way to measure or understand its consequences deprives the larger educational field an opportunity to learn more about that practice.
Keys to consider:
• Is there a strong theory as to why a practice might improve outcomes?
• How will the practice be evaluated? How will you know if it worked, or didn’t work?
DRAFT
14
Follow up, Monitoring, and EvaluationMost SEAs will use their existing accountability systems for monitoring and evaluation; however, there are ways to enhance these systems. SEAs may want to consider the following questions:
• What types of data might complement the state assessment data?
• How many years of data will we use as we consider improvement?
• What will we do to avoid regression to the mean (improvement that can be expected simply because a score is below the mean and, therefore, would statistically be expected to move toward the mean even without intervention) as an explanation for school improvement?
DRAFT

15
SEA Self-Study Guide ChecklistSelf-Study Guide Checklist - Preparation
Person Responsible Task Due
DateDate
Completed Follow-up Notes/Tasks
State Education Agency Leadership
Recruit team members which could include researchers, content area specialists, exceptional student education and English language learner specialists, and senior leadership.
State Education Agency Leadership
Choose a knowledgeable facilitator such as a School Improvement Director or ESSA state plan project manager.
Facilitator Study self-study materials and gather local data and evidence pertinent to the process.
Facilitator Distribute a blank SEA Scoring Template, the SEA Scoring Guide, Appendix A, and any other relevant data or evidence to each team member and establishes a timeline for team members to review the materials.
Facilitator Conduct a short meeting after team members have reviewed the documents to discuss any questions.
DRAFT
16
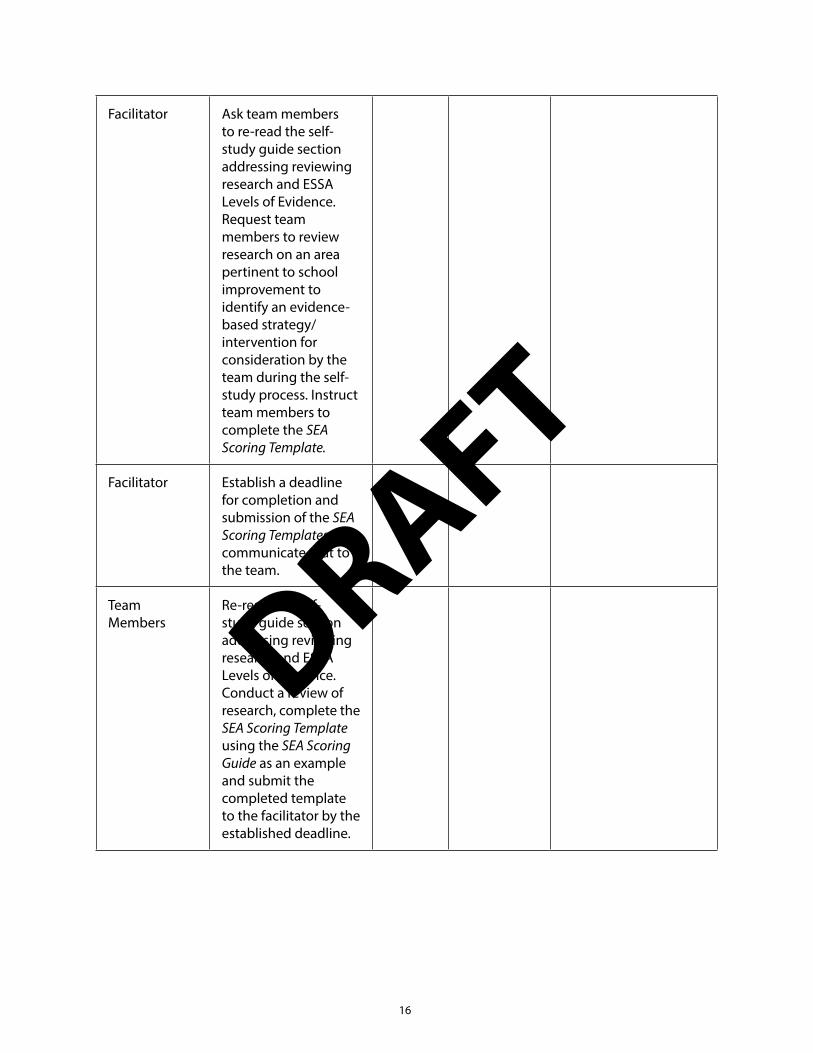
Facilitator Ask team members to re-read the self-study guide section addressing reviewing research and ESSA Levels of Evidence. Request team members to review research on an area pertinent to school improvement to identify an evidence-based strategy/intervention for consideration by the team during the self-study process. Instruct team members to complete the SEA Scoring Template.
Facilitator Establish a deadline for completion and submission of the SEA Scoring Templates and communicate that to the team.
Team Members
Re-read the self-study guide section addressing reviewing research and ESSA Levels of evidence. Conduct a review of research, complete the SEA Scoring Template using the SEA Scoring Guide as an example and submit the completed template to the facilitator by the established deadline.
DRAFT

17
Facilitator Distribute the completed SEA Scoring Templates to all team members and asks them to rate the strategies and interventions according to the scale on the template and to complete the SEA Scoring Guide.
Team Members
Review the completed SEA Scoring Templates they received from the facilitator. Review and rate the strategies and interventions includes in the SEA Scoring Guide.
Self-Study Guide Checklist - Discussion
Person Responsible Task Due
DateDate
Completed Follow-up Notes/Tasks
Facilitator and Team Members
Meet to establish consensus. The team discusses the ratings of the strategies and interventions recorded on the SEA Scoring Template and the SEA Scoring Guide.
Facilitator Conduct the first team vote in an effort to reach consensus on the ratings.
Facilitator Guide the team discussion regarding the first vote including the rationale for decisions of team members.
DRAFT

18
Facilitator and Team Members
Vote a second time if consensus is not reached initially.
Facilitator Guide any discussion and records results of voting, any team thoughts, comments or concerns, on the SEA Voting and Consensus Rating Form.
Self-Study Guide Checklist - Planning
Person Responsible Task Due
DateDate
Completed Follow-up Notes/Tasks
Facilitator Lead team discussion regarding priorities, resources, and anticipated challenges and records thoughts of the team on the SEA Planning Form.
Facilitator and Team Members
Establish timelines and responsibilities of team members and facilitator. The facilitator records this information on the SEA Planning Form.
Facilitator and Team Members
Mark calendars to complete tasks by established deadlines.
Facilitator Schedule future meetings to assess progress.
DRAFT

19
SEA Facilitator’s ChecklistFacilitator’s Checklist - Preparation
Task Due Date
Date Completed Follow-Up Notes/Tasks
Review materials for self-study process and gather all pertinent data and evidence pertaining to the strategies and interventions.
Distribute a blank SEA Scoring Template, SEA Scoring Guide, and Appendix A as well as any other relevant data or evidence to each team member. Provide a timeline for team members to review the materials.
Conduct a short meeting after team members have reviewed the documents to discuss any questions.
Ask each team member to re-read the self-study guide section addressing reviewing research and ESSA Levels of Evidence. Request team members to review research pertinent to an area related to school improvement to identify a specific evidence-based strategy/intervention for consideration by the self-study team. Instruct team members to complete the SEA Scoring Template for the strategy/intervention selected.
Establish a deadline for completion and submission of the SEA Scoring Templates and communicate that to the team.
Distribute the completed SEA Scoring Templates to all team members and ask them to rate the strategies and interventions according to the scale on the template and to complete the SEA Scoring Guide.
DRAFT

20
Facilitator’s Checklist - Discussion
Task Due Date
Date Completed Follow-Up Notes/Tasks
Conduct the first team vote in an effort to reach consensus on the ratings.
Guide discussion regarding first vote including the rationale for decisions of team members.
Facilitate second team vote if consensus is not reached initially.
Guide any discussion and record results of voting, any team thoughts, comments or concerns, on the SEA Voting and Consensus Rating Form.
Facilitator’s Checklist - Planning
Task Due Date
Date Completed Follow-Up Notes/Tasks
Lead discussion regarding timelines and responsibilities of team members and facilitator. Record this information on the SEA Planning Form.
Mark calendar to complete tasks by established deadlines.
Schedule future meetings to assess progress. DRAFT

21
SEA Team Member’s ChecklistTeam Member Checklist - Preparation
Task Due Date
Date Completed Follow-Up Notes/Tasks
Review all materials received from the facilitator.
Attend team meeting and ask any questions to be sure the process is clear.
Re-read the self-study guide section addressing reviewing research and the ESSA Levels of Evidence. Conduct a review of research to identify a school improvement strategy/intervention to be considered for recommendation by the team. Complete the SEA Scoring Template and submit to the facilitator by the established deadline.
Rate the strategies and interventions on the completed SEA Scoring Templates (received from the facilitator) according to the rating on the template. Complete the SEA Scoring Guide after reviewing the research and information provided for each strategy/intervention. Use the guiding questions to help make decisions.
Team Member Checklist - Discussion
Task Due Date
Date Completed Follow-Up Notes/Tasks
Participate in the discussion regarding first vote. Reconsider the first rating based on discussion.
Participate in second team vote if consensus is not reached initially.
Participate in additional discussion of voting results.
DRAFT

22
Team Member Checklist - Planning
Task Due Date
Date Completed Follow-Up Notes/Tasks
Participate in discussion regarding priorities, resources, and anticipated challenges. These will be recorded on the SEA Planning Form.
Record any assigned responsibilities and mark calendar to complete tasks by established deadlines.
Attend any future meetings as scheduled by the facilitator.
DRAFT

23
SEA Scoring TemplateArea:
Circle the rating that reflects whether or not you feel this option should be included in the menu for selection by comprehensive or targeted support schools.
1=Not recommended
2=Recommended
3=Strongly recommended
Strategy/Intervention: Rating:
1 2 3
Evidence Level:
Summary of Research:
Additional Information for Consideration:
Guiding Questions:
Selected Citations:
DRAFT

24
SEA Scoring GuideArea 1: Implementing Systemic Change
LEAs/schools select and implement a systemic strategy or intervention which affects the organi-zational structure of the school.
Circle the rating that reflects whether or not you feel this option should be included in the menu for selection by comprehensive and targeted support schools.
1=Not recommended 2=Recommended 3=Strongly recommended
1. LEAs/schools will implement a reconstitution model which will replace the principal, rehire no more than 50 percent of the staff, and grant the principal sufficient operational flexibility (including staffing, calendars, schedules, and budgeting) to implement fully a compre-hensive approach that substantially improves student outcomes.
Rating:
1=Not recommended 2=Recommended 3=Strongly recommended
1 2 3
Evidence Level: Moderate
Summary of Research:
One quasi-experimental study6 found improved student achievement in the first year of the reform but smaller impacts in subsequent years. Over time, it does not seem that the positive impact on stu-dent achievement is sustained; however, it may be due to the withdrawal of support such as profes-sional development that occurred in the years following the reconstitution.
Additional Information for Consideration:
Student achievement data and school improvement plans for comprehensive and targeted support schools. Student data from schools that have reconstituted in the past.
Guiding questions:
• Are we satisfied with the evidence level of this strategy?
• Are there schools in the state that have reconstituted successfully and where are they?
• How can we help LEAs/schools ensure that the new principal and staff can make effective change?
• How do we help LEAs/schools recruit and retain high-quality teachers?
• How can we help LEAs/schools ensure that any initial positive impact is sustained?
• For what types of schools might this be an appropriate choice?
• Can or should this strategy be used in conjunction with other strategies, activities, or interven-tions?
DRAFT

25
• What is the cost/benefit of utilizing this strategy?
Selected Citation:
6Strunk, K. O., Marsh, J. A., Hashim, A. K., & Bush-Mecenas, S. (2016). Innovation and a Return to the Status Quo A Mixed-Methods Study of School Reconstitution. Educational Evaluation and Policy Analysis, 0162373716642517.
2. LEAs/schools will implement a transformational model, which by definition replaces the principal, and address-es various aspects at the school such as professional development, instructional reform, teacher evaluation and rewards systems, extended learning time, and com-munity involvement.
Rating:
1=Not recommended 2=Recommended 3=Strongly recommended
1 2 3
Evidence Level: Moderate
Summary of Research:
A meta-analysis of research7 as conducted regarding this strategy in general as well as the effects associated with specific comprehensive school reform model components. Overall, the effects ap-pear to be positive, especially in the instances where the strategy was in place for five years or more. If using an outside provider, it is important to consider the provider that is most appropriate for the needs of the school. While the intent was for the strategy to emphasize eleven specific components as identified by the U.S. Department of Education in 2002 in a comprehensive manner8, some externally developed programs emphasized some components more than others.
Additional Information for Consideration:
Student achievement data and school improvement plans for comprehensive and targeted support schools.
Guiding questions:
• Are we satisfied with the evidence level of this strategy?
• Where has a transformational model been implemented effectively?
• For what types of schools might this be an appropriate choice?
• If LEAs/school wish to use an outside provider to assist them, how can we help them in the selec-tion process?
• What guidance can be provided to districts if they seek to develop this model?
• What can we do to help promote sustainability?
• What is the cost/benefit of utilizing this strategy?
Selected Citations:
7Borman, G. D., Hewes, G. M., Overman, L. T., & Brown, S. (2003). Comprehensive school reform and achievement: A meta-analysis. Review of educational research, 73(2), 125-230.
8May, H., & Supovitz, J. A. (2006). Capturing the cumulative effects of school reform: An 11-year study of the impacts of America’s Choice on student achievement. Educational Evaluation and Policy Analysis, 28(3), 231-257.
DRAFT

26
3. LEAs/schools will implement a restart model which involves transferring control of a school to an operator, such as a charter school, that has been selected through a rigorous review process.
Rating:
1=Not recommended 2=Recommended 3=Strongly recommended
1 2 3
Evidence Level: Promising
Summary of Research:
Only a few schools that received School Improvement Grant funds have chosen to restart by trans-ferring control to a charter school. Case studies9 suggest that the autonomy associated with charters can be an advantage in implementing processes that may positively impact student achievement. That said, the restart model has had mixed results reflecting that simply converting a low-performing school to a charter school does not in and of itself positively impact student achievement10.
Additional Information for Consideration:
Student achievement data and school improvement plans for comprehensive and targeted support schools.
Guiding questions:
• Are we satisfied with the evidence level of this strategy?
• Are their schools in our state that have done this and where are they?
• How can we ensure that the LEA/school selects the operator that best meets their needs?
• For what schools might this be appropriate?
• What review process occurs for operators?
• What is the cost/benefit of utilizing this strategy?
Selected Citations:
9Corbett, J. (2015). Chartering Turnaround: Leveraging Public Charter School Autonomy to Address Failure. National Alliance for Public Charter Schools.
10Herman, R. (2012). Scaling school turnaround. Journal of Education for Students Placed at Risk (JESPAR), 17(1-2), 25-33.
4. LEAs/schools will convert to a thematic magnet school resulting in a change in faculty as well as a change in student population.
Rating:
1=Not recommended 2=Recommended 3=Strongly recommended
1 2 3
Evidence Level: Moderate
DRAFT
27
Summary of Research:
Many years of research11 substantiates the fact that schools in need of the most improvement are most often schools with higher populations of minority students and students in poverty. Studies12,13,14,15
show that if the school implements a magnet program attracting students in higher socio-economic backgrounds, student achievement tends to increase.
Additional Information for Consideration:
Student achievement data and school improvement plans for comprehensive and targeted support schools. Data regarding schools that have implemented magnet programs.
Guiding questions:
• Are we satisfied with the evidence level of this strategy?
• How much success has there been in implementing magnet programs and where has the success occurred?
• What types of magnet programs have been most successful?
• For what types of schools would this be most appropriate?
• What is the cost/benefit of utilizing this strategy?
Selected Citations:
11Blank, R. K., Dentler, R., Baltzell, D. C., Chabotar, K (1983). Survey of magnet schools. Analyzing a model for quality integrated education. Final Report of a National Study 10-11 (U.S. Dept. of Ed.).
12Bifulco, R., Cobb, C. D., Bell, C. (2008). Do magnet schools outperform traditional public schools and re-duce the achievement gap? The case of Connecticut’s interdistrict magnet school program. Oc-casional Paper No. 167. New York: National Center for the Study of Privatization in Education.
13Gamoran, A. (1996). Student achievement in public magnet, public comprehensive, and private city high schools. Educational Evaluation and Policy Analysis 18, 1–18.
14Kahlenberg, R. D. (2009). Turnaround schools that work: Moving beyond separate but equal. Century Foundation.
15Poppell, J. and Hague, S. (2001). Examining indicators to assess the overall effectiveness of magnet schools: A study of magnet schools in Jacksonville, Florida. Paper presented at the American Educational Research Association, Seattle, Washington, 10-14.
DRAFT

28
Area 2: Establishing Strong LeadershipLEAs/schools will Identify and employ strong leadership that can effect change quickly.
Circle the rating that reflects whether or not you feel this option should be included in the menu for selection by comprehensive and targeted support schools.
1=Not recommended 2=Recommended 3=Strongly recommended
1. LEAs/schools will ensure that the principal has a clear commitment to dramatic changes from the status quo and can communicate the magnitude and urgency of those changes.
Rating:
1=Not recommended 2=Recommended 3=Strongly recommended
1 2 3
Evidence Level: Promising
Summary of Research:
It is important that principals “demonstrate commitment to developing a learning community for students and staff with the primary focus of the school on learning with staff and students working together toward that goal”.16 School leaders also signal change through clear communication, creating high expectations, sharing leadership and authority, demonstrating a willingness to make the same types of changes asked of their staff, identifying advocates with the staff, building a consensus that permeates the staff, ensuring that the maximum amount of classroom time is focused on instruction and establishing a cohesive culture. The current principal may be able to signal change; however, there may need to be a change in leadership to communicate the need for a dramatic change in the school.
Additional Information for Consideration:
Student achievement data and school improvement plans for comprehensive and targeted support schools. Hiring protocols from districts.
Guiding questions:
• Are we satisfied with the evidence level of this strategy?
• How often are principals retained versus new principals hired?
• How does the success of a retained principal compare to that of a newly hired principal?
• How can we ensure the principal will implement change and exhibit behaviors that impact stu-dent achievement?
• What guidance can we provide LEAs/schools as they consider the retention of the current princi-pal or recruitment of another?
• Can or should this strategy be used in conjunction with other strategies, activities, or interven-tions?
• What is the cost/benefit of utilizing this strategy?
DRAFT

29
Selected Citation:
16Herman, R., Dawson, P., Dee, T., Greene, J., Maynard, R., Redding, S., and Darwin, M. (2008). Turning Around Chronically Low-Performing Schools: A practice guide (NCEE #2008-4020). Washington, DC: National Center for Education Evaluation and Regional Assistance, Institute of Education Sciences, U.S. Department of Education. Retrieved from http://ies.ed.gov/ncee/wwc/publica-tions/practiceguides pg. 10.
2. LEAs/schools will ensure that principals implement evidence-based behaviors shown to increase stu-dent achievement such as monitoring and providing feedback to teachers and students, protection of instructional time, promoting school learning climate, supporting teachers in professional development, em-phasizing data-driven decision-making and positively interacting with students and teachers.
Rating:
1=Not recommended 2=Recommended 3=Strongly recommended
1 2 3
Evidence Level: Varies by specific behavior
Summary of Research:
There are some principal responsibilities that affect student achievement more than others. There is evidence17 that behaviors related to instructional management and internal relations impact student achievement while behaviors associated with organizational management and administrative duties do not appear to impact student achievement significantly, if at all.
Additional Information for Consideration:
Student achievement data and school improvement plans for comprehensive and targeted support schools. Principal evaluation protocol for districts.
Guiding questions:
• Are we satisfied with the evidence level of this strategy?
• Are there characteristics, such as years of experience, which indicate a principal would be more likely to exhibit these behaviors?
• What will LEAs do to ensure that principals are engaging in behaviors that most impact student achievement?
• How do we support LEAs/schools as they implement this strategy?
• What is the cost/benefit of utilizing this strategy?
Selected Citation:
17Osborne-Lampkin, L. T., Folsom, J. S., & Herrington, C. (2015). A systematic review of the relationships between principal characteristics and student achievement (REL 2016-091). Washington, DC: U.S. Department of Education, Institute of Education Sciences, National Center for Education Eval-uation and Regional Assistance, Regional Educational Laboratory Southeast. Retrieved from http://ies.ed.gov/ncee/edlabs.
DRAFT

30
3. LEAs/schools will implement a distributed leadership model, transformational leadership model, or an inte-grated model to increase student achievement.
Rating:
1=Not recommended 2=Recommended 3=Strongly recommended
1 2 3
Evidence Level: Promising
Summary of Research:
Distributed leadership and transformational leadership models positively impact student achieve-ment; however, it appears that the effect is indirect. These leadership styles had a significant effect on changes in school academic capacity, which in turn had significant effects on growth in English lan-guage arts and mathematics.18 Studies19,20 have found that over time that schools with a higher level of integrated leadership (transformational and distributed) had higher academic achievement than schools with a lower level of integrated leadership (Heck and Hallinger, 2009).
Additional Information for Consideration:
Student achievement data and school improvement plans for comprehensive and targeted support schools.
Guiding questions:
• Are we satisfied with the evidence level of this strategy?
• Has a distributed, transformational, or integrated leadership model been implemented in com-prehensive and targeted support schools in our state?
• What can we do to provide guidance and technical assistance to LEAs/schools to help schools implement these leadership models?
• For what schools might this be appropriate?
• Can or should this strategy be used in conjunction with other strategies, activities, or interven-tions?
• What is the cost/benefit of utilizing this strategy?
Selected Citations:
18Louis, K. S., Leithwood, K., Wahlstrom, K. L., Anderson, S. E., Michlin, M., & Mascall, B. (2010). Learn-ing from leadership: Investigating the links to improved student learning. Center for Applied Research and Educational Improvement/University of Minnesota and Ontario Institute for Studies in Education/University of Toronto, 42, 50.
19Heck, R. H., & Hallinger, P. (2009). Assessing the contribution of distributed leadership to school improve-ment and growth in math achievement. American Educational Research Journal, 46(3), 659-689.
20Osborne-Lampkin, L. T., Folsom, J. S., & Herrington, C. (2015). A systematic review of the relationships between principal characteristics and student achievement (REL 2016-091). Washington, DC: U.S. Department of Education, Institute of Education Sciences, National Center for Education Eval-uation and Regional Assistance, Regional Educational Laboratory Southeast. Retrieved from http://ies.ed.gov/ncee/edlabs.
DRAFT

31
4. LEAs/schools provide a program such as the School Turnaround Specialist Program which includes sub-stantial professional development to help school leaders improve culture, team building, data analysis, instruction and other aspects of the school to positively impact student achievement. Follow-up occurs over the course of one to two years.
Rating:
1=Not recommended 2=Recommended 3=Strongly recommended
1 2 3
Evidence Level: Moderate
Summary of Research:
A quasi-experimental four-year study21 was conducted involving schools in Cleveland and Cincin-nati, Ohio. The study found statistically significant effects during and after implementing the School Turnaround Specialist Program and underscored the importance of strong leadership. The strategy/intervention entailed an intense two-year embedded professional development program in which leaders were given support in establishing goals, using data to make decisions regarding student performance, and motivating teachers. Significant growth occurred in a relatively short period of time. This improvement began during the two-year program and continued two years beyond. The analy-sis of data excluded schools receiving School Improvement Grants (SIG) during the time of the study. Although improvement was noted, the schools still fell short of the average state level of proficiency.
Additional Information for Consideration:
Student achievement data and school improvement plans for comprehensive and targeted support schools. Data or information from institutions that provide school turnaround specialist programs.
Guiding questions:
• Are we satisfied with the evidence level of this strategy?
• Has a school turnaround specialist program been implemented in comprehensive and targeted support schools in our state?
• What institutions or entities provide School Turnaround Specialists Programs or similar programs to schools in our state?
• How can we ensure the program is implemented in a manner similar to the successful program?
• Can or should this strategy be used in conjunction with other strategies, activities, or interven-tions?
• What is the cost/benefit of utilizing this strategy?
Selected Citation:
21Player, D., & Katz, V. (2016). Assessing School Turnaround: Evidence from Ohio. The Elementary School Journal, 116(4), 675-698.
DRAFT

32
Area 3: Improving Academic Instruction and InterventionLEAs/schools will implement evidence-based curriculum aligned with state standards and as-sessments and use data to set goals and drive instruction for all students.
Circle the rating that reflects whether or not you feel this option should be included in the menu for selection by comprehensive and targeted support schools.
1=Not recommended 2=Recommended 3=Strongly recommended
1. LEAs/schools will evaluate current curriculum and inter-ventions to ensure they are evidence-based and aligned with state standards and assessments.
Rating:
1=Not recommended 2=Recommended 3=Strongly recommended
1 2 3
Evidence Level: Varies, depending on curricula
Summary of Research:
Research22 reflects that student performance improved if instructional materials were aligned with state standards and assessments. The What Works Clearinghouse provides a list of curriculum and interventions along with their research base that are shown to improve the academic skills of students. LEAs should incorporate consideration of the research supporting curricula in their review process and whenever feasible give priority to adopting curricula with stronger research support.
Additional Information for Consideration:
Student achievement data; instructional materials rubrics; adoption or selection process protocol; and school improvement plans for comprehensive and targeted support schools.
Guiding questions:
• Are we satisfied with the evidence level of this strategy?
• What curriculum and materials are successful schools using?
• Are there curriculum materials or interventions used in the state that have demonstrated success in comprehensive and targeted support schools in our state?
• What tools can be provided to help LEAs/schools evaluate curriculum and interventions?
• Can or should this strategy be used in conjunction with other strategies, activities, or interven-tions?
• What is the cost/benefit of utilizing this strategy?
Citation:
22Herman, R., Dawson, P., Dee, T., Greene, J., Maynard, R., Redding, S., and Darwin, M. (2008). Turning Around Chronically Low-Performing Schools: A practice guide (NCEE #2008-4020). Washington,
DRAFT
33
DC: National Center for Education Evaluation and Regional Assistance, Institute of Education Sciences, U.S. Department of Education. Retrieved from http://ies.ed.gov/ncee/wwc/publica-tions/practiceguides.
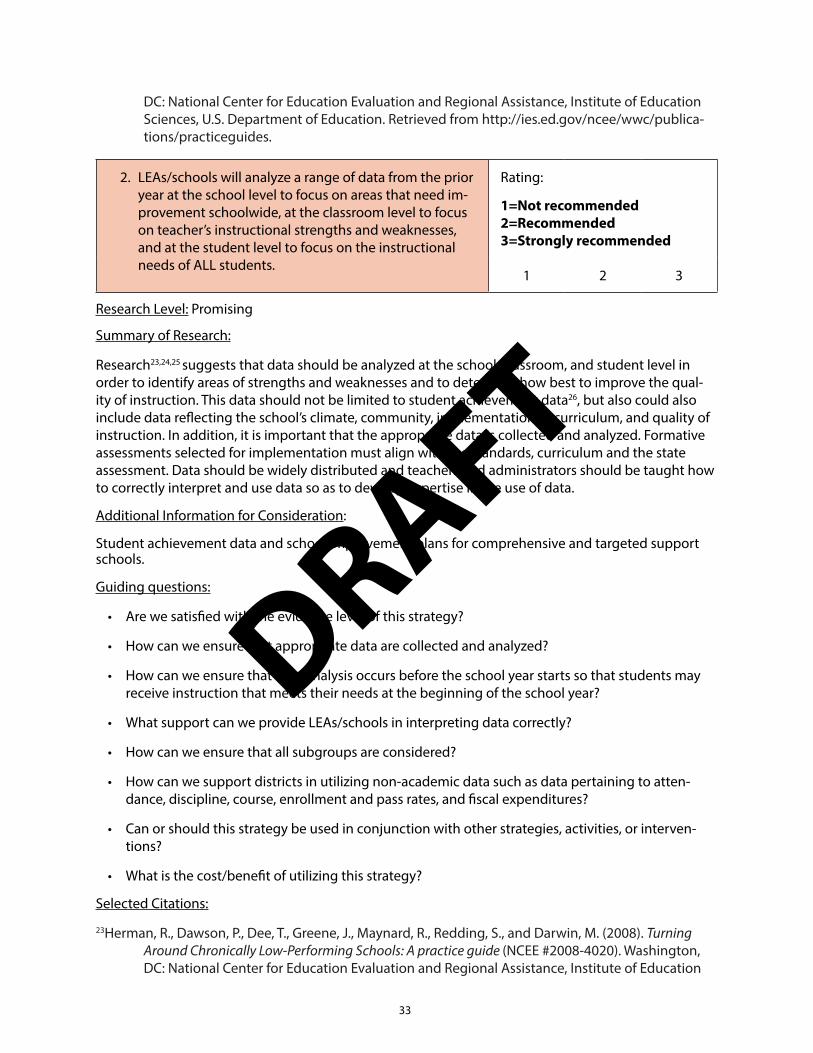
2. LEAs/schools will analyze a range of data from the prior year at the school level to focus on areas that need im-provement schoolwide, at the classroom level to focus on teacher’s instructional strengths and weaknesses, and at the student level to focus on the instructional needs of ALL students.
Rating:
1=Not recommended 2=Recommended 3=Strongly recommended
1 2 3
Research Level: Promising
Summary of Research:
Research23,24,25 suggests that data should be analyzed at the school, classroom, and student level in order to identify areas of strengths and weaknesses and to determine how best to improve the qual-ity of instruction. This data should not be limited to student achievement data26, but also could also include data reflecting the school’s climate, community, implementation of curriculum, and quality of instruction. In addition, it is important that the appropriate data is collected and analyzed. Formative assessments selected for implementation must align with the standards, curriculum and the state assessment. Data should be widely distributed and teachers and administrators should be taught how to correctly interpret and use data so as to develop expertise in the use of data.
Additional Information for Consideration:
Student achievement data and school improvement plans for comprehensive and targeted support schools.
Guiding questions:
• Are we satisfied with the evidence level of this strategy?
• How can we ensure that appropriate data are collected and analyzed?
• How can we ensure that data analysis occurs before the school year starts so that students may receive instruction that meets their needs at the beginning of the school year?
• What support can we provide LEAs/schools in interpreting data correctly?
• How can we ensure that all subgroups are considered?
• How can we support districts in utilizing non-academic data such as data pertaining to atten-dance, discipline, course, enrollment and pass rates, and fiscal expenditures?
• Can or should this strategy be used in conjunction with other strategies, activities, or interven-tions?
• What is the cost/benefit of utilizing this strategy?
Selected Citations:
23Herman, R., Dawson, P., Dee, T., Greene, J., Maynard, R., Redding, S., and Darwin, M. (2008). Turning Around Chronically Low-Performing Schools: A practice guide (NCEE #2008-4020). Washington, DC: National Center for Education Evaluation and Regional Assistance, Institute of Education
DRAFT

34
Sciences, U.S. Department of Education. Retrieved from http://ies.ed.gov/ncee/wwc/publica-tions/practiceguides.
24Anderson, S., Leithwood, K., & Strauss, T. (2010). Leading data use in schools: Organizational condi-tions and practices at the school and district levels. Leadership and Policy in Schools, 9(3), 292-327.
25van Geel, M., Keuning, T., Visscher, A. J., & Fox, J. P. (2016). Assessing the Effects of a School-Wide Da-ta-Based Decision-Making Intervention on Student Achievement Growth in Primary Schools. American Educational Research Journal, 0002831216637346.
26Hamilton, L., Halverson, R., Jackson, S., Mandinach, E., Supovitz, J., & Wayman, J. (2009). Using student achievement data to support instructional decision making (NCEE 2009-4067). Washington, DC: National Center for Education Evaluation and Regional Assistance, Institute of Education Sci-ences, U.S. Department of Education. Retrieved from http://ies.ed.gov/ncee/wwc/publications/practiceguides.
3. LEAs/schools will progress monitor students through-out the school year, analyze data, and modify instruc-tion to meet the ongoing instructional needs of stu-dents.
Rating:
1=Not recommended 2=Recommended 3=Strongly recommended
1 2 3
Evidence Level: Moderate
Summary of Research:
Teachers can use this data to determine the progress of students toward grade level standards and to adjust instruction accordingly.27, Data should analyzed and interpreted so that teachers can develop a hypothesis regarding student learning and modify instruction to test that hypothesis and improve student achievement28. A study 29was conducted of a computerized curriculum-based instructional management system implemented as an enhancement to ongoing mathematics instruction which en-abled teachers to use data to modify instruction for students. This was shown to lead to an increase in student achievement in mathematics. In addition, research30 reflects that a computer-adaptive literacy assessment can help to identify students at risk of not meeting grade level standards as well as those who are not at risk so that teachers can provide instruction accordingly. Finally, computer-adaptive as-sessments may be especially valuable in helping teachers to monitor the progress of English language learners and students with learning disabilities, enabling them to target instruction to their needs.31
Additional Information for Consideration:
Student achievement data and school improvement plans for comprehensive and targeted support schools.
Guiding questions:
• Are we satisfied with the evidence level of this strategy?
• Will we require specific tools for progress monitoring?
• How can we support LEAs/schools in collecting data and analyzing it correctly?
• How can we ensure that progress monitoring data drives continued modification of instruction
DRAFT

35
for all students in all subgroups?
• Can or should this strategy be used in conjunction with other strategies, activities, or interven-tions?
• What is the cost/benefit of utilizing this strategy?
Selected Citations:
27Herman, R., Dawson, P., Dee, T., Greene, J., Maynard, R., Redding, S., and Darwin, M. (2008). Turning Around Chronically Low-Performing Schools: A practice guide (NCEE #2008-4020). Washington, DC: National Center for Education Evaluation and Regional Assistance, Institute of Education Sciences, U.S. Department of Education. Retrieved from http://ies.ed.gov/ncee/wwc/publica-tions/practiceguides.
28Hamilton, L., Halverson, R., Jackson, S., Mandinach, E., Supovitz, J., & Wayman, J. (2009). Using student achievement data to support instructional decision making (NCEE 2009-4067). Washington, DC: National Center for Education Evaluation and Regional Assistance, Institute of Education Sci-ences, U.S. Department of Education. Retrieved from http://ies.ed.gov/ncee/wwc/publications/practiceguides.
29Ysseldyke, J., Spicuzza, R., Kosciolek, S., Teelucksingh, E., Boys, C., & Lemkuil, A. (2003). Using a curricu-lum-based instructional management system to enhance math achievement in urban schools. Journal of Education for Students Placed at Risk, 8(2), 247-265.
30Foorman, B., Kershaw, S., Petscher, Y. (2013). Evaluating the screening accuracy of the Florida Assess-ments for Instruction in Reading (FAIR). (REL 2013-008). Washington, DC: U.S. Department of Ed-ucation, Institute of Education Sciences, National Center for Education Evaluation and Regional Assistance, Regional Educational Laboratory Southeast. Retrieved from http://ies.ed.gov/ncee/edlabs/regions/southeast/pdf/REL_2013008.pdf.
31Foorman, B., Espinosa, A., Jackson, C., Wu, Y. (2016b). Using computer-adaptive assessments of literacy to monitor the progress of English learner students. (REL 2016-149). Washington, DC: U.S. Depart-ment of Education, Institute of Education Sciences, National Center for Education Evaluation and Regional Assistance, Regional Educational Laboratory Southeast. Retrieved from http://ies.ed.gov/ncee/edlabs/regions/southeast/pdf/REL_2016149.pdf.DRAFT

36
Area 4: Developing and Retaining a High-Quality StaffLEAs/schools implement a plan for developing and retaining a high quality staff that can im-prove instruction and is dedicated to the school’s improvement goals.
Circle the rating that reflects whether or not you feel this option should be included in the menu for selection by comprehensive and targeted support schools.
1=Not recommended 2=Recommended 3=Strongly recommended
1. LEAs/schools will build a committed staff and provide professional development for teachers to improve the quality of instruction in the classroom and positively impact student achievement.
Rating:
1=Not recommended 2=Recommended 3=Strongly recommended
1 2 3
Evidence Level: Strong
Summary of Research:
A common characteristic of schools that have successfully turned around is that school leaders chose teachers who were committed to improving the school and were qualified to implement high-qual-ity instruction.32 Professional development can also help these teachers continue to improve their instruction. Nine studies33 that met the What Works Clearinghouse evidence standards, five of which were randomized control trials that met evidence standards without reservations, were examined to ascertain the effectiveness of professional development as it relates to student achievement. These studies focused on elementary school teachers and students and included four studies pertaining to reading and language arts, two related to mathematics, one focused on science and two on language arts, mathematics, and science. All nine studies found that teacher professional development had a moderate effect on student achievement. Effective professional development is focused on content and extends and intensifies teacher knowledge in a particular subject area and how students learn that content.42 A variety of approaches to professional development can be implemented to impact to student achievement, including the establishment of professional grade level teams wherein teachers can collaborate and receive professional development.35,36,37
Additional Information for Consideration:
School achievement data and school improvement plans.
Guiding questions:
• Are we satisfied with the evidence level of this strategy?
• What can be done to support LEAs/schools in analyzing data to target their professional develop-ment plans?
• What support can be provided for LEAs/schools as they develop their professional development plan?
• How can it be ensured that professional development plans are driven by instructional goals?
DRAFT

37
• What can be done to support LEAs/schools so that they deliver high-quality professional devel-opment?
• What can be done to ensure follow-up so that professional development strategies are imple-mented in the classroom?
• Can or should this strategy be used in conjunction with other strategies, activities, or interven-tions?
• What is the cost/benefit of utilizing this strategy?
Selected Citations:
32Herman, R., Dawson, P., Dee, T., Greene, J., Maynard, R., Redding, S., and Darwin, M. (2008). Turning Around Chronically Low-Performing Schools: A practice guide (NCEE #2008-4020). Washington, DC: National Center for Education Evaluation and Regional Assistance, Institute of Education Sciences, U.S. Department of Education. Retrieved from http://ies.ed.gov/ncee/wwc/publica-tions/practiceguides.
33Yoon, K. S., Duncan, T., Lee, S. W. Y., Scarloss, B., & Shapley, K. L. (2007). Reviewing the Evidence on How Teacher Professional Development Affects Student Achievement. Issues & Answers. REL 2007-No. 033.Regional Educational Laboratory Southwest (NJ1).
34Early, D. M., Berg, J. K., Alicea, S., Si, Y., Aber, J. L., Ryan, R. M., & Deci, E. L. (2016). The Impact of Every Classroom, Every Day on High School Student Achievement: Results From a School-Random-ized Trial. Journal of Research on Educational Effectiveness, 9(1), 3-29.
35Antoniou, P., & Kyriakides, L. (2011). The impact of a dynamic approach to professional development on teacher instruction and student learning: Results from an experimental study. School Effec-tiveness and School Improvement, 22(3), 291-311.
36Saunders, W. M., Goldenberg, C. N., & Gallimore, R. (2009). Increasing achievement by focusing grade-level teams on improving classroom learning: A prospective, quasi-experimental study of Title I schools. American Educational Research Journal, 46(4), 1006-1033.
37van Kuijk, M. F., Deunk, M. I., Bosker, R. J., & Ritzema, E. S. (2016). Goals, data use, and instruction: the effect of a teacher professional development program on reading achievement. School Effec-tiveness and School Improvement, 27(2), 135-156.
2. LEAs/schools will provide well-trained instructional coaches to deliver embedded professional develop-ment for teachers based on data.
Rating:
1=Not recommended 2=Recommended 3=Strongly recommended
1 2 3
Evidence Level: Moderate
Summary of Research:
The hiring of an instructional coach to provide embedded professional development can positively impact student achievement38,39,40 if the coach is well-trained and engages in behaviors such as model-ing lessons, providing feedback, and engaging in discussions centered on data.
DRAFT

38
Additional Information for Consideration:
Student achievement data and school improvement plans for comprehensive and targeted support schools. Data regarding the numbers and districts that have implemented instructional coaches.
Guiding questions:
• Are we satisfied with the evidence level of this strategy of providing well-trained instructional coaches?
• Have coaches serving in comprehensive and targeted support schools impacted student achieve-ment?
• Should there be specific requirements for instructional coaches?
• How can we support districts as they select coaches and train them?
• How can we ensure that roles of coaches include those that yield the biggest impact on student achievement?
• Can or should this strategy be used in conjunction with other strategies, activities, or interven-tions?
• What is the cost/benefit of utilizing this strategy?
Selected Citations:
38Lockwood, J. R., Jennifer Sloan McCombs, and Julie Marsh. “Linking reading coaches and student achievement evidence from Florida middle schools.” Educational Evaluation and Policy Analysis 32.3 (2010): 372-388.
39Marsh, J. A., McCombs, J. S., & Martorell, P. (2010). How Instructional Coaches Support Data-Driven Decision Making. Educational Policy, 20(10), 1-37.
40Matsumura, L. C., Garnier, H. E., & Spybrook, J. (2013). Literacy coaching to improve student reading achievement: A multi-level mediation model. Learning and Instruction, 25, 35-48.
3. LEAs/schools will implement a career continuum for teachers encouraging professional growth and the opportunity to take on leadership roles. They will com-pensate teachers based on student achievement results and their roles designated by the career continuum.
Rating:
1=Not recommended 2=Recommended 3=Strongly recommended
1 2 3
Evidence Level: Moderate
Summary of Research:
Comprehensive school reforms focused on teacher recruiting and developing high quality teachers can positively impact 41student achievement. Implementing an aggressive recruitment plan including substantial advertising is important so that high-quality teachers are attracted to schools in need of improvement. In addition, establishing a career continuum can help develop and retain teachers by, (a) enabling teachers to assume increasing responsibilities, roles, and authority; (b) providing opportu-nities for teachers to conduct professional development in their schools; and (c) holding teachers ac-
DRAFT
39
countable. Implementing a continuum and compensating teachers according to student achievement and their progress on the continuum yielded significant improvement in student achievement data compared to like schools that did not implement a comprehensive method of recruiting, developing, and retaining teachers. In addition, teachers working in a more supportive professional environment improve their effectiveness more over time than teachers working in less supportive contexts.
Additional Information for Consideration:
School achievement data and school improvement plans.
Guiding questions:
• Are we satisfied with the evidence level of the strategy of implementing a career continuum?
• Are there districts that have established such a continuum for teachers in our state and how suc-cessful has that been?
• What responsibilities/roles could be included in a career continuum?
• How can we support LEAs/districts as they develop a career continuum?
• Can or should this strategy be used in conjunction with other strategies, activities, or interven-tions?
• What is the cost/benefit of utilizing this strategy?
Selected Citation:
41Schacter, J., & Thum, Y. M. (2005). TAPping into high quality teachers: Preliminary results from the-Teacher Advancement Program comprehensive school reform. School Effectiveness and School Improvement, 16(3), 327-353.
DRAFT

40
Area 5: Creating a Positive School Climate and CultureLEAs/schools implement a plan to establish a positive school culture and climate that embraces high academic expectations.
Circle the rating that reflects whether or not you feel this option should be included in the menu for selection by comprehensive and targeted support schools.
1=Not recommended 2=Recommended 3=Strongly recommended
1. LEAs/schools will create a culture that promotes safety, community, and collaboration amongst all stakeholders including faculty, parents and caregivers, and the com-munity.
Rating:
1=Not recommended 2=Recommended 3=Strongly recommended
1 2 3
Evidence Level: Promising
Summary of Research:
Academic achievement seems to be impacted42,43 by a school climate and culture that addresses not only academic needs, but also fosters students’ feelings of safety, addresses health and mental health issues, and establishes high expectations for academic success. It is important to develop strong partnerships with parents and families, businesses, faith-based organizations, and youth development agencies to address these priorities beyond the school day. In addition, teacher effectiveness tends to improve more over time when teachers are working in supportive professional environments as opposed to when they are working in less supportive contexts.44
Additional Information for Consideration:
School achievement data and school improvement plans.
Guiding questions:
• Are we satisfied with the evidence level of this strategy to create a positive school climate and culture?
• What districts/schools have successfully changed the culture and how did that affect student achievement?
• What can be done to support districts as they identify areas in their culture that need to be im-proved and develop a plan for doing so?
• What can be done to support districts as they seek to establish partnerships with outside entities in their community?
• Can or should this strategy be used in conjunction with other strategies, activities, or interven-tions?
• What is the cost/benefit of utilizing this strategy?
DRAFT

41
Selected Citations:
42Anderson-Butcher, D., Iachini, A. L., Ball, A., Barke, S., & Martin, L. D. (2016). A University–School Part-nership to Examine the Adoption and Implementation of the Ohio Community Collaboration Model in One Urban School District: A Mixed-Method Case Study. Journal of Education for Students Placed at Risk (JESPAR), 1-15.
43Tichnor-Wagner, A., & Allen, D. (2016). Accountable for Care: Cultivating Caring School Communities in Urban High Schools. Leadership and Policy in Schools, 1-42.
44Kraft, M. A., & Papay, J. P. (2014). Can professional environments in schools promote teacher develop-ment? Explaining heterogeneity in returns to teaching experience. Educational Evaluation and Policy Analysis, 36(4), 476-500.
2. LEAs/schools will create a climate of change evidenced by visible improvements early in the turnaround pro-cess.
Rating:
1=Not recommended 2=Recommended 3=Strongly recommended
1 2 3
Evidence Level: Promising
Summary of Research:
A common strategy of successful turnaround schools is to implement visible changes that can be easi-ly recognized as improvements and accomplished quickly. Although the changes made depend upon the school, changes can oftentimes quickly occur in the areas of use of time, resources, the physical plant, and student discipline.45
Additional Information for Consideration:
School achievement data and school improvement plans.
Guiding questions:
• Are we satisfied with the evidence level of this strategy of creating a climate of change?
• What districts/schools instituted changes that could be accomplished quickly and was that suc-cessful in impacting student achievement?
• What can be done to support districts as they make decisions regarding what types of positive changes could be made quickly?
• Can or should this strategy be used in conjunction with other strategies, activities, or interven-tions?
• What is the cost/benefit of utilizing this strategy?
DRAFT

42
Selected Citation:
45Herman, R., Dawson, P., Dee, T., Greene, J., Maynard, R., Redding, S., and Darwin, M. (2008). Turning Around Chronically Low-Performing Schools: A practice guide (NCEE #2008-4020). Washington, DC: National Center for Education Evaluation and Regional Assistance, Institute of Education Sciences, U.S. Department of Education. Retrieved from http://ies.ed.gov/ncee/wwc/publica-tions/practiceguides.
DRAFT

43
SEA Voting and Consensus Rating FormThis form is used to document the results of consensus ratings by the self-study team. The facilitator leads the team in consensus voting which consists of several steps:
1. Vote. Ask each team member to provide a numerical ranking (1-3) for each of the areas.
2. Identify frequency. Identify the most frequent number (if three team members vote 3, five vote 2, and two vote 1, the most frequent number that team members votes is 2).
3. Discuss the rationale of the high frequency number. Ask a team member who selected the high frequency number to talk about what motivated that vote.
4. Discuss the rationale of lower frequency numbers. Ask other team members to talk about why they voted in a particular way.
5. Vote. Use numeric voting a second time. Team members may change their votes based on the discussion.
6. Record rating on this form. If there is a consensus (typically determined by majority vote), record the high frequency number below. If consensus is not reached (there is a tie), continue discussing and voting until consensus is reached.
7. Continue across areas of the self-study guide and include strategies and interventions submitted by team members.
SEA Self-Study Team:
Facilitator: ____________________________________________________________________
Team Member: ____________________________________________________________________
Team Member: ____________________________________________________________________
Team Member: ____________________________________________________________________
Team Member: ____________________________________________________________________
Team Member: ____________________________________________________________________
DRAFT

44
SEA Consensus Form:
NR = Not Recommended R = Recommended SR = Strongly Recommended
Scoring Guide Area Consensus Rating NR R SR
1. Implementing Systemic Change Strategy/Int. 1 (reconstitution) 1 2 3
Strategy/Int. 2 (transformation) 1 2 3
Strategy/Int. 3 (transfer control) 1 2 3
Strategy/Int. 4 (magnet) 1 2 3
2. Establishing Strong Leadership Strategy/Int. 1 (principal commitment) 1 2 3
Strategy/Int. 2 (principal behaviors) 1 2 3
Strategy/Int. 3 (dist. leadership) 1 2 3
Strategy/Int. 4 (turnaround program) 1 2 3
3. Improving Academic Instruction and Intervention
Strategy/Int. 1 (review curriculum) 1 2 3
Strategy/Int. 2 (analyze data) 1 2 3
Strategy/Int. 3 (progress monitor) 1 2 3
4. Developing and Retaining a High Quality Staff
Strategy/Int. 1 (committed staff) 1 2 3
Strategy/Int. 2 (coaches) 1 2 3
Strategy/Int. 3 (career continuum) 1 2 3
DRAFT
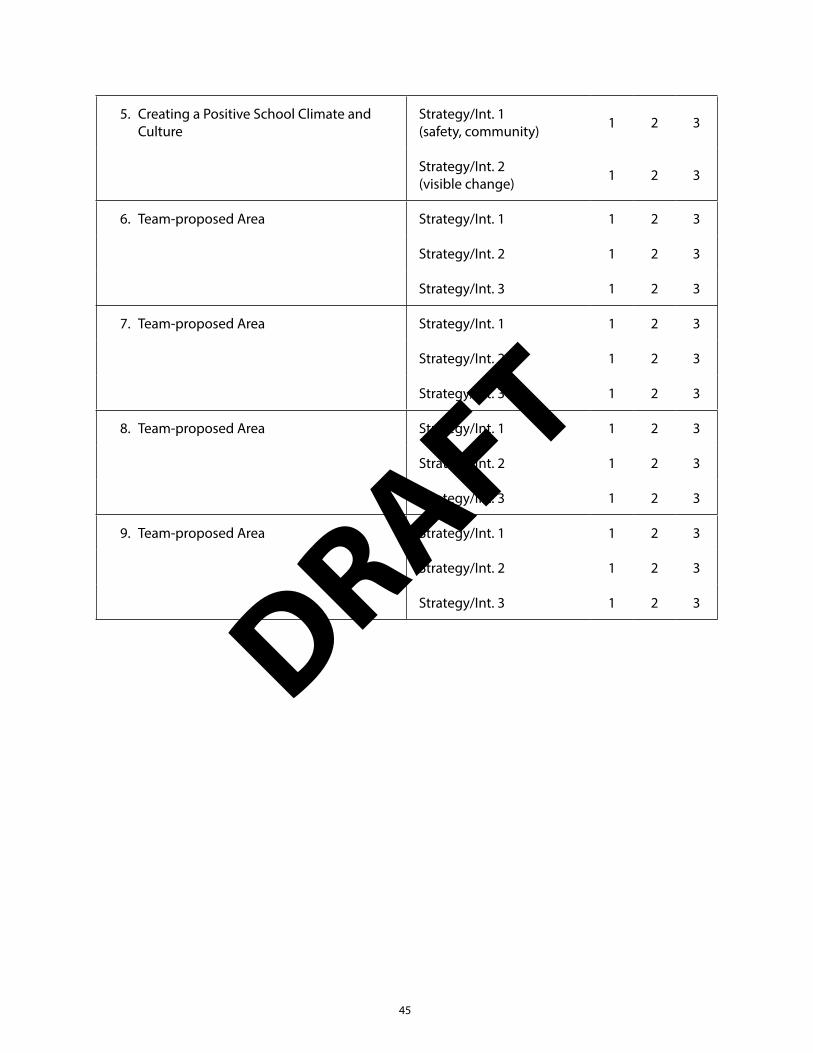
45
5. Creating a Positive School Climate and Culture
Strategy/Int. 1 (safety, community) 1 2 3
Strategy/Int. 2 (visible change) 1 2 3
6. Team-proposed Area Strategy/Int. 1 1 2 3
Strategy/Int. 2 1 2 3
Strategy/Int. 3 1 2 3
7. Team-proposed Area Strategy/Int. 1 1 2 3
Strategy/Int. 2 1 2 3
Strategy/Int. 3 1 2 3
8. Team-proposed Area Strategy/Int. 1 1 2 3
Strategy/Int. 2 1 2 3
Strategy/Int. 3 1 2 3
9. Team-proposed Area Strategy/Int. 1 1 2 3
Strategy/Int. 2 1 2 3
Strategy/Int. 3 1 2 3
DRAFT

46
SEA Planning Form(to be completed by the facilitator)
After the SEA Voting and Consensus Rating Form has been completed, the facilitator will begin comple-tion of this form by leading a discussion with the group about priorities for action, based on the rec-ommended strategies/interventions and priorities expressed by team members during the discussion of each area. The discussion may also include next steps for developing and disseminating resources to LEAs. Any challenges and ideas to meet those challenges may also be captured.
AREA:
1. Based on group discussion and consensus ratings, list the top priorities pertaining to the recommendations of strategies/interventions for school improvement.
2. What are next steps in addressing the priorities? Consider timelines and who will be responsi-ble.
3. What resources need to be provided for LEAs? Consider timelines and who will be responsi-ble for development and dissemination.
4. What potential challenges are anticipated? How will they be addressed? Who will be respon-sible for addressing these challenges?
5. Who will be responsible for ensuring that priorities and resource development and dissemi-nation are occurring according to the established timeline?
DRAFT

47
Appendix A. Annotated BibliographyThis appendix describes key references that provide additional support for each of the Scoring Guide areas.
Scoring Guide Area 1: Implementing Systemic ChangeStrunk, K. O., Marsh, J. A., Hashim, A. K., & Bush-Mecenas, S. (2016). Innovation and a Return to the
Status Quo A Mixed-Methods Study of School Reconstitution. Educational Evaluation and Policy Analysis, 0162373716642517.
This study of a small set of schools that were reconstituted in an urban area (pg. 555) found that students in reconstituted schools experience sizable and significant gains in ELA during the first two years of reconstitution, but insignificant effects for math. Changes in the state-wide assessment prevented these schools from being studied in subsequent years (pg. 556); however, case study data reflected that while reconstitution initially improves the student achievement at the school, the effects diminish over time (pg. 570). The authors suggest that it may be helpful for districts to maintain support in the form of funding and providing other resources for several years (pg. 571).
Borman, G. D., Hewes, G. M., Overman, L. T., & Brown, S. (2003). Comprehensive school reform and achievement: A meta-analysis. Review of educational research, 73(2), 125-230.
The authors note that there are limitations on the overall quantity and quality of the research base; however, the effects of the comprehensive school reform model appear promising. Schools that implemented the model for five years or more showed particularly strong effects (pg. 125).
May, H., & Supovitz, J. A. (2006). Capturing the cumulative effects of school reform: An 11-year study of the impacts of America’s Choice on student achievement. Educational Evaluation and Policy Analysis, 28(3), 231-257.
The authors present the results of an 11-year longitudinal study of the America’s Choice comprehen-sive school reform design focused on student learning gains. The study was conducted in Rochester, New York and compared test scores of students attending America’s Choice schools with the scores of students who attended other schools and students who attended the same schools before America’s Choice was implemented. There were significant annual effects, which accumulated over time in the elementary and middle grades (pg. 231). This study also found that over time, particularly after the fifth year of implementation, the effects dropped off and that although the effects were significant, students who were working below grade level did not catch up with grade-level peers (pg. 253). The America’s Choice model emphasizes ongoing assessment and differentiation of instruction (252).
Corbett, J. (2015). Chartering Turnaround: Leveraging Public Charter School Autonomy to Address Failure. National Alliance for Public Charter Schools.
The authors reflect that only a few districts or schools have chosen to restart schools as char-ters. Case studies indicate several benefits of restarting a school as a charter including the free-dom to hire, place, and remove staff; provide professional development and incentive; to use time as deemed best for students; adopt curriculum and implement other academic services; allocate dollars to priority areas and to own and maintain facilities (pg. 20). Case studies reflect improvements in student performance in some schools (pg. 12).
DRAFT

48
Herman, R. (2012). Scaling school turnaround. Journal of Education for Students Placed at Risk (JESPAR), 17(1-2), 25-33.
The author reflects that evidence regarding the effects of charter schools and education man-agement organizations focuses on primarily on charter schools in general. Student achieve-ment results are mixed when comparing student performance in charter schools to that of students in other schools ((pg. 27). It is unclear if true flexibility is afforded to charter schools that are low-performing or if that flexibility matters when it comes to student achievement (pg. 28).
Blank, R. K., Dentler, R., Baltzell, D. C., Chabotar, K (1983). Survey of magnet schools. Analyzing a model for quality integrated education. Final Report of a National Study 10-11 (U.S.Dept. of Ed.).
The authors examine using magnet programs to improve the quality of education in urban areas and also to facilitate integration of schools. They note that “While desegregation does not ‘predict’ quality, within magnets a racial balance does predict academic gains. Integration and quality are highly associated; each is a correlative facet of effectiveness,” (pg. 134). A variety of factors in success are noted for schools that were studied. These include leadership of the principal, parental support, coordinated instructional program, and use of community resources (pg. 403, 412).
Bifulco, R., Cobb, C. D., Bell, C. (2008). Do magnet schools outperform traditional public schools and re-duce the achievement gap? The case of Connecticut’s interdistrict magnet school program. Oc-casional Paper No. 167. New York: National Center for the Study of Privatization in Education.
Results of a study conducted in Connecticut’s central cities indicate that “attendance at an interdistrict magnet high school has positive effects on the math and reading achievement of central city students and that interdistrict magnet middle schools have positive effects on reading achievement,” (pg. 323).
Gamoran, A. (1996). Student achievement in public magnet, public comprehensive, and private city high schools. Educational Evaluation and Policy Analysis 18, 1–18.
The author reflects that results of a study in American cities indicating that magnet schools were more effective than public comprehensive high schools in raising proficiency in science, reading and social studies (pg 1). In addition, principals of magnet schools reported “slightly more posi-tive academic climates, on average, than principals in comprehensive schools,” (pg. 8).
Kahlenberg, R. D. (2009). Turnaround schools that work: Moving beyond separate but equal. Century Foundation.
The author states that there are “a number of studies over the past quarter-century that have found that magnet schools have higher levels of achievement than do other schools, and produce faster achievement gains in most subjects” (pg. 8). In addition, the magnet model is one where “schools seek to improve the performance of low-income students by drawing into a high-poverty school a contingent of middle class students” (pg. 8).
Poppell, J. and Hague, S. (2001). Examining indicators to assess the overall effectiveness of magnet schools: A study of magnet schools in Jacksonville, Florida. Paper presented at the American Educational Research Association, Seattle, Washington, 10-14.
A study of magnet schools in Duval County Public Schools in Florida found that academic achievement of students attending magnet schools exceeded that of students who attended nonmagnet schools. The schools were established as part of a plan to desegregate the district (pg. 1).
DRAFT

49
Scoring Guide Area 2: Establishing Strong LeadershipHerman, R., Dawson, P., Dee, T., Greene, J., Maynard, R., Redding, S., and Darwin, M. (2008). Turning
Around Chronically Low-Performing Schools: A practice guide (NCEE #2008-4020). Washington, DC: National Center for Education Evaluation and Regional Assistance, Institute of Education Sciences, U.S. Department of Education. Retrieved from http://ies.ed.gov/ncee/wwc/publica-tions/practiceguides.
This practice guide addressing turnaround of chronically low-performing schools recommends that strong leadership signal the need for dramatic change. It is important that principals “demonstrate commitment to developing a learning community for students and staff with the primary focus of the school on learning with staff and students working together toward that goal” (pg. 10). School leaders also signal change through clear communication, creating high expectations, sharing leadership and authority, demonstrating a willingness to make the same types of changes asked of their staff, identifying advocates with the staff, building a consensus that permeates the staff, ensuring that the maximum amount of classroom time is focused on instruction and establishing a cohesive culture (pg. 10-11). The current principal may be able to signal change; however, there may need to be a change in leadership to com-municate the need for a dramatic change in the school (pg. 11).
Osborne-Lampkin, L. T., Folsom, J. S., & Herrington, C. (2015). A Systematic Review of the Relationships between Principal Characteristics and Student Achievement. (REL 2016-091). Washington, DC: U.S. Department of Education, Institute of Education Sciences, National Center for Education Eval-uation and Regional Assistance, Regional Educational Laboratory Southeast. Retrieved from http://ies.ed.gov/ncee/edlabs.
The authors “describe the literature on principal behaviors linked to improved student achieve-ment” (pg. 9). The behaviors are organized into five domains which include instructional management, internal relations, organizational management, administrative duties, and external relations. Under instructional management, behaviors such as “monitoring and pro-viding feedback to teachers and student,” “having a vision for learning,” “providing support and professional development to teachers,” and “using data to drive decision-making,” were found to have positive relationships with student achievement. One study found that “promoting high standards for student learning (r = .55-.61) and having a rigorous curriculum (r =.42-.47) were most highly correlated with English language arts achievement in grades 3-5 and that performance accountability was significantly correlated in grade 3 (r = .37; Reardon, 2011)” (pg. 9-10). Eight of nine studies examined found a positive relationship between internal relations and student achievement while three of five studies reflected positive relationships between the time that principals spent on organizational management and student achievement. No studies found any relationship between principals’ time spent on administrative duties and student achievement. There were mixed results when it came to time spent devoted to exter-nal relationships and student achievement with school-community links n high-poverty and rural schools positively related to student achievement.
Louis, K. S., Leithwood, K., Wahlstrom, K. L., Anderson, S. E., Michlin, M., & Mascall, B. (2010). Learning from leadership: Investigating the links to improved student learning. Center for Applied Re-search and Educational Improvement/University of Minnesota and Ontario Institute for Studies in Education/University of Toronto, 42, 50.
The authors of this study examined leadership at the school, district, and state level with the purpose to “identify the nature of successful educational leadership and to better understand how such leadership can improve educational practices and student learning” (pg. 7). At the
DRAFT

50
school level, the authors reflected that among other findings that “collective leadership has a stronger influence on student achievement than individual leadership” (pg. 19). Data suggests that “collective leadership has modest but significant indirect effects on student achievement” (pg. 28) as it positively effects teacher variables such as work setting and motivation which, in turn, impact student achievement.
Heck, R. H., & Hallinger, P. (2009). Assessing the contribution of distributed leadership to school im-provement and growth in math achievement. American Educational Research Journal, 46(3), 659-689.
The authors of this study examined the relationship between distributed leadership and academic capacity when observed over time and how distributed leadership impacts school improvement and subsequent growth in math (pg. 677). They “found support for the hypoth-esis that school leadership and capacity building are mutually reinforcing in their effects on each other over time,” and that “changes in these mutually reinforcing constructs were also positively associated with school growth rates in math. The effect size for change in academic capacity was almost 0.2” (pg. 679-680).
Osborne-Lampkin, L. T., Folsom, J. S., & Herrington, C. (2015). A Systematic Review of the Relationships between Principal Characteristics and Student Achievement. (REL 2016-091). Washington, DC: U.S. Department of Education, Institute of Education Sciences, National Center for Education Evaluation and Regional Assistance, Regional Educational Laboratory Southeast. Retrieved from http://ies.ed.gov/ncee/edlabs.
The authors examined a study investigating distributed or collaborative leadership. The study found that although there was no evidence of direct effect of collaborative or distributed lead-ership on student achievement, there was consistent indirect effects (pg. 12). The study found significant effect on changes in school academic capacity “which in turn had a significant effect on growth in student achievement in English language arts” (pg. 12).
Player, D., & Katz, V. (2016). Assessing School Turnaround: Evidence from Ohio. The Elementary School Journal, 116(4), 675-698.
The authors of this study examined “a sample of 20 Ohio schools that participated in a school turnaround program and found that participating schools experienced meaningful improve-ments in student achievement after completing the two-year program” (pg. 675). These schools investigated the implementation of a School Turnaround Specialist Program (STSP) where it was required that the principal and at least half of the school’s prior staff would be replaced. That said, the principal was replaced in only six of the 20 schools (pg. 691). Profes-sional development to the principal and other leaders of the school the summer before the program was implemented and considerable support was provided to the principals through mentoring (pg. 679). “The schools examined as a part of this study demonstrated statistically and practically significant growth in student achievement within 2 years of participating in STSP” (pg. 694).
DRAFT

51
Scoring Guide Area 3: Improving Academic Instruction and InterventionHerman, R., Dawson, P., Dee, T., Greene, J., Maynard, R., Redding, S., and Darwin, M. (2008). Turning
Around Chronically Low-Performing Schools: A practice guide (NCEE #2008-4020). Washington, DC: National Center for Education Evaluation and Regional Assistance, Institute of Education Sciences, U.S. Department of Education. Retrieved from http://ies.ed.gov/ncee/wwc/publica-tions/practiceguides.
The practice guide states that a “comprehensive curriculum review can ensure that the cur-riculum aligns with state and local standards and meets the needs of all students (pg. 19). In addition, the What Works Clearinghouse establishes levels of evidence for assessing the quality of evidence supporting educational programs and practices (pg. 3).
The practice guide also indicates that schools need to “examine student achievement data to identify gaps and weaknesses in student learning….they can examine student learning through standards-based assessments and classroom assessments” (pg. 17). In addition, “school personnel can also look at data on factors that contribute to or impeded student learn-ing, such as attendance, discipline, and fiscal expenditures” (pg. 17).
Anderson, S., Leithwood, K., & Strauss, T. (2010). Leading data use in schools: Organizational conditions and practices at the school and district levels. Leadership and Policy in Schools, 9(3), 292-327.
“This study examined data use and conditions influencing data use by typical principals and teachers, as well as the relationship between data use and student performance” (pg. 292). The authors note that data should be accessible, timely, and valid. In addition, the staff should have the expertise to analyze the data correctly (pgs. 296-297). “It is not data use per se that affects the quality of teaching and learning; rather it is the appropriateness of actions actually taken based on data-informed decisions about the nature of the problem and how it might be solved (pg. 321).
van Geel, M., Keuning, T., Visscher, A. J., & Fox, J. P. (2016). Assessing the Effects of a School-Wide Da-ta-Based Decision-Making Intervention on Student Achievement Growth in Primary Schools. American Educational Research Journal, 0002831216637346.
This study investigated a school-wide data-based decision-making (DBDM) intervention in primary schools in The Netherlands. The intervention involved a two-year training course in DBDM for primary school teams (pg. 366). It was hypothesized that “implementing DBDM will lead to changes in teacher’s classroom practices, which in turn will lead to student achieve-ment growth in mathematics” (pg. 370). Results indicated that the intervention “can lead to a considerable improvement in the correct interpretation of student achievement data” (pg. 387) and there were positive effects on student achievement. In addition, the intervention “signifi-cantly improved the performances of students in low socioeconomic schools” (pgs. 360-361).
Hamilton, L., Halverson, R., Jackson, S., Mandinach, E., Supovitz, J., & Wayman, J. (2009). Using student achievement data to support instructional decision making (NCEE #2009-4067). Washington, DC: National Center for Education Evaluation and Regional Assistance, Institute of Education Sci-ences, U.S. Department of Education. Retrieved from http://ies.ed.gov/ncee/wwc/publications/practiceguides.
This practice guide recommends that a variety of data is collected about student learning. Multiple data sources are important because, “no single assessment provides all the infor-mation teachers need to make informed instructional decisions” (pg. 11). Data collected may include “curriculum-based unit tests; class projects; classwork and homework; records from
DRAFT
52
parent meetings and phone calls; classroom behavior charts; individualized education plans; and prior data from students’ cumulative folders” (pg. 13).
Herman, R., Dawson, P., Dee, T., Greene, J., Maynard, R., Redding, S., and Darwin, M. (2008). Turning Around Chronically Low-Performing Schools: A practice guide (NCEE #2008-4020). Washington, DC: National Center for Education Evaluation and Regional Assistance, Institute of Education Sciences, U.S. Department of Education. Retrieved from http://ies.ed.gov/ncee/wwc/publica-tions/practiceguides.
The practice guide reflects that schools in need of improvement should “monitor progress and make adjustments” (pg. 17). Once schools have identified areas that needed improvement and develop a plan to improve instruction, they should continually monitor progress. In the schools cited in the practice guide, all of them used benchmark assessments or in some way systematically monitored student achievement and progress toward instructional goals (pg. 17). This was done so instruction could be modified as needed.
Hamilton, L., Halverson, R., Jackson, S., Mandinach, E., Supovitz, J., & Wayman, J. (2009). Using student achievement data to support instructional decision making (NCEE #2009-4067). Washington, DC: National Center for Education Evaluation and Regional Assistance, Institute of Education Sci-ences, U.S. Department of Education. Retrieved from http://ies.ed.gov/ncee/wwc/publications/practiceguides.
This practice guide recommends that teachers interpret data, develop a hypothesis about how to improve student learning (pg. 14), modify instruction to test the hypothesis, and continue the cycle to increase student learning (pg. 15). Modifying instruction may mean allocating more time, reordering the curriculum, identifying particular students in need of assistance with specific skills, attempting to teach complex skills in new ways, improving alignment be-tween performance expectations among grade levels, or better aligning curricular alignment in the school (pg. 15).
Ysseldyke, J., Spicuzza, R., Kosciolek, S., Teelucksingh, E., Boys, C., & Lemkuil, A. (2003). Using a curricu-lum-based instructional management system to enhance math achievement in urban schools. Journal of Education for Students Placed at Risk, 8(2), 247-265.
The authors reflect that in order to improve teaching and learning, systematic, usable informa-tion regarding individual student performance and progress at the classroom level must be available (pg. 247). The study examined the “use of a computerized curriculum-based instruc-tional management system in addition to ongoing math instruction” (pg. 248). The system al-lowed teachers to differentiate instruction based on data. Results reflect a positive effect with students in classrooms implementing the system demonstrating more growth than students in classrooms that did not implement the system (pg. 259).
Foorman, B., Espinosa, A., Jackson, C., Wu, T. (2016b). Evaluating the screening accuracy of the Florida Assessments for Instruction in Reading (FAIR). (REL 2013-008). Washington, DC: U.S. Department of Education, Institute of Education Sciences, National Center for Education Evaluation and Regional Assistance, Regional Educational Laboratory Southeast. Retrieved from http://ies.ed.gov/ncee/edlabs/regions/southeast/pdf/REL_2013008.pdf.
This study examined the association between student performance on the 2012 Florida Comprehensive Assessment Test (FCAT) and their scores on the Florida Assessment for Instruc-tion in Reading (FAIR) during three assessment periods throughout the year. In addition, the authors looked at the effects of adding FAIR as a means of preventing errors while identifying students in need of intervention (pg. i). The study showed a strong correlation between FAIR
DRAFT

53
FCAT Success Probability (FSP) scores and performance on the 2012 FCAT at all grade levels. In addition, while FCAT could be used to identify students at risk/not at risk of meeting grade level standards the following school year, implementing FAIR as a progress monitoring tool throughout the school year decreased the percentage of students that were misidentified. For example, “using FAIR FSP scores (which combine the FAIR Reading Comprehension Assessment with the 2011 FCAT 2.0 score) reduced underidentification from 21 percent in grade 4 to 4-6 percent” (pg. 9).
Foorman, B., Kershaw, S., Petscher, Y. (2013). Using computer-adaptive assessments of literacy to monitor the progress of English learner students. (REL 2016-149). Washington DC: U.S. Department of Ed-ucation, Institute of Education Sciences, National Center for Education Evaluation and Regional Assistance, Regional Education Laboratory Southeast. Retrieved from http://ies.ed.gov/ncee/edlabs/regions/southeast/pdf/REL_2016149.pdf.
This study, conducted in a large urban district in Florida, examined how teachers and school staff administered computer-adaptive assessments of literacy to English learner students in grades 3-5 and how they used the assessments to monitor students’ growth in literacy skills. (pgs. 1-2). “Reliably measuring the literacy skills of English learner students can be challenging. Assessments typically address only grade-level proficiency, do not provide instructionally rel-evant information, and are not developmentally scaled to measure change over time” (pg. 2). The Florida Assessments for Instruction in Reading (FAIR) K-2 system was used because of the low level of English proficiency. The study found that teachers partnered with each other so that the assessment could be delivered within the required timeframe. Students’ literacy skills improved during the course of the year, but most students remained at the same grade level in the FAIR K-2 system at the end of the school year. Teachers found the data helpful as they could use it to plan and adjust instruction as needed.
DRAFT

54
Scoring Guide Area 4: Developing and Retaining a High-Quality StaffHerman, R., Dawson, P., Dee, T., Greene, J., Maynard, R., Redding, S., and Darwin, M. (2008). Turning
Around Chronically Low-Performing Schools: A practice guide (NCEE #2008-4020). Washington, DC: National Center for Education Evaluation and Regional Assistance, Institute of Education Sciences, U.S. Department of Education. Retrieved from http://ies.ed.gov/ncee/wwc/publica-tions/practiceguides.
The authors reflect that “the school leader needs to build a staff that is committed to the school’s improvement goals and qualified to meet them” (pg. 27). In addition, while not a focus of the specific recommendation in the practice guide, the author’s state that “professional development to help staff reach the school’s goals is an essential element of all school reform efforts and should be a part of turnaround schools,” (pg. 27).
Yoon, K. S., Duncan, T., Lee, S. W. Y., Scarloss, B., & Shapley, K. L. (2007). Reviewing the Evidence on How Teacher Professional Development Affects Student Achievement. Issues & Answers. REL 2007-No. 033. Regional Educational Laboratory Southwest (NJ1).
The authors examined nine studies that addressed the effect of teacher professional develop-ment on student achievement in mathematics, science, and reading or English language arts. Five of the studies were randomized controlled trials and met the What Works Clearinghouse evidence standards without reservation. Four studies met the evidence standards with reser-vations (pg. iii). In all studies the professional development provided was directly to teachers and not through a “train the trainer” approach. It was delivered by those who created the professional development. It was also found that studies that had “more than 14 hours of pro-fessional development showed a positive and significant effect on student achievement from professional development” (pg.”3). Further, the authors state that “First, professional develop-ment enhances teacher knowledge and skills. Second, better knowledge and skills improve classroom teaching. Third, improved teaching raises student achievement….If a teacher fails to apply new ideas from professional development to classroom instruction, students will not benefit from the teacher’s professional development” (pg. 4).
Early, D. M., Berg, J. K., Alicea, S., Si, Y., Aber, J. L., Ryan, R. M., & Deci, E. L. (2016). The Impact of Every Classroom, Every Day on High School Student Achievement: Results From a School-Random-ized Trial. Journal of Research on Educational Effectiveness, 9(1), 3-29.
Professional development was a key component of the set of instructional improvement interventions that were examined by this study. The study was conducted in high schools and included professional development for both mathematics and English teachers (pg. 3). The authors explain that professional development should be content focused, “meaning that it extends and intensifies teacher knowledge of a subject area and how children learn subject specific content” (pg. 5-6). Students attending treatment schools had higher math scores than those who attended schools not in the treatment group (pg. 19). Although the professional development component alone was not studied, it was a major component of the interven-tion set.
Antoniou, P., & Kyriakides, L. (2011). The impact of a dynamic approach to professional development on teacher instruction and student learning: Results from an experimental study. School Effec-tiveness and School Improvement, 22(3), 291-311.
This study investigated a dynamic integrated approach to professional development as opposed to a holistic approach. The dynamic approach focused on factors that describe the
DRAFT

55
teachers’ instructional role and are associated with student outcomes such as questioning, classroom assessment, and teacher-modeling while the holistic approach focused on teachers’ beliefs, experiences, and reflection on teaching practices (pgs. 291-292). The study found that teachers that had participated in the dynamic approach to professional development were more effective than those participating in the holistic approach model (pg. 303).
Saunders, W. M., Goldenberg, C. N., & Gallimore, R. (2009). Increasing achievement by focusing grade-level teams on improving classroom learning: A prospective, quasi-experimental study of Title I schools. American Educational Research Journal, 46(4), 1006-1033.
The authors conducted a quasi-experimental investigation focused on the effects of estab-lishing grade-level teams focused on student learning on student achievement. Professional development was provided to the principal and the teachers on establishing the teams and professional development occurred during team meetings. Student achievement at schools in the treatment group improved at a faster rate than student achievement at comparable schools who did not implement grade-level teams (pg. 1).
van Kuijk, M. F., Deunk, M. I., Bosker, R. J., & Ritzema, E. S. (2016). Goals, data use, and instruction: the effect of a teacher professional development program on reading achievement. School Effec-tiveness and School Improvement, 27(2), 135-156.
The authors of this study investigated whether student reading comprehension could be improved through a professional development program emphasizing goals, data use, and instruction (pg. 1). Second and third grade teachers received 40 hours of professional develop-ment over the course of the school year. They attended meetings after school and completed homework assignments. Participation was voluntary and free of charge; however, no addi-tional compensation was provided to teachers (pg. 140). The study found a positive effect on student achievement and at the end of the program “students in the experimental condition were more than half a year ahead of students in the control condition” (pg. 150).
Lockwood, J. R., Jennifer Sloan McCombs, and Julie Marsh. “Linking reading coaches and student achievement evidence from Florida middle schools.” Educational Evaluation and Policy Analysis 32.3 (2010): 372-388.
The authors conducted an evaluation of a statewide reading coach program in Florida middle schools. “Using achievement data from nearly 1,000 Florida middle schools from the 1997-1998 through 2005-2006 school years, we find that receiving a state-funded coach was associ-ated with statistically significant improvements in average annual reading achievement gains for two of the four cohorts of schools analyzed” (pg. 1). It is possible that the lack of effects for one of the cohorts (2006) may have been due to the fact that implementation had taken place for only one year. The other cohort (2004) was small and it is possible that idiosyncrasies of the schools came into play (pg. 383). Overall, “our results might be more supportive of positive coaching effects than the simple count of statistically significant findings would imply” (pg. 383).
Marsh, J. A., McCombs, J. S., & Martorell, P. (2010). How Instructional Coaches Support Data-Driven Decision Making. Educational Policy, 20(10), 1-37.
The authors examined how coaches support data-driven decision-making and “the extent to which these efforts are associated with improvements in teaching and student achieve-ment” (pg. 873). Data support was one of many activities to which coaches devoted their time. Coaches spent time administering and coordinating assessments, working with individual teachers, managing resources and materials, as well as working with groups of teachers. They
DRAFT
56
also, in some cases, devoted time to non-coaching tasks such as substitute teaching or per-forming “duties” such as lunch duty or bus duty. More experienced coaches spent more time in supporting data-driven decision-making. A positive relationship was found between data analysis and student achievement (pg. 898).
Matsumura, L. C., Garnier, H. E., & Spybrook, J. (2013). Literacy coaching to improve student reading achievement: A multi-level mediation model. Learning and Instruction, 25, 35-48.
The authors conducted a group-randomized trial in which schools within one district received a content-focused coach (CFC) and other schools continued with literacy coaching that was standard practice in the district (pg. 38). The CFC coaches helped teachers become more pro-ficient at planning, teaching, and reflecting on their lessons and emphasized the Questioning the Author (QtA) approach which is a discussion-based approach to reading comprehension (pg. 37). Coaches met with teachers in weekly grade level teams and monthly in their class-rooms. The study found that the CFC program had a positive effect on the quality of classroom discussions and “by the end of that academic year, students in the CFC schools demonstrated significantly higher reading achievement than their comparison group peers” (pg. 44). In addi-tion, the CFC program helped to close the gap between ELL and non-ELL students in the study (pg. 44).
Schacter, J., & Thum, Y. M. (2005). TAPping into high quality teachers: Preliminary results from the Teacher Advancement Program comprehensive school reform. School Effectiveness and School Improvement, 16(3), 327-353.
This study investigated whether schools implementing the Teacher Advancement Program (TAP) outperformed comparable schools on an annual basis, outperformed its controls, wheth-er fidelity to implementation influenced student achievement and teacher satisfaction with the program (pg. 334). “By aggressively recruiting new teachers, providing a career continuum, introducing teacher-led professional development, implementing rigorous teacher account-ability, and paying teachers based on their position, teaching skills and how much their students achieve, TAP schools change their organizational structure to support and reward high-quality instruction” (pg. 327). The student achievement in TAP schools grew significantly when compared to the controls although the magnitude of the gains varied by school and fidelity of implementation (pg. 327).DRAFT
57
Scoring Guide Area 5: Creating a Positive School Climate and CultureAnderson, S., Leithwood, K., & Strauss, T. (2010). Leading data use in schools: Organizational conditions
and practices at the school and district levels. Leadership and Policy in Schools, 9(3), 292-327.
This study examined a model designed to support school improvement efforts by empha-sizing youth development, parent and family engagement and support, health and social services and community partnerships (pg. 192). The authors looked at the types of capacity-re-lated innovations developed to support the model, whether school-level perceptions improve throughout implementation, and whether or not school-level indicators of academic achieve-ment improve over the course of implementation. The study found that roles and responsibil-ities of staff changed to focus on the model and that innovations occurred that resulted in the use of data for planning. There was an improvement in the perception of the school climate and in academic motivation and implementation resulted in increased student achievement (pg. 198).
Tichnor-Wagner, A., & Allen, D. (2016). Accountable for Care: Cultivating Caring School Communities in Urban High Schools. Leadership and Policy in Schools, 1-42.
The authors of this study examined the caring practices in two higher performing and two lower performing urban high schools. It was found that “higher performing schools demon-strated caring communities, where interpersonal relationships and high academic expecta-tions were prevalent throughout the school” (pg. 406). Factors such as “strong leadership sup-port, caring as a core school value, and abundant curricular and extracurricular structures” (pg. 406) were less prevalent in lower performing schools that had only isolated instances of care.
Kraft, M. A., & Papay, J. P. (2014). Can professional environments in schools promote teacher develop-ment? Explaining heterogeneity in returns to teaching experience. Educational Evaluation and Policy Analysis, 36(4), 476-500.
The authors examined whether a supportive professional environment is associated with teacher improvement over time (pg. 476). The professional environment included factors such as the extent to which the school was a safe environment and order prevailed, the opportunity for peer collaboration, the support of the principal, the opportunity for teachers to participate in professional development, the respect, openness, and commitment to student achievement and a teacher evaluation process that provided teachers with meaningful feedback which could be used to improve instruction (pg. 480). The study concluded that teachers “working in more supportive professional environments improve their effectiveness more over time than teachers working in less supportive environments” (pg. 476).
Herman, R., Dawson, P., Dee, T., Greene, J., Maynard, R., Redding, S., and Darwin, M. (2008). Turning Around Chronically Low-Performing Schools: A practice guide (NCEE #2008-4020). Washington, DC: National Center for Education Evaluation and Regional Assistance, Institute of Education Sciences, U.S. Department of Education. Retrieved from http://ies.ed.gov/ncee/wwc/publica-tions/practiceguides.
The practice guide recommends providing “visible improvements early in the turnaround process” (pg. 22). These can include making improvements to the physical environment such as painting, ensuring the school building and grounds are clean, and fixing anything that is broken (pg. 25). In addition, establishing a safe and orderly environment by implementing an approach to discipline that demonstrates the presence of administrators and safety officers, in-volves parents, and provides a means of dispensing discipline swiftly and fairly can also impact student learning and be implemented fairly quickly.
DRAFT

58
ReferencesAnderson, S., Leithwood, K., & Strauss, T. (2010). Leading data use in schools: Organizational conditions
and practices at the school and district levels. Leadership and Policy in Schools, 9(3), 292-327.
Anderson-Butcher, D., Iachini, A. L., Ball, A., Barke, S., & Martin, L. D. (2016). A University–School Part-nership to Examine the Adoption and Implementation of the Ohio Community Collaboration Model in One Urban School District: A Mixed-Method Case Study. Journal of Education for Students Placed at Risk (JESPAR), 1-15.
Antoniou, P., & Kyriakides, L. (2011). The impact of a dynamic approach to professional development on teacher instruction and student learning: Results from an experimental study. School Effec-tiveness and School Improvement, 22(3), 291-311.
Bifulco, R., Cobb, C. D., Bell, C. (2008). Do magnet schools outperform traditional public schools and re-duce the achievement gap? The case of Connecticut’s interdistrict magnet school program. Oc-casional Paper No. 167. New York: National Center for the Study of Privatization in Education.
Blank, R. K., Dentler, R., Baltzell, D. C., Chabotar, K (1983). Survey of magnet schools. Analyzing a model for quality integrated education. Final Report of a National Study 10-11 (U.S.Dept. of Ed.).
Borman, G. D., Hewes, G. M., Overman, L. T., & Brown, S. (2003). Comprehensive school reform and achievement: A meta-analysis. Review of educational research, 73(2), 125-230.
Corbett, J. (2015). Chartering Turnaround: Leveraging Public Charter School Autonomy to Address Failure. National Alliance for Public Charter Schools.
Early, D. M., Berg, J. K., Alicea, S., Si, Y., Aber, J. L., Ryan, R. M., & Deci, E. L. (2016). The Impact of Every Classroom, Every Day on High School Student Achievement: Results From a School-Random-ized Trial. Journal of Research on Educational Effectiveness, 9(1), 3-29.
Foorman, B., Espinosa, A., Jackson, C., Wu, T. (2016b). Evaluating the screening accuracy of the Florida Assessments for Instruction in Reading (FAIR). (REL 2013-008). Washington, DC: U.S. Department of Education, Institute of Education Sciences, National Center for Education Evaluation and Regional Assistance, Regional Educational Laboratory Southeast. Retrieved from http://ies.ed.gov/ncee/edlabs/regions/southeast/pdf/REL_2013008.pdf.
Foorman, B., Kershaw, S., Petscher, Y. (2013). Using computer-adaptive assessments of literacy to monitor the progress of English learner students. (REL 2016-149). Washington DC: U.S. Department of Ed-ucation, Institute of Education Sciences, National Center for Education Evaluation and Regional Assistance, Regional Education Laboratory Southeast. Retrieved from http://ies.ed.gov/ncee/edlabs/regions/southeast/pdf/REL_2016149.pdf.
Gamoran, A. (1996). Student achievement in public magnet, public comprehensive, and private city high schools. Educational Evaluation and Policy Analysis 18, 1–18.
Heck, R. H., & Hallinger, P. (2009). Assessing the contribution of distributed leadership to school im-provement and growth in math achievement. American Educational Research Journal, 46(3), 659-689.
DRAFT

59
Hamilton, L., Halverson, R., Jackson, S., Mandinach, E., Supovitz, J., & Wayman, J. (2009). Using student achievement data to support instructional decision making (NCEE #2009-4067). Washington, DC: National Center for Education Evaluation and Regional Assistance, Institute of Education Sci-ences, U.S. Department of Education. Retrieved from http://ies.ed.gov/ncee/wwc/publications/practiceguides.
Herman, R. (2012). Scaling school turnaround. Journal of Education for Students Placed at Risk (JESPAR), 17(1-2), 25-33.
Herman, R., Dawson, P., Dee, T., Greene, J., Maynard, R., Redding, S., and Darwin, M. (2008). Turning Around Chronically Low-Performing Schools: A practice guide (NCEE #2008-4020). Washington, DC: National Center for Education Evaluation and Regional Assistance, Institute of Education Sciences, U.S. Department of Education. Retrieved from http://ies.ed.gov/ncee/wwc/publica-tions/practiceguides.
Kahlenberg, R. D. (2009). Turnaround schools that work: Moving beyond separate but equal. Century Foundation.
Kraft, M. A., & Papay, J. P. (2014). Can professional environments in schools promote teacher develop-ment? Explaining heterogeneity in returns to teaching experience. Educational Evaluation and Policy Analysis, 36(4), 476-500.
Lockwood, J. R., Jennifer Sloan McCombs, and Julie Marsh. “Linking reading coaches and student achievement evidence from Florida middle schools.” Educational Evaluation and Policy Analysis 32.3 (2010): 372-388.
Louis, K. S., Leithwood, K., Wahlstrom, K. L., Anderson, S. E., Michlin, M., & Mascall, B. (2010). Learning from leadership: Investigating the links to improved student learning. Center for Applied Re-search and Educational Improvement/University of Minnesota and Ontario Institute for Studies in Education/University of Toronto, 42, 50.
Marsh, J. A., McCombs, J. S., & Martorell, P. (2010). How Instructional Coaches Support Data-Driven Decision Making. Educational Policy, 20(10), 1-37.
Matsumura, L. C., Garnier, H. E., & Spybrook, J. (2013). Literacy coaching to improve student reading achievement: A multi-level mediation model. Learning and Instruction, 25, 35-48.
May, H., & Supovitz, J. A. (2006). Capturing the cumulative effects of school reform: An 11-year study of the impacts of America’s Choice on student achievement. Educational Evaluation and Policy Analysis, 28(3), 231-257.
Osborne-Lampkin, L. T., Folsom, J. S., & Herrington, C. (2015). A Systematic Review of the Relationships between Principal Characteristics and Student Achievement. (REL 2016-091). Washington, DC: U.S. Department of Education, Institute of Education Sciences, National Center for Education Eval-uation and Regional Assistance, Regional Educational Laboratory Southeast. Retrieved from http://ies.ed.gov/ncee/edlabs.
Player, D., & Katz, V. (2016). Assessing School Turnaround: Evidence from Ohio. The Elementary School Journal, 116(4), 000-000.
Poppell, J. and Hague, S. (2001). Examining indicators to assess the overall effectiveness of magnet schools: A study of magnet schools in Jacksonville, Florida. Paper presented at the American Educational Research Association, Seattle, Washington, 10-14.
DRAFT

60
Saunders, W. M., Goldenberg, C. N., & Gallimore, R. (2009). Increasing achievement by focusing grade-level teams on improving classroom learning: A prospective, quasi-experimental study of Title I schools. American Educational Research Journal, 46(4), 1006-1033.
Schacter, J., & Thum, Y. M. (2005). TAPping into high quality teachers: Preliminary results from the Teacher Advancement Program comprehensive school reform. School Effectiveness and School Improvement, 16(3), 327-353.
Strunk, K. O., Marsh, J. A., Hashim, A. K., & Bush-Mecenas, S. (2016). Innovation and a Return to the Status Quo A Mixed-Methods Study of School Reconstitution. Educational Evaluation and Policy Analysis, 0162373716642517.
Tichnor-Wagner, A., & Allen, D. (2016). Accountable for Care: Cultivating Caring School Communities in Urban High Schools. Leadership and Policy in Schools, 1-42.
van Geel, M., Keuning, T., Visscher, A. J., & Fox, J. P. (2016). Assessing the Effects of a School-Wide Da-ta-Based Decision-Making Intervention on Student Achievement Growth in Primary Schools. American Educational Research Journal, 0002831216637346.
van Kuijk, M. F., Deunk, M. I., Bosker, R. J., & Ritzema, E. S. (2016). Goals, data use, and instruction: the effect of a teacher professional development program on reading achievement. School Effec-tiveness and School Improvement, 27(2), 135-156.
What Works Clearinghouse. (n.d.). http://ies.ed.gov/ncee/wwc/default.aspx.
Yoon, K. S., Duncan, T., Lee, S. W. Y., Scarloss, B., & Shapley, K. L. (2007). Reviewing the Evidence on How Teacher Professional Development Affects Student Achievement. Issues & Answers. REL 2007-No. 033. Regional Educational Laboratory Southwest (NJ1).
Ysseldyke, J., Spicuzza, R., Kosciolek, S., Teelucksingh, E., Boys, C., & Lemkuil, A. (2003). Using a curricu-lum-based instructional management system to enhance math achievement in urban schools. Journal of Education for Students Placed at Risk, 8(2), 247-265.
DRAFT