a semi-automated measuring system of brain diffusion and
TRANSCRIPT

TECHNICAL ADVANCE Open Access
A semi-automated measuring system ofbrain diffusion and perfusion magneticresonance imaging abnormalities inpatients with multiple sclerosis based onthe integration of coregistration and tissuesegmentation proceduresAlfredo Revenaz1, Massimiliano Ruggeri2, Marcella Laganà3, Niels Bergsland3,4, Elisabetta Groppo5,Marco Rovaris6 and Enrico Fainardi1*
Abstract
Background: Diffusion-weighted imaging (DWI) and perfusion-weighted imaging (PWI) abnormalities in patientswith multiple sclerosis (MS) are currently measured by a complex combination of separate procedures. Therefore,the purpose of this study was to provide a reliable method for reducing analysis complexity and obtainingreproducible results.
Methods: We implemented a semi-automated measuring system in which different well-known softwarecomponents for magnetic resonance imaging (MRI) analysis are integrated to obtain reliable measurements ofDWI and PWI disturbances in MS.
Results: We generated the Diffusion/Perfusion Project (DPP) Suite, in which a series of external software programs aremanaged and harmonically and hierarchically incorporated by in-house developed Matlab software to perform thefollowing processes: 1) image pre-processing, including imaging data anonymization and conversion from DICOM toNifti format; 2) co-registration of 2D and 3D non-enhanced and Gd-enhanced T1-weighted images in fluid-attenuatedinversion recovery (FLAIR) space; 3) lesion segmentation and classification, in which FLAIR lesions are at first segmentedand then categorized according to their presumed evolution; 4) co-registration of segmented FLAIR lesion in T1 spaceto obtain the FLAIR lesion mask in the T1 space; 5) normal appearing tissue segmentation, in which T1 lesion mask isused to segment basal ganglia/thalami, normal appearing grey matter (NAGM) and normal appearing white matter(NAWM); 6) DWI and PWI map generation; 7) co-registration of basal ganglia/thalami, NAGM, NAWM, DWI and PWImaps in previously segmented FLAIR space; 8) data analysis. All these steps are automatic, except for lesion segmentationand classification.
Conclusion: We developed a promising method to limit misclassifications and user errors, providing clinical researcherswith a practical and reproducible tool to measure DWI and PWI changes in MS.
Keywords: DPP Suite, Coregistration, Automatic segmentation, Automatic classification, DWI, PWI
* Correspondence: [email protected]à Operativa di Neuroradiologia, Dipartimento di Neuroscienze eRiabilitazione, Azienda Ospedaliero-Universitaria of Ferrara, Arcispedale S.Anna, Via Aldo Moro 8, 44124 Cona, Ferrara, ItalyFull list of author information is available at the end of the article
© 2016 Revenaz et al. Open Access This article is distributed under the terms of the Creative Commons Attribution 4.0International License (http://creativecommons.org/licenses/by/4.0/), which permits unrestricted use, distribution, andreproduction in any medium, provided you give appropriate credit to the original author(s) and the source, provide a link tothe Creative Commons license, and indicate if changes were made. The Creative Commons Public Domain Dedication waiver(http://creativecommons.org/publicdomain/zero/1.0/) applies to the data made available in this article, unless otherwise stated.
Revenaz et al. BMC Medical Imaging (2016) 16:4 DOI 10.1186/s12880-016-0108-1

BackgroundThe role of diffusion-weighted imaging (DWI) andperfusion-weighted imaging (PWI) modalities in mul-tiple sclerosis (MS) has recently received increased at-tention due to the potential of these two advancedmagnetic resonance imaging (MRI) techniques in detect-ing the structural and hemodynamic characteristics ofMS-related focal [1–7] and diffuse [8–16] brain abnor-malities in gray and white matter, which characterize thewell-known heterogeneity of the disease [17]. In fact,although conventional MRI findings are currently con-sidered a valid surrogate marker for MS diagnosis andprogression in treated and untreated patients, their diag-nostic and prognostic value still remains very limitedgiven the inability of conventional MRI in identifying thespecific pathologic substrates of MS lesions [17]. Thus,it could be crucial to understand whether the detectionand quantification of focal and diffuse DWI and PWIchanges may help in recognizing the different mecha-nisms implicated in MS damage and, as a consequence,in improving diagnostic accuracy, early outcome predic-tion and response to treatment monitoring in MS. AsDWI and PWI can be easily integrated in the context ofMRI examination, this may have a large impact for rou-tine clinical setting and patient quality of life. Therefore,further studies are warranted to clarify the actual signifi-cance of DWI and PWI disturbances in MS. However,the evaluation of DWI and PWI alterations in MS isgenerally restricted to the research field and is currentlyperformed by different software programs, used separ-ately from each other with lack of standardization re-garding the overall process [1–16, 18, 19]. This impliesseveral steps including various co-registration and tis-sue/lesion segmentation tasks which make the analysisrather laborious, time-consuming and prone to inaccur-acies due to human intervention. These limitationscould explain why the results coming from previousstudies were not always concordant. In addition, thereare no large-scale studies investigating DWI and PWIabnormalities in MS focal lesions categorized accordingto different stages of their evolution (acute and chronic)[20]. Thus, a more integrated analysis process incorpor-ating all software packages employed in performing co-registration and tissue/lesion segmentation steps wouldbe beneficial. This approach should be based on theactivation of the different software modules according toa logical sequence leading to precise measurements ofDWI and PWI values in focal MS lesions, in normalappearing grey matter (NAGM) and in normal appearingwhite matter (NAWM). For these reasons, the pipelineproposed in this work consists in an implementation ofalready described algorithms [4, 6, 10, 13, 15] combinedaccording to a hierarchical order in a semi-automatedmanner. Although many automated methods have recently
been developed for MS lesion detection [21–23], we chosesemi-automated operations for the identification of focaldamage to minimize potential biases due to lesion mis-classification [18, 19], which could overcome operator-dependent misinterpretations related to visual inspection.On the other hand, the lack of clear standards renders itdifficult to judge the superiority of one approach over otheravailable choices [18, 19, 24]. Accordingly, we includedtools commonly used in the MS literature which havebeen demonstrated to be both efficient and accurate inco-registration and tissue/lesion segmentation proce-dures. Moreover, the investigators of our group havemany combined years of experience using these tools[18, 19, 24–26]. In this way, we sought to provide apromising tool for reducing analysis complexity andobtaining reproducible results.
MethodsDefinition and general description of the DPP Suiteand modulesThe process management system named Diffusion/Perfusion Project (DPP) described in the paper is anin-house developed suite written in Matlab (The Math-Works, Natick, MA, USA) and requiring the Image Pro-cessing Toolbox. The DPP is a collection of softwaremodules all related to MRI data management, sharing thesame GUI (Graphical User Interface) and exchanging datawith each other. DPP Suite integrates commonly usedsoftware tools which are able to perform different types ofdata analysis and management. The primary aim of DPPSuite is to create a uniform environment where it can bepossible to assess a considerably larger number of datafrom MS patients compared to the other current analysismethods, reducing as much as possible analysis com-plexity, time required and potential human errors. Themost relevant procedures manageable through DPPSuite are schematically presented in Fig. 1, where dataand operations are shown as a flowchart. In summary,DPP Suite operations include: 1) image pre-processing;2) registration of T1-weighted images; 3) lesion segmenta-tion and classification; 4) registration of lesion masks; 5)normal appearing tissue segmentation; 6) PWI and DWImap generation; 7) registration of tissue segmentation andquantitative MRI maps; 8) data analysis.
Pre-processingImage pre-processing starts with the automatic anonymi-zation of MRI sequences for each patient which areexported from a PACS database and copied in a local re-pository dynamically linked with the DPP Suite. Thisprocess aims at protecting patient identity during thewhole procedure. Furthermore, demographic data, result-ing analysis and patient identity are stored as a protectedfile controlled by the DPP Suite. The anonymization
Revenaz et al. BMC Medical Imaging (2016) 16:4 Page 2 of 16

procedure is performed by Image Processing ToolboxMatlab function with some adaptations. The original em-bedded task for data anonymization, called dicomanon,was modified generating a function called dpp_dicomanonthat can strengthen the patient data confidentiality level ifneeded. After anonymization, DICOM format [27] filesare converted in NIFTI format [28] using the StatisticalParametric Mapping (SPM) 8 toolbox (http://www.fil.ion.ucl.ac.uk/spm/) [29]. Notably, pre-processing is performedon a limited dataset that includes the following MRI se-quences: axial fluid-attenuated inversion recovery (FLAIR);two-dimensional (2D) axial non-enhanced T1-weightedspin-echo or three-dimensional (3D) non-enhanced T1gradient-echo; axial Gadolinium (Gd)-enhanced T1-weighted spin-echo; axial DWI and axial PWI. Therefore,before data conversion, a DPP function selects patientshaving all MRI sequences requested for analysis, excludingthose with incomplete radiological data. Concurrently, aset of report files containing a checklist of unavailable
sequences for each non-conforming patient is generated.In addition, all MRI data are reorganized in a storagestructure aimed at making a uniform data format, in-cluding sequences names, filenames or data storing andother details, that is independent of that given by differentMRI scanners (e.g. Philips, Siemens or GE), without modi-fications in information content.
Registration of T1-weighted imagesIn this first step (Fig. 2), both axial 2D non-enhancedT1-weighted spin-echo or 3D non-enhanced T1 gradient-echo and axial Gd-enhanced T1-weighted spin-echo areregistered in FLAIR space using an automated processbased on the employment of a DPP module invoking oneof the two following external software packages: SPM orFMRIB’s Linear Image Registration Tool (FLIRT) fromFMRIB Software Library (FSL) suite (http://fsl.fmrib.ox.ac.uk/fsl/fslwiki/flirt) [30, 31]. Although T2-weighted imagesare generally considered the most sensitive in detecting
Fig. 1 Flowchart of Diffusion/Perfusion Project (DPP) Suite. The DPP Suite is used for diffusion-weighted imaging (DWI) and perfusion-weightedimaging (PWI) measurements in focal and diffuse abnormalities in multiple sclerosis (MS) patients. OspFE = Ferrara Hospital; MRI = magneticresonance imaging; FLAIR = axial fluid-attenuated inversion recovery MRI images; T1 = 2D axial non-enhanced T1-weighted spin-Echo or 3Dnon-enhanced T1-weighted gradient-Echo MRI images; Gd T1 = Gadolinium-enhanced T1-weighted spin-Echo MRI images; r_T1 = registered2D axial non-enhanced T1-weighted spin-Echo or 3D non-enhanced T1-weighted gradient-Echo MRI images; r_Gd T1 = registered Gadolinium-enhanced T1-weighted spin-Echo MRI images; ROI = regions of interest; NAWM = normal appearing white matter; NAGM = normal appearinggrey matter; ADC = apparent diffusion coefficient; CBF = cerebral blood flow; CBV = cerebral blood volume; MTT = mean transit time
Revenaz et al. BMC Medical Imaging (2016) 16:4 Page 3 of 16

infratentorial lesions [32], FLAIR images serve for thefollowing lesion segmentation since they improve lesion/brain contrast due to the suppression of cerebrospinalfluid signal [33]. On the other hand, T1-weighted imagesallow the identification of MS T1 hypointense (blackholes) and T1 Gd-enhancing lesions as well as the evalu-ation of brain atrophy [17]. In this regard, it is well-accepted that 3D are superior to 2D T1 images in thedetermination of brain volume [34]. However, we chose toprocess also 2D T1 images since, in clinical practice, notall centers are equipped to routinely perform 3D T1 se-quences in MS patients. The choice between SPM andFSL FLIRT is user selectable.
Lesion segmentation and classificationThe development of automated techniques for lesiondetection is one of the most central challenges in MS re-search. Therefore, a number of approaches have recentlybeen proposed [21–23]. However, it is generally acceptedthat there are no automatic lesion segmentation methodswith 100 % reliability [18, 19]. This is the reason why aseries of semi-automated algorithms were designed and
tested in order to support and simplify lesion segmenta-tion and classification. This step is one of the most criticaland complex because it involves both human operationand automated processes. In fact, two basic operations areimplemented: a) semi-automatic lesion segmentation; b)semi-automatic lesion classification.
Semi-automatic lesion segmentationAs depicted in Fig. 3, this step is performed on FLAIRimages using Jim (Jim 6.0, Xinapse Systems, Leicester,UK; http://www.xinapse.com) [34] as an external soft-ware package. After visual identification, each lesion issemi-automatically segmented by a local threshold-basedtechnique. In addition, a region of interest (ROI) of theNAWM is manually outlined. The output of this processis an ROI file corresponding to the delineated areas.
Semi-automatic lesion classificationUsing the FLAIR-derived lesion ROI file, DDP Suiteautomatically masks the non-enhanced and Gd-enhancedT1-weighted images (Fig. 4). The DPP Suite then calcu-lates the intensity of each lesion in both non-enhanced
Fig. 2 An illustrative example of registration of T1-weighted images. SPM= Statistical Parametric Mapping; FSL = FMRIB Software Library; FLIRT = FMRIB’sLinear Image Registration Tool; FLAIR = axial fluid-attenuated inversion recovery MRI images; T1 = 2D axial non-enhanced T1-weighted spin-Echo or 3Dnon-enhanced T1-weighted gradient-Echo MRI images; Gd T1 = Gadolinium-enhanced T1-weighted spin-Echo MRI images; r_T1 = registered 2D axialnon-enhanced T1-weighted spin-Echo or 3D non-enhanced T1-weighted gradient-Echo MRI images; r_Gd T1 = registered Gadolinium-enhanced T1-weighted spin-Echo MRI images
Fig. 3 A descriptive example of semi-automated lesion segmentation process on fluid-attenuated inversion recovery (FLAIR) images. Segmentedhyperintense lesions in red; area used for NAWM mean intensity estimation in green
Revenaz et al. BMC Medical Imaging (2016) 16:4 Page 4 of 16

and Gd-enhanced T1-weighted sequence. Based on therecently proposed classification [20], the algorithm cat-egorizes each T2-weighted hyperintense lesion, basedon its intensity in four classes: 1) Gd-enhancing andT1-weighted isointense (C1); 2) Gd-enhancing and T1-weighted hypointense (C2); 3) non Gd-enhancing andT1-weighted isointense (C3); 4) non Gd-enhancing andT1-weighted hypointense, i.e. black holes (C4). As, inabsence of serial MRI examinations, lesion activity isdemonstrable only by Gd enhancement [35], C1 and C2type lesions are considered as acute, whereas C3 andC4 lesions are judged as chronic [36, 37]. The output ofthe process is a recombined ROI file enriched withclassification of each lesion given by a different colorcode for each lesion type and a descriptive text labelwhere the type and characteristics of the single lesionare briefly reported (Fig. 4). Lesion classification is ac-complished using a DPP algorithm based on a lesion in-tensity comparison to the NAWM ROI intensity level.The thresholds to identify the lesion classes are definedas a configurable multiplier of the standard deviation ofthe intensity values in the NAWM ROI.
ThreHigh ¼ �I default þMf ⋅St�dev INAWMð Þ ð1ÞThreLow ¼ �I default−Mf ⋅St�dev INAWMð Þ ð2Þ
Where Ī is the mean intensity of the NAWM and Mfis the multiplier factor and St_dev is the standard devi-ation calculation function. The mean intensity of ach le-sion is then calculated and compared with the twothresholds referred to in formulas (1) and (2) that arecalculated for both non-enhanced and Gd-enhanced T1-
weighted images. The automatic lesion classification al-gorithm performance is briefly presented in Fig. 5 todocument the accuracy of the procedure. The error per-centage of automatic classification was less than 1 % forC1 and C2 lesion classes and about 21 % and 23 % forC3 and C4 lesion classes, respectively. It is important tounderline that the low error percentage found for C1and C2 lesion classes could be related to the small num-ber of this type of lesions occurred in the selected pa-tients, as well as in all patients analyzed. Therefore,these results support the need of a visual correction forautomatic lesion classification. The output of the auto-matic lesion classification process is a text file in JimROI Analysis Tool format, containing all the ROI defini-tions and classifications. Automatic lesion classificationsare visually checked and revised by the operator. Thenew checked file is then automatically reloaded and con-verted by DDP Suite into different revised ROI files, in-cluding the lesions categorized as total lesions, lesionclasses (C1, C2, C3 and C4) and single lesion, which arethen used in the following steps.
Registration of lesion masksThis stage requires the creation of a lesion mask in theT1 space and is performed by SPM or FSL FLIRT exter-nal software packages invoked by a DPP module. Briefly,FLAIR images previously segmented are used to auto-matically produce a lesion mask that is coregistered inthe non-enhanced T1-weighted space to obtain a regis-tered lesion mask. When FLIRT is chosen, coregistrationis done applying to the lesion mask in the FLAIR spacethe transformation matrix generated by the registration
Fig. 4 A demonstrative example showing the automatic lesion classification process. FLAIR = axial fluid-attenuated inversion recovery MRI images;r_T1 = registered 2D axial non-enhanced T1-weighted spin-Echo or 3D non-enhanced T1-weighted gradient-Echo MRI images; r_Gd T1 = registeredGadolinium-enhanced T1-weighted spin-Echo MRI images. ROI = Region Of Interest; area used for NAWM mean intensity estimation in red
Revenaz et al. BMC Medical Imaging (2016) 16:4 Page 5 of 16

of FLAIR and T1. If SPM is selected, T1 is set as thereference image, FLAIR as source and the lesion maskas other. The result is a black and white lesion mask thatis a binarization of the brain lesion area where lesionsare white and the remaining brain tissue is black (Fig. 6).
Normal appearing tissue segmentationAs depicted in Fig. 7, DPP Suite invokes automatic seg-mentation of the basal ganglia and thalami via the externalFSL tool FMRIB’s Integrated Registration and Segmenta-tion Tool (FIRST) (http://fsl.fmrib.ox.ac.uk/fsl/fslwiki/first)
Fig. 5 Automatic lesion classification algorithm performance for a group of 15 randomly selected patients. The automatic classification algorithmis compared with classification of the same lesions performed visually by an expert. Vertical axis shows the error percentage over total number oflesions. Group 1 (>40) = patient group 1 was composed by 5 patients with more than 40 lesions; Group 2 (>20 ≤ 40) = patient group 2 was composedby 5 patients with more than 20 and less than 40 lesions; Group 3 (≤20) = patient group 3 was composed by 5 patients with less than 20 lesions;Total =mean values between group 1, 2 and 3; C1 = lesion class 1; C2 = lesion class 2; C3 = lesion class 3; C4 = lesion class 4
Fig. 6 A graphic example of registration of lesion masks. FLAIR = axial fluid-attenuated inversion recovery MRI images; T1 = 2D axial non-enhanced T1-weighted spin-Echo or 3D non-enhanced T1-weighted gradient-Echo MRI images; SPM= Statistical Parametric Mapping; FSL = FMRIB Software Library;FLIRT = FMRIB’s Linear Image Registration Tool; r_T1 = registered 2D axial non-enhanced T1-weighted spin-Echo or 3D non-enhanced T1-weighted
Revenaz et al. BMC Medical Imaging (2016) 16:4 Page 6 of 16

[38]. The input is the non-enhanced T1-weighted se-quence. The segmented basal ganglia structures includethe right and left caudate, putamen and globus pallidus.The following step is represented by the automatic seg-mentation of grey and white matter for which DPP Suiteinvokes FSL SIENAX (Structural Image Evaluationusing Normalization of Atrophy) (http://fsl.fmrib.ox.ac.uk/fsl/fslwiki/SIENA) [39]. In this case, the inputs arenon-enhanced T1-weighted sequence and registered T1lesion mask, whereas the output are two files includingNAGM and NAWM images obtained after subtractingregistered T1 lesion mask from non-enhanced T1-weighted. In addition, FSL SIENAX generates a reportfile including total brain tissue volume, as a whole andnormalized according to skull size, and normalized NAGMand NAWM volumes.
PWI map generationPWI studies are performed with a dynamic susceptibil-ity contrast (DSC) MRI first-pass bolus-tracking tech-nique using echo-planar gradient-echo T2* sequences.PWI analysis provides relative measurements of brainhemodynamic parameters such as Cerebral Blood Flow(CBF), Cerebral Blood Volume (CBV) and Mean TransitTime (MTT). CBF, CBV and MTT maps are generated bya singular value decomposition (SVD) deconvolution op-eration based on the measurement of an arterial inputfunction (AIF) [40]. The calculation of PWI maps is auto-matically performed by Jim Perfusion Analysis tool in-voked by DPP Suite. DSC images consist of a time-seriesof sequences, one volume for each time point, whichmonitor the concentration of an injected paramagneticcontrast agent transiting from the blood vessels to the
brain tissue. Therefore, AIF determination implies theknowledge of the exact volume where the contrast agentis perceptible in the brain (Contrast Arrival Point). Forthat reason, the DPP Suite implements an algorithm thatidentifies the contrast arrival volume number using JimStats. This algorithm evaluates the mean intensity involumes, using in subsequent steps the average intensityof the previous analyzed volumes, in order to reduce thenoise affecting the images. It detects when the differenceof mean intensity between two subsequent volumes ismore than an adjustable threshold. The threshold is notan absolute value or an absolute percent, but is a fractionof the difference between maximum and minimum inten-sity value measured in all volumes of the sequence. Thus,the threshold is less dependent from the volume intensityabsolute level.
DWI map generationDWI studies are often performed with a single-shotecho-planar T2 spin-echo sequence according to theStejskal-Tanner method [41]. The diffusion gradients areapplied in three orthogonal directions (x, y, z) with twob-values (0 and 1000 s/mm2) to form the isotropic DWIimages at b 1000 s/mm2. DWI analysis takes as input T2images and extracts from these images apparent Diffu-sion Coefficient (ADC) maps, related to each Cartesianaxis. More precisely, as reported elsewhere [42], ADC mapsare generated using T2-weighted images at b 0s/mm2 andisotropic DWI images at b 1000 s/mm2 obtained in all threeorthogonal directions. All calculations are automaticallyperformed by Jim Image Algebra tool invoked by DPP Suitecontrolling the entire process. The process output is anaverage ADC map, obtained calculating the mean of the
Fig. 7 An illustrative example of normal appearing tissue segmentation. T1 = 2D axial non-enhanced T1-weighted spin-Echo or 3D non-enhancedT1-weighted gradient-Echo MRI images; FSL = FMRIB Software Library; FIRST = FMRIB’s Integrated Registration and Segmentation Tool; SIENAX = StructuralImage Evaluation using Normalization of Atrophy; r_T1 = registered 2D axial non-enhanced T1-weighted spin-Echo or 3D non-enhanced T1-weightedgradient-Echo MRI images; NAGM=normal appearing grey matter; NAWM= normal appearing white matter
Revenaz et al. BMC Medical Imaging (2016) 16:4 Page 7 of 16
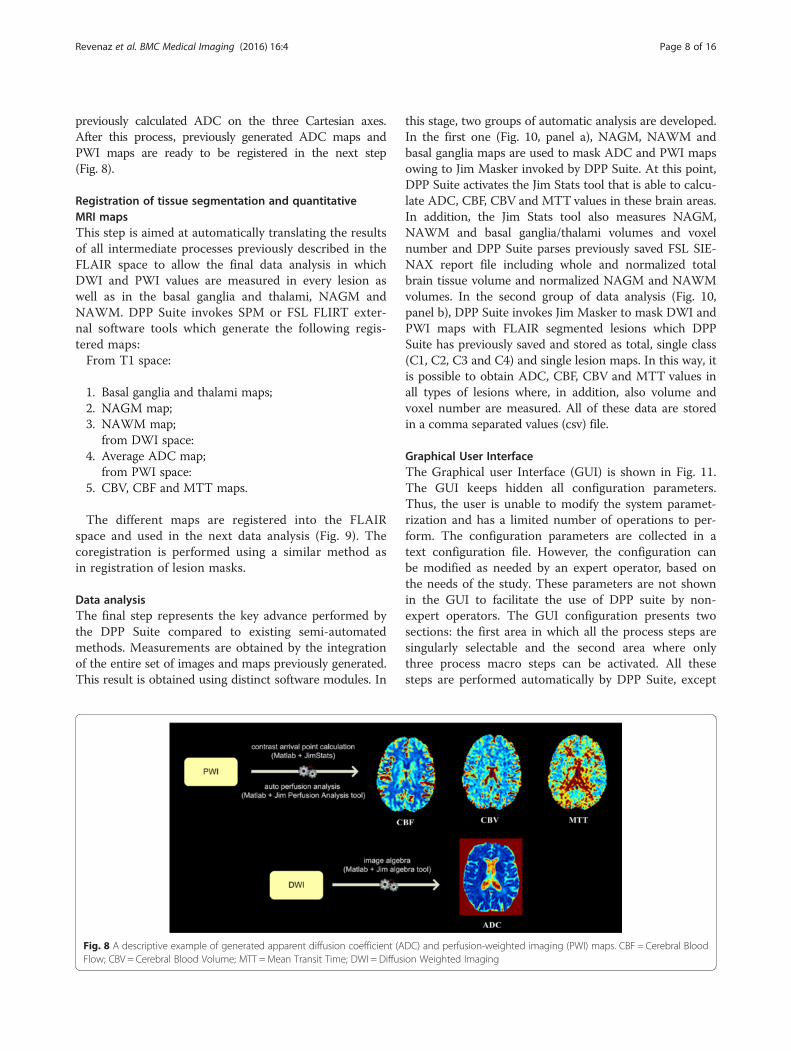
previously calculated ADC on the three Cartesian axes.After this process, previously generated ADC maps andPWI maps are ready to be registered in the next step(Fig. 8).
Registration of tissue segmentation and quantitativeMRI mapsThis step is aimed at automatically translating the resultsof all intermediate processes previously described in theFLAIR space to allow the final data analysis in whichDWI and PWI values are measured in every lesion aswell as in the basal ganglia and thalami, NAGM andNAWM. DPP Suite invokes SPM or FSL FLIRT exter-nal software tools which generate the following regis-tered maps:From T1 space:
1. Basal ganglia and thalami maps;2. NAGM map;3. NAWM map;
from DWI space:4. Average ADC map;
from PWI space:5. CBV, CBF and MTT maps.
The different maps are registered into the FLAIRspace and used in the next data analysis (Fig. 9). Thecoregistration is performed using a similar method asin registration of lesion masks.
Data analysisThe final step represents the key advance performed bythe DPP Suite compared to existing semi-automatedmethods. Measurements are obtained by the integrationof the entire set of images and maps previously generated.This result is obtained using distinct software modules. In
this stage, two groups of automatic analysis are developed.In the first one (Fig. 10, panel a), NAGM, NAWM andbasal ganglia maps are used to mask ADC and PWI mapsowing to Jim Masker invoked by DPP Suite. At this point,DPP Suite activates the Jim Stats tool that is able to calcu-late ADC, CBF, CBV and MTT values in these brain areas.In addition, the Jim Stats tool also measures NAGM,NAWM and basal ganglia/thalami volumes and voxelnumber and DPP Suite parses previously saved FSL SIE-NAX report file including whole and normalized totalbrain tissue volume and normalized NAGM and NAWMvolumes. In the second group of data analysis (Fig. 10,panel b), DPP Suite invokes Jim Masker to mask DWI andPWI maps with FLAIR segmented lesions which DPPSuite has previously saved and stored as total, single class(C1, C2, C3 and C4) and single lesion maps. In this way, itis possible to obtain ADC, CBF, CBV and MTT values inall types of lesions where, in addition, also volume andvoxel number are measured. All of these data are storedin a comma separated values (csv) file.
Graphical User InterfaceThe Graphical user Interface (GUI) is shown in Fig. 11.The GUI keeps hidden all configuration parameters.Thus, the user is unable to modify the system paramet-rization and has a limited number of operations to per-form. The configuration parameters are collected in atext configuration file. However, the configuration canbe modified as needed by an expert operator, based onthe needs of the study. These parameters are not shownin the GUI to facilitate the use of DPP suite by non-expert operators. The GUI configuration presents twosections: the first area in which all the process steps aresingularly selectable and the second area where onlythree process macro steps can be activated. All thesesteps are performed automatically by DPP Suite, except
Fig. 8 A descriptive example of generated apparent diffusion coefficient (ADC) and perfusion-weighted imaging (PWI) maps. CBF = Cerebral BloodFlow; CBV = Cerebral Blood Volume; MTT =Mean Transit Time; DWI = Diffusion Weighted Imaging
Revenaz et al. BMC Medical Imaging (2016) 16:4 Page 8 of 16

Fig. 9 A graphic example of registration of tissue segmentation and quantitative MRI maps. NAGM=normal appearing grey matter; NAWM=normalappearing white matter; ADC = apparent diffusion coefficient; CBF = cerebral blood flow; CBV = cerebral blood volume; MTT =mean transit time; SPM=Statistical Parametric Mapping; FSL = FMRIB Software Library; FLIRT = FMRIB’s Linear Image Registration Tool; FLAIR = axial fluid-attenuated inversionrecovery MRI images
Fig. 10 Two diagrams describing DPP data analysis. Panel a: measurements of total, brain normal appearing grey matter (NAGM) and normalappearing white matter (NAWM) volume and voxel number, both as a whole and normalized according to skull size, and measurements of apparentdiffusion coefficient (ADC), cerebral blood flow (CBF), cerebral blood volume (CBV) and mean transit time (MTT) in basal ganglia, NAGM and NAWM.Panel b: measurements of apparent diffusion coefficient (ADC), cerebral blood flow (CBF), cerebral blood volume (CBV) and mean transit time (MTT) inpreviously saved and stored FLAIR lesion categorized as total, class C1, C2, C3, C4 and single. norm = normalized; C1 = enhancing T2-weightedhyperintense and T1-weighted isointense; C2 = enhancing T2-weighted hyperintense and T1-weighted ipointense ; C3 = non-enhancing T2-weighted hyperintense and T1-weighted isointense; C4 = non-enhancing T2-weighted hyperintense and T1-weighted ipointense, black holes
Revenaz et al. BMC Medical Imaging (2016) 16:4 Page 9 of 16

lesion segmentation and classification which requireshuman intervention. The GUI presents also two direc-tory browsing selection buttons for a more user friendlyand flexible selection of input and output data director-ies. In order to control the process status and evolution,three status bars are also present in the lower part of theGUI window: a) a status bar defining the step under exe-cution or the process execution status; b) a status-subbar describing the sub-module under execution; c) astatus-info bar indicating the patient number whose dataare under analysis. The lower button is the step/processactivation button, which starts the selected operations tobe executed in an automated way by the DPP Suite.
Process safety and data securityAll process steps, such as utilized parameters, the finalresults and the intermediate data are logged, saved andstored in the DPP Suite. This ensures complete environ-ment preservation. For example, when an external toolis invoked by the DPP Suite both images and results andthe tool’s standard output/error data log is read and
saved. This approach allows post processing visual verifi-cation of e.g. co-registration (SPM or FSL FLIRT), tissuesegmentation (SIENAX or FSL FIRST) or automatic de-tection of AIF-like voxels (Jim Perfusion tool). In Fig. 12is presented an example of coregistration check per-formed using the Check Reg tool part of SPM modulefor functional MRI. Although processing parameterswere tuned and optimized for every single step in DPPsuite, in case of failure, configuration can be modified tocorrect processing errors. In this way, a clinician cancheck the results and make sure that they are accurate.Other security measures are integrated in DPP suite aswell. For example, if a set of data represent both an out-put for the (n-1)th step and the input for the (n)th step,the entire data are copied before being modified by the(n)th step. Moreover, execution times and softwareversion are preserved for every run of the suite (e.g. pre-processing data structure). This approach allows datareconstruction, process verification and software debug-ging, making it possible to reproduce every single stepor the entire process and, thus, future validation of theDPP Suite.
ResultsSoftware metricsIn order to evaluate the DPP Suite performance, thehardware and software configurations are listed inTable 1. It is important to note that the entire suite iscarried out by a Linux Virtual Machine running in aWindows based PC. The execution time for all modulesin a single patient (woman; 33 year old; clinically and MRIinactive with Relapsing-Remitting MS; disease duration =84 months; Expanded Disability Status Scale = 2.5) and infive patients (4 women and 1 men; mean age = 46.4 ± 3.7years; 2 clinically and MRI active and 3 clinically and MRIinactive with Relapsing-Remitting MS; median diseaseduration = 1 months; median Expanded Disability StatusScale = 1.5) were evaluated to test the DPP Suite perform-ance. This analysis resulted linear regarding the numberof patients, while the execution time varied as a functionof number of lesions of patients (Fig. 13). Typical execu-tion time for a single patient can vary from 30 to 55 mindepending on the patient characteristics (number of le-sions and MRI quality). The key information derivedfrom this analysis is that the most time-consumingprocess is the anonymization with dpp_dicomanon.Interestingly, the typical execution time of the entiresuite analysis is relatively short (45 min), which seemsto be acceptable for a research use. It is important tonote that the DPP Suite is able to work with differentequipment since it can run on all hardware supportingVMware player (https://www.vmware.com/) or compat-ible virtualization software.
Fig. 11 A picture illustrating the Graphical User Interface (GUI)
Revenaz et al. BMC Medical Imaging (2016) 16:4 Page 10 of 16

Reproducibility of resultsThe repeatability of data coming from DPP Suite wastested with the analysis of lesion number and ADC, CBF,CBV and MTT values obtained from 38 patients withRelapsing-Remitting MS (31 women and 7 men; meanage = 45.8 ± 9.1 years; 8 clinically active and 30 clinicallyinactive; median disease duration = 9 months; medianExpanded Disability Status Scale = 2.0) by two differentreaders (EG with 2 years of experience; EF with 15 yearsof experience) who performed a double blinded, independ-ent semi-automatic lesion segmentation and classificationof T2-weighted hyperintense lesions. After checking datafor normality by using the Kolmogorov-Smirnov test, con-tinuous variables were compared using Mann-Whitney Utest or independent-samples t test when appropriate. Inaddition, kappa inter-observer agreement was calculated.
Kappa values were interpreted according to the pro-posed standards of Landis and Koch: 0–0.20 (slightagreement); 0.21–0.40 (fair agreement); 0.41–0.60(moderate agreement); 0.61–0.80 (substantial agreement);0.81–1.00 (almost perfect agreement) [43]. Tables 2 and 3show that there were not statistically significant differ-ences between the two readers in the evaluation of lesionnumber and ADC, CBF, CBV and MTT values detected inthe four classes of T2-weighted hyperintense lesions.Inter-observer agreement between the two readers wassubstantial for lesion number and ADC, CBF, CBV andMTT values in C1 lesion class and for lesion number andADC and MTT values in C2 lesion class, almost perfectfor all parameters assessed in C3 and C4 lesion classes,and only moderate for CBF and CBV values in C2 lesionclass. These findings argue for a good reproducibility ofresults provided by DPP Suite. On the other hand, thediscrepancies observed between the two readers could bemainly attributable to differences in how the users haveoutlined and categorized the lesions, even if the selectionof co-registration (FSL FLIRT versus SPM) and decision ofwhether an automated analysis passes quality control ornot could represent other potential explanations. Themodest inter-observer agreement between the two readersfound for CBF and CBV values in C2 lesion class could bealso affected by the current limitations in discriminatingbetween acute active and chronic active Gd-enhancingand T1-weighted hypointense T2-weighted hyperintenselesions [44]. In any case, such differences can be mini-mized based on having some type of training between the
Fig. 12 A visual coregistration check example using Check Reg tool in SPM. Left to right are presented three panels showing the output of Check Reg incase of a T1 (lower images) to FLAIR (higher images) sequences coregistration. Three relevant points were selected in order to check coregistration visually
Table 1 Test Bench Hardware and Software
Hardware Host PC
CPU Intel Core i7-4770
Ram 8 Gb
Hard Disk SSD + Raid 1 disk
Software Host PC
Operating System Windows 7 professional
Virtualization VMware player 6.0.3
Software Guest PC
Operating System Scientific Linux 5.5
CPU Central Processing Unit, SSD Solid State Drive, Raid Redundant array ofindependent disks
Revenaz et al. BMC Medical Imaging (2016) 16:4 Page 11 of 16

users (i.e. which option should be selected and how to as-sess the quality of the analysis).Written informed consent was given by all patients
before inclusion and the study design was approved bythe Research Ethics Board of Azienda Ospedaliero-Universitaria di Ferrara (Italy) that is our Local Com-mittee for Medical Ethics in Research
Discussion and conclusionsIn this work we implemented an alternative system toanalyze DWI and PWI abnormalities in various classesof lesions and in normal appearing brain tissues frompatients with MS. The novelty of our approach is repre-sented by a semi-automated integration of several previ-ously validated software packages which are sequentiallyactivated instead of separately utilized. This has the ef-fect of significantly reducing human intervention thatcan be a source of bias and improper tissue and/or le-sion classification. This approach makes the analysisquicker, simpler and provides reliable results. In fact,
except for two checkpoints represented by lesion seg-mentation and classification, DPP Suite procedures offera highly automatic elaboration of a large amount of MRIdata in which the different algorithms are harmonicallyand hierarchically incorporated. The main objective ofthe development of our DPP Suite is to provide clinicalresearchers with a practical and reproducible tool toclarify the actual significance of DWI and PWI distur-bances in MS. On the other hand, the coherent inte-gration process obtained with the DPP Suite offers anintuitive time improvement compared to manuallyperforming the individual steps. Finally, the DPP Suiteprovides a “best of breed” approach for the externaltool choice and usage for each specific operation, asoftware modularity leading to a better managementof method complexity and reusability in the setting ofprocess safety. However, the evaluation of the DPPSuite in terms of usability, sustainability and main-tainability by using different target users remains tobe addressed.
Fig. 13 Execution time benchmark in a single patient (yellow/left) and 5 patients (blue/right). Vertical axis shows the execution times in thehours:minutes:seconds format. Matlab R2010a, Xinapse Jim 6.0, FMRIB Software library (FSL) 4.1.9 and Statistical Parametric Mapping (SPM) 8 werethe software systems employed. coreg_1 = registration of T1-weighted images; lesion_class = lesion classification; coreg_2 = registration of lesionmasks; auto_segment = normal appearing tissue segmentation; coreg_3 = registration of tissue segmentation and quantitative MRI maps
Revenaz et al. BMC Medical Imaging (2016) 16:4 Page 12 of 16

Table 2 Number of focal lesions and ADC, CBF, CBV and MTT values in C1 and C2
C1 lesions C2 lesions
First reader Second reader p value* Kappa value First reader Second reader p value* Kappa value
Lesion number(sum, median, IQR, mean ± SD, range)
4, 0, 0-0, 0.1 ± 0.3, 0-1 7, 0, 0-0, 0.2 ± 0.5, 0-2 p = 0.242 0.692 9, 0, 0-0, 0.3 ± 0.6, 0-2 12, 0, 0-0, 0.2 ± 0.7, 0-3 p = 0.148 0.614
ADC x 10-3 s/mm2(median, IQR, mean ± SD, range)
0, 0-0, 0.1 ± 0.3, 0-0.9 0, 0-0, 0.1 ± 0.3, 0-0.9 p = 0.256 0.792 0, 0-0, 0.2 ± 0.4, 0-1.1 0, 0-0, 0.1 ± 0.3, 0-1.2 p = 0.146 0.721
CBF ml/100g/min(median, IQR, mean ± SD, range)
0, 0-0, 15.8 ± 50.2, 0-244.9 0, 0-0, 24 ± 59.3, 0-244.9 p = 0.2400 0.686 0, 0-0, 35.3 ± 76.2, 0-342.2 0, 0-0, 14.5 ± 39, 0-136.6 p = 0.108 0.450
CBV 100g/min(median, IQR, mean ± SD, range)
0, 0-0, 0 ± 0, 0-0.2 0, 0-0, 0 ± 0.1, 0-0.2 p = 0.248 0.742 0, 0-0, 0 ± 0.1, 0-0.4 0, 0-0, 0 ± 0.1, 0-0.3 p = 0.114 0.464
MTT seconds(median, IQR, mean ± SD, range)
0, 0-0, 0.8 ± 2.8, 0-15.3 0, 0-0, 1.1 ± 2.7, 0-11.2 p = 0.251 0.719 0, 0-0, 2 ± 3.8, 0-13.5 0, 0-0, 1.2 ± 3.3, 0-13.5 p = 0.136 0.673
Values obtained by two different readers in Gd-enhancing and T1-weighted isointense (C1) and Gd-enhancing and T1-weighted hypointense (C2) T2-weighted hyperintense lesions from 38 patients with Relapsing-Remitting Multiple Sclerosis. ADC Apparent Diffusion Coefficient, CBF Cerebral Blood Flow, CBV Cerebral Blood Volume, MTT Mean Transit Time, First reader EG, Second reader EF, SD Standard deviation, IQR Interquartilerange, *Mann-Whitney
Revenazet
al.BMCMedicalIm
aging (2016) 16:4
Page13
of16

Table 3 Number of focal lesions and ADC, CBF, CBV and MTT values in C3 and C4
C3 lesions C4 lesions
First reader Second reader p value Kappa value First reader Second reader p value Kappa value
Lesion number(sum, median, IQR, mean ± SD, range)
1075, 18, 5.5-33.8,28.3 ± 30.8, 0-129
1138, 19, 5.5-38.8,29.9 ± 32.6, 0-132
p = 0.446* 0.921 689, 11, 3-21.5, 18.1 ± 22.8, 0-99 623, 8, 2-20, 16.4 ± 20.3,0-87
p = 0.420* 0.904
ADC x 10-3 s/mm2(median, IQR, mean ± SD, range)
0.9, 0.9-1, 0.9 ± 0.2,0-1.2
0.9, 0.9-1, 0.9 ± 0.2,0-1.2
p = 0.350* 0.872 1, 0.9-1.1, 1 ± 0.2, 0-1.2 1, 0.9-1.1, 1 ± 0.2, 0-1.3 p = 0.448* 0.812
CBF ml/100g/min(median, IQR, mean ± SD, range)
131.6, 88.6-183.8,137.5 ± 60.2, 0-295.9
139.3, 99.9-191.1,141.8 ± 58.8, 0-295.9
p = 0.376** 0.844 124.3, 84.8-165.9, 124.6 ± 58.5,0-263
105.5, 76.5-150,115.1 ± 59.6, 0-270.8
p = 0.243** 0.848
CBV 100g/min(median, IQR, mean ± SD, range)
0.1, 0.1-0.2,0.1 ± 0, 0-0.3
0.1, 0.1-0.2, 0.1 ± 0,0-0.3
p = 0.500** 0.824 0.1, 0.1-0.2, 0.1 ± 0.1, 0-0.3 0.1, 0.1-0.1, 0.1 ± 0.1, 0-0.3 p = 0.181** 0.769
MTT seconds(median, IQR, mean ± SD, range)
8.3, 6.9-9, 8 ± 2.2,0-12.1
8.1, 6.6-8.6, 7.8 ± 2.2,0-12.1
p = 0.384** 0.836 8.4, 6.8-9.7, 8.2 ± 2.6, 0-15 8.4, 6.8-9.7, 81. ± 2.9, 0-15 p = 0.463** 0.828
Values obtained by two different readers in non Gd-enhancing and T1-weighted isointense (C3) and non Gd-enhancing and T1-weighted hypointense (C4) T2-weighted hyperintense lesions from 38 patients withRelapsing-Remitting Multiple Sclerosis. ADC Apparent Diffusion Coefficient, CBF Cerebral Blood Flow, CBV Cerebral Blood Volume, MTT Mean Transit Time, First reader EG, Second reader EF; SD Standard deviation, IQRInterquartile range, *Mann-Whitney; **t-test
Revenazet
al.BMCMedicalIm
aging (2016) 16:4
Page14
of16

Competing interestsThe author(s) declare that they have no competing interests.
Authors’ contributionsAR designed and implemented the algorithm, participated in the studyconcept and design, in data acquisition and interpretation and in manuscriptpreparation, editing and review. MRuggeri participated in manuscriptpreparation and editing. ML participated in the study design, in data analysisand in manuscript editing and review. NB participated in the study design, indata analysis and in manuscript editing and review. EG contributed to dataacquisition and interpretation. MRovaris contributed to the study design, indata analysis and in manuscript editing and review. EF conceived the study,participated in the study design, performed the statistical analysis, contributedto data acquisition and interpretation and in manuscript preparation, editingand review. All authors read and approved the final manuscript.
Author details1Unità Operativa di Neuroradiologia, Dipartimento di Neuroscienze eRiabilitazione, Azienda Ospedaliero-Universitaria of Ferrara, Arcispedale S.Anna, Via Aldo Moro 8, 44124 Cona, Ferrara, Italy. 2Consiglio Nazionale delleRicerche, 44124 Ferrara, Italy. 3MR Research Laboratory, IRCCS Don GnocchiFoundation ONLUS, Milan, Italy. 4Buffalo Neuroimaging Analysis Center,Department of Neurology, University at Buffalo SUNY, Buffalo, NY, USA.5Sezione di Neurologia, Dipartimento di Scienze Biomediche e ChirurgicoSpecialistiche, Università di Ferrara, Ferrara, Italy. 6Unità Operativa di SclerosiMultipla, Fondazione Don Gnocchi ONLUS, IRCCS S. Maria Nascente, 20148Milano, Italy.
Received: 17 August 2015 Accepted: 6 January 2016
References1. Balashov KE, Lindzen E. Acute demyelinating lesions with restricted diffusion
in multiple sclerosis. Mult Scler. 2012;18:1745–53.2. Zeid NA, Pirko I, Erickson B, Weigand SD, Thomsen KM, Scheithauer B, et al.
Diffusion-weighted imaging characteristics of biopsy-proven demyelinatingbrain lesions. Neurology. 2012;78:1655–62.
3. Eisele P, Szabo K, Griebe M, Rossmanith C, Förster A, Hennerici M, et al.Reduced diffusion in a subset of acute MS lesions: a serial multiparametricMRI study. AJNR Am J Neuroradiol. 2012;33:1369–73.
4. Wuerfel J, Bellmann-Strobl J, Brunecker P, Aktas O, McFarland H, Villringer A,et al. Changes in cerebral perfusion precede plaque formation in multiplesclerosis: a longitudinal perfusion MRI study. Brain. 2004;127:111–9.
5. Ge Y, Law M, Johnson G, Herbert J, Babb JS, Mannon LJ, et al. Dynamicsusceptibility contrast perfusion MR imaging of multiple sclerosis lesions:characterizing hemodynamic impairment and inflammatory activity. AJNRAm J Neuroradiol. 2005;26:1539–47.
6. Peruzzo D, Castellaro M, Calabrese M, Veronese E, Rinaldi F, Bernardi V, et al.Heterogeneity of cortical lesions in multiple sclerosis: an MRI perfusionstudy. J Cereb Blood Flow Metab. 2013;33:457–63.
7. Narayana PA, Zhou Y, Hasan KM, Datta S, Sun X, Wolinsky JS. Hypoperfusionand T1-hypointense lesions in white matter in multiple sclerosis. Mult Scler.2014;20:365–73.
8. Werring DJ, Brassat D, Droogan AG, Clark CA, Symms MR, Barker GJ, et al.The pathogenesis of lesions and normal-appearing white matter changes inmultiple sclerosis: a serial diffusion MRI study. Brain. 2000;123:1667–76.
9. Filippi M, Iannucci G, Cercignani M, Rocca MA, Pratesi A, Comi G. A quantitativestudy of water diffusion in multiple sclerosis lesions and normal-appearingwhite matter using echo-planar imaging. Arch Neurol. 2000;57:1017–21.
10. Tavazzi E, Dwyer MG, Weinstock-Guttman B, Lema J, Bastianello S, Bergamaschi R,et al. Quantitative diffusion weighted imaging measures in patients with multiplesclerosis. Neuroimage. 2007;36:746–54.
11. Garaci FG, Colangelo V, Ludovici A, Gaudiello F, Marziali S, Centonze D, et al.A diffusion longitudinal MR imaging study in normal-appearing whitematter in untreated relapsing-remitting multiple sclerosis. AJNR Am JNeuroradiol. 2007;28:475–8.
12. Law M, Saindane AM, Ge Y, Babb JS, Johnson G, Mannon LJ, et al. Microvascularabnormality in relapsing remitting multiple sclerosis: perfusion MR imagingfindings in normal-appearing white matter. Radiology. 2004;231:645–52.
13. Adhya S, Johnson G, Herbert J, Jaggi H, Babb JS, Grossman RI, et al. Patternof hemodynamic impairment in multiple sclerosis: dynamic susceptibilitycontrast perfusion MR imaging at 3.0 T. Neuroimage. 2006;33:1029–35.
14. Inglese M, Park S-J, Johnson G, Babb JS, Miles L, Jaggi H, et al. Deep graymatter perfusion in multiple sclerosis: dynamic susceptibility contrast perfusionmagnetic resonance imaging at 3.0 T. Arch Neurol. 2007;64:196–202.
15. Zamboni P, Menegatti E, Weinstock-Guttman B, Dwyer MG, Schirda CV,Malagoni AM, et al. Hypoperfusion of brain parenchyma is associated withthe severity of chronic cerebrospinal venous insufficiency in patients withmultiple sclerosis: a cross-sectional preliminary report. BMC Med. 2011;9:22.
16. Paling D, Thade Petersen E, Tozer DJ, Altmann DR, Wheeler-Kingshott CA,Kapoor R, et al. Cerebral arterial bolus arrival time is prolonged in multiplesclerosis and associated with disability. J Cereb Blood Flow Metab. 2014;34:34–42.
17. Filippi M, Rocca MA. MR imaging of multiple sclerosis. Radiology. 2011;259:659–81.
18. Mortazavi D, Kouzani AZ, Soltanian-Zadeh H. Segmentation of multiplesclerosis lesions in MR images: a review. Neuroradiology. 2012;54:299–320.
19. Lladó X, Ganiler O, Oliver A, Martí R, Freixenet J, Valls L, et al. Automateddetection of multiple sclerosis lesions in serial brain MRI. Neuroradiology.2012;54:787–807.
20. Zivadinov R, Stosic M, Cox JL, Ramasamy DP, Dwyer MG. The place ofconventional MRI and newly emerging MRI techniques in monitoringdifferent aspects of treatment outcome. J Neurol. 2008;255:61–74.
21. Datta S, Sajja BR, He R, Wolinsky JS, Gupta RK, Narayana PA. Segmentationand quantification of black holes in multiple sclerosis. Neuroimage. 2006;29:467–74.
22. Datta S, Sajja BR, He R, Gupta RK, Wolinsky JS, Narayana PA. Segmentationof gadolinium-enhanced lesions on MRI in multiple sclerosis. J Magn ResonImaging. 2007;25:932–7.
23. Schmidt P, Gaser C, Arsic M, Buck D, Förschler A, Berthele A, et al. An automatedtool for detection of FLAIR-hyperintense white-matter lesions in multiplesclerosis. Neuroimage. 2012;59:3774–83.
24. Vrenken H, Jenkinson M, Horsfield MA, Battaglini M, van Schijndel RA,Rostrup E, et al. Recommendations to improve imaging and analysis ofbrain lesion load and atrophy in longitudinal studies of multiple sclerosis.J Neurol. 2013;260:2458–71.
25. Tavazzi E, Laganà MM, Bergsland N, Tortorella P, Pinardi G, Lunetta C, et al.Grey matter damage in progressive multiple sclerosis versus amyotrophiclateral sclerosis: a voxel-based morphometry MRI study. Neurol Sci. 2015;36:371–7.
26. Bergsland N, Laganà MM, Tavazzi E, Caffini M, Tortorella P, Baglio F, et al.Corticospinal tract integrity is related to primary motor cortex thinning inrelapsing-remitting multiple sclerosis. Mult Scler. 2015. [Epub ahead of print].
27. Lim J, Zein R. The digital imaging and communications in medicine (DICOM):description, structure and applications. In: Kamrani AK, Nasr EA, editors. RapidPrototyping: Theory and practice. New York: Springer; 2006. p. 63–86.
28. Larobina M, Murino L. Medical image file formats. J Digit Imaging.2014;27:200–6.
29. Ashburner J, Andersson JLR, Friston KJ. Image registration using a symmetricprior-in three-dimensions. Hum Brain Mapping. 2000;9:212–25.
30. Jenkinson M, Smith S. A global optimisation method for robust affineregistration of brain images. Med Image Anal. 2001;5:143–56.
31. Jenkinson M, Beckmann CF, Behrens TEJ, Woolrich MW, Smith SM. FSL.Neuroimage. 2012;62:782–90.
32. Gawne-Cain ML, O’Riordan JI, Thompson AJ, Moseley IF, Miller DH. Multiplesclerosis lesion detection in the brain: a comparison of fast fluid-attenuatedinversion recovery and conventional T2-weighted dual spin echo.Neurology. 1997;49:364–70.
33. Hennig J, Nauerth A, Friedburg H. RARE imaging: a fast imaging method forclinical MR. Magn Reson Med. 1986;3:823–33.
34. Bermel RA, Sharma J, Tjoa CW, Puli SR, Bakshi R. A semiautomated measureof whole-brain atrophy in multiple sclerosis. J Neurol Sci. 2003;208:57–65.
35. Lublin FD, Reingold SC, Cohen JA, Cutter GR, Sørensen PS, Thompson AJ,et al. Defining the clinical course of multiple sclerosis: the 2013 revisions.Neurology. 2014;83:278–86.
36. Ge Y. Multiple Sclerosis: The Role of MR Imaging. AJNR Am J Neuroradiol.2006;27:1165–76.
37. Zivadinov R, Bergsland N, Stosic M, Sharma J, Nussenbaum F, Durfee J, et al.Use of perfusion- and diffusion-weighted imaging in differential diagnosisof acute and chronic ischemic stroke and multiple sclerosis. Neurol Res.2008;30:816–26.
Revenaz et al. BMC Medical Imaging (2016) 16:4 Page 15 of 16

38. Patenaude B, Smith SM, Kennedy DN, Jenkinson M. A Bayesian model ofshape and appearance for subcortical brain segmentation. Neuroimage.2011;56:907–22.
39. Smith SM, Zhang Y, Jenkinson M, Chen J, Matthews PM, Federico A, et al.Accurate, robust, and automated longitudinal and cross-sectional brainchange analysis. Neuroimage. 2002;17:479–89.
40. Østergaard L, Weisskoff RM, Chesler DA, Gyldensted C, Rosen BR. Highresolution measurement of cerebral blood flow using intravascular tracerbolus passages. Part I. Mathematical approach andstatistical analysis. MagnReson Med. 1996;36:715–25.
41. Stejskal EO, Tanner JE. Spin diffusion measurements: spin echoes in thepresence of a time dependent field gradient. J Chem Phys. 1965;42:288.
42. Le Bihan D, Breton E, Lallemand D, Grenier P, Cabanis E, Laval-Jeantet M.MR imaging of intravoxel incoherent motions: application to diffusion andperfusion in neurologic disorders. Radiology. 1986;161:401–7.
43. Landis JR, Koch GG. The measurement of observer agreement for categoricaldata. Biometrics. 1977;33:159–74.
44. Campbell Z, Sahm D, Donohue K, Jamison J, Davis M, Pellicano C, et al.Characterizing contrast-enhancing and re-enhancing lesions in multiplesclerosis. Neurology. 2012;78:1493–9.
• We accept pre-submission inquiries
• Our selector tool helps you to find the most relevant journal
• We provide round the clock customer support
• Convenient online submission
• Thorough peer review
• Inclusion in PubMed and all major indexing services
• Maximum visibility for your research
Submit your manuscript atwww.biomedcentral.com/submit
Submit your next manuscript to BioMed Central and we will help you at every step:
Revenaz et al. BMC Medical Imaging (2016) 16:4 Page 16 of 16