a senior design project in environmentally friendly glass ... · pdf filea senior design...
TRANSCRIPT

Paper ID #7851
A Senior Design Project in Environmentally Friendly Glass Manufacturing
Dr. Richard Chiou, Drexel UniversityDr. Michael G Mauk P.E., Drexel UniversityMr. M. Eric Carr, Drexel University
Mr. Eric Carr is currently the Laboratory Technician for Drexel University’s Engineering Technologyprogram. Carr assists faculty members with the development and implementation of various EngineeringTechnology courses, and enjoys finding innovative ways to use microcontrollers and other technologies toenhance Drexel’s Engineering Technology course offerings. Carr holds an M.S. in Computer Engineeringfrom Drexel University and is an author of several recent technical papers in the field of EngineeringTechnology Education.
c©American Society for Engineering Education, 2013
Page 23.100.1
A Senior Design Project in Environmentally Friendly Glass Manufacturing
Abstract This paper discusses an educational effort that incorporates environmentally conscious design for glass manufacturing in a senior design project at Drexel University. A critical component of a national “green industries/green jobs” effort is to motivate our citizenry to become proficient in STEM and associated manufacturing fields and trades, thus ensuring we have a 21st-century workforce. This senior design project engages students in the implementation of an innovative method for improving tool design and measuring the quality of glass using statistical process control and thermal image processing. Through this project, students learn how to provide a green design method for evaluating the characteristics of environmentally friendly glass manufacturing. This student senior design project was in collaboration with Bent Glass Design Inc., which is a specialty glass company focusing on the production of custom design glass for applications in transportation and architectural applications. There has been an increasing demand for delivering its custom products with a polished edge in recent years. The students incorporated real-world experience with innovative green design for the reduction of manual operations and use of hazardous materials, as well as improving final product quality. For the sake of comparisons for green design, experiments were conducted, including surface roughness tests, thermal image analysis, and effects of water cooling. A concluding section discusses the experiences from this project.
Introduction Fusing U.S. innovation on green science and clean manufacturing is an environmental necessity. Without new innovations and a green science and technology policy, the United States will not be able to reduce greenhouse gas emissions (GHG) to needed levels, unless the price of GHG emission through cap-and-trade legislation rises to politically unsustainable levels. The reformation needs of green engineering education are driven by dramatic changes in the practices of U.S. companies in recent years. Briefly, these changes can be summarized as follows: (1) Complexity – Green design has become an extremely distributed activity; (2) Globalization – Most of the large U.S. industrial manufacturers have operations outside of the United States due to the lower cost of utilizing natural resources outside of the U.S.as well as the importance of expanding to new markets, etc.; (3) Environmental Awareness – There is an increased perception of the need for environmental consciousness practices. Manufacturing operations are required by law to consider environmental impacts and to implement substantive programs and technologies to reduce those impacts; (4) Computerization and Integration -- Owing to globalization, complexity and environmental requirements, the coordination of green engineering activities must be carried out. Hands-on green related classes, labs, and projects promote engineering education1-5. The main objective of senior design courses in our engineering technology curricula is to bridge the gap between academic theory and real-world practice. Accordingly, the proposed senior projects should include elements of both credible analysis and experimental proofing as discussed in ABET criteria6. The primary intent of this effort is to foster learning of class concepts and to impact the breadth of student learning (in terms of ABET outcomes “(c) an ability to design a system, component, or process to meet desired needs within realistic
Page 23.100.2

constraints such as economic, environmental, social, political, ethical, health and safety, manufacturability, and sustainability” and (h) “the broad education necessary to understand the impact of engineering solutions in a global, economic, environmental, and societal context”). The senior design project can serve as an excellent culminating experience in the program of study when it focuses on research and design projects that have practical value to consumers or to industry. For the ET program at Drexel University, the senior design course is a year-long educational journey (three quarters) that takes an idea generated by a student or an industrial sponsor and culminates in a product or project. This course is an excellent capstone experience, which requires both teamwork and individual skills in solving a modern industrial problem. Senior design projects in fall, winter, and spring quarters bring the students, faculty, and industrial partners together to see the student’s results and to give them the additional experience of public presentation of their work7-10. The purpose of this paper is to describe a capstone senior design project involved in the environmentally conscious manufacturing11. The experience to improve industrial working environment and process costs in the project is discussed. Our senior design project course is a 3-term core course usually taken by the students during their terminal year in the Engineering Technology program at Drexel University. The design involves an educational effort that incorporates environmental consciousness in the senior design project. Several design approaches are pursued as part of the project for glass manufacturing. Through image processing, the students performed statistical analysis on the glass surfaces and related it to the measured glass quality. An attempt at measuring the glass edge surface roughness was also performed. Finally, the effects of water cooling on the glass surface finish were studied and analyzed. The paper discusses the steps taken and apparatus used for performing design, assembly, and quality control measurements of glass products. It is concluded with the experimental results regarding the project. Background and Problem Statement
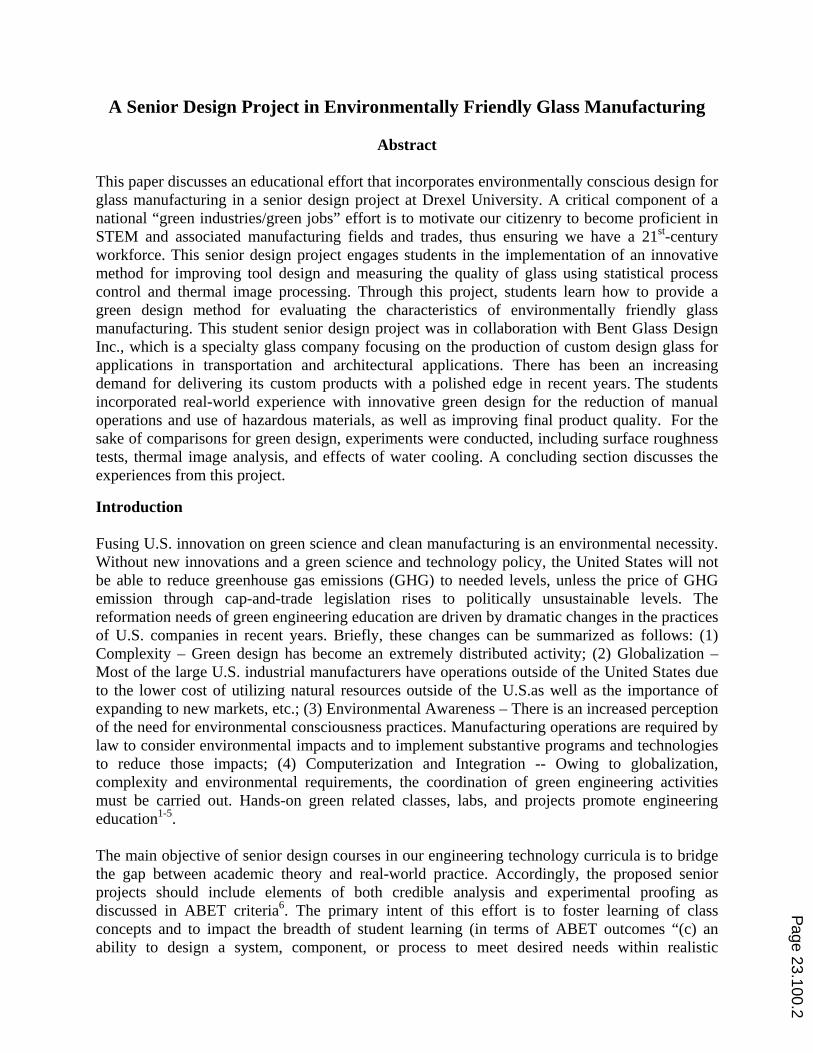
Bent Glass Design Inc., Hatboro, Pennsylvania is a specialty glass company focusing in the production of custom design glass for applications in transportation and architectural products12. The company has observed increasing demand for delivering their custom products with a polished edge in the past few years. The absence of a fixed and repeatable pattern precludes the use of complex robotic options such as industry-standard CNC glass polishers, and therefore glass that requires polishing of a curved or bent pattern requires the glass to be manually polished by skilled craftsmen. Unfortunately, these skilled craftsmen are forced to use polishing tools that have not been designed specifically for glass polishing. As a result, as shown in Figure 1, two major problems were encountered13:
1. Polishing of glass requires the use of water for cooling of the glass surface. Since the primary hand tool (a handheld belt sander) used does not include a water feed, any polishing requires a second craftsman to operate a water spray bottle while the first operator polishes the desired area. The addition of a second craftsman significantly increases the cost of hand polishing and thus occupies a skilled worker with a menial job when the craftsman could be doing something more valuable for the company.
Page 23.100.3
2. Since the tool used is not designed for wet application(s) and is not protected against intrusion of the fine glass dust generated as a byproduct of polishing, each tool only lasts approximately one month before the tool is degraded to the point to which it is no longer economically repairable. At about $275 per tool and the need for replacement at an average rate of three tools per month, the added cost of tool replacements adds significantly to the cost of hand polishing.
Figure 1: Traditional polishing process
Design Process
The goals of the senior design project were to reduce process cost and to develop a tool designed specifically for polishing the edges of curved and bent glass, so that a single operator is capable of performing the work and the expected tool life is increased to be greater than one year (ideally three to five years of tool life). The initial design (as proposed during the first term) involved manufacturing a sanding tool to incorporate the following requirements: 1. Reduction of the number of operators from 2 to 1, 2. Reduce total cost of ownership, 3. Be suited for wet application, and 4. Retain use of the sand belt. The team received the preferences of the operators as feedback, and tweaked their ideas to include those preferences. The team was able to find an air motor which weighed significantly less than what we initially supposed causing further changes in our proposed idea. The team should be able to manufacture a tool which is well received by the operators in terms of handling and user friendliness.
To address these challenges, the team decided that the best solution would be to have two different sized tools which were of the same concept and could be switched in or out as required while working on an order. The other tool was decided to be made for a 3x21 inch standard belt size, as this was the other sized tool that was preferred and light enough for the operator to use continuously on larger orders. At the end of the second term, the team began brainstorming ideas on how to incorporate the suggested larger tool into the completed designs. The second tool proposed would need to be as easy to manufacture, and as comfortable to use as the current prototype. The team agreed on extending the prototype to support a larger belt, instead of manufacturing a tool from scratch or modifying a tool with a different design. This approach proved to be a more cost effective option than other options and was accomplished by manufacturing an individual extended piece which replaces the original wheel/belt assembly.
Page 23.100.4

Again, keeping in mind the cost considerations, the students created designs using Solidworks that were similar to the original but easier to manufacture. They designed and produced prototypes of two tools, both of which met the required objectives. While the smaller (1x18”) tool is more suited for pieces with sharper bends; the larger (3x21”) tool is quicker while polishing larger curved pieces.
Figure 2: Simulation Model of 1x18’’ tool
Development and Testing of Prototype
As shown in Figure 3, the prototype was built to fit a belt 1x18 inches in size. Belts of this size are good for smaller and sharper bends, but they are slower on larger pieces with a shallower curve. This meant that even though the prototype was good on smaller pieces and surfaces, and was preferred by the operator over the other tools and methods available, it still lacked speed for larger orders.
Figure 3: Assembled 1x18” Prototype
Page 23.100.5

The team started by researching existing tools and systems currently used in the industry setting, later brainstorming possible adaptations of what could be done. They concluded that a pneumatic motor would be the best option for the motor as it would be suited for working in a wet and dusty environment. The approach and further design would then be based on the type of motor opted for. The team was able to identify a pneumatic 1HP motor from Snap-onTM Co. during the first months which fulfilled all the requirements. The team then took apart a generic tool to find out how it worked and to learn how to design our prototype. A model of the baseline tool was also constructed using Solidworks. From here, the team first designed an adapter that would fit the pneumatic motor to the rest of the tool that the team was modifying and later designing. As the assembly of the motor, adapter and the disassembled tool is light weight and its ergonomics were preferred by the operator, the team was asked not to modify the currently preferred tool weight. After conducting a series of tests and through operator feedback, the optimal location and type of a water feed was determined. The team selected a needle valve, fed by a water line running along the handle, which would constantly spray the belt with water near the drive wheel. A shield was designed and manufactured which serves to contain the spray of the water which shoots off the belt at the other end as it turns around the contact wheel. As shown in Table 1, the new tool meets the following criteria and fulfills the required objectives:
Reduction of input resource cost (monthly replacement of the tools) o Projected life of the tool is more than a year with proper maintenance, which is
significantly longer than that of the current tools which need to be replaced each month.
Be suited for wet application o The tool uses a pneumatic motor instead of an electric motor which makes it
suitable for wet and or dusty applications. Reduction of the number of operators from 2 to 1
o Integrated water feed eliminates the requirement of a second operator with a spray bottle.
Retain the use of the sand belt
Table 1: Comparison between old tool and new tool
Old Tool New Tool
Motor Electric Pneumatic
Operators 2 1
Lifespan of motor
1 month Over a year with proper maintenance
Operator cost $120,000 (5 year) $60,000 (5 year)
Coolant System
External: spray bottle Internal: coolant line is permanently mounted and controlled by a needle valve P
age 23.100.6

Weight Heavier weighing 12.5 pounds Lighter weighing 3.5 pounds
Mobility Limited due to weight Free
Fatigue Operator tires quickly Operator can work longer
Cost
Purchase new tool every month.
$275 for 3x21 tool, (Porter Cable)
$250 for 1x21 tool, (Makita)
$750 one-time cost for manufacturing the assembly.
$250 cost for motor replacement. (yearly)
Surface Quality
Poorer surface quality with deep scratches
Smoother surface quality with few imperfections
Preference - preferred
Experimental Apparatus for surface roughness measurement
The surface roughness testing equipment (Mitutoyo Corp. SJ-301) was used for the project14-15. The testing equipment is available in the engineering technology laboratory. The SJ-301 surface roughness testing equipment utilizes a diamond point stylus to map the surface topography of the test specimen in one dimension. Four different glass edges (same piece) were tested, including: 1. the basic unpolished naturally broken edge, 2. the Straight edge Polisher – Industry tool ($200,000), and 3. the OLD hand tool, and the NEW hand tool – prototype.
Figure 4: Stylus of the SJ-301 for surface roughness measurement on glass edge.
The procedure was to take a glass piece and polish each edge with the specified tool as it would have been used when working on a proper piece. This included belt changes. The measurements for each edge were recorded by placing the probe/stylus of the SJ-301 on the glass edge at multiple randomly selected locations. All the results gathered by the SJ-301 are provided in the
Page 23.100.7
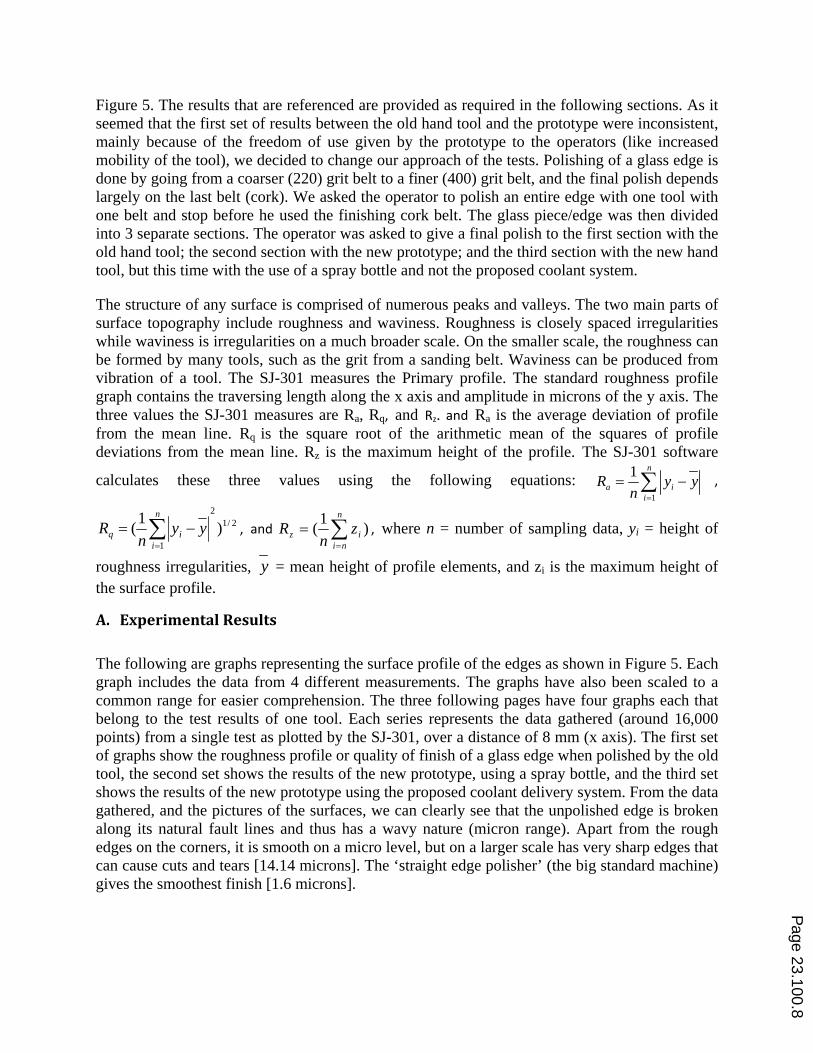
Figure 5. The results that are referenced are provided as required in the following sections. As it seemed that the first set of results between the old hand tool and the prototype were inconsistent, mainly because of the freedom of use given by the prototype to the operators (like increased mobility of the tool), we decided to change our approach of the tests. Polishing of a glass edge is done by going from a coarser (220) grit belt to a finer (400) grit belt, and the final polish depends largely on the last belt (cork). We asked the operator to polish an entire edge with one tool with one belt and stop before he used the finishing cork belt. The glass piece/edge was then divided into 3 separate sections. The operator was asked to give a final polish to the first section with the old hand tool; the second section with the new prototype; and the third section with the new hand tool, but this time with the use of a spray bottle and not the proposed coolant system.
The structure of any surface is comprised of numerous peaks and valleys. The two main parts of surface topography include roughness and waviness. Roughness is closely spaced irregularities while waviness is irregularities on a much broader scale. On the smaller scale, the roughness can be formed by many tools, such as the grit from a sanding belt. Waviness can be produced from vibration of a tool. The SJ-301 measures the Primary profile. The standard roughness profile graph contains the traversing length along the x axis and amplitude in microns of the y axis. The three values the SJ-301 measures are Ra, Rq, and Rz. and Ra is the average deviation of profile from the mean line. Rq is the square root of the arithmetic mean of the squares of profile deviations from the mean line. Rz is the maximum height of the profile. The SJ-301 software
calculates these three values using the following equations: ,
2/12
1
)1
(
n
iiq yy
nR , and )
1(
n
niiz z
nR , where n = number of sampling data, yi = height of
roughness irregularities, = mean height of profile elements, and zi is the maximum height of the surface profile.
A. ExperimentalResults
The following are graphs representing the surface profile of the edges as shown in Figure 5. Each graph includes the data from 4 different measurements. The graphs have also been scaled to a common range for easier comprehension. The three following pages have four graphs each that belong to the test results of one tool. Each series represents the data gathered (around 16,000 points) from a single test as plotted by the SJ-301, over a distance of 8 mm (x axis). The first set of graphs show the roughness profile or quality of finish of a glass edge when polished by the old tool, the second set shows the results of the new prototype, using a spray bottle, and the third set shows the results of the new prototype using the proposed coolant delivery system. From the data gathered, and the pictures of the surfaces, we can clearly see that the unpolished edge is broken along its natural fault lines and thus has a wavy nature (micron range). Apart from the rough edges on the corners, it is smooth on a micro level, but on a larger scale has very sharp edges that can cause cuts and tears [14.14 microns]. The ‘straight edge polisher’ (the big standard machine) gives the smoothest finish [1.6 microns].
1
1 n
a ii
R y yn
y
Page 23.100.8

(a) Original Tool (b) Prototype with Spray bottle (c) New Prototype
Figure 5: Surface finish results
A comparative study between the old hand tool and our modified version of the tool yield very informative and concluding results. Comparing each of the hand tools with the unpolished broken edge, the old hand tool grinds away the original waviness of the edge, polishing away most of the major sharp edges, but on a micro level, it causes micro-cracks on the surface of the edge as shown by the valleys on the profile graph. The final finish is smooth and is something the new tool must either achieve or improve on.
On the other hand as the prototype (new tool) is significantly lighter than the old tool, the operator has the option to move the tool freely over the glass edge as he tries to achieve a smoother curved edge by changing the tools orientation. This is not so in the case of the heavier old tool, which is held rather firmly on the same plane throughout the process. Thus, it enables the operator to freely move the tool over the edge costing him less in stamina and still manages to give a finish as smooth as the old hand tool without the previously occurring micro-cracks.
B. Analysis
As shown by the surface roughness test, the unpolished broken piece has a smooth wave profile on a lower scale, but on the whole, the edge has multiple sharp surfaces and an irregular profile; the industrial glass polishing machine which can only polish straight edges gives the smoothest finish amongst the three tools. The problem is that it cannot polish curved pieces, and hence the smaller hand-held tool becomes a requirement. As for the hand tools, the new hand tool (the students’ prototype) gives a smoother finish than the old hand tool.
Also, there is a need for directed coolant flow such as water as shown by our second test. Our prototype gave us a roughness value close to that of the straight edge polisher, but when we replaced the coolant system with a spray bottle, the roughness value doubled, not to mention that it needed an additional operator for the coolant spray! With the comparative results, it can be concluded that the prototype produced a surface roughness profile that was on par with the old hand tool.
Page 23.100.9
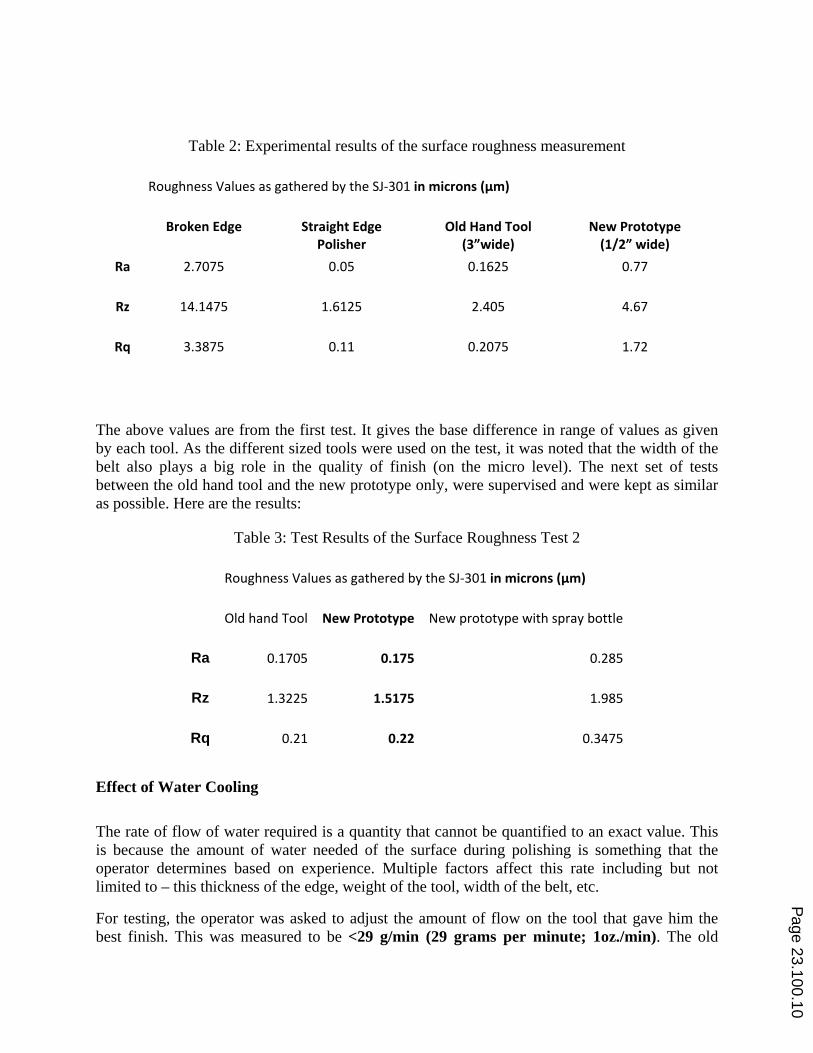
Table 2: Experimental results of the surface roughness measurement
Roughness Values as gathered by the SJ‐301 in microns (μm)
Broken Edge Straight Edge Polisher
Old Hand Tool (3”wide)
New Prototype (1/2” wide)
Ra 2.7075 0.05 0.1625 0.77
Rz 14.1475 1.6125 2.405 4.67
Rq 3.3875 0.11 0.2075 1.72
The above values are from the first test. It gives the base difference in range of values as given by each tool. As the different sized tools were used on the test, it was noted that the width of the belt also plays a big role in the quality of finish (on the micro level). The next set of tests between the old hand tool and the new prototype only, were supervised and were kept as similar as possible. Here are the results:
Table 3: Test Results of the Surface Roughness Test 2
Roughness Values as gathered by the SJ‐301 in microns (μm)
Old hand Tool New Prototype New prototype with spray bottle
Ra 0.1705 0.175 0.285
Rz 1.3225 1.5175 1.985
Rq 0.21 0.22 0.3475
Effect of Water Cooling
The rate of flow of water required is a quantity that cannot be quantified to an exact value. This is because the amount of water needed of the surface during polishing is something that the operator determines based on experience. Multiple factors affect this rate including but not limited to – this thickness of the edge, weight of the tool, width of the belt, etc.
For testing, the operator was asked to adjust the amount of flow on the tool that gave him the best finish. This was measured to be <29 g/min (29 grams per minute; 1oz./min). The old
Page 23.100.10
method included a second operator with a spray bottle spraying as close as possible on the surface between the glass and the sander. The squirt bottle consumed more water than the amount that was actually sprayed at the required area, and required another operator to spray. The flow rate based on the capacity of the spray bottle and the time it took the operator to refill the bottle again; it was determined to be 9 g/min (9 grams per minute; 0.3 oz./min).
The new design requires a larger flow rate, but it is important to note that it gives a better finish. We also tested for the impact made by the use of water. It was observed that without water, the glass edge chipped or cracked and even that some of the smaller grit belts became useless just after one use. But, with the use of water, the glass neither chipped nor was the belt destroyed.
Thermal Imaging
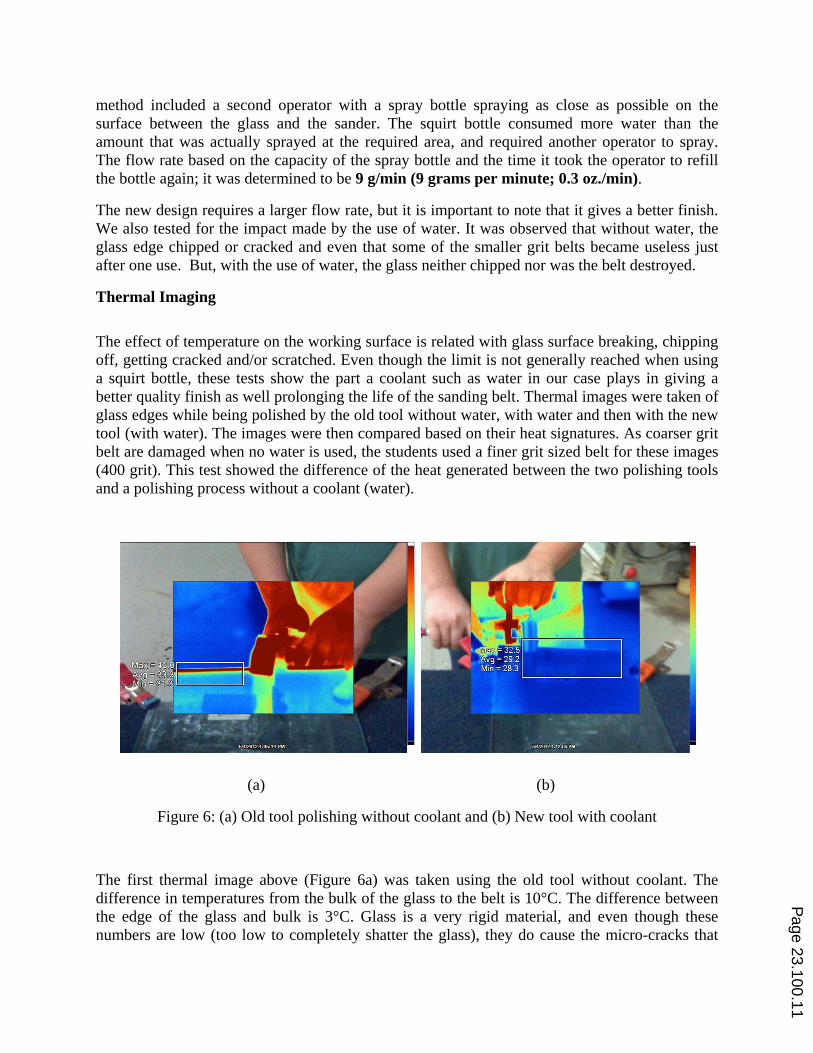
The effect of temperature on the working surface is related with glass surface breaking, chipping off, getting cracked and/or scratched. Even though the limit is not generally reached when using a squirt bottle, these tests show the part a coolant such as water in our case plays in giving a better quality finish as well prolonging the life of the sanding belt. Thermal images were taken of glass edges while being polished by the old tool without water, with water and then with the new tool (with water). The images were then compared based on their heat signatures. As coarser grit belt are damaged when no water is used, the students used a finer grit sized belt for these images (400 grit). This test showed the difference of the heat generated between the two polishing tools and a polishing process without a coolant (water).
(a) (b)
Figure 6: (a) Old tool polishing without coolant and (b) New tool with coolant
The first thermal image above (Figure 6a) was taken using the old tool without coolant. The difference in temperatures from the bulk of the glass to the belt is 10°C. The difference between the edge of the glass and bulk is 3°C. Glass is a very rigid material, and even though these numbers are low (too low to completely shatter the glass), they do cause the micro-cracks that
Page 23.100.11

turn up in the roughness measurements. Micro-cracks are undesirable in a finished piece of glass. This thermal image was taken with the old tool while using the manual spray bottle for coolant. The temperature is lower, but coolant spray is inconsistent, and not well aimed. The glass will gain heat between water mists, and will expand, but then cool and contract when hit with water again. This happens as the operator is generating cutting forces on the glass. This expansion and contraction creates the observed micro-cracks in the finished glass. The second thermal image above (Figure 6b) is of the new air tool running with water flow on the belt. There is no heat difference between the belt, the glass edge, or the bulk of the glass. This accounts for the better surface finish created by this tool, which has the least amount micro-cracks (almost none). In addition, designing a pneumatic tool that can operate in wet environments will give better finishes on glass, as water also aids in the prevention of micro-cracks.
Conclusion
For Engineering Technology students, a senior design project is a sequence of tasks required to reach objectives. Typically, the objectives are to design a device or process that has value to industry. The project begins by defining a performance problem associated with applications and ends with a prototype for a green design solution. The problem drives the learning required to complete the project. Managing the project requires the students to demonstrate effective teamwork, clear communication and the ability to balance the social, economic and environmental impacts of the project. The reduction in the number of operators for the polishing process and the extension of the tool life, allows Bent Glass Design Inc. to save cost for each tool replaced as well as to save the cost for a reduced operator. The company currently uses multiple tools to meet the increasing demand of polishing curved edges and is also planning on increasing the number of tools being designed by the senior design team. We believe that problem-based learning, as exemplified by a capstone Senior Design project such as this one, provides students with important knowledge about green design. In addition, such projects provide students with the essential project management and engineering skills required to bring complex projects from idea to completion.
Bibliography
1. Shellenberger et al, “Fast, Clean, & Cheap,” Harvard Law and Policy Review, 2008, vol. 2, no. 1, www.thebreakthrough.org.
2. World Economic Forum, “Green Investing: Toward a Clean Energy Infrastructure,” January 2009, www.weforum.org/pdf/climate/Green.pdf.
3. Rob Atkinson, Past and Future of America’s Economy: Waves of Innovation that Power Cycles of Growth, Northampton, Massachusetts: Edward Elgar, 2005, (p. 272).
4. Rob Atkinson and Scott Andes, “Atlantic Century: Benchmarking EU and U.S. Innovation and Competitiveness,” Information Technology and Innovation Foundation, February 2009, www.itif.org/!les/2009-atlantic-century.pdf.
5. Rob Atkinson, “8 Ideas for Improving the America COMPETES Act,” Information Technology and Innovation Foundation, March 2010, www.itif.org/!les/2010-america-competes.pdf.
6. ABET, “Criteria for Accrediting Engineering Programs”, ABET, Inc., 2012. 7. S. M. Williams, S. E. Reyer, and O. G. Petersen, Senior Design as a Transition from Academia to Industry.
Proceedings of the 2005 ASEE Annual Conference & Exposition, Session 2425. Portland, OR (2005).
Page 23.100.12
8. M. P. Brackin and J. D. Gibson, Capstone Design Projects with Industry: Emphasizing Teaming and Management Tools. Proceedings of the 2005 ASEE Annual Conference & Exposition, Session 1125. Portland, OR (2005).
9. R. Bachnak, S. Verma, and T. Coppinger, Restructuring the Capstone Course Leads to Successful Projects.Proceedings of the 2005 ASEE Annual Conference & Exposition, Session 1647. Portland, OR (2005).
10. C. Luongo and C. Shih, Senior Design Projects in Mechanical Engineering – A Case Study of Capstone Experience with Strong Industrial Participation. Proceedings of the 2006 ASEE Annual Conference & Exposition, Session 717. Chicago, IL (2006).
11. Kevin Cunningham, Shashank Gupta, Andrew Lerner, and David Resnick, Senior Design project: Glass EdgePolisher,DrexelUniversity,2012.
12. Bent Glass Design, Inc. – 3535 Davisville Road, Hatboro, Pa, 19040 - for pictures, current process studies, operators and feedback, testing grounds. Etc.
13. OSHA, QnA - Expert: Mike Brown CSP Retired - 7/10/2008, “Occupational (OSHA) and Environmental Hazards/Glass Dust from Sanding.”
14. Surface Finish Metrology Tutorial. Author: T. V. Vorburgur. Supervisory Physicist Center for Manufacturing Engineering, National institute of Standard and Technology, June 1990.
15. SJ-301 Surface Roughness Tester User’s Manual: Mitutoyo Corporation No. 99MBB091A8 Series No. 178.
Page 23.100.13