a sensitive immunoblotting method for measuring protein synthesis
TRANSCRIPT
THE JOURNAL OF BIOLOGICAL CHEMISTRY Vol. 256, No. 24. Issue of December 25, p p . 12836-12839, 1981 Prlnted in U S.A.
A Sensitive Immunoblotting Method for Measuring Protein Synthesis Initiation Factor Levels in Lysates of Escherichia coZi*
(Received for publication, July 20, 1981)
J. Greg Howe and John W. B. Hershey From the Department of Biological Chemistry, School of Medicine, University of California, Davis, California 95616
Protein synthesis initiation factor levels are meas- ured in crude cell lysates of Escherichia coli MRE600 by use of a sensitive immunoblotting method. The method involves electrophoretic transfer of protein from sodium dodecyl sulfate-polyacrylamide gels onto nitrocellulose paper and subsequent incubation with a specific antiserum and radioactive iodinated second antibody. The measurement of iodinated antibody at- tached to known amounts of initiation factor is deter- mined by densitometric scanning of autoradiographs or counting radioactivity in excised protein bands. Lin- ear standard curves over the range 1 to 300 ng of factor are obtained by these methods. Unknown amounts of initiation factor in crude cell lysates are measured ac- xrately; values agree with previous radioimmune as- say data. The immunoblotting method serves as an alternative to the radioimmune assay in measuring small quantities of protein in complex mixtures. Im- munoblotting enjoys three major advantages: it is sim- ple and rapid to execute; it is sensitive; and it is capable of distinguishing multiple forms of the antigen which separate in the gel system employed.
Knowledge of the cellular levels of enzymes and other proteins is an important part of understanding their functional role. We have been studying the protein synthesis initiation factors from Escherichia coli and are interested in determin- ing how factor levels change as the bacteria progress into different physiological states. Toward this goal we developed a radioimmune assay capable of measuring the levels of each of three initiation factors, IFl,’ IF2, and IF3, in crude cell lysates (1). The method is sensitive in the range 20 to 300 ng of factor, but is rather laborious and difficult to perform. It also fails to distinguish multiple forms of a factor such as IF2, which is known to occur as 118,000- and 90,000-dalton proteins (2, 3). To circumvent these difficulties, we recentIy utilized non-equilibrium pH gradient electrophoresis on polyacryl- amide gels, followed by a second dimension gel in SDS (4), to separate and quantitate initiation factors.2 This method is more rapid than the RIA, and is capable of distinguishing different molecular weight or isoelectric forms of the factors, but it suffers from two problems. Some proteins are not well resolved from other unrelated proteins in the lysate, and
* This work was supported by Grant NP-70 from the American Cancer Society. The costs of publication of this article were defrayed in part by the payment of page charges. This article must therefore be hereby marked “advertisement” in accordance with 18 U.S.C. Section 1734 solely to indicate this fact.
‘ The abbreviations used are: IF, initiation factor; SDS, sodium dodecyl sulfate; PAGE, polyacrylamide gel electrophoresis; IgG, im- munoglobulin G; RIA, radioimmune assay; PBS, IO m~ K phosphate, 150 mM NaCI.
* J. G . Howe and J. W. B. Hershey, manuscript in preparation.
quantitative entry of all prot,eins into the gel system is not always attained.
New methods for analyzing proteins have been described which combine polyacrylamide gel electrophoresis and im- munochemical techniques. Towbin and co-workers (5) de- scribed a technique for electrotransferring proteins from an SDS-polyacrylamide slab gel to a nitrocellulose sheet. The presence of specific proteins are then identified by treating the nitrocellulose with specific antibody. The presence of attached antibodies is determined by a coupled reagent which generates a color in situ. Renart et czl. (6) transferred protein from gels to diazobenzyloxymethyl paper and identified spe- cific antigens with antisera followed by treatment with I2’I- labeled protein A from Staphylococcus aureus. We have adapted these techniques to enable us to quantitate the levels of the initiation factors in crude cell lysates. The method is sensitive in measuring nanogram amounts of protein and is both simple and rapid. Its usefulness can be extended to quantitating changes in molecular weight or isoelectric forms for any protein for which specific antisera are available. While this work was in progress, a method was reported ( 7 ) for quantitating the subunits of the yeast cytochrome bcl com- plex; it is similar to that described here, but is much less sensitive.
EXPERIMENTAL PROCEDURES
Materials-E. coli strain MRE600 cells were grown in morpholi- nopropanesulfonic acid-minimal media supplemented with 0.4% glu- cose, 1% Bacto-tryptone, and 0.5% yeast extract (8). The cells were harvested in exponential phase, sonicated in buffer (IO mM Tris-HCl, pH 7.4,lO mM Mg acetate, 150 mM KC]) and clarified by centrifugation for 20 min at 30,000 X g. Protein concentration was determined by the methods of Lowry et al. (9) and Schaffner and Weissmann (10) with bovine serum albumin as standard. Initiation factors IF1, IF2a, and IF3 were prepared as described (2) and were greater than 95% pure. Preparation of rabbit antisera against each initiation factor has been described previously (1). To obtain purified immunoglobulin G , crude antiserum (500 pl) against IF2a was dialyzed against 1 liter of buffer (20 m m K phosphate, pH 8.0, and 0.01% sodium azide), and passed through a 1-ml Affi-Gel blue (Bio-Rad) column equilibrated with the same buffer. The flow-through fractions containing IgG were pooled and the protein was precipitated by adding ammonium sulfate to 45% saturation. The precipitated protein was collected by centrif- ugation and resuspended in 200 pl of PBS (10 mM K phosphate, PH 7.2; 150 mM NaC1) and dialyzed against PBS. Purified anti-IF2a IgG and S. eureus protein A (Sigma) were radioiodinated ( 1 1). Specific activities were between 0.5 and 1.5 X 10’ cpmlpg.
Electrotransfer of Protein to Nitrocellulose-Slab gel electropho- resis (10% acrylamide) was conducted by use of the SDS-PAGE system of L a e d i (12). Upon completion of the electrophoretic run, protein was transferred to nitrocellulose sheets essentially by the method of Towbin et al. (5). Slab gels (IO X 14 cm) were placed onto wetted nitrocellulose paper supported by Whatman 3” paper and scouring pads on each side. The sandwich was placed between two %- inch plastic sheets with 0.5-inch holes drilled into them opposite the position of the sandwich. The entire assembly was f r d y wrapped with glass-fiber tape and placed between two vertical wire mesh electrodes encased in a plastic chamber. The assembly fit snugly into
12836
Immunoblotting Method for Measuring Protein Levels 12837
the chamber to allow the current to pass only through the gel via the 0.5-inch holes. The chamber was filled with electrode buffer (25 KIM Tris-base 192 m glycine, 20% methanol, at pH 8.3) and electropho- resis was carried out a t 20 V, 300 mA for 6 h with the anode on the nitrocellulose side of the sandwich. The nitrocellulose paper was stained with Amido black (0.1% in 45% methanol and 10% acetic acid), destained (90% methanol and 2% acetic acid) and stored in water for up to 1 week (IO).
Antibody Incubation with Blotted Nitrocellulose-The blotted and stained nitrocellulose papers were incubated with 3% bovine serum albumin in saline (0.9% NaCI, 10 m Tris-HC1, pH 7.4) for 1 h a t 37 "C and rinsed twice with buffer A (0.2% SDS, 0.5% Triton X- 100,0.5% bovine serum albumin, and 0.01% NaN:3 in saline) (13). Anti- IF1 and anti-IF3 were diluted with buffer A 1:25 and 1:100, respec- tively; I2'I-anti-IF2a was used at 0.1 to 0.4 pg/ml. The diluted antise- rum (10 to 40 m l ) and blots were incubated together with gentle shaking a t room temperature for 12 h. The blots were washed with buffer A for 30 min and five changes. When the second antibody, I2'I- labeled S. aureus protein A, was used, it was diluted in buffer A to 5 X 10" cpm/ml and 10 to 40 ml were incubated with the washed blots for 6 h. Again the blot was washed with buffer A for 30 min and five changes. After washing, the blots were air dried and exposed to Kodak X-OMAT SB film as indicated in the figure legends.
Quantitation of Radioactivity on the Nitrocellulose Blots-Two different methods were used to measure the amount of "'I-IgG or "'I-protein A bound to the nitrocellulose blot. In the first method, the autoradiograph was scanned in a Cary 210 Spectrophotometer
interfaced with a Hewlet Packard 9845A computer. The individual (Varian) with a gel-scanning accessory. The spectrophotometer was
lanes on the autoradiograph were scanned and analyzed with use of a gel-scanninz program written by Harry Matthews and modified by Frank Zucker (Davis, CA). The second method involved placing the exposed autoiadlograph on top of the nitrocellulose paper and with a scalpel blade cutting out the darkened band and the nitrocellulose sheet beneath. The ;:?yocellulose chip was counted in a Tracer Analytic model 1197 (Searle) y counter.
RESULTS AND DISCUSSION
Quantitation by Immunoblotting Towbin et al. (5) and Renart et al. (6) described procedures
for electrotransfemng proteins separated by SDS-PAGE onto nitrocellulose sheets or diazobenzyloxymethyl paper and iden- tifying specific proteins by treating the sheet with antibodies. We modified the general procedure to allow quantitation of the levels of proteins in a crude mixture. The quantitative assay is dependent on the following conditions: all of the protein in the sample must enter the polyacrylamide gel and be transferred to the nitrocellulose sheet; the amount of antibody bound to the nitrocellulose must be proportional to the amount of antigen analyzed; and the presence of other components in the sample may not affect the assay results. These conditions are satisfied when assays with crude E. coli lysates are analyzed as described under "Experimental Pro- cedures." The following control experiments document this assertion.
Conditions for Quantitative Transfer-We tested the rate of electrotransfer of cell lysate proteins over 6 h by exchanging the nitrocellulose blot with a new sheet every hour. Electro- transfer of small proteins proceeds more rapidly than large proteins, as shown in Fig. L4. Low molecular weight proteins required 1 to 2 h for quantitative transfer in our apparatus, whereas the highest molecular weight proteins need up to 6 h. That all of the protein is transferred after 6 h was shown by staining the polyacrylamide gel with a sensitive silver stain (14); no residual proteins were detected in the gel (results not shown). I t is important to show that all of the proteins which leave the gel actually bind to the nitrocellulose sheet. We analyzed different amounts of lysates and pure IF2a by using two nitrocellulose sheets and asked at what protein level is the first nitrocellulose sheet saturated, resulting in binding to the second sheet. As shown in Fig. 1, all of the protein binds
a. 8. c. D. E. I 2 3 4 5 6 IO 40100 10 40100 I 3 10MlWMO I 2 3 4 5
. L = , ~.
i n - X F S
-IF1
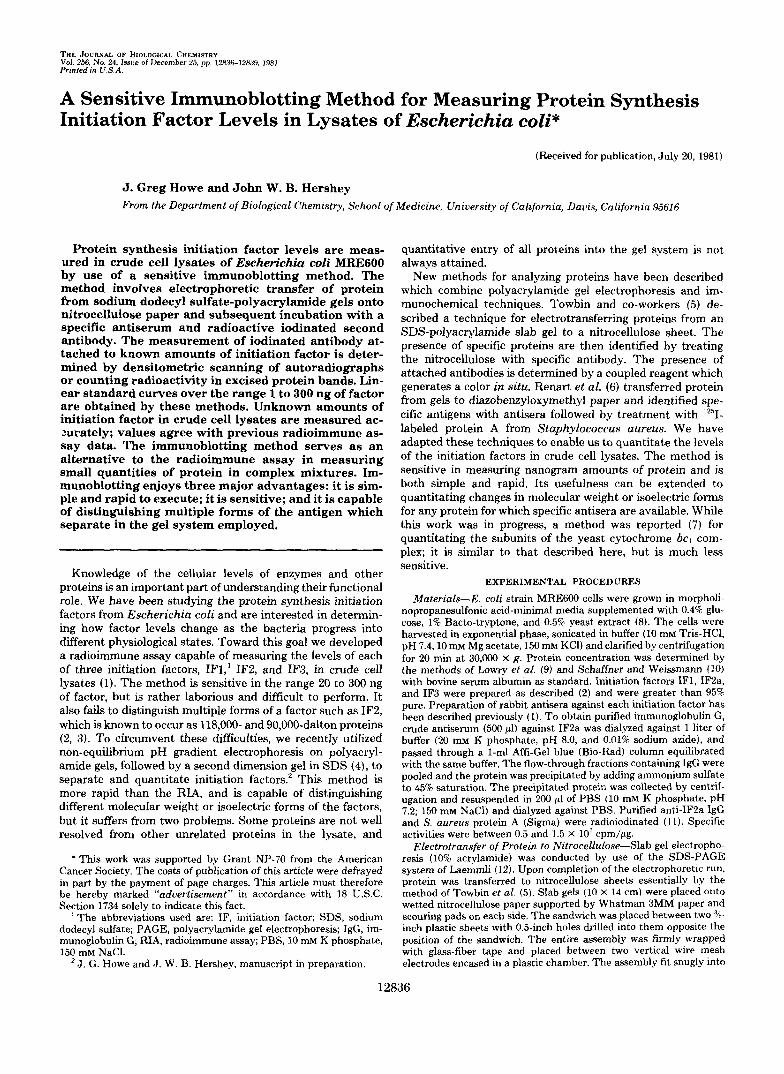
FIG. 1. Electrotransfers and immunoblots. Panel A, effect of electrotransfer time. An E. coli lysate (40 pg of protein) was subjected to PAGE and electrotransfer as described under "Experimental Pro- cedures." After each hour of electrotransfer, the nitrocellulose sheet was removed and replaced by a new sheet, and electrotransfer was continued. Each sheet was stained with Amido black and photo- graphed. The figure shows photographs of the blotted, stained lane obtained after 1, 2, 3,4, 5, and 6 h of electrotransfer. Panel B, E. coli lysates (IO, 40, and 100 pg of protein) were electrotransferred for 6 h in a sandwich containing two nitrocellulose sheets. The figure shows the Amido black-stained sheet nearer the gels. Panel C, the same electrotransfer experiment as panel B, except that the stained sheet shown is that further from the gel. Panel D, IF2a in nanogram amounts shown at the top of the figure were subjected to PAGE and immunoblotting with 12'I-anti-IF2a as described under "Experimental Procedures." The figure shows the autoradiograph exposed for 21 h. Panel E , the figure shows autoradiographs of immunoblots of crude lysates of cells harvested in early exponential phase from rich media. Lanes I to 3 contain 5, 10, and 20 pg of lysate protein, respectively, and were treated with '*'I-anti-IF2a. Lane 4 contains 40 pg of lysate protein and was treated with a 1:IOO dilution of anti-IF3 and I2'I- protein A. Lane 5 contains 40 pg of lysate protein and was treated with a 1:25 dilution of anti-IF1 and "'I-protein A. The migration positions of standard initiation factors are shown on the right.
to the first sheet (panel B ) when 10 pg of lysate are analyzed some smaller molecular weight proteins (range: 10,000 to 20,000) pass through to the second sheet (panel C ) a t 40 pg of lysate; 100 pg of lysate substantially exceeds the capacity of the first nitrocellulose sheet. IF2a as a single sharp band was completely retained by the first sheet up to 0.5 pg of protein (results not shown). Similarly, bovine serum albumin up to 1 pg of protein was quantitatively recovered on a nitrocellulose sheet as determined by staining (10); at 10 pg, 73% of the protein bound (results not shown). No protein could be de- tected when nitrocellulose sheets were placed on the cathode side of the gel (results not shown). This is in contrast to results reported by Buhler et al. (13) and may be due to differences in the amount of SDS formed in a complex with the proteins. Our experiments indicate that care must be taken in order not to exceed the binding capacity of the nitrocellulose sheets and in allowing electrophoresis to proceed long enough to transfer all proteins. The actual time required depends in part on the apparatus used, and should be determined empirically.
Quantitation of Specific Antibody Bound-In order to obtain low background levels of radioactivity with '251-IgG or "'I-protein A, we utilized a buffer containing 0.2% SDS and 0.5% Triton X-100 for the antibody adsorptions, as suggested by Buhler et al. (13). This buffer system is very effective in enhancing the signal/noise ratio, and allows us to detect less than 5 ng of initiation factors, even with the low titer anti-IF1 antiserum. The nitrocellulose sheet following electrotransfer was treated with bovine serum albumin and then either with labeled antibody or with antibody followed by labeled protein A, as described under "Experimental Procedures." The amount of antibody used was in excess of that amount needed to give a maximal response when tested a t different dilutions.
Two methods for quantitating the amount of bound radio- activity were used. In the first, radioactive bands were excised and counted in a y counter as described under "Experimental
12838 Immunoblotting Method for Measuring Protein Levels
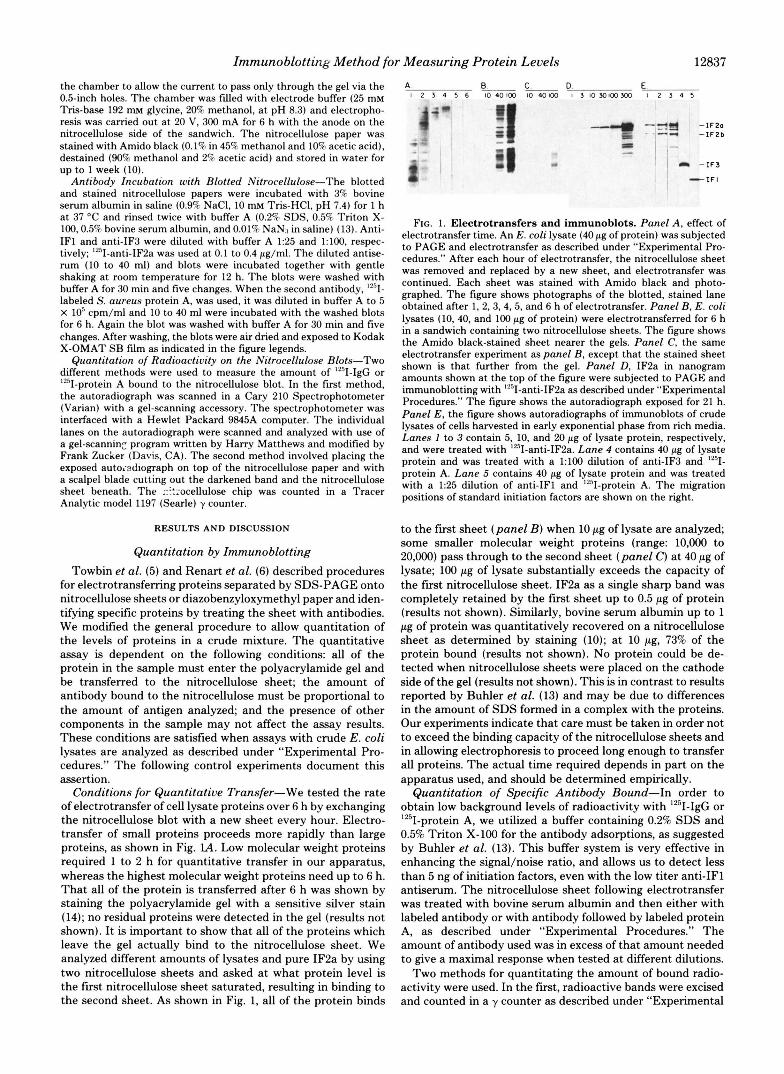
FIG. 2 (left). Densitometric scan areas as a function of auto- radiograph exposure time. The IF2a blots shown in Fig. 1D were exposed for the times indicated in the figure and were scanned as described under “Experimental Procedures.” Areas for the IF2a peaks were computed and are expressed as absorbance X millimeters. The dashed diagonal line shows the theoretical slope for a linear re- sponse.
FIG. 3 (center). Standard curves for initiation factors. Nano- gram quantities of IFl, IF2a, and IF3 were analyzed by immunoblot- ting and quantitated by scanning (lines b, d , and e) or counting (lines a and c) as described under “Experimental Procedures.” a, @”+3, IF2a with 1Z51-anti-IF2a; b, .”., IF2a with lZ5I-anti-IF2a and a 2-
Procedures.” This is a suitable method if the band to be cut out is well isolated from other labeled bands. The bands of “‘I-anti-IF2 from Fig. 1D were excised and counted, and results are shown in Fig. 3 (curve a) . This standard curve is linear over a range from 1 to 300 ng. In the second method, an autoradiograph of the blot was developed and scanned, and the peaks were integrated to yield areas which are propor- tional to the radioactivity present. A problem with using exposed x-ray film is that it may become saturated and no longer give a linear response to increased radioactivity. Fig. 2 shows that as a blotted set of IF2a standards (30 to 300 ng) is exposed for longer lengths of time, intensity (area) of the bands in the exposed autoradiograph begins to level off. In order to produce an adequate standard curve, an exposure time which is in the linear range (i.e. parallel to the dashed line in Fig. 2) of all of the standard points must be chosen. Such a standard curve, developed from an autoradiograph of the blot illustrated in Fig. 11), is shown in Fig. 3 (curue b). As in the direct counting method, the standard curve is linear over a wide range. The scanning method is more ideally suited to analyzing a number of labeled bands in a single gel lane, especially if they are not well separated.
Effect of Lysate Components on Assay-An IF2a standard curve was determined in the presence of a constant amount of cell lysate. The same incremental increase in radioactivity in the IF2a bands, due to the addition of known amounts of IF2a, was observed whether lysate was present or not (results not shown). The amount of IF2a measured is therefore the sum of the amounts in the lysate and in the purified fractions added no effect of one on the other was observed.
Initiation Factor Levels and Molecular Weight Forms in Cell Lysates
Bacterial cells were harvested in exponential phase and lysed into nondenaturing buffer as described under “Experi- mental Procedures.” Analyses of such clarified lysates with antisera against IFl, IF2a, and IF3 are shown in Fig. 1E. These and similar autoradiographs were scanned in the gel region appropriate for each factor, and factor levels were computed from the standard curves shown in Fig. 3. The
h exposure time; c, 0-“0, IF2a with nonradioactive anti-IF2a and ‘251-protein A; d, A-A, IF1 with anti-IF1 and 1z51-protein A and a 5-h exposure time; and e M, IF3 with anti-IF3 and ’251-protein A and a 20-min exposure time.
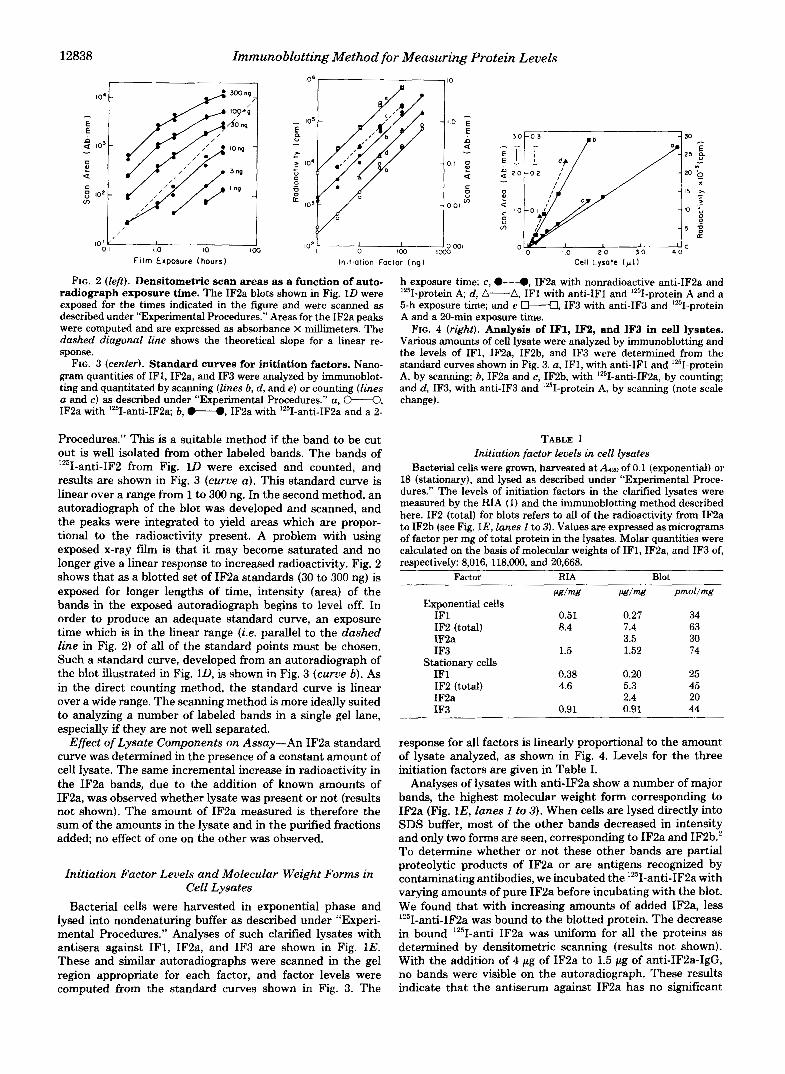
FIG. 4 (right). Analysis of IF1, IF2, and IF3 in cell lysates.
the levels of IFI, IF2a, IFZb, and IF3 were determined from the Various amounts of cell lysate were analyzed by immunoblotting and
standard curves shown in Fig. 3. a, IF1, with anti-IF1 and ‘251-protein A, by scanning; 6, IF2a and c, IF2b, with lZ5I-anti-IF2a, by counting; and d , IF3, with anti-IF3 and ‘251-protein A, by scanning (note scale change).
TABLE I Initiation factor levels in cell lysates
Bacterial cells were grown, harvested at A4m of 0.1 (exponential) or 18 (stationary), and lysed as described under “Experimental Proce- dures.” The levels of initiation factors in the clarified lysates were measured by the RIA (1) and the immunoblotting method described here. IF2 (total) for blots refers to all of the radioactivity from IF2a to IF2b (see Fig. IE, lanes 1 to 3). Values are expressed as micrograms of factor per mg of total protein in the lysates. Molar quantities were calculated on the basis of molecular weights of IF1, IF2a, and IF3 of, respectively: 8,016, 118,000, and 20,668.
Factor RIA Blot w / m g M/mg pmol/mg
Exponential cells IF1 0.51 0.27 34 IF2 (total) 8.4 7.4 63 IF2a 3.5 30 IF3 1.5 1.52 74
IF1 0.38 0.20 25 IF2 (total) 4.6 5.3 45 IF2a 2.4 20 IF3 0.91 0.91 44
Stationary cells
response for all factors is linearly proportional to the amount of lysate analyzed, as shown in Fig. 4. Levels for the three initiation factors are given in Table I.
Analyses of lysates with anti-IF2a show a number of major bands, the highest molecular weight form corresponding to IF2a (Fig. lE , lanes 1 to 3). When cells are lysed directly into SDS buffer, most of the other bands decreased in intensity and only two forms are seen, corresponding to IF2a and IF2b.’ To determine whether or not these other bands are partial proteolytic products of IF2a or are antigens recognized by contaminating antibodies, we incubated the lZ5I-anti-IF2a with varying amounts of pure IF2a before incubating with the blot. We found that with increasing amounts of added IF2a, less Iz5I-anti-IF2a was bound to the blotted protein. The decrease in bound lZ5I-anti IF2a was uniform for all the proteins as determined by densitometric scanning (results not shown). With the addition of 4 pg of IF2a to 1.5 pg of anti-IF2a-IgG, no bands were visible on the autoradiograph. These results indicate that the antiserum against IF2a has no s igdkant
Immunoblotting Method for Measuring Protein Levels 12839
levels of contaminating antibodies which bind to other bac- terial proteins and that the proteins which bind to anti-IF2a are truly related to IF2a. The blots also show that the IF2b form which has been purified (2, 3) is present in intact cells and is not an artifact of isolation.
When lysates are analyzed with anti-IF3 (Fig. IE, lane 4), a single major band is seen which corresponds in molecular weight to IF3. Only a single molecular weight form of IF3 is seen, whereas two forms of IF3 have been reported (15, 16) which differ in length by 6 amino acid residues (17). Appar- ently, the second form is not present in these extracts of strain MREGOO. Anti-IF1 serum (Fig. lE, lane 5) shows a major band corresponding to IF1 and a number of minor bands of higher molecular weight, presumably due to contaminating antibodies. The detection of contaminating antibodies in the anti-IF1 serum occurs in part because the titer of anti-IF1 antibodies is lower and more serum is used in the immuno- blotting procedure. Nevertheless, the band corresponding to IF1 is the strongest in intensity, and quantitation of the factor is not compromised by the low level impurities in the antise- rum. A detailed analysis of the various forms of the initiation factors and their degradation products will be presented else- where.'
Comparison with Other Methods
In earlier work, we developed a radioimmune assay which is able to measure amounts of the three initiation factors in crude cell lysates. When we compare the amounts of initiation factors in crude cell lysates from exponential and stationary cells as assayed by the radioimmune assay and the blotting assay, there is good agreement (Table I). The amounts of IF3 are nearly identical. The amounts of IF1 are one-half in the blotting assay. Because of the low antibody titer and low amount of IF1 (levels near the nonlinear portion of the RIA standard curve), the RIA analyses may have been inaccurate. A different problem exists with anti-IFZa. Fig. 1E shows the numerous lysate proteins which bind to anti-IF2a. When the amount of IF2a by the blotting assay is compared with the RIA, it is found to be one-half of the RIA. However, the numerous proteins which bind to anti-IF2a are probably re- lated to IF2a. If all of the radioactivity between IF2a and IF2b are added together, a comparable number to the RIA figure is obtained (Table I).
The quantitative immunoblotting procedure compares fa- vorably with the more classical radioimmune assay, and in some ways is superior. Both methods are comparably sensitive and can measure protein levels in complex mixtures. The RIA requires either monospecific antisera or a radioactive antigen of very high purity. Immunoblotting can tolerate considerable levels of antibody impurities if the antigens recognized are
separable by polyacrylamide gel electrophoresis. Further- more, immunoblotting can distinguish different molecular forms of an antigen whereas the RIA cannot. For example, in this work we are able to measure the IF2a and IF2b molecular weight forms independently. If isoelectric focusing gels rather than SDS-gels are used, forms differing in charge (e.g. phos- phorylated forms) can be distinguished and their levels quan- titated. A further advantage of the immunoblotting procedure is that antibody cross-reactivity with other proteins can be readily detected and need not influence the quantitative re- sults. Thus, this method provides significant advantages over the RIA in some situations, and yet is comparably rapid and simple in execution. We are currently using the quantitative immunoblotting procedure to analyze initiation factor forms in mammalian cells and as a screening procedure for identi- fying recombinant DNA clones carrying bacterid initiation factor genes.
Acknowledgments-We thank Susan Milburn and Sue Corbett for help in developing the electrotransfer procedures and for stimulating discussions, and Beverley Haskins for expert typing of the manuscript.
REFERENCES 1. Howe, J. G., Yanov, J., Meyer, L., Johnston, K., and Hershey, J .
2. Hershey, J. W. B., Yanov, J., Johnston, K., and Fakunding, J. L.
3. Miller, M. J., and Wahba, A. J. (1973) J. Biol. Chem. 248, 1084-
4. O'Farrell, P. Z., Goodman, H. M., and O'Farrell, P. H. (1977) Cell
5. Towbin, H., Staehelin, T., and Gordon, J. (1979) Proc. Natl.
6. Renart, J., Reiser, J., and Stark, G. R. (1979) Proc. Natl. Acad.
7. Vaessen, R. T. M. J., Kreike, J., and Groot, G. S. P. (1981) FEBS
8. Parker, J., Flashner, M., McKeever, W. G., and Neidhardt, F. C.
9. Lowry, 0. H., Rosebrough, N. J., Farr, A. L., and Randall, R. J.
10. Schaffner, W., and Weissmann, C. (1973) Anal. Biochem. 56,502-
11. Broome, S., and Gilbert, W. (1978) Proc. Natl. Acad. Sci. U. S. A.
12. Laemmli, U. K. (1970) Nature (Lond.) 227,680-685 13. Buhler, J. M., Huet, J., Davies, K. E., Sentenac, A,, and Froma-
geot, P. (1980) J. Biol. Chem. 255,9949-9954 14. Oakley, B. R., Kirsch, D. R., and Morris, N. R. (1980) Anal.
Biochem. 105,361-363 15. Lee-Huang, S., and Ochoa, S. (1973) Arch. Biochem. Biophys.
156,84-96 16. Suryanarayana, T., and Subramanian, A. R. (1977) FEBS Lett.
17. Brauer, D., and Wittmann-Liebold, B. (1977) FEBS Lett. 79,269-
W. B. (1978) Arch. Biochem. Biophys. 191,813-820
(1977) Arch. Biochem. Biophys. 182,626-638
1090
12, 1133-1142
Acad. Sci. U. S. A. 76,4350-4354
Sci. U. S. A. 76,3116-3120
Lett. 124,193-196
(1974) J. Biol. Chem. 249, 1044-1053
(1951) J. Biol. Chem. 193,265-275
514
75,2746-2749
79,264-268
275