a shared financial planning style is essential for couples...
TRANSCRIPT
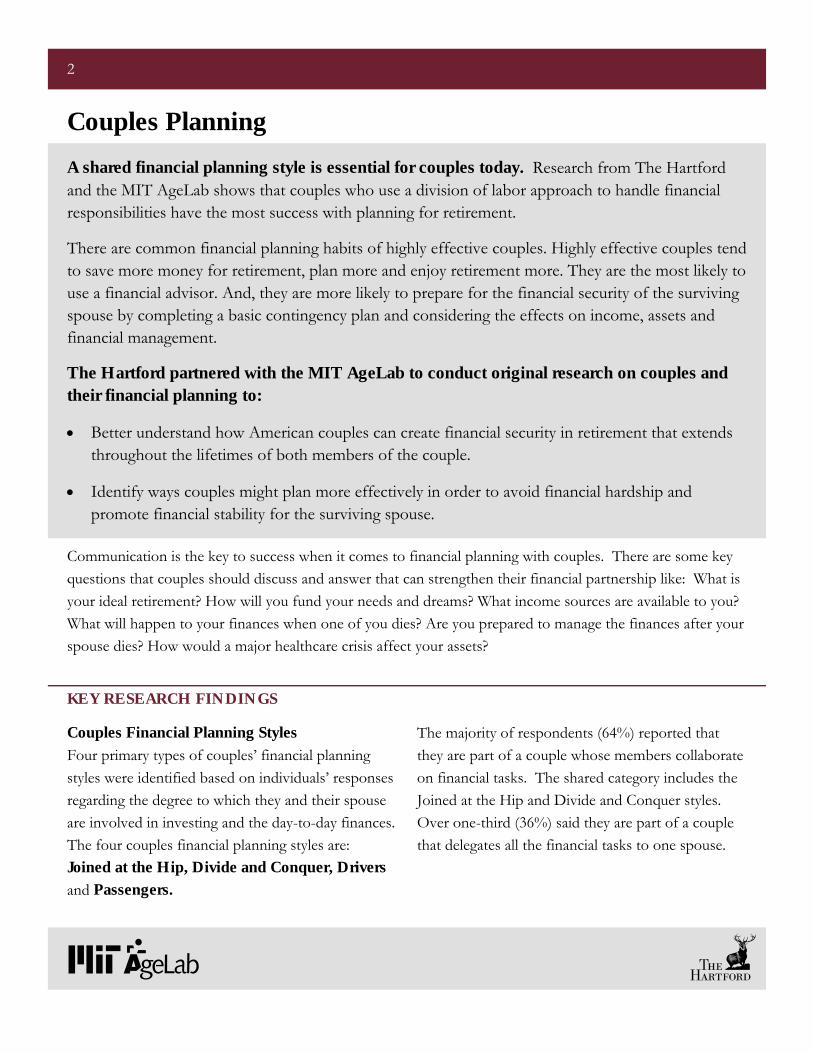
Couples Financial Planning Styles
Four primary types of couples’ financial planning styles were identified based on individuals’ responses regarding the degree to which they and their spouse are involved in investing and the day-to-day finances. The four couples financial planning styles are: Joined at the Hip, Divide and Conquer, Drivers
and Passengers.
The majority of respondents (64%) reported that they are part of a couple whose members collaborate on financial tasks. The shared category includes the Joined at the Hip and Divide and Conquer styles. Over one-third (36%) said they are part of a couple that delegates all the financial tasks to one spouse.
2
A shared financial planning style is essential for couples today. Research from The Hartford and the MIT AgeLab shows that couples who use a division of labor approach to handle financial responsibilities have the most success with planning for retirement.
There are common financial planning habits of highly effective couples. Highly effective couples tend to save more money for retirement, plan more and enjoy retirement more. They are the most likely to use a financial advisor. And, they are more likely to prepare for the financial security of the surviving spouse by completing a basic contingency plan and considering the effects on income, assets and financial management.
The Hartford partnered with the MIT AgeLab to conduct original research on couples and their financial planning to:
• Better understand how American couples can create financial security in retirement that extends throughout the lifetimes of both members of the couple.
• Identify ways couples might plan more effectively in order to avoid financial hardship and promote financial stability for the surviving spouse.
Couples Planning
KEY RESEARCH FINDINGS
Communication is the key to success when it comes to financial planning with couples. There are some key questions that couples should discuss and answer that can strengthen their financial partnership like: What is your ideal retirement? How will you fund your needs and dreams? What income sources are available to you? What will happen to your finances when one of you dies? Are you prepared to manage the finances after your spouse dies? How would a major healthcare crisis affect your assets?
3
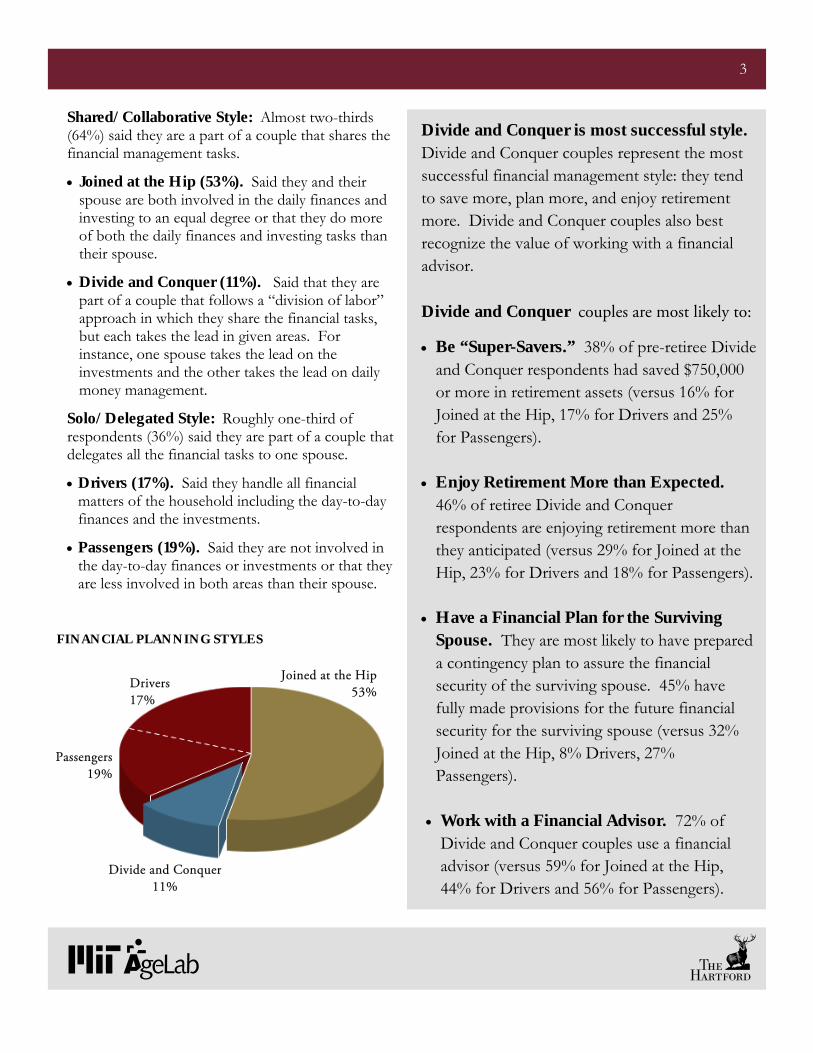
Shared/Collaborative Style: Almost two-thirds (64%) said they are a part of a couple that shares the financial management tasks.
• Joined at the Hip (53%). Said they and their spouse are both involved in the daily finances and investing to an equal degree or that they do more of both the daily finances and investing tasks than their spouse.
• Divide and Conquer (11%). Said that they are part of a couple that follows a “division of labor” approach in which they share the financial tasks, but each takes the lead in given areas. For instance, one spouse takes the lead on the investments and the other takes the lead on daily money management.
Solo/Delegated Style: Roughly one-third of respondents (36%) said they are part of a couple that delegates all the financial tasks to one spouse.
• Drivers (17%). Said they handle all financial matters of the household including the day-to-day finances and the investments.
• Passengers (19%). Said they are not involved in the day-to-day finances or investments or that they are less involved in both areas than their spouse.
Divide and Conquer is most successful style. Divide and Conquer couples represent the most successful financial management style: they tend to save more, plan more, and enjoy retirement more. Divide and Conquer couples also best recognize the value of working with a financial advisor. Divide and Conquer couples are most likely to:
• Be “Super-Savers.” 38% of pre-retiree Divide and Conquer respondents had saved $750,000 or more in retirement assets (versus 16% for Joined at the Hip, 17% for Drivers and 25% for Passengers).
• Enjoy Retirement More than Expected.
46% of retiree Divide and Conquer respondents are enjoying retirement more than they anticipated (versus 29% for Joined at the Hip, 23% for Drivers and 18% for Passengers).
• Have a Financial Plan for the Surviving
Spouse. They are most likely to have prepared a contingency plan to assure the financial security of the surviving spouse. 45% have fully made provisions for the future financial security for the surviving spouse (versus 32% Joined at the Hip, 8% Drivers, 27% Passengers).
• Work with a Financial Advisor. 72% of
Divide and Conquer couples use a financial advisor (versus 59% for Joined at the Hip, 44% for Drivers and 56% for Passengers).
FINANCIAL PLANNING STYLES
Drivers 17%
Passengers 19%
Divide and Conquer 11%
Joined at the Hip 53%
It helps to do some serious self-reflection on how you and your spouse are approaching your retirement planning process. Successful couples use some simple steps to build their retirement plans.
4
Planning Together: What Works for Highly Effective Couples
Communicate By talking very clearly about both day-to-day household finances and your long-term financial plans, you are ensuring that neither of you will be surprised.
Envision Your Ideal Retirement If you could do anything or go anywhere in retirement, and money were no object, what would you do? And, on the other hand, what would you absolutely not want to do? What do you think your primary role will be in retirement: grandparent, volunteer, student, employee, other? Once you’ve thought about your dreams and your role, think about what it would take to fund your needs.
Consult An Expert The research showed that “Divide and Conquer” couples are significantly more likely to seek the assistance of a professional financial advisor (72% of those surveyed versus 59% of those who are “Joined at the Hip,” 44% of the “Drivers” and 56% of the “Passengers”). A financial advisor can play a critical role in helping to coach couples and facilitate communication. By taking a few additional simple steps to plan for each other’s future financial well-being, a trusted financial advisor can help couples avoid issues later in life.
Answer Three Key Questions
1. How will your income change after one of you dies? ● What income sources will continue or disappear? ● What ways can the surviving spouse make up for any loss of income? Do you have a plan? Does your spouse know about it? ● For annuities and pensions, have you selected a survivor benefit and do you know what portion each of you will receive (or not)? ● Have you reviewed your beneficiary designations (examples: IRA, life insurance, bank accounts)? ● Have you done calculations of retirement income for both of you (they could be different)?
2. Are you prepared to manage the finances after your spouse dies? ● How will you maintain cash flow? ● How will you manage investments? Do you both have the same risk tolerance? ● Do you have an estate plan in place? ● Can you find the checkbook, access computer files, find paperwork?
3. How would a major healthcare crisis affect your assets? ● Are you prepared if one of you becomes disabled? ● Are you prepared if one of you has a serious illness?
Older singles have less financial security than couples. In retirement, non-married people are often worse-off financially than married people. Of the population age 65 and older, 28% of single women and 23% of single men are poor or near poor compared with only 8% of married people in that age group.1
Older women are twice as likely to be single as men. Among women age 65 and older, 60% are single compared to 29% of men of the same age. 2 As women get older, their probability of being single increases. Single women comprise over 30% of households aged 65-69, nearly 50% of households aged 75-79 and over 60% of households age 85 and older.1
Women are most at risk of financial insecurity in old age. • Women must stretch less money over a longer time. Gerontologists have long known that women are vulnerable to financial insecurity in old age. Compared to men, women tend to: live longer; have shorter total employment years; and have lower lifetime earnings.3 Nearly one-third of all women who are 65 today will live into their 90s.4 In successive cohorts born in the 1940s and 1950s, declining percentages of women will be eligible for spousal and widow benefits from Social Security.5 Going into retirement, then, women typically bring fewer financial resources than men do. All women, controlling for age, save less for retirement than men do, making longevity risks for women all the more acute: they need to stretch less money over a longer period of time.
5
Highly effective planning couples not only consider how they can create financial security for themselves as a couple, but also plan for the financial needs of the surviving spouse.
Challenges For The Surviving Spouse
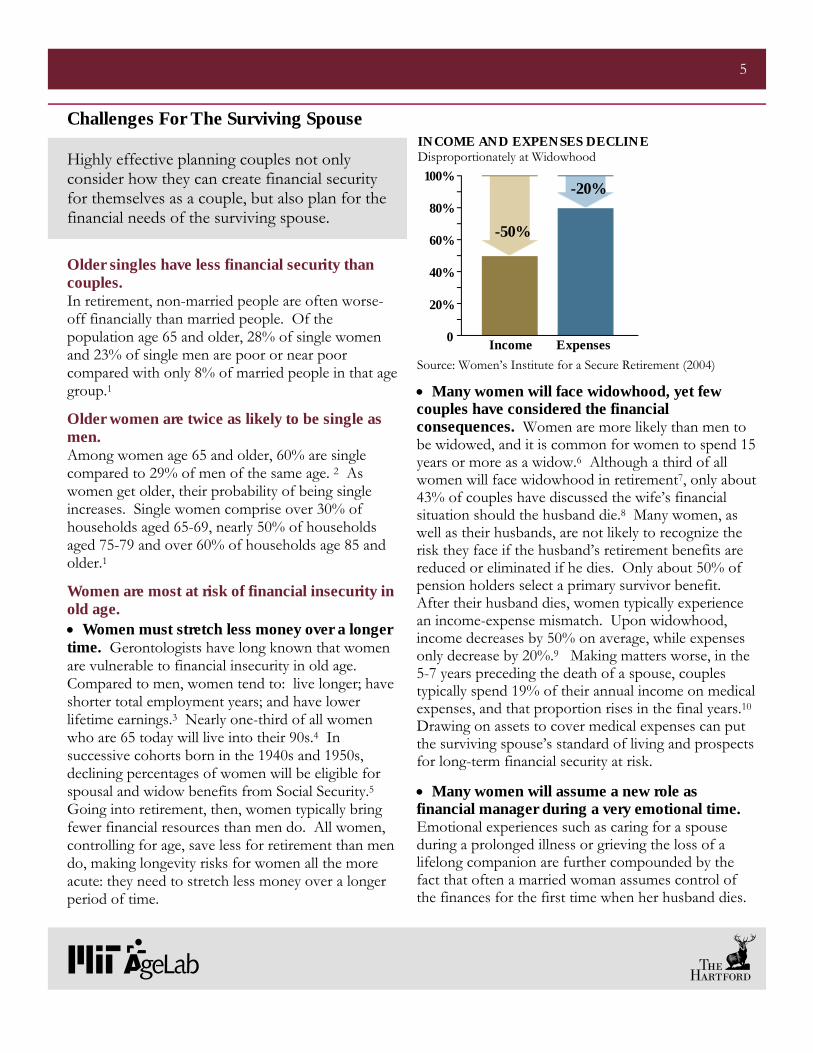
• Many women will face widowhood, yet few couples have considered the financial consequences. Women are more likely than men to be widowed, and it is common for women to spend 15 years or more as a widow.6 Although a third of all women will face widowhood in retirement7, only about 43% of couples have discussed the wife’s financial situation should the husband die.8 Many women, as well as their husbands, are not likely to recognize the risk they face if the husband’s retirement benefits are reduced or eliminated if he dies. Only about 50% of pension holders select a primary survivor benefit. After their husband dies, women typically experience an income-expense mismatch. Upon widowhood, income decreases by 50% on average, while expenses only decrease by 20%.9 Making matters worse, in the 5-7 years preceding the death of a spouse, couples typically spend 19% of their annual income on medical expenses, and that proportion rises in the final years.10 Drawing on assets to cover medical expenses can put the surviving spouse’s standard of living and prospects for long-term financial security at risk.
• Many women will assume a new role as financial manager during a very emotional time. Emotional experiences such as caring for a spouse during a prolonged illness or grieving the loss of a lifelong companion are further compounded by the fact that often a married woman assumes control of the finances for the first time when her husband dies.
INCOME AND EXPENSES DECLINE
-50%
Income Expenses
-20%
Source: Women’s Institute for a Secure Retirement (2004)
Disproportionately at Widowhood 100%
80%
60%
40%
20%
0
6
Relationship of Planning Styles to Other Variables
Gender For the two-thirds of married respondents who were members of a couple with a collaborative approach to financial management, there are no gender differences in their likelihood to be members of a Joined at the Hip couple versus a Divide and Conquer couple. The proportion of men and women reporting they are part of a Joined at the Hip couple is 53.8% and 52.3% respectively, and the proportion of men and women reporting they are part of the Divide and Conquer couple is 11.2% and 10.9% respectively.
For the one-third of married respondents who are members of a couple with a delegated approach, married men are more likely to report they are Drivers than married women (21.6% of married men versus 13.3% of married women), and married women were more likely to be Passengers than married men (23.5% of married women versus 13.4% of married men).
Income Income demographics among the four financial management styles varied significantly between retiree and pre-retiree groups.
• For retirees: 44.1% of the Drivers had incomes of $100,000 or more. Only 21.6% of the Passengers, 17.4% of the Divide and Conquer, and 24.4% of the Joined at the Hip were at the $100,000 or more income level. At the other end of the income spectrum, 47.1% of the Passengers made $49,999 or less. This compares to 35.3% of the Drivers, 30.4% of the Divide and Conquer, and 32.3% of the Joined at the Hip at the $49,999 or less income level.
• For pre-retirees: The majority of Divide and Conquer couples tended to have higher income levels, with 61.5% making $100,000 or more. Only 5.8% of the Divide and Conquer made $49,999 or less. Among Drivers, 52.5% made $100,000 or more and 7.5% made $49,999 or less. 35% of the Passengers made $100,000 or more with 11.3% at the $49,999 or less income level. Joined at the Hip couples’ statistics show that 33.2% made over $100,000 or more, and 12.4% made $49,999 or less.
Couples financial planning styles are related to other factors in six categories shown on pages 6 - 9:
Health Compared with other financial management styles, Passengers were more likely to report that they were in fair or poor health (16.2% of the Passengers, versus 6.7% of the Divide and Conquer, 8.0% of the Drivers, and 10.3% of the Joined at the Hip).
Compared with other financial management styles, Drivers were more likely to report that their spouses were in fair or poor health (21.9% of the Drivers versus 12.2% of the Divide and Conquer, 7.8% of the Passengers, and 11.7% of the Joined at the Hip). Health of self or spouse may thus add significantly to the physical, emotional and tactical demands that the household must manage, stretching household management resources further. Although we cannot say definitively with these data, poor health of one or more spouse in the household may push the household financial management toward a more delegated style of financial management, even if the couple may have used a shared style in the past.
Education Divide and Conquer were more likely to have higher levels of education – bachelor’s or advanced/professional degrees. Among the Divide and Conquer, 36.0% had a bachelor’s degree, and 27.0% had an advanced or professional degree. Among the Joined at the Hip, 35.4% had some college or an associate’s degree, 29.7% had a bachelor’s degree, and 23.9% had an advanced or professional degree. Among the Drivers, 24.8% had some college or an associate’s degree; 24.1% had a bachelor’s degree. 39.4% of the Drivers had an advanced or professional degree. 19.0% of the Passengers had a high school diploma or less, and 24.2% of the Passengers had an advanced or professional degree.
Age Age was not statistically related to couples’ financial management style. Though many people may think that older individuals are more likely to be part of a couple where one person dominates the financial management, we found that this was not the case. For instance, respondents who described themselves as Drivers were just as likely to be in the 45-55 age group as they were to be in the 65-74 age group.
1. Demographics
Money to Live on in Retirement Meets their Expectations Among retirees, Divide and Conquer and Drivers were more likely to say that they had more money to live on in retirement than they had expected. Divide and Conquer were less likely than others to say that the amount of money in retirement was less than they had expected; Passengers were much more likely to be unpleasantly surprised in retirement: 39.7% of Passengers said the amount of money they had in retirement was less than they had expected.
Mortgage Debt Divide and Conquer were less likely to say that they would not have any mortgage debt when they retired – 63.2% versus 80.0% of Drivers, 78.4% of Joined at the Hip, and 80.7% of Passengers.
6 7
2. Retirement Saving Assets Retirement assets by retirees and pre-retirees:
Retirees: Divide and Conquer and Driver retirees were more likely to have saved over $750,000 at the time of retirement (33.3% of Divide and Conquer, 36.8% of Drivers). Passengers were less likely to have saved more for retirement – 17.0% had less than $100,000 in retirement savings, and only 14.9% of Passengers had saved $750,000 at the time of retirement.
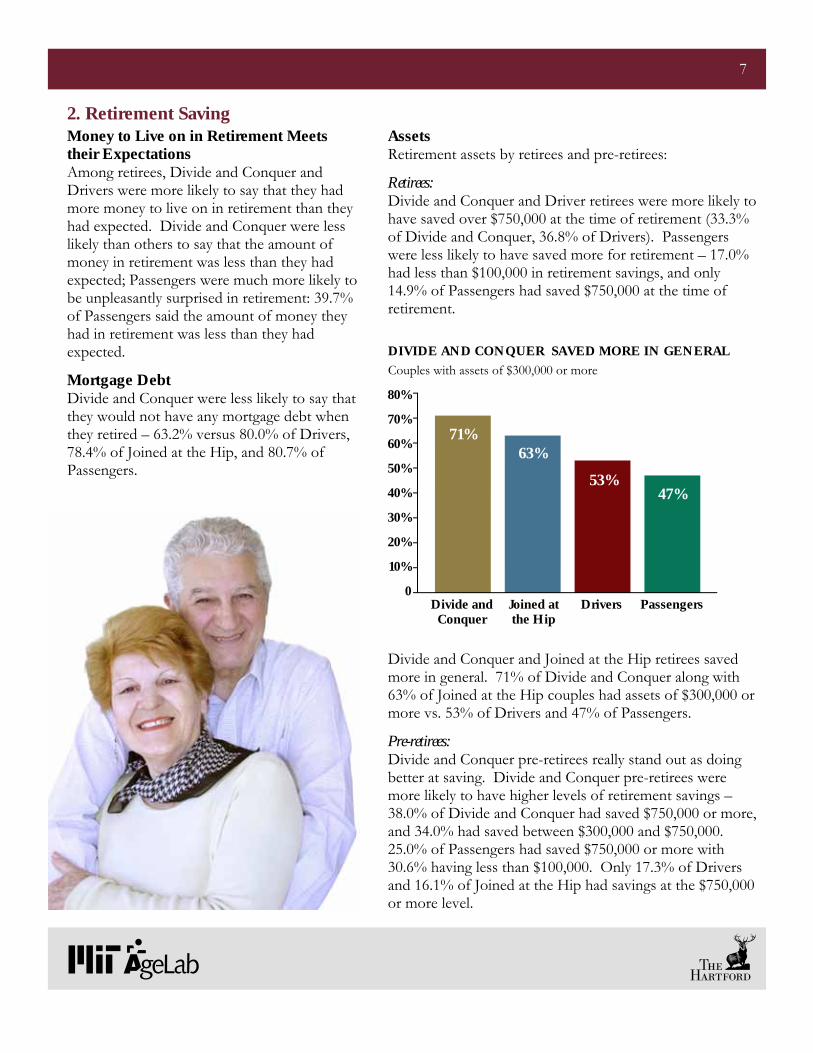
Divide and Conquer and Joined at the Hip retirees saved more in general. 71% of Divide and Conquer along with 63% of Joined at the Hip couples had assets of $300,000 or more vs. 53% of Drivers and 47% of Passengers.
Pre-retirees: Divide and Conquer pre-retirees really stand out as doing better at saving. Divide and Conquer pre-retirees were more likely to have higher levels of retirement savings – 38.0% of Divide and Conquer had saved $750,000 or more, and 34.0% had saved between $300,000 and $750,000. 25.0% of Passengers had saved $750,000 or more with 30.6% having less than $100,000. Only 17.3% of Drivers and 16.1% of Joined at the Hip had savings at the $750,000 or more level.
Couples with assets of $300,000 or more DIVIDE AND CONQUER SAVED MORE IN GENERAL
71% 63%
53% 47%
Divide and Conquer
Joined at the Hip
Drivers Passengers
80%
70%
60%
50%
40%
30%
20%
10%
0
6 8
Perceived Barriers Passengers were more likely to perceive barriers to retirement planning. 28.6% of Passengers agreed with three or more of the following statements regarding barriers to retirement planning, compared with 11.6% for Drivers, 8.6% for Joined at the Hip, and 13.3% for Divide and Conquer. Barrier statements: • There are too many unknowns in retirement
planning. • Making a retirement plan takes too much time. • I don’t know enough to make a good plan for
my retirement. • Retirement is too far away for me to start
planning yet. • I just don’t feel like planning for retirement.
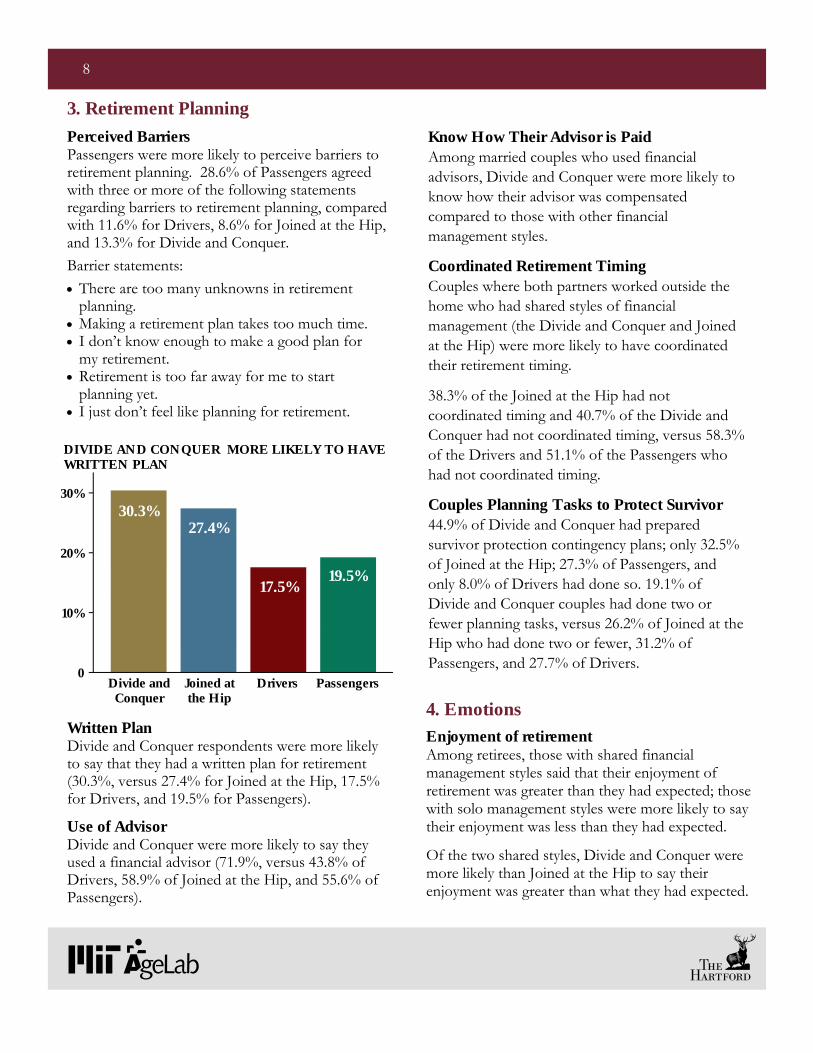
Written Plan Divide and Conquer respondents were more likely to say that they had a written plan for retirement (30.3%, versus 27.4% for Joined at the Hip, 17.5% for Drivers, and 19.5% for Passengers).
Use of Advisor Divide and Conquer were more likely to say they used a financial advisor (71.9%, versus 43.8% of Drivers, 58.9% of Joined at the Hip, and 55.6% of Passengers).
Enjoyment of retirement Among retirees, those with shared financial management styles said that their enjoyment of retirement was greater than they had expected; those with solo management styles were more likely to say their enjoyment was less than they had expected.
Of the two shared styles, Divide and Conquer were more likely than Joined at the Hip to say their enjoyment was greater than what they had expected.
4. Emotions
Know How Their Advisor is Paid Among married couples who used financial advisors, Divide and Conquer were more likely to know how their advisor was compensated compared to those with other financial management styles.
Coordinated Retirement Timing Couples where both partners worked outside the home who had shared styles of financial management (the Divide and Conquer and Joined at the Hip) were more likely to have coordinated their retirement timing.
38.3% of the Joined at the Hip had not coordinated timing and 40.7% of the Divide and Conquer had not coordinated timing, versus 58.3% of the Drivers and 51.1% of the Passengers who had not coordinated timing.
Couples Planning Tasks to Protect Survivor 44.9% of Divide and Conquer had prepared survivor protection contingency plans; only 32.5% of Joined at the Hip; 27.3% of Passengers, and only 8.0% of Drivers had done so. 19.1% of Divide and Conquer couples had done two or fewer planning tasks, versus 26.2% of Joined at the Hip who had done two or fewer, 31.2% of Passengers, and 27.7% of Drivers.
3. Retirement Planning
30.3% 27.4%
17.5% 19.5%
Divide and Conquer
Joined at the Hip
Drivers Passengers
DIVIDE AND CONQUER MORE LIKELY TO HAVE WRITTEN PLAN
30%
20%
10%
0
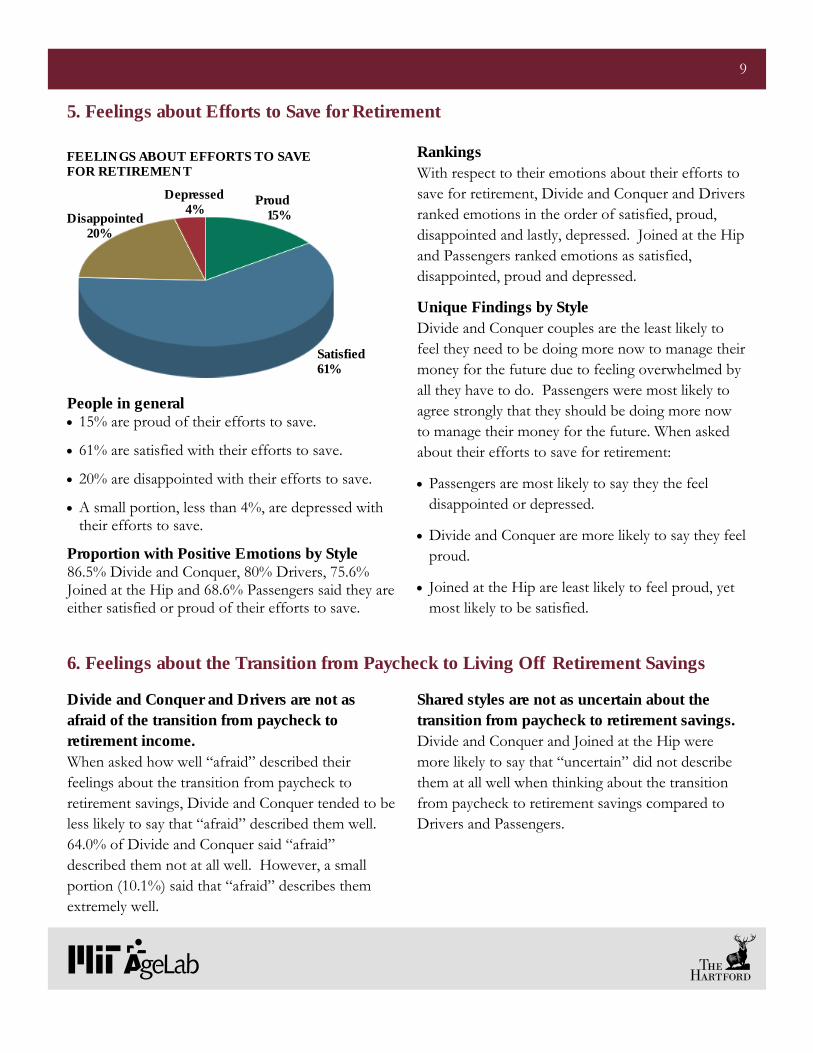
People in general • 15% are proud of their efforts to save.
• 61% are satisfied with their efforts to save.
• 20% are disappointed with their efforts to save.
• A small portion, less than 4%, are depressed with their efforts to save.
Proportion with Positive Emotions by Style 86.5% Divide and Conquer, 80% Drivers, 75.6% Joined at the Hip and 68.6% Passengers said they are either satisfied or proud of their efforts to save.
Rankings With respect to their emotions about their efforts to save for retirement, Divide and Conquer and Drivers ranked emotions in the order of satisfied, proud, disappointed and lastly, depressed. Joined at the Hip and Passengers ranked emotions as satisfied, disappointed, proud and depressed.
Unique Findings by Style Divide and Conquer couples are the least likely to feel they need to be doing more now to manage their money for the future due to feeling overwhelmed by all they have to do. Passengers were most likely to agree strongly that they should be doing more now to manage their money for the future. When asked about their efforts to save for retirement:
• Passengers are most likely to say they the feel disappointed or depressed.
• Divide and Conquer are more likely to say they feel proud.
• Joined at the Hip are least likely to feel proud, yet most likely to be satisfied.
6 9
Divide and Conquer and Drivers are not as afraid of the transition from paycheck to retirement income. When asked how well “afraid” described their feelings about the transition from paycheck to retirement savings, Divide and Conquer tended to be less likely to say that “afraid” described them well. 64.0% of Divide and Conquer said “afraid” described them not at all well. However, a small portion (10.1%) said that “afraid” describes them extremely well.
Shared styles are not as uncertain about the transition from paycheck to retirement savings. Divide and Conquer and Joined at the Hip were more likely to say that “uncertain” did not describe them at all well when thinking about the transition from paycheck to retirement savings compared to Drivers and Passengers.
6. Feelings about the Transition from Paycheck to Living Off Retirement Savings
5. Feelings about Efforts to Save for Retirement
FEELINGS ABOUT EFFORTS TO SAVE FOR RETIREMENT
Proud 15%
Satisfied 61%
Disappointed 20%
Depressed 4%
10
ABOUT THE QUESTIONS IN THE SURVEY
Survivor Protection Questions (Contingency Planning)
We included questions in the retirement survey to address survivor protection and asked survey respondents who indicated they were married or living with a partner the survivor protection questions. Because we interviewed individuals rather than both members of given couples, we asked respondents to answer both from their own perspective and the perspective of their spouse. We asked participants to consider two scenarios: whether they were to die first and whether their spouse was to die first. Then we asked them the following questions:
• Have you calculated the effect on monthly income if you die first? Or if your spouse dies first?
• Have you calculated the effect on assets if you have an expensive illness? Or if your spouse has an expensive illness?
• Are you prepared to fully manage the money and investments if your spouse dies first? Is your spouse prepared to fully manage the money and investments if you die first?
We developed a six-point scale regarding couples’ level of contingency planning from 0–No Tasks Completed to 6–Completed All Six Tasks. Those who scored higher on the scale – who had completed more planning tasks – would be better prepared to protect the surviving spouse’s financial security.
We then looked at whether contingency planning was related to other factors and determined that the respondent’s role in managing the household’s personal finances was significantly related to their reported level of contingency planning.
Financial Management Questions
The interviewers asked the following financial management questions:
Which one best describes your role in managing day-to-day financial responsibilities such as balancing the checkbook and paying bills in your household?
I am the primary manager I share the management, but I do more of these
tasks I share the management equally with someone else I share the management, but I do fewer of these
tasks Someone else is the primary manager
Which one best describes your role in managing investments, such as deciding how much to save and what to invest the money in for your household?
I am the sole investment manager I share the task, but I am more involved than the
other person I share the task equally with someone else I share the task, but I am less involved than the
other person Someone else manages investments
From the responses, we identified four distinct financial planning styles of married individuals, the level of contingency planning done by members of each style and the financial planning style whose members appear to be most successful at planning in advance to protect the survivor.
In addition, we determined that the couples financial management styles were related to other factors such as: demographic variables, the extent to which respondents planned for retirement or perceive barriers to retirement planning, and respondents’ feelings about their efforts to save for retirement.
SURVEY SAMPLE CHARACTERISTICS The couples analysis included 837 people within the sample (69% of the sample of 1,194) who indicated that they were married or living with a partner.
In general the married/partnered respondents to the survey appear to have slightly higher household incomes and accrued assets than the single/widowed/divorced respondents.
Of the respondents who are married or partnered, 20% earned less than $49,999, 17% earned between $50,000 - $69,000 , 27% earned $70,000 - $99,000 , and 35% earned over $100,000 in pre-tax household income. The most common income range indicated was $100,000 - $149,999.
Of those who were married or partnered and answered the question on their current assets, 21% have assets less than $100,000, 30% have assets between $100,000 - $300,000, 29% have assets between $300,000 and $750,000 and 21% have assets over $750,000. The most common asset range indicated was $100,000 - $300,000.
Note: Percentages may not sum to 100 due to rounding and weighting of data.
ABOUT THE SURVEY
To be eligible for inclusion in the survey, individuals had to meet the following three criteria: • Between the ages of 45 and 74; • English speaking and living in continental
U.S.; • Have some personal savings for retirement. Personal savings for retirement could include money saved in an account like a 401(k) or 403(b) or in any kind of IRA. Individuals who reported that they did not have any personal savings for retirement, outside of Social Security or a pension, were not included in the sample. The sample included pre-retirees and retirees and was stratified by age. The survey data are weighted. The data weights were created based on 2006 U.S. Census estimates for age. Thus, the weighted data are representative of Americans ages 45 to 74 who have some personal savings for retirement. Roughly 60 % of the final weighted sample were women and 40 % were men. The survey questionnaire was fielded between November 28 and December 21, 2007. The interviews were completed in this period with 1,194 eligible respondents.
11
REFERENCES 1. U.S. Social Security Administration 2002a (2000) Income of the
Aged Chartbook. Washington, D.C.: U.S. Government Printing Office
2. U.S. Census Bureau (2006) Statistical Abstract of the United States, Table 51. Marital Status of the Population by Sex and Age 2004, p. 50 and U.S. Census Bureau 2005) 65+ in the United States, pp. 145-153
3. Munnell, Alicia H. (April 2004) Why are so many older women poor? Center for Retirement Research at Boston College
4. WISER/Actuarial Foundation (2005) Retirement Planning: Taking Your Money Out. Downloaded from http://www.actfnd.org/consumer/wiser-final090905.pdf
5. Meyer, M.H., D.A. Wolf, & C.L. Himes (2006) Declining Eligibility for Social Security Spouse and Widow Benefits in the United States? Research on Aging 28:240-260
6. Population Resource Center (1994) Executive Summary: The Feminization of Aging. Princeton: Population Resource Center
7. Glass, J.C., Jr., & B.B. Kilpatrick (1998) Financial Planning for Retirement: An Imperative for Baby Boomer Women. Educational Gerontology 24:595-617
8. Byles, J.E., S. Feldman, & G. Mishra (1999) For Richer, for Poorer, in Sickness and in Health: Older Widowed Women’s Health, Relationships and Financial Security. Women and Health 29:15-30
9. Women’s Institute for a Secure Retirement (2004)
10. Social Security Bulletin (2005) Medicare Gaps and Widow Poverty